Science In An Exponential World Alexander Szalay, JHU Jim Gray, Microsoft Reserach Alexander Szalay,...
30
Science In An Exponential World Alexander Szalay, JHU Jim Gray, Microsoft Reserach
-
Upload
clifford-fleming -
Category
Documents
-
view
230 -
download
1
Transcript of Science In An Exponential World Alexander Szalay, JHU Jim Gray, Microsoft Reserach Alexander Szalay,...
Science In An Exponential WorldScience In An Exponential World
Alexander Szalay, JHUJim Gray, Microsoft ReserachAlexander Szalay, JHUJim Gray, Microsoft Reserach
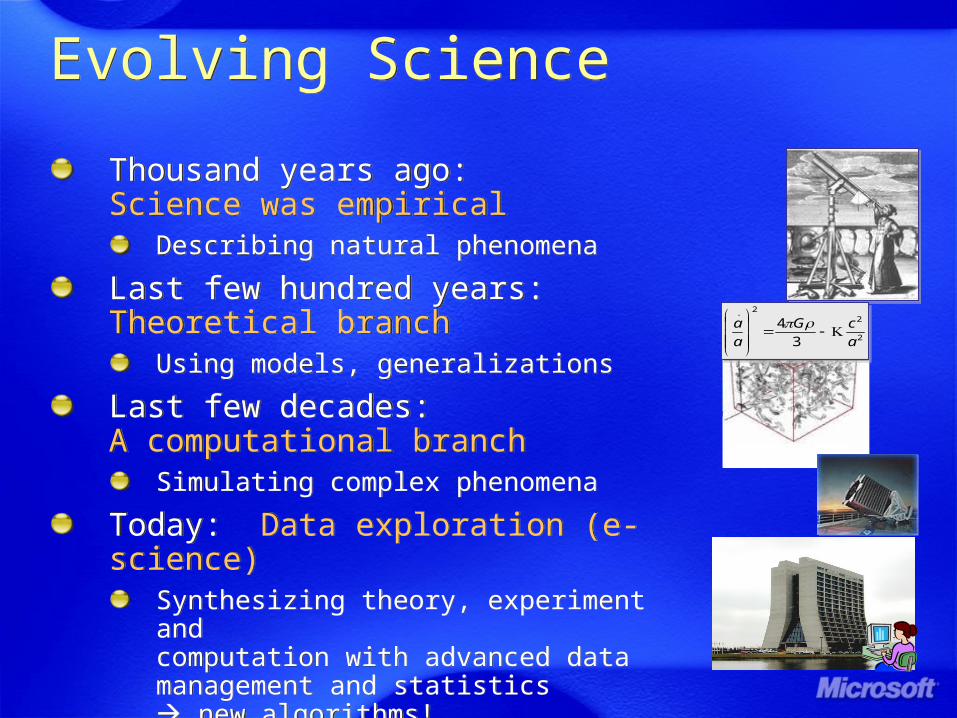
Evolving ScienceEvolving Science
Thousand years ago:Science was empirical
Describing natural phenomena
Last few hundred years:Theoretical branch
Using models, generalizations
Last few decades:A computational branch
Simulating complex phenomena
Today: Data exploration (e-science)Synthesizing theory, experiment and computation with advanced data management and statistics new algorithms!
2
22.
3
4
a
cG
a
a
2
22.
3
4
a
cG
a
a
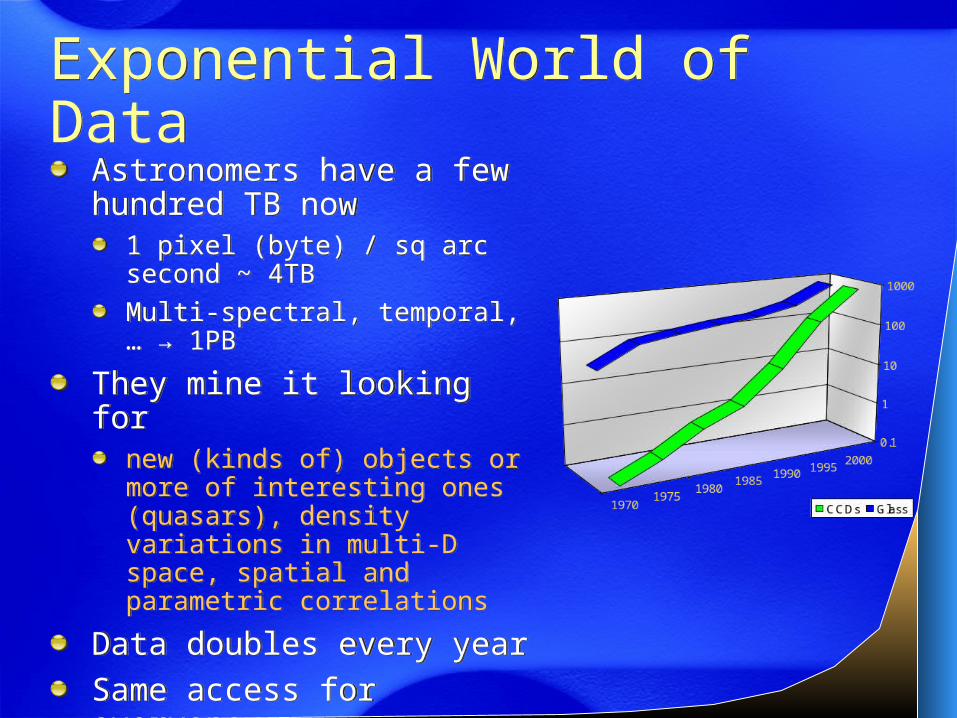
Exponential World of DataExponential World of Data
Astronomers have a few hundred TB now
1 pixel (byte) / sq arc second ~ 4TB
Multi-spectral, temporal, … → 1PB
They mine it looking fornew (kinds of) objects or more of interesting ones (quasars), density variations in multi-D space, spatial and parametric correlations
Data doubles every year
Same access for everyone
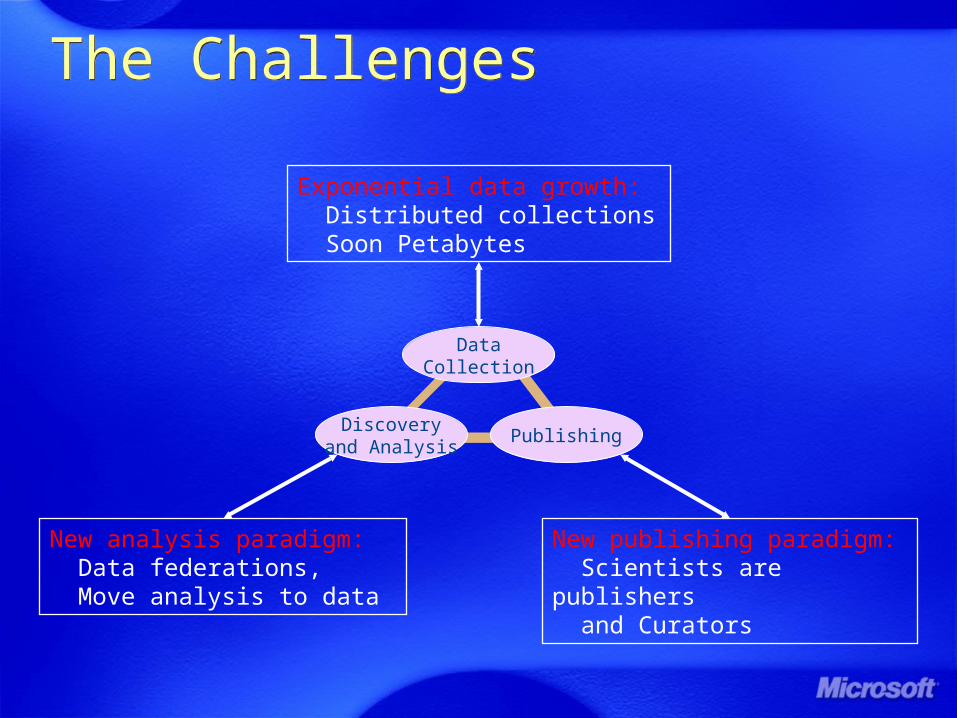
The ChallengesThe Challenges
DataCollection
Discoveryand Analysis
Publishing
Exponential data growth: Distributed collections Soon Petabytes
New analysis paradigm: Data federations, Move analysis to data
New publishing paradigm: Scientists are publishers and Curators
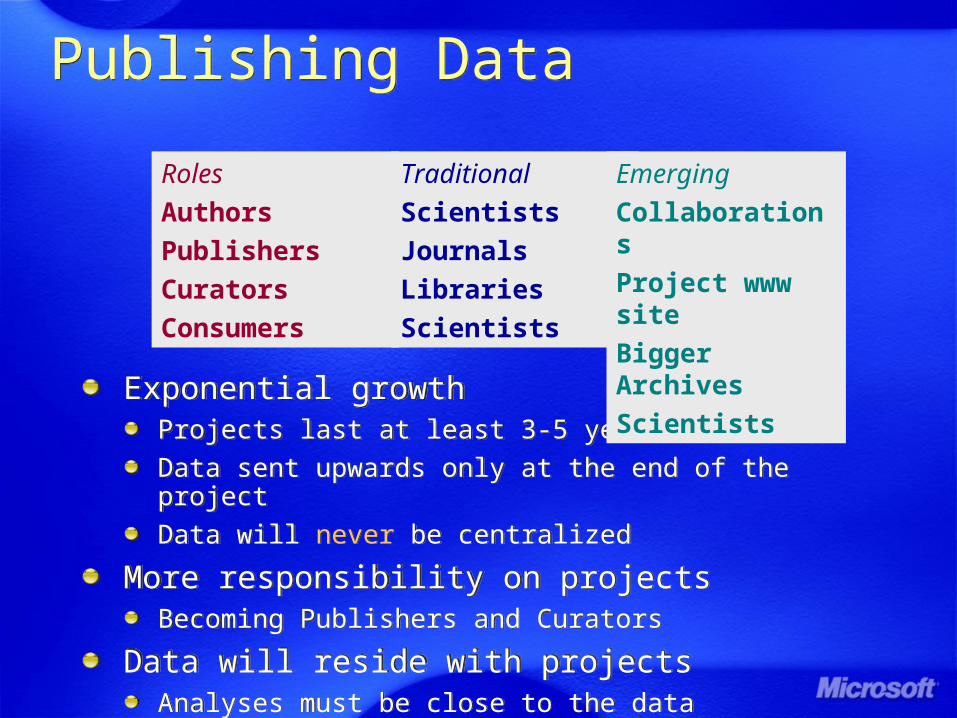
Publishing DataPublishing Data
Exponential growthProjects last at least 3-5 years
Data sent upwards only at the end of the project
Data will never be centralized
More responsibility on projectsBecoming Publishers and Curators
Data will reside with projectsAnalyses must be close to the data
Exponential growthProjects last at least 3-5 years
Data sent upwards only at the end of the project
Data will never be centralized
More responsibility on projectsBecoming Publishers and Curators
Data will reside with projectsAnalyses must be close to the data
Roles
Authors
Publishers
Curators
Consumers
Traditional
Scientists
Journals
Libraries
Scientists
Emerging
Collaborations
Project www site
Bigger Archives
Scientists
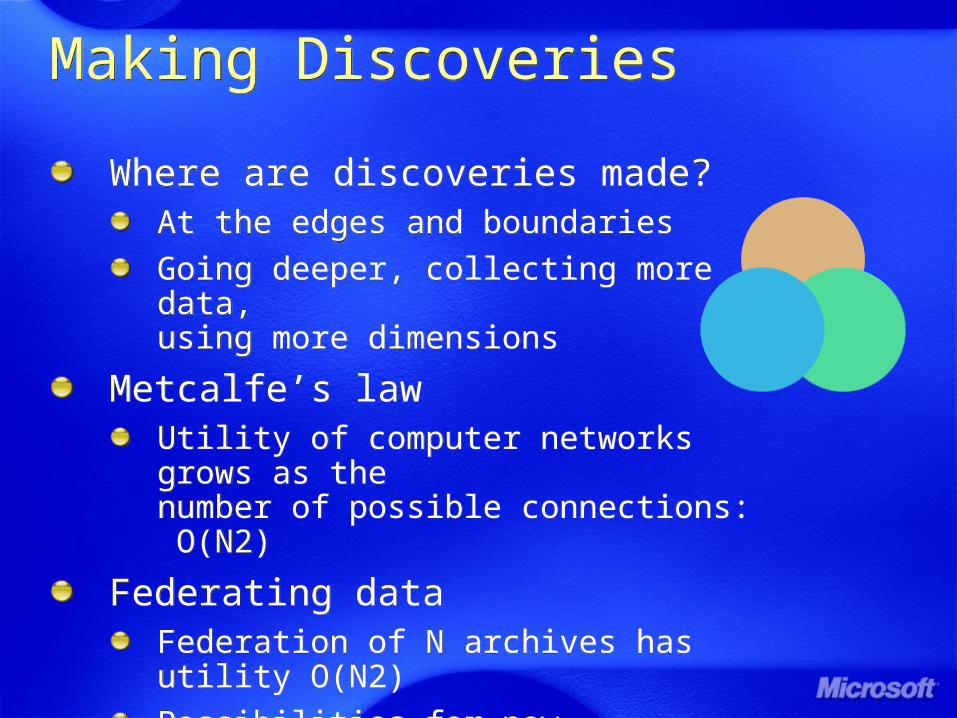
Making DiscoveriesMaking Discoveries
Where are discoveries made?At the edges and boundaries
Going deeper, collecting more data,using more dimensions
Metcalfe’s lawUtility of computer networks grows as the number of possible connections: O(N2)
Federating dataFederation of N archives has utility O(N2)
Possibilities for new discoveriesgrow as O(N2)
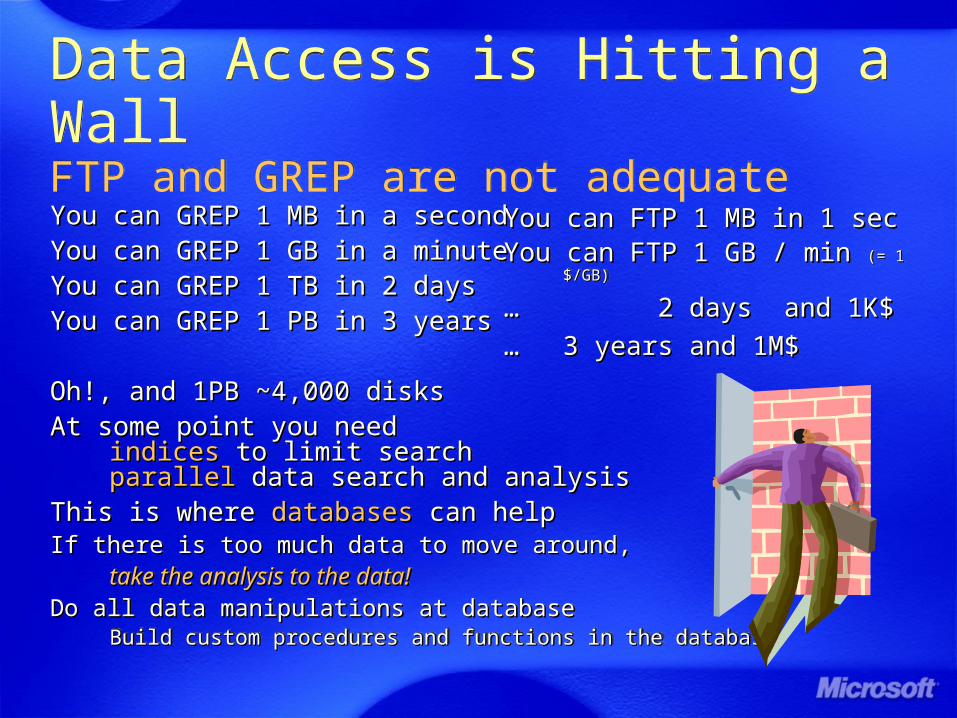
Data Access is Hitting a WallFTP and GREP are not adequateData Access is Hitting a WallFTP and GREP are not adequate
You can GREP 1 MB in a secondYou can GREP 1 MB in a secondYou can GREP 1 GB in a minute You can GREP 1 GB in a minute You can GREP 1 TB in 2 daysYou can GREP 1 TB in 2 daysYou can GREP 1 PB in 3 yearsYou can GREP 1 PB in 3 years
Oh!, and 1PB ~4,000 disksOh!, and 1PB ~4,000 disksAt some point you need At some point you need
indicesindices to limit search to limit searchparallelparallel data search and analysis data search and analysis
This is where This is where databasesdatabases can help can helpIf there is too much data to move around,If there is too much data to move around,
take the analysis to the data!take the analysis to the data!Do all data manipulations at databaseDo all data manipulations at database
Build custom procedures and functions in the databaseBuild custom procedures and functions in the database
You can FTP 1 MB in 1 secYou can FTP 1 MB in 1 secYou can FTP 1 GB / min You can FTP 1 GB / min (= 1 $/GB)(= 1 $/GB)
… … 2 days and 1K$2 days and 1K$
… … 3 years and 1M$3 years and 1M$
You can FTP 1 MB in 1 secYou can FTP 1 MB in 1 secYou can FTP 1 GB / min You can FTP 1 GB / min (= 1 $/GB)(= 1 $/GB)
… … 2 days and 1K$2 days and 1K$
… … 3 years and 1M$3 years and 1M$
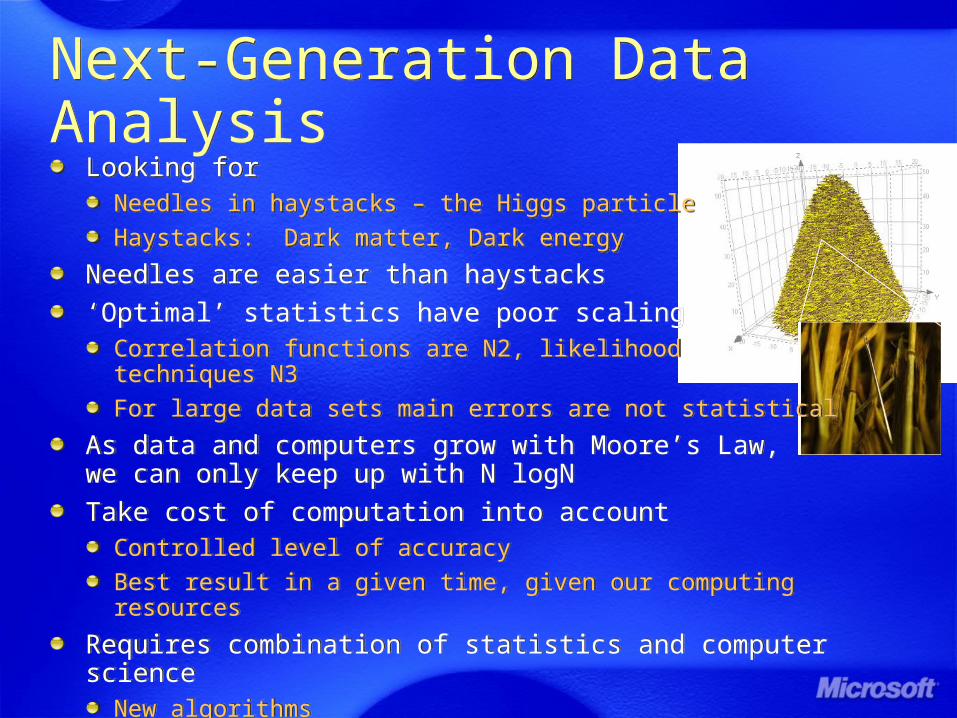
Next-Generation Data AnalysisNext-Generation Data Analysis
Looking forNeedles in haystacks – the Higgs particle
Haystacks: Dark matter, Dark energy
Needles are easier than haystacks
‘Optimal’ statistics have poor scalingCorrelation functions are N2, likelihoodtechniques N3
For large data sets main errors are not statistical
As data and computers grow with Moore’s Law, we can only keep up with N logN
Take cost of computation into accountControlled level of accuracy
Best result in a given time, given our computing resources
Requires combination of statistics and computer scienceNew algorithms
Our E-Science ProjectsOur E-Science Projects
Sloan Digital Sky Survey/ SkyServer
Virtual Observatory
Wireless Sensor Networks
Analyzing Large Numerical Simulations
Fast Spatial Search Techniques
Sloan Digital Sky Survey/ SkyServer
Virtual Observatory
Wireless Sensor Networks
Analyzing Large Numerical Simulations
Fast Spatial Search Techniques
Commonalities
Web services
Analysis inside the database!
Commonalities
Web services
Analysis inside the database!
Why Is Astronomy Special?Why Is Astronomy Special?
Especially attractive for the wide public
It has no commercial value – “worthless!” (Jim Gray)No privacy concerns, freely share results with others
Great for experimenting with algorithms
It is real and well documentedHigh-dimensional (with confidence intervals)
Spatial, temporal
Diverse and distributedMany different instruments from many different places and many different times
Virtual Observatory
The questions are interesting
There is a lot of it (soon Petabytes)
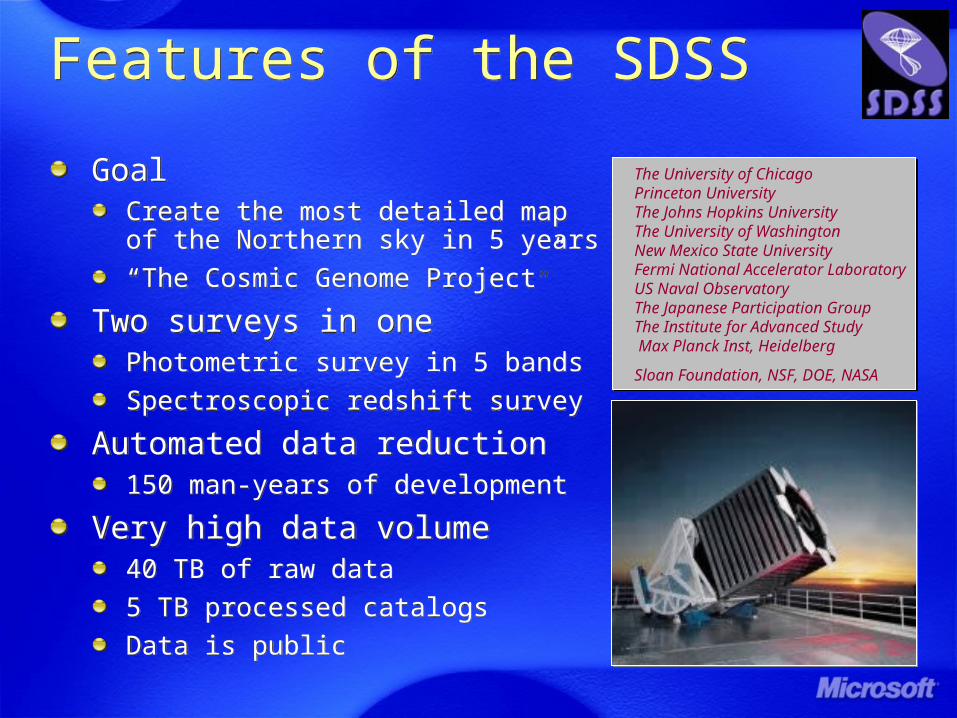
Features of the SDSSFeatures of the SDSS
GoalCreate the most detailed mapof the Northern sky in 5 years
“The Cosmic Genome Project”
Two surveys in onePhotometric survey in 5 bands
Spectroscopic redshift survey
Automated data reduction150 man-years of development
Very high data volume40 TB of raw data
5 TB processed catalogs
Data is public
GoalCreate the most detailed mapof the Northern sky in 5 years
“The Cosmic Genome Project”
Two surveys in onePhotometric survey in 5 bands
Spectroscopic redshift survey
Automated data reduction150 man-years of development
Very high data volume40 TB of raw data
5 TB processed catalogs
Data is public
The University of Chicago Princeton University The Johns Hopkins University The University of Washington New Mexico State University Fermi National Accelerator Laboratory US Naval Observatory The Japanese Participation Group The Institute for Advanced Study Max Planck Inst, Heidelberg
Sloan Foundation, NSF, DOE, NASA
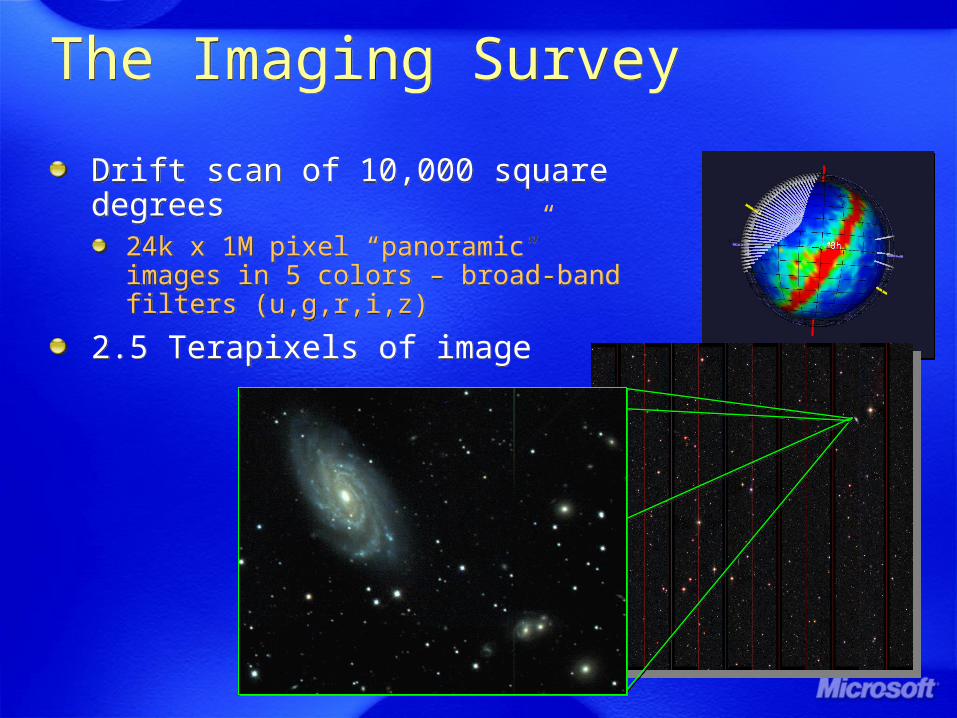
The Imaging SurveyThe Imaging Survey
Drift scan of 10,000 square degrees24k x 1M pixel “panoramic” images in 5 colors – broad-band filters (u,g,r,i,z)
2.5 Terapixels of image
Drift scan of 10,000 square degrees24k x 1M pixel “panoramic” images in 5 colors – broad-band filters (u,g,r,i,z)
2.5 Terapixels of image
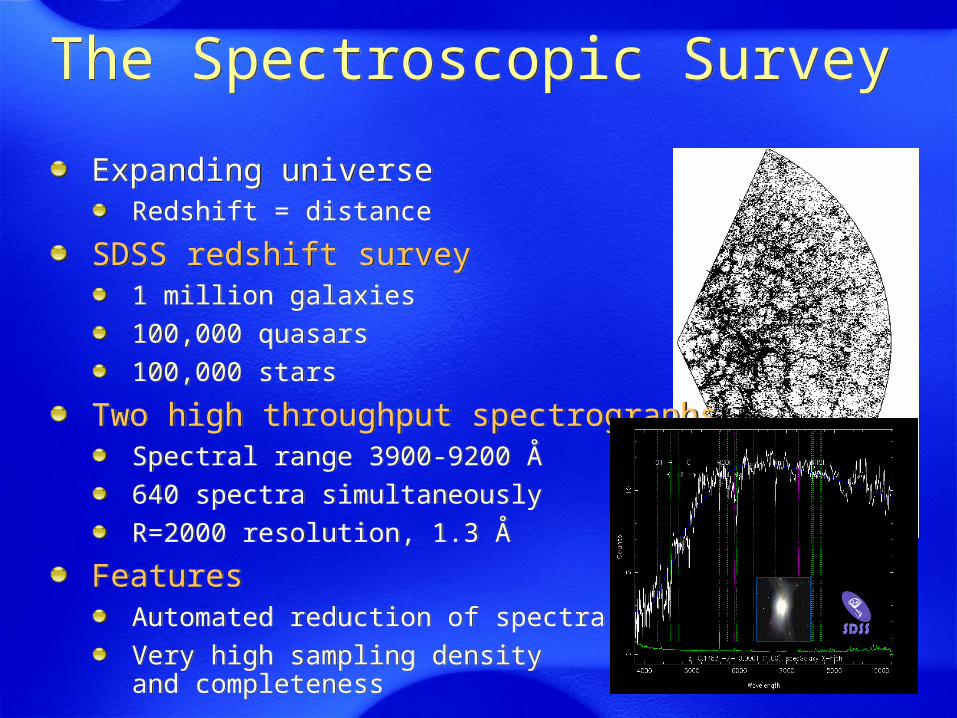
The Spectroscopic SurveyThe Spectroscopic Survey
Expanding universe Redshift = distance
SDSS redshift survey1 million galaxies
100,000 quasars
100,000 stars
Two high throughput spectrographsSpectral range 3900-9200 Å
640 spectra simultaneously
R=2000 resolution, 1.3 Å
FeaturesAutomated reduction of spectra
Very high sampling density and completeness
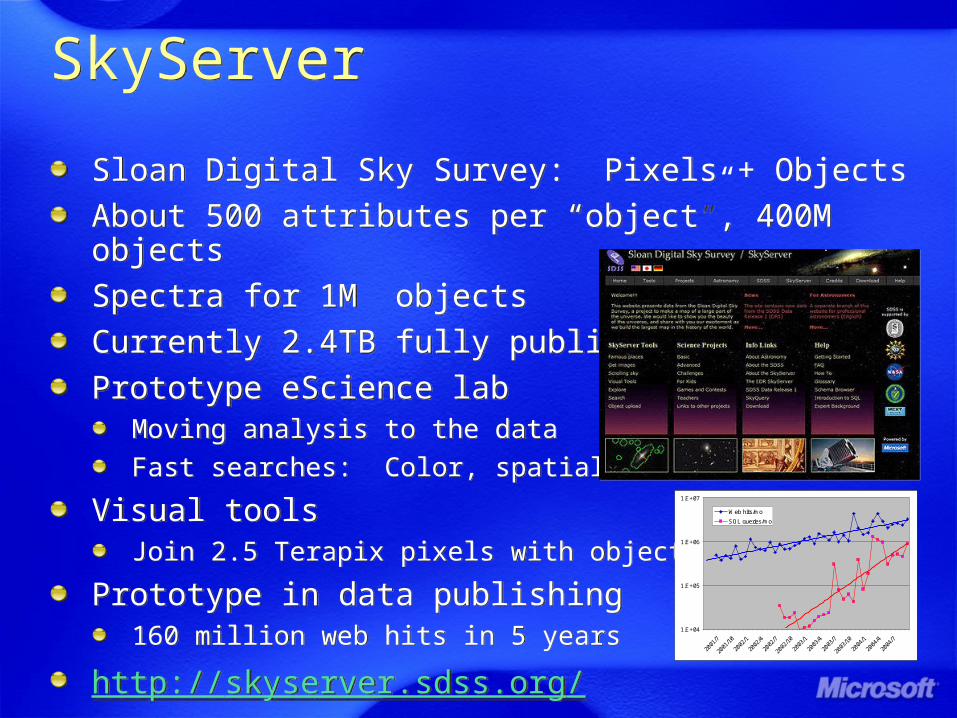
SkyServerSkyServer
Sloan Digital Sky Survey: Pixels + Objects
About 500 attributes per “object”, 400M objects
Spectra for 1M objects
Currently 2.4TB fully public
Prototype eScience labMoving analysis to the data
Fast searches: Color, spatial
Visual toolsJoin 2.5 Terapix pixels with objects
Prototype in data publishing160 million web hits in 5 years
http://skyserver.sdss.org/
Sloan Digital Sky Survey: Pixels + Objects
About 500 attributes per “object”, 400M objects
Spectra for 1M objects
Currently 2.4TB fully public
Prototype eScience labMoving analysis to the data
Fast searches: Color, spatial
Visual toolsJoin 2.5 Terapix pixels with objects
Prototype in data publishing160 million web hits in 5 years
http://skyserver.sdss.org/1.E+04
1.E+05
1.E+06
1.E+07
2001
/7
2001
/10
2002
/1
2002
/4
2002
/7
2002
/10
2003
/1
2003
/4
2003
/7
2003
/10
2004
/1
2004
/4
2004
/7
Web hits/mo
SQL queries/mo
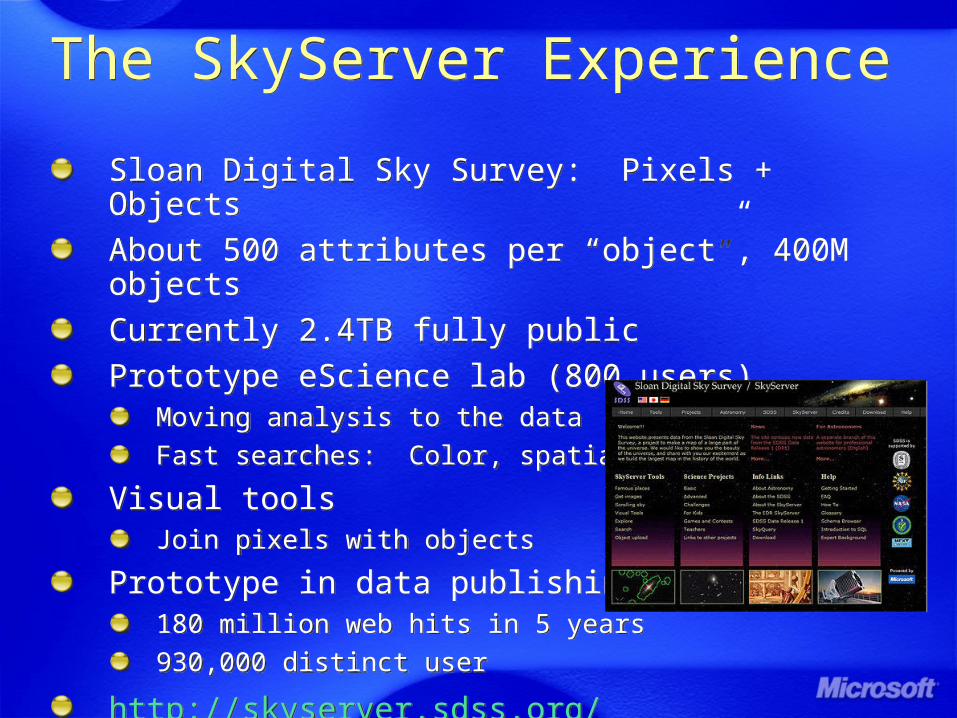
The SkyServer ExperienceThe SkyServer Experience
Sloan Digital Sky Survey: Pixels + Objects
About 500 attributes per “object”, 400M objects
Currently 2.4TB fully public
Prototype eScience lab (800 users)Moving analysis to the data
Fast searches: Color, spatial
Visual toolsJoin pixels with objects
Prototype in data publishing180 million web hits in 5 years
930,000 distinct user
http://skyserver.sdss.org/
Sloan Digital Sky Survey: Pixels + Objects
About 500 attributes per “object”, 400M objects
Currently 2.4TB fully public
Prototype eScience lab (800 users)Moving analysis to the data
Fast searches: Color, spatial
Visual toolsJoin pixels with objects
Prototype in data publishing180 million web hits in 5 years
930,000 distinct user
http://skyserver.sdss.org/
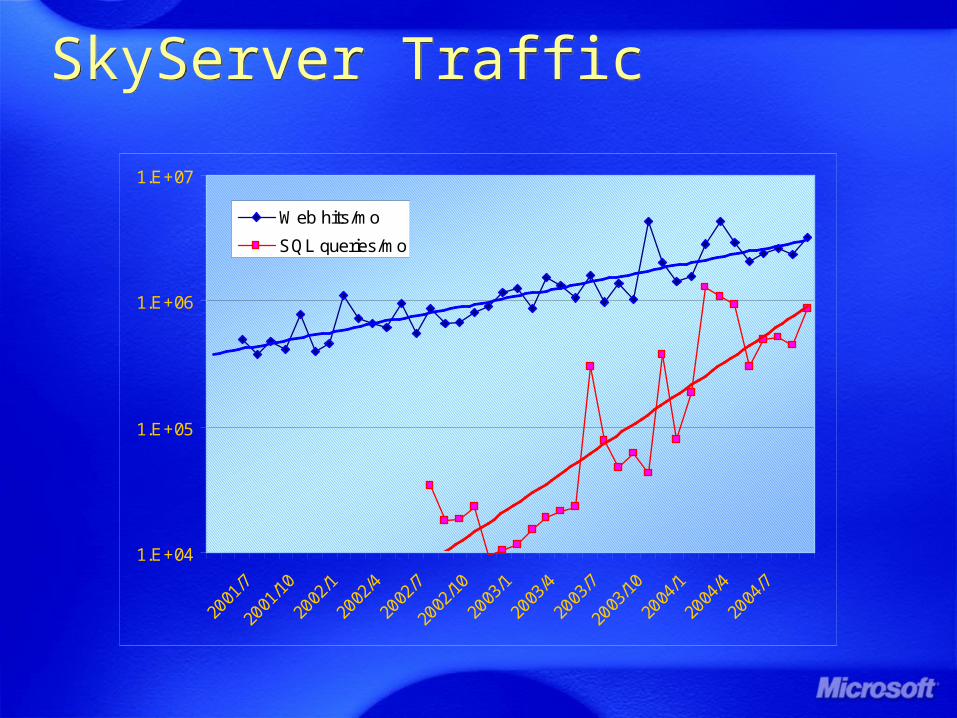
SkyServer TrafficSkyServer Traffic
1.E+04
1.E+05
1.E+06
1.E+07
2001
/7
2001
/10
2002
/1
2002
/4
2002
/7
2002
/10
2003
/1
2003
/4
2003
/7
2003
/10
2004
/1
2004
/4
2004
/7
Web hits/mo
SQL queries/mo
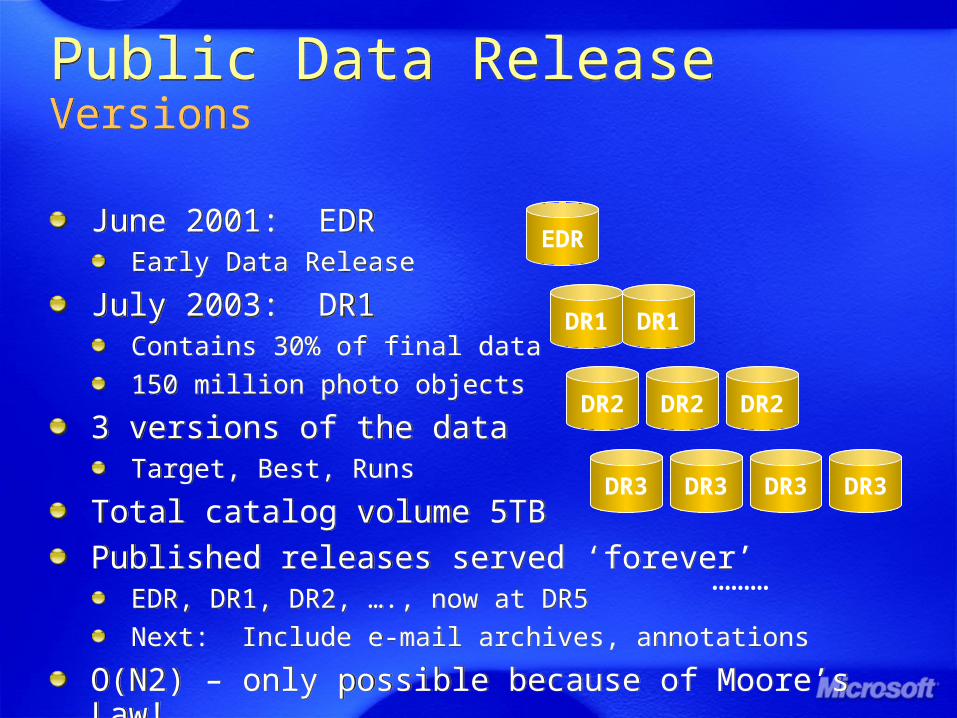
Public Data ReleaseVersionsPublic Data ReleaseVersions
June 2001: EDREarly Data Release
July 2003: DR1Contains 30% of final data
150 million photo objects
3 versions of the dataTarget, Best, Runs
Total catalog volume 5TB
Published releases served ‘forever’EDR, DR1, DR2, …., now at DR5
Next: Include e-mail archives, annotations
O(N2) – only possible because of Moore’s Law!
EDR
DR1 DR1
DR2 DR2 DR2
DR3 DR3 DR3 DR3
………
Spatial Information For UsersSpatial Information For Users
What surveys covered this part of the sky?
What is the common area of these surveys?
Is this point in the survey?
Give me all objects in this region
Cross-matching these two catalogs
Give me the cumulative counts over areas
Compute fast spherical transforms of densities
Interpolate sparsely sampled functions
Spatial Queries In SQLSpatial Queries In SQL
Regions and convexesBoolean algebra of spherical polygons
Indexing using spherical quadtreesHierarchical Triangular Mesh
Fast Spatial Joins of billions of pointsZone algorithm
All implemented in T-SQL and C#, runninginside SQL Server 2005
Regions and convexesBoolean algebra of spherical polygons
Indexing using spherical quadtreesHierarchical Triangular Mesh
Fast Spatial Joins of billions of pointsZone algorithm
All implemented in T-SQL and C#, runninginside SQL Server 2005
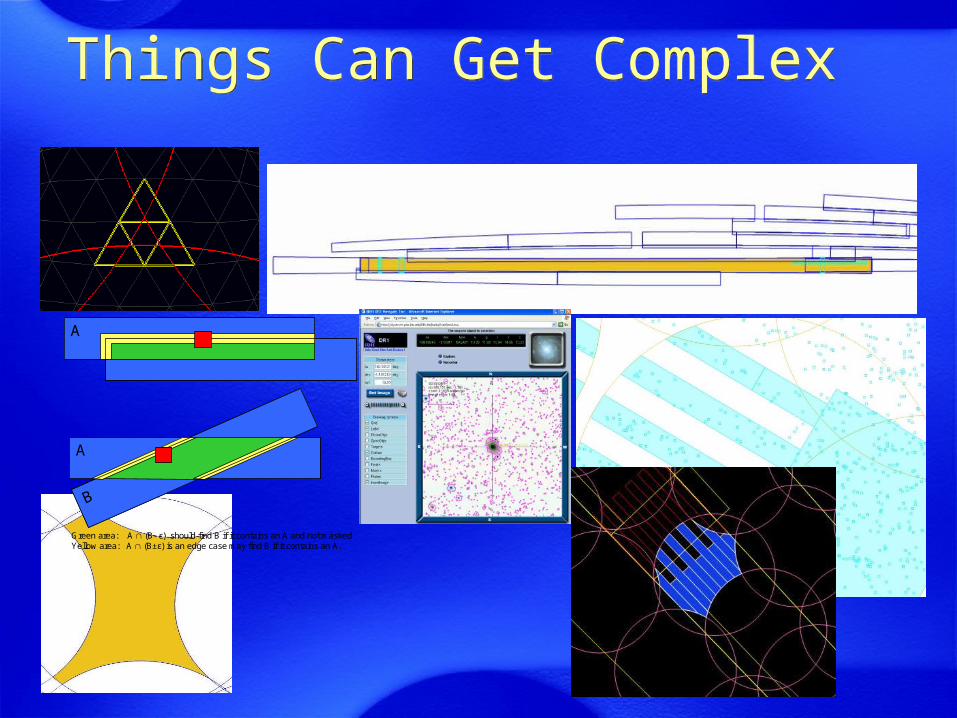
Things Can Get ComplexThings Can Get Complex
AABB
AA
Green area: A (B- ε) should find B if it contains an A and not maskedYellow area: A (B±ε) is an edge case may find B if it contains an A.
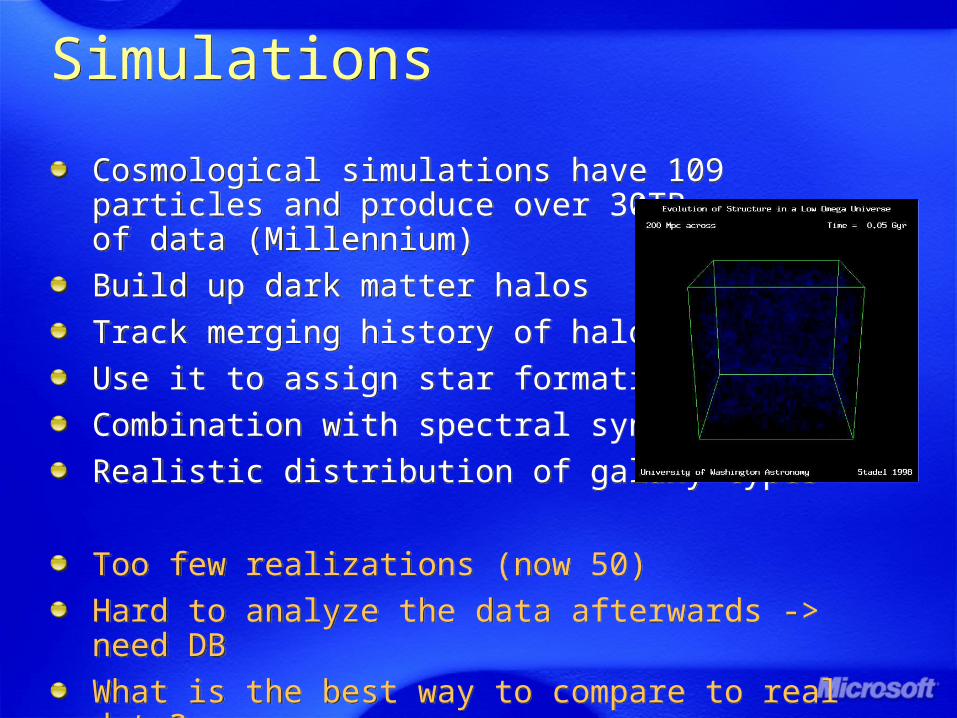
SimulationsSimulations
Cosmological simulations have 109particles and produce over 30TBof data (Millennium)
Build up dark matter halos
Track merging history of halos
Use it to assign star formation history
Combination with spectral synthesis
Realistic distribution of galaxy types
Too few realizations (now 50)
Hard to analyze the data afterwards -> need DB
What is the best way to compare to real data?
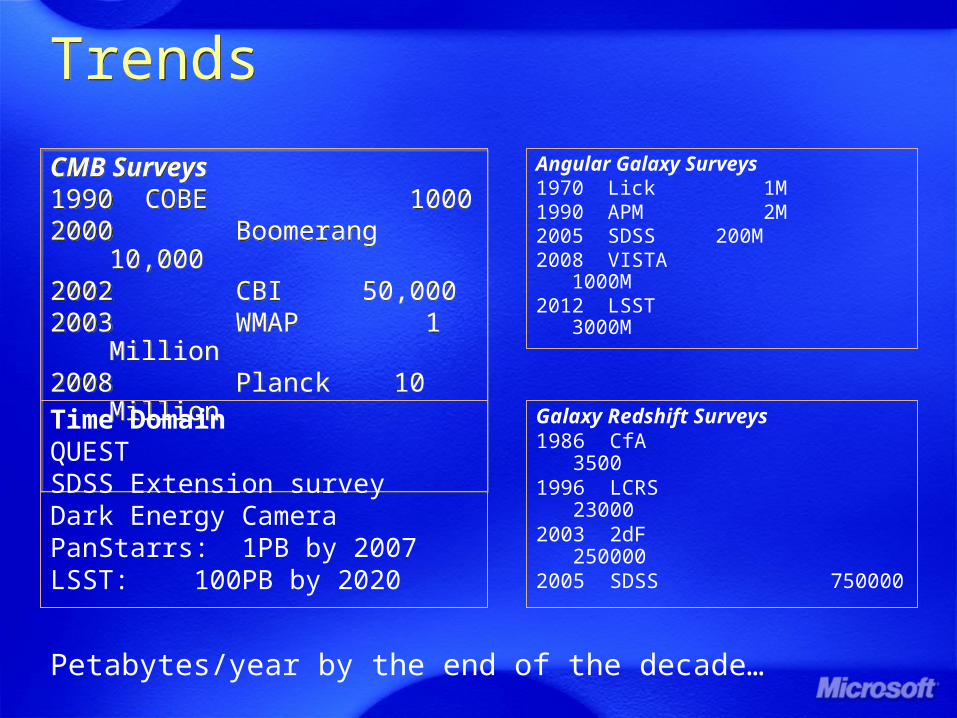
TrendsTrends
CMB Surveys1990 COBE 10002000 Boomerang 10,0002002 CBI 50,0002003 WMAP 1
Million2008 Planck 10 Million
CMB Surveys1990 COBE 10002000 Boomerang 10,0002002 CBI 50,0002003 WMAP 1
Million2008 Planck 10 Million
Galaxy Redshift Surveys1986 CfA 35001996 LCRS 230002003 2dF 2500002005 SDSS 750000
Angular Galaxy Surveys1970 Lick 1M1990 APM 2M2005 SDSS 200M2008 VISTA
1000M2012 LSST 3000M
Time DomainQUESTSDSS Extension surveyDark Energy CameraPanStarrs: 1PB by 2007LSST: 100PB by 2020
Petabytes/year by the end of the decade…
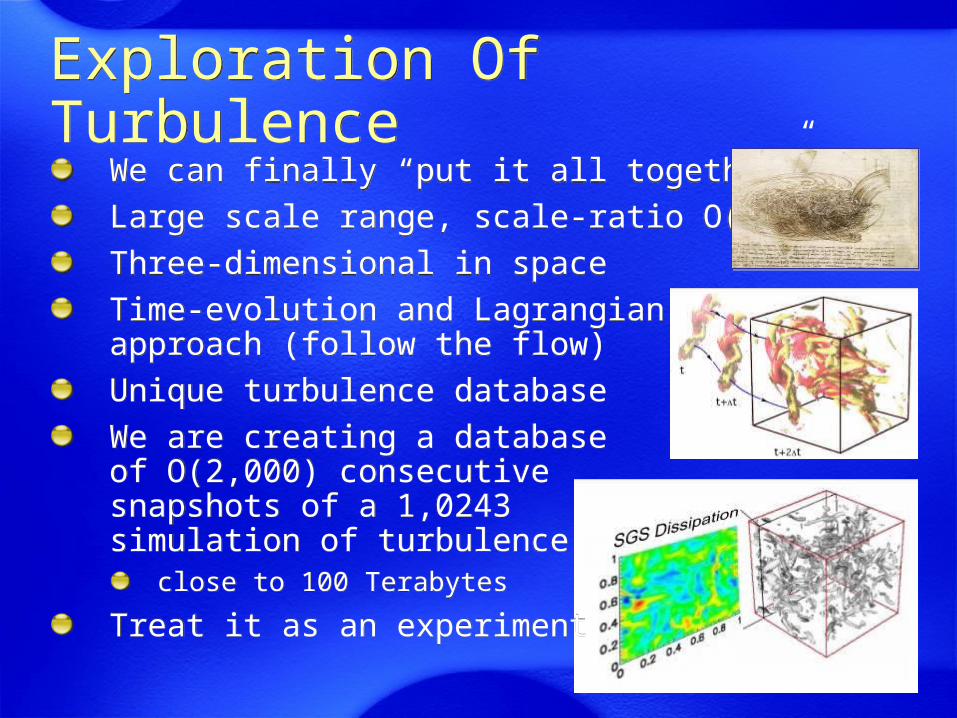
Exploration Of TurbulenceExploration Of Turbulence
We can finally “put it all together”
Large scale range, scale-ratio O(1,000)
Three-dimensional in space
Time-evolution and Lagrangian approach (follow the flow)
Unique turbulence database
We are creating a databaseof O(2,000) consecutivesnapshots of a 1,0243simulation of turbulence
close to 100 Terabytes
Treat it as an experiment
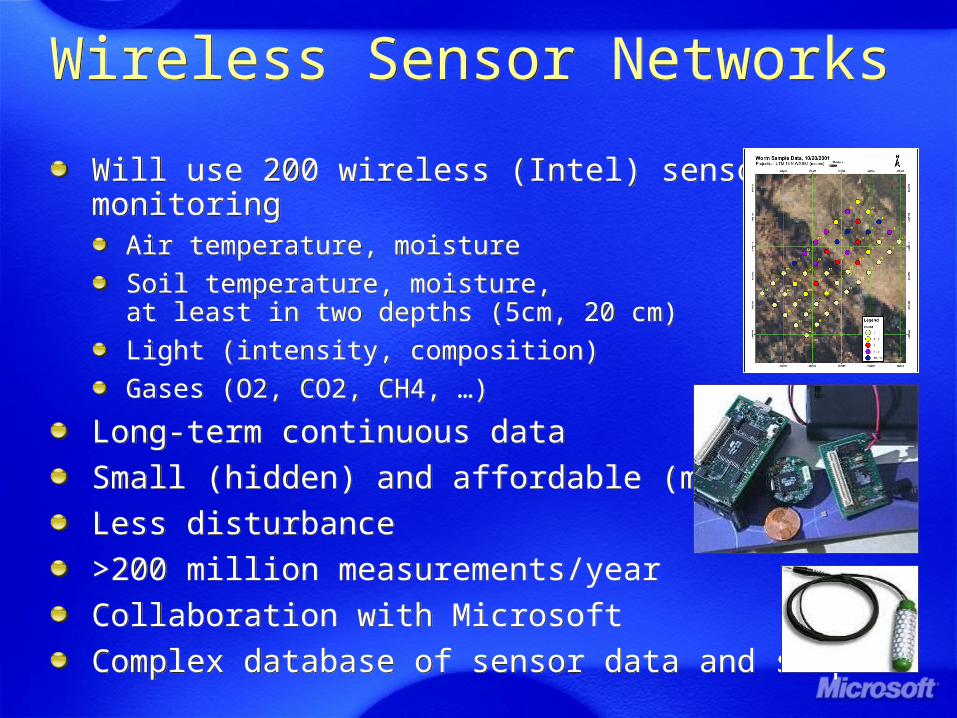
Wireless Sensor NetworksWireless Sensor Networks
Will use 200 wireless (Intel) sensors, monitoring
Air temperature, moisture
Soil temperature, moisture, at least in two depths (5cm, 20 cm)
Light (intensity, composition)
Gases (O2, CO2, CH4, …)
Long-term continuous data
Small (hidden) and affordable (many)
Less disturbance
>200 million measurements/year
Collaboration with Microsoft
Complex database of sensor data and samples
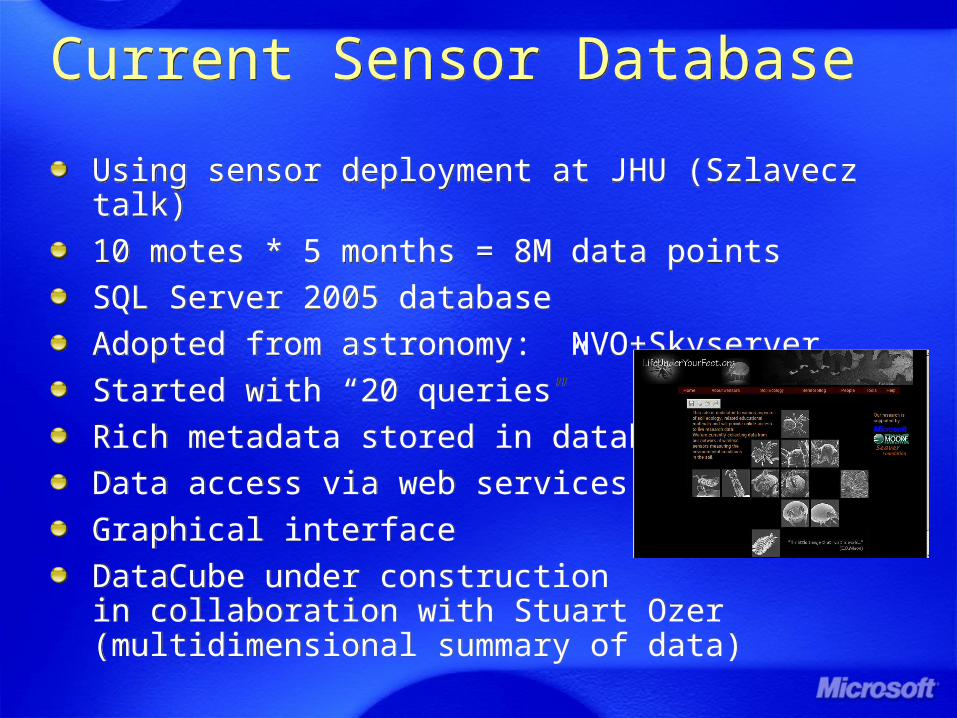
Current Sensor DatabaseCurrent Sensor Database
Using sensor deployment at JHU (Szlavecz talk)
10 motes * 5 months = 8M data points
SQL Server 2005 database
Adopted from astronomy: NVO+Skyserver
Started with “20 queries”
Rich metadata stored in database
Data access via web services
Graphical interface
DataCube under constructionin collaboration with Stuart Ozer(multidimensional summary of data)
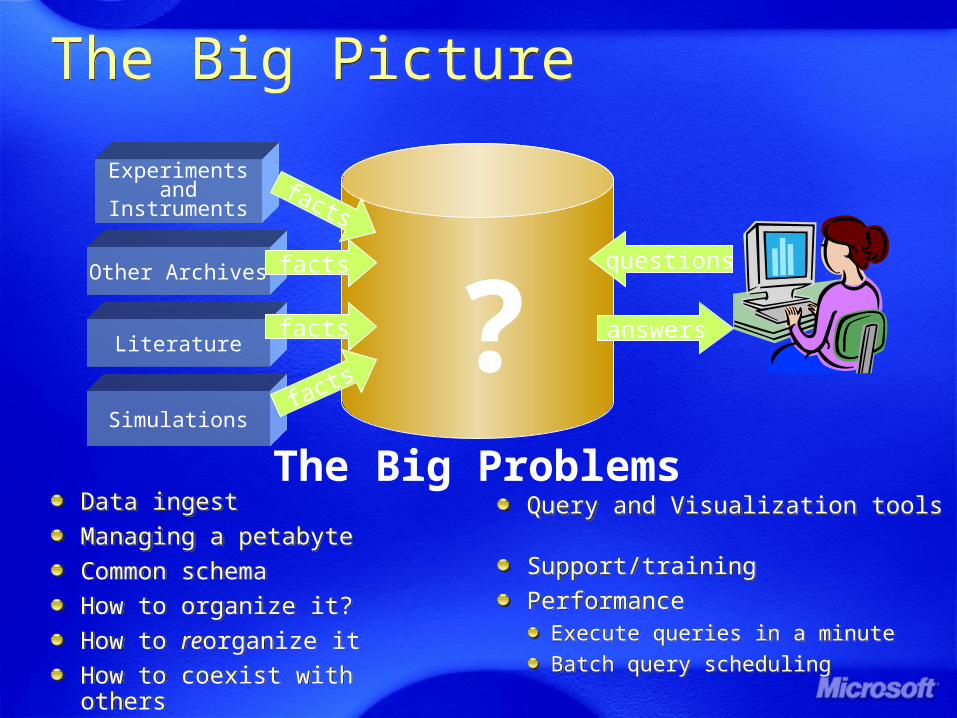
The Big PictureThe Big Picture
Experimentsand
Instruments
Simulationsfacts
facts
answers
questions
Data ingest
Managing a petabyte
Common schema
How to organize it?
How to reorganize it
How to coexist with others
Data ingest
Managing a petabyte
Common schema
How to organize it?
How to reorganize it
How to coexist with others
Query and Visualization tools
Support/training
PerformanceExecute queries in a minute
Batch query scheduling
Query and Visualization tools
Support/training
PerformanceExecute queries in a minute
Batch query scheduling
?The Big Problems
Literature
Other Archives facts
facts
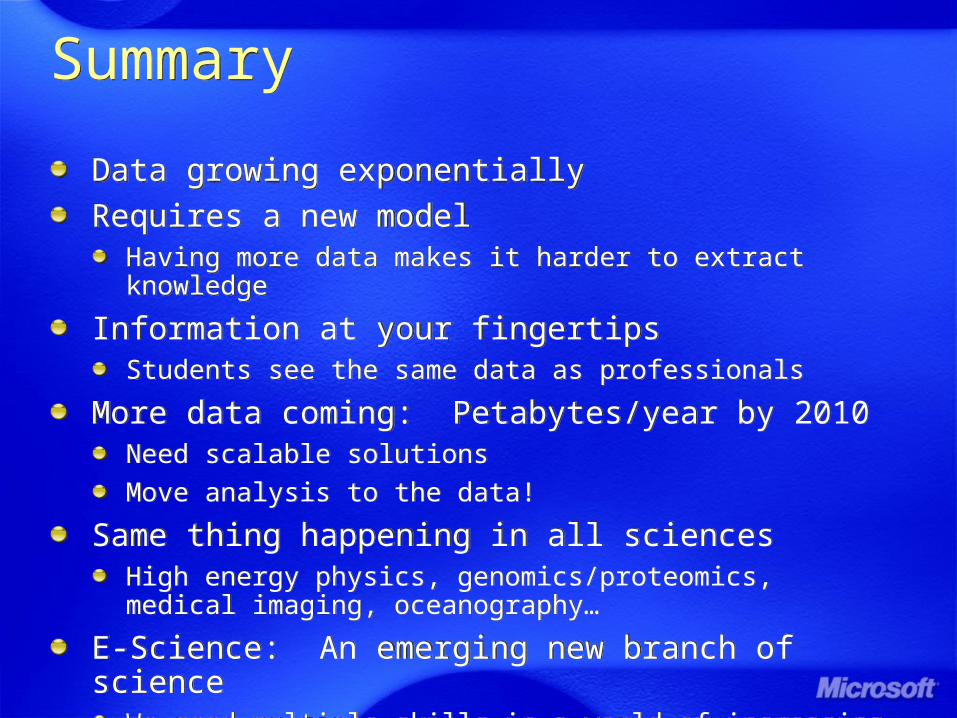
SummarySummary
Data growing exponentially
Requires a new modelHaving more data makes it harder to extract knowledge
Information at your fingertipsStudents see the same data as professionals
More data coming: Petabytes/year by 2010Need scalable solutions
Move analysis to the data!
Same thing happening in all sciencesHigh energy physics, genomics/proteomics, medical imaging, oceanography…
E-Science: An emerging new branch of scienceWe need multiple skills in a world of increasing specialization…
Microsoft Computational Science Workshop
at the Johns Hopkins University
Oct 13-15, 2006
Microsoft Computational Science Workshop
at the Johns Hopkins University
Oct 13-15, 2006

© 2006 Microsoft Corporation. All rights reserved.Microsoft, Windows, Windows Vista and other product names are or may be registered trademarks and/or trademarks in the U.S. and/or other countries.
The information herein is for informational purposes only and represents the current view of Microsoft Corporation as of the date of this presentation.Because Microsoft must respond to changing market conditions, it should not be interpreted to be a commitment on the part of Microsoft,
and Microsoft cannot guarantee the accuracy of any information provided after the date of this presentation.MICROSOFT MAKES NO WARRANTIES, EXPRESS, IMPLIED OR STATUTORY, AS TO THE INFORMATION IN THIS PRESENTATION.