Science Guidelines and Evaluation Methods North … Life Protection Act Initiative Science...
36
Marine Life Protection Act Initiative Science Guidelines and Evaluation Methods North Central Coast Study Region Presentation to the MLPA Blue Ribbon Task Force and the California Fish and Game Commission February 13, 2008 • Pacifica, CA Prepared by Dr. Steven Gaines
Transcript of Science Guidelines and Evaluation Methods North … Life Protection Act Initiative Science...

Marine Life Protection Act Initiative
Science Guidelines and Evaluation MethodsNorth Central Coast Study Region
Presentation to theMLPA Blue Ribbon Task Force and the California Fish and Game Commission
February 13, 2008 • Pacifica, CA
Prepared by Dr. Steven Gaines

Master Plan Science Advisory Team
MLPA goals
Science guidelines for MPA design
Evaluation Methods

MLPA Goals
1. To protect the natural diversity and function of marine ecosystems.
2. To help sustain and restore marine life populations.
3. To improve recreational, educational, and study opportunities in areas with minimal human disturbance.
4. To protect representative and unique marine life habitats.
5. Clear objectives, effective management, adequate enforcement, sound science.
6. To ensure that MPAs are designed and managed as a network.

MLPA Goals: Habitats
1. To protect the natural diversity and function of marine ecosystems.
2. To help sustain and restore marine life populations.
3. To improve recreational, educational, and study opportunities in areas with minimal human disturbance.
4. To protect representative and unique marine life habitats.
5. Clear objectives, effective management, adequate enforcement, sound science.
6. To ensure that MPAs are designed and managed as a network.

SAT Guidelines: Goals 1 and 4
SAT Approach
Refined key habitats for NCCSR
Defined biogeographic subregions
Refined and described level of protection designations
Evaluated habitat representation in MPAs
MLPA Goals:1) Protect natural diversity and function of marine ecosystems4) Protect representative and unique marine life habitats

SAT Guidelines: Goals 1 and 4
Identified Key Habitats Using:• Bottom Type and Depth Categories• Biogenic Habitats• Oceanographic Features

Key Marine Habitats
Seafloor Habitats
• Rocky reefs• Intertidal zones• Sandy or soft ocean bottoms• Underwater pinnacles• Submarine canyons
Biogenic Habitats
• Kelp forests• Seagrass beds
Oceanographic Habitats
• Upwelling areas• Freshwater plumes• Retention zones
Depth Zones
• Intertidal• Intertidal to 30 m• 30 to 100 m • 100 to 200 m• 200 m and deeper
SAT Guidelines: Goals 1 and 4

SAT Guidelines: Goals 1 and 4
Identified geographic distribution
Estimated area of each habitat type for study area and subregions
Estimated area or linear extent of habitat in each MPA
Used GIS to Locate Habitats

SAT Guidelines: Goals 1 and 4
Three subregions• North (Pt. Reyes – Pt
Arena)• South (Pigeon Pt. to
Pt. Reyes)• Farallon Islands
Based upon• Species and community
distributions• Geomorphology• Oceanography
Pt. Arena
Pt. Reyes
Bodega Head
Pt. San Pedro
Pillar Pt.
Pigeon Pt.
Duxbury
Farallon Islands
Salt Pt.
Gualala

SAT Guidelines: Levels of Protection
direct impacts - habitat damage- incidental removal or mortality of non-target
species
indirect impacts- potential ecosystem effects caused by
removing target or associated catch species
Designated levels of protection based on potential impacts of proposed activities
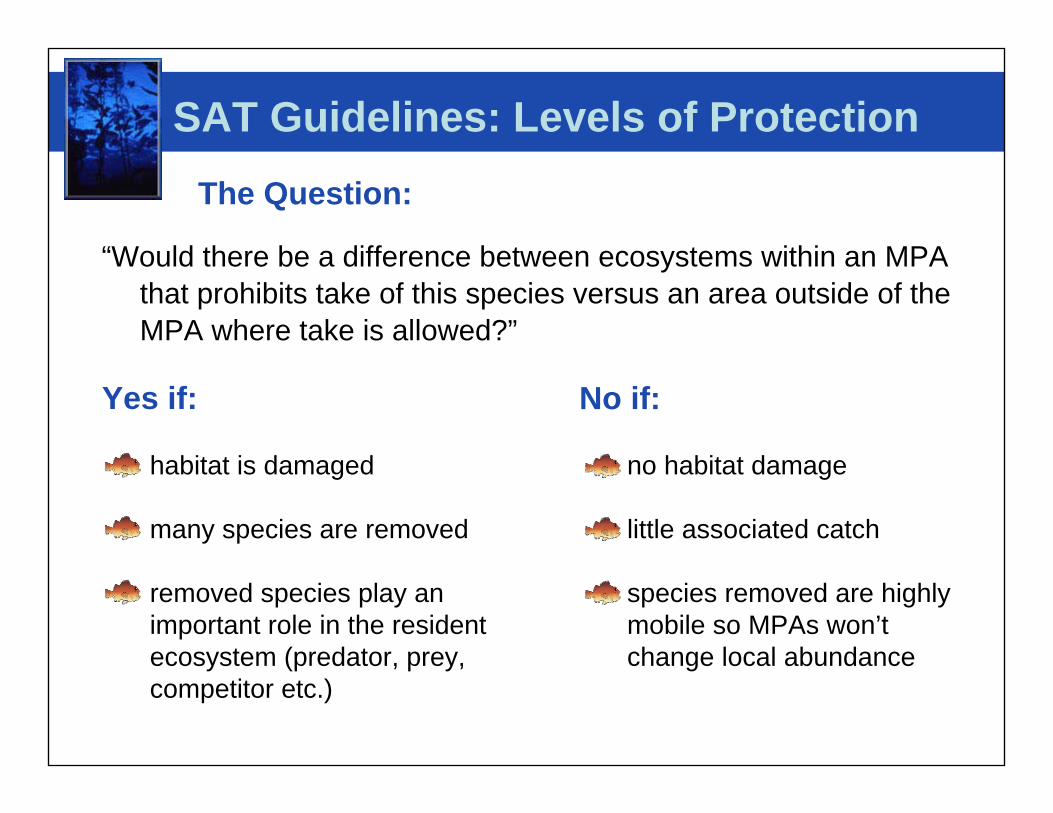
SAT Guidelines: Levels of Protection
“Would there be a difference between ecosystems within an MPA that prohibits take of this species versus an area outside of the MPA where take is allowed?”
The Question:
Yes if:
habitat is damaged
many species are removed
removed species play an important role in the resident ecosystem (predator, prey, competitor etc.)
No if:
no habitat damage
little associated catch
species removed are highly mobile so MPAs won’t change local abundance

SAT Guidelines: Levels of Protection
Level of Protection
MPA Types
Activities associated with this protection level
Very high SMR No take
High SMCA salmon (troll H&L in water greater than 50m depth), sardine, anchovy, and herring (pelagic seine)
Mod-high SMCA salmon (troll H&L in water less than 50m depth)*, Dungeness crab (traps/pots), squid (pelagic seine)
Moderate SMCA SMP
salmon (non-troll H&L), abalone (diving), halibut, white seabass, striped bass, shore-based finfish and flatfishes (H&L), clams (hand harvest), giant kelp (hand harvest)
Low-mod SMCA SMP
Urchin (diving), lingcod, cabezon, greenling,rockfish, and other reef fish (H&L), surfperches(H&L)
Low SMCA SMP
bull kelp and mussels (any method), all trawling, giant kelp (mechanical harvest)
* Note SAT (1/23/08) assigned this activity a “high/mod-high” LOP

Key Questions for Each Proposed Package
1. How well are key habitat types represented in proposed MPA packages?
2. What are the proposed levels of protection for these habitat types?
3. How well are habitats and levels of protection distributed across the study region?
Evaluation: Habitat Representation

Evaluation: Habitat Representation
Example of how habitat representation is evaluated and presented to stakeholders
For some habitats, there are strong differences between proposals in the amount of habitat represented in MPAsand the levels of protection
Very High High Mod-high Moderate Low

0 10 20 30 40 50 60 70 80
Square KM (or linear distance along coastline)
0.0
0.1
0.2
0.3
0.4
0.5
0.6
0.7
0.8
0.9
1.0
Est
imat
ed p
ropo
rtion
of s
peci
esHow Much Habitat is Needed?
For a habitat to count in an MPAShould be sufficient to encompass most of the species that live in the habitat
Survey data shows how more area captures more species
SAT determined that area should be sufficient to capture 90% of biodiversity

How much Habitat is needed?
Habitat Representation needed to encompass 90% of biodiversity
Data Source
Rocky Intertidal ~0.6 linear miles PISCO Biodiversity
Shallow Rocky Reefs/Kelp Forests (0-30 M)
~1.1 linear miles PISCO Subtidal
Deep Rocky Reefs (30-100 M)
~0.2 square miles Starr surveys
Sandy Habitat (30-100 M) ~10 square miles NMFS triennial trawl surveys 1977-2007
Sandy Habitat (0-30 M) ~1.1 linear miles Based on shallow rocky reefs
Sandy Beaches ~ 1 linear mile
The amount needed varies by habitat

MLPA Goals: Populations
1. To protect the natural diversity and function of marine ecosystems.
2. To help sustain and restore marine life populations.
3. To improve recreational, educational, and study opportunities in areas with minimal human disturbance.
4. To protect representative and unique marine life habitats.
5. Clear objectives, effective management, adequate enforcement, sound science.
6. To ensure that MPAs are designed and managed as a network.
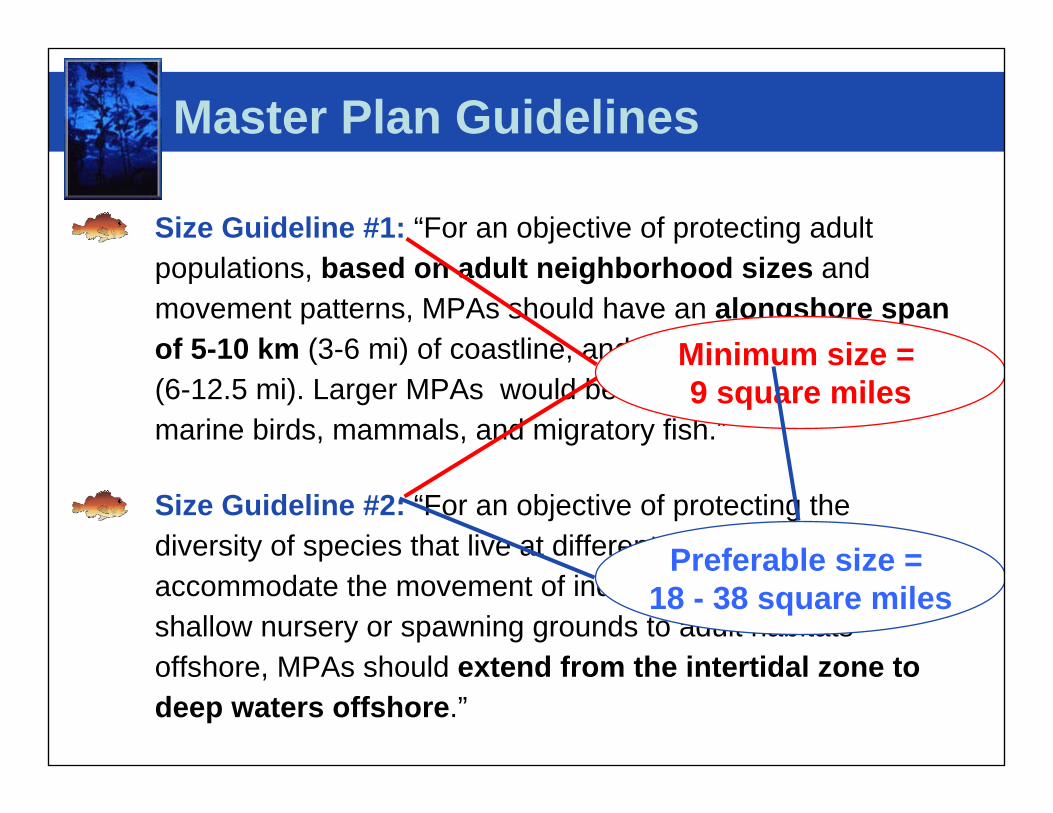
Master Plan Guidelines
• Size Guideline #1: “For an objective of protecting adult populations, based on adult neighborhood sizes and movement patterns, MPAs should have an alongshore span of 5-10 km (3-6 mi) of coastline, and preferably 10-20 km(6-12.5 mi). Larger MPAs would be required to fully protect marine birds, mammals, and migratory fish.”
• Size Guideline #2: “For an objective of protecting the diversity of species that live at different depths and to accommodate the movement of individuals to and from shallow nursery or spawning grounds to adult habitats offshore, MPAs should extend from the intertidal zone to deep waters offshore.”
Minimum size = 9 square miles
Preferable size = 18 - 38 square miles

0 – 1 km 1 – 10 km 10 – 100 km 100 – 1000 km > 1000 km
Invertebratesjumbo squid**
Fishes sharks**tunas**
Turtles**Birds
albatross** pelican** shearwater** shorebirds** terns**
Mammals dolphins sea lions** whales**
InvertebratesDung. crab**
Rockfishesblue, bocaccio,yellowtail
Other Fishesanchovy, Ca. halibut, herring, lingcod, sardine, starry flounder
Birds gulls, cormorants
Mammals harbor seal, otter
Rockfishescanary
Fishesbig skate Pacific halibutsablefish**salmonids**sole spp.sturgeonwhiting**Birdsgulls**
Mammals porpoises sea lions**
Rockfishes black, China, greenspotted,* olive, yelloweye
Other Fisheswalleye perch*
Invertebratesabalone, mussel, octopus, sea star, snail, urchin
Rockfishesblack & yellowbrown, copper, gopher, grass,* kelp, quillback, starry, treefish, vermillion
Other Fishescabezon, eels,greenlings, giant seabass,black, striped, and pile perch, pricklebacks
* Studies of this species included fewer than 10 individuals** Seasonal Migration
SAT Guidelines: Goals 2 and 6

Size Analysis Methods
• Measure individual MPA lengths and area
• Combine contiguous MPAs into single MPA complexes
• Consider level of protection
• Tabulate MPA lengths and areas relative to minimum & preferred guidelines

Evaluation: SizeCluster Size at High Protection

Master Plan Guidelines
• Spacing Guideline: “For an objective of facilitating dispersal of important bottom-dwelling fish and invertebrate groups among MPAs, based on currently known scales of larval dispersal, MPAs should be placed within 50-100 km (31-62 m or 27-54 nm) of each other.”

Size Spacing • Size:– 5-10 km, minimum– 10-20 km, preferred– Intertidal to deep waters
• Spacing:– 50 – 100 km apart
Size and spacing are interrelated
Data from Kinlan and Gaines 2003, PISCO 2007
SAT Guidelines – Goals 2 and 6

Spacing Analysis Methods
• Characterize each MPA by the habitats included
• For each habitat, measure the gaps between adjacent, high protection MPAs

Evaluation: SpacingMaximum Gaps at High Protection

MPA Replication Guidelines
Replication Guidelines:
– “‘Key’ marine habitats should be replicated in multiple MPAs across large environmental and geographic gradients to protect the greater diversity of species and communities that occur across such gradients, and to protect species from local year-to-year fluctuations in larval production and recruitment.”
– “For an objective of providing analytical power for management comparisons and to buffer against catastrophic loss of an MPA, at least three to five replicate MPAs should be designed for each habitat type within a biogeographical region.”

To count as a replicate, the MPA must
1. Meet the desired level of protection
2. Meet size guidelines (9 sq mi) – estuarine MPAsare the exception to this rule
3. Contain enough of the habitat to encompass 90% of biodiversity
Evaluation: Habitat Replication
Note: The biogeographic region is Oregon to Point Conception

Evaluation: Habitat Replication
Replication at High Protection

Evaluation: ReplicationReplication can inform adaptive management
Comparing a marine reserve (no take) to an MPA that allows one activity can provide insights about the impact of that activity on marine ecosystems
For study purposes, the MPAs should be located in similar habitats and in the same subregion
Multiple points of comparison (replicates) increases analytical power

Evaluation: Birds and Mammals
Breeding Colonies/RookeriesAbundance and percentage of subregional populations within proposed MPAs
Haul-outs/Roosts Number of major roosts/haul outs within proposed MPAs
Foraging areas Focus on species with limited foraging ranges. Considered overlap of draft proposal with foraging areas near colonies (near = 3 mi alongshore x 1 mi offshore)Weighted analysis based on colony size and foraging area of overlap within proposed MPAs.
Consider:

SAT Parallel Approaches Group
• Size and spacing guidelines come from simple models informed by data

SAT Parallel Approaches Group
• Habitats are patchy
• Packages do not have MPAs of uniform size and spacing
• Costs depend on how marine species and humans respond

Different Species, Different Views
• Habitats are patchy
• Packages do not have MPAs of uniform size and spacing
• Costs depend on how marine species and humans respond
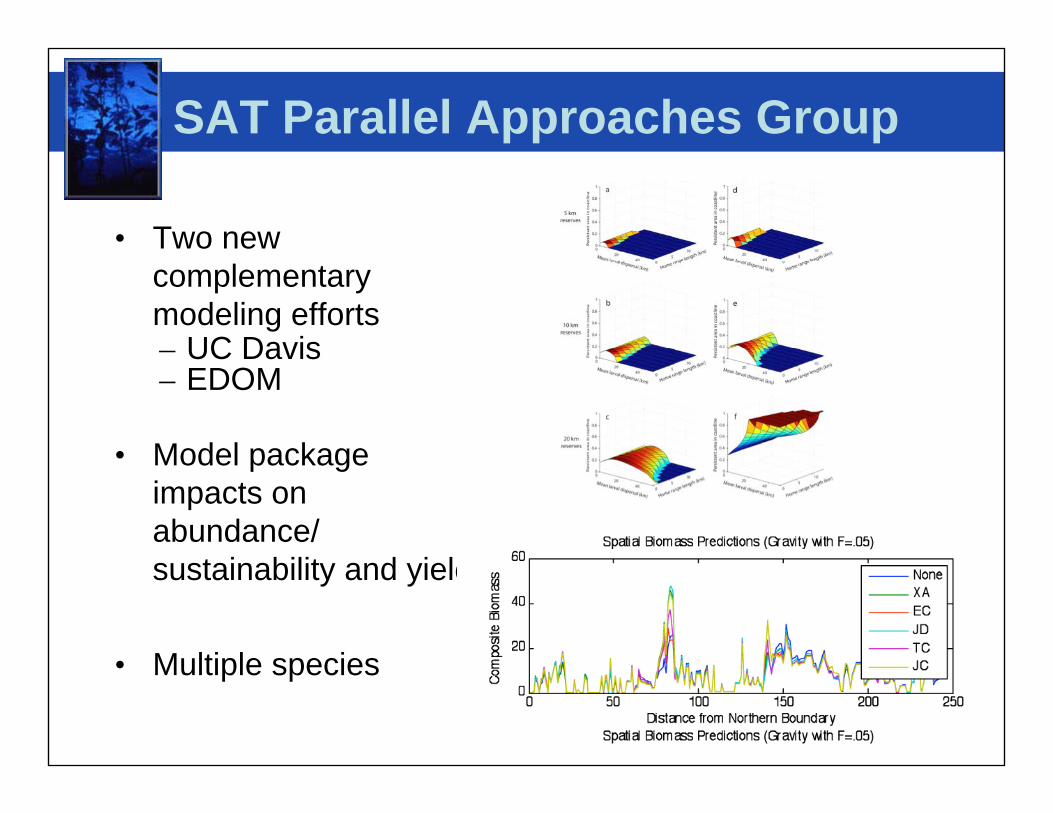
SAT Parallel Approaches Group
• Two new complementary modeling efforts– UC Davis– EDOM
• Model package impacts on abundance/ sustainability and yield
• Multiple species

New Model Insights
• Estimate costs and benefits of packages
• Combine impacts of size and spacing
• Evaluate consequences of different human actions outside MPAs

MLPA goals and MPF guidelines remain the same across study regions
Evaluations are tailored to the specific study region (eg. some habitats not present, presence of offshore islands)
The NCC SAT has refined evaluation methods with additional science
• levels of protection• minimum habitat to count• evaluation of birds and mammals• new ways to present evaluations• new insights from models
Conclusions