science for a changing world Water Quality in the Rio ... · PDF filescience for a changing...
44
Water Quality in the Rio Grande Valley Colorado, New Mexico, and Texas, 1992–95 U.S. Department of the Interior U.S. Geological Survey Circular 1162 science for a changing world
Transcript of science for a changing world Water Quality in the Rio ... · PDF filescience for a changing...

Water Quality in theRio Grande Valley
Colorado, New Mexico, and Texas, 1992–95
U.S. Department of the InteriorU.S. Geological Survey Circular 1162
science for a changing world
A COORDINATED EFFORT
k the
Coordination among agencies and organizations is an integral part of the NAWQA Program. We thanfollowing agencies and organizations who directly participated in the Rio Grande Valley program.•Bureau of Land Management •Bureau of Reclamation•City of Albuquerque •City of Las Cruces•City of Sante Fe •Colorado Department of Health•Colorado Division of Water Resources, Division III •Colorado Division of Wildlife•Colorado State University •Elephant Butte Irrigation District•International Boundary and Water Commission •Los Alamos National Laboratory•Middle Rio Grande Conservancy District •National Park Service•Natural Resources Conservation Service •New Mexico Environment Department•New Mexico Game and Fish Department •New Mexico Highlands University•New Mexico State Engineer •New Mexico Water Resources Research Institute•Pueblo of Isleta •Pueblo of Santa Clara•Rio Grande Water Conservation District •Texas Natural Resources Conservation Commission•Town of Sunland Park •University of New Mexico•U.S. Environmental Protection Agency •U.S. Fish and Wildlife Service
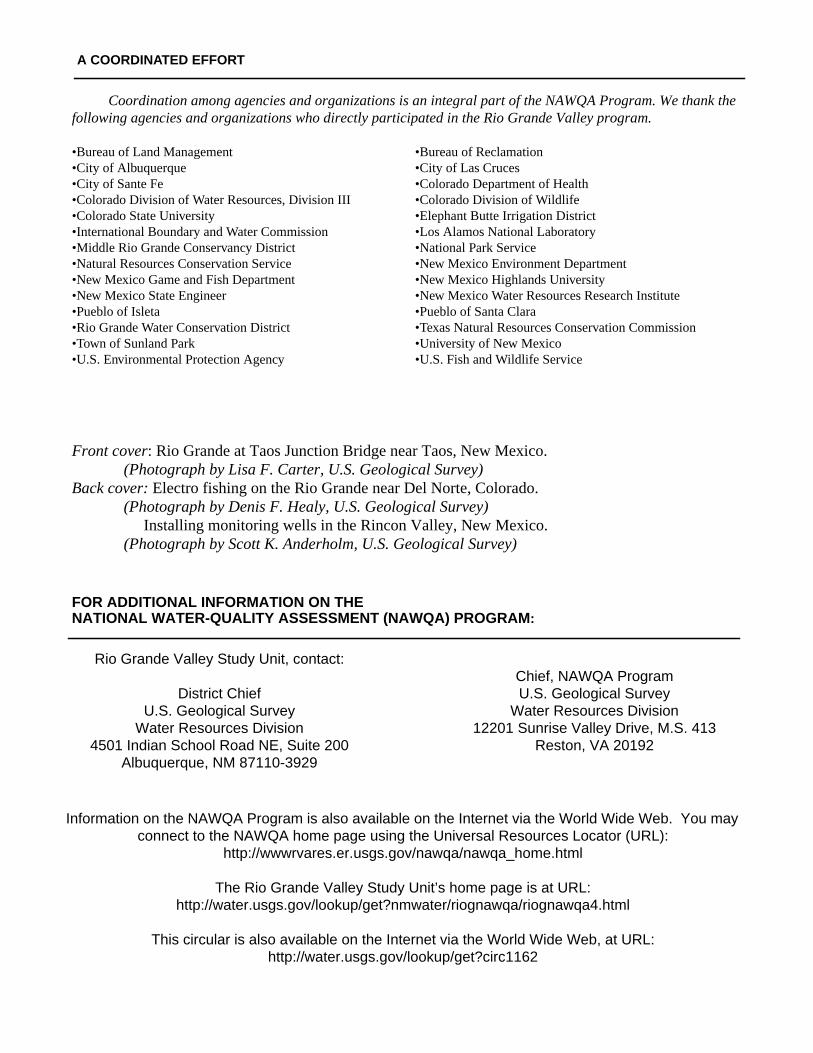
Front cover: Rio Grande at Taos Junction Bridge near Taos, New Mexico. (Photograph by Lisa F. Carter, U.S. Geological Survey)
Back cover:Electro fishing on the Rio Grande near Del Norte, Colorado. (Photograph by Denis F. Healy, U.S. Geological Survey)
Installing monitoring wells in the Rincon Valley, New Mexico. (Photograph by Scott K. Anderholm, U.S. Geological Survey)
FOR ADDITIONAL INFORMATION ON THENATIONAL WATER-QUALITY ASSESSMENT (NAWQA) PROGRAM :
Rio Grande Valley Study Unit, contact:
District ChiefU.S. Geological Survey
Water Resources Division4501 Indian School Road NE, Suite 200
Albuquerque, NM 87110-3929
Chief, NAWQA ProgramU.S. Geological Survey
Water Resources Division12201 Sunrise Valley Drive, M.S. 413
Reston, VA 20192
Information on the NAWQA Program is also available on the Internet via the World Wide Web. You mayconnect to the NAWQA home page using the Universal Resources Locator (URL):
http://wwwrvares.er.usgs.gov/nawqa/nawqa_home.html
The Rio Grande Valley Study Unit’s home page is at URL:http://water.usgs.gov/lookup/get?nmwater/riognawqa/riognawqa4.html
This circular is also available on the Internet via the World Wide Web, at URL:http://water.usgs.gov/lookup/get?circ1162

Water Quality in the Rio Grande Valley,Colorado, New Mexico, and Texas, 1992-95
By Gary W. Levings, Denis F. Healy, Steven F. Richey,and Lisa F. Carter
U.S. GEOLOGICAL SURVEY CIRCULAR 1162
CONTENTS
National Water-Quality AssessmentProgram ......................................................... 1
Summary of major issues and findings ........ 2
Environmental setting and hydrologicconditions ...................................................... 4
Major issues and findings............................... 6
Welcome to the Rio Grande Valley ............ 6
Organics in ground water, surface water, bed sediment, and fish tissue ...... 10
Nutrients in ground water and surfacewater ............................................................ 14
Radon in ground water and dissolvedsolids in surface water............................... 16
Trace elements............................................... 18
Fish communities and streamhabitat .......................................................... 20
Water quality conditions in anational context ............................................ 22
Study design and data collection................... 26
Summary of compound detectionsand concentrations ....................................... 28
References ......................................................... 34
Glossary............................................................. 36

Library of Congress Cataloging in Publications Data
The use of firm, trade, and brand names in this report is for identification purposes only anddoes not constitute endorsement by the U.S. Government
1998
Free on application to theU.S. Geological Survey
Information ServicesBox 25286 Federal Center
Denver, CO 80225
U.S. DEPARTMENT OF THE INTERIOR
BRUCE BABBITT, Secretary
U.S. GEOLOGICAL SURVEY
Thomas J. Casadevall, Acting Director
Levings, Gary W. Water quality in the Rio Grande Valley, Colorado, New Mexico, and Texas, 1992–95
p. cm. -- (U.S. Geological Survey circular ; 1162) Includes bibliographical references.
1. Water quality--Rio Grande Valley I. Levings, Gary W. II. Geological Survey (U.S.) III. Series: U.S.Geological Survey circular : 1162-G.TD225.R53W38 1998363.739’42’097644--dc21
98-11972CIP
ISBN 0-607-89113-0
NATIONAL WATER-QUALITY ASSESSMENT PROGRAM
U.S. G
isandandU.S.) totohearean
ofn ashet 70boudys inngll asling
tionlar
akef the
edRio
lityilyent.tors
ists,pro-iteste
t
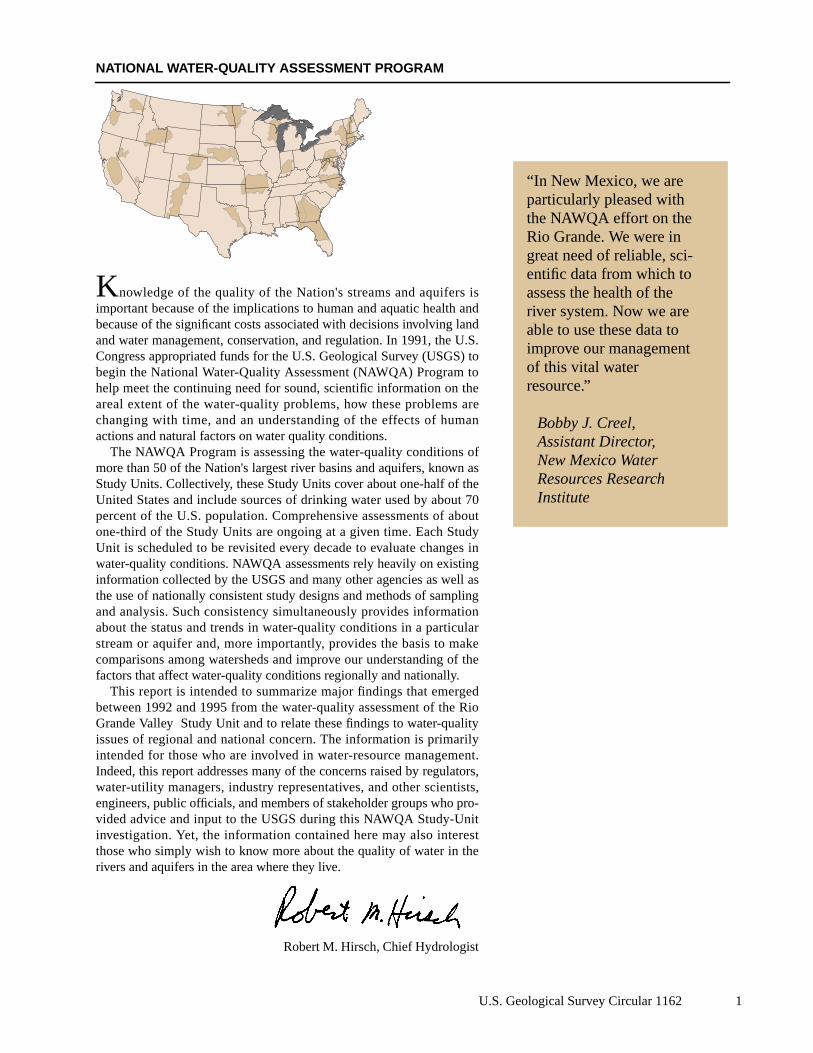
“In New Mexico, we areparticularly pleased withthe NAWQA effort on theRio Grande. We were ingreat need of reliable, sci-entific data from which toassess the health of theriver system. Now we areable to use these data toimprove our managementof this vital waterresource.”
Bobby J. Creel,Assistant Director,New Mexico WaterResources ResearchInstitute
,
Knowledge of the quality of the Nation's streams and aquifersimportant because of the implications to human and aquatic healthbecause of the significant costs associated with decisions involving land water management, conservation, and regulation. In 1991, theCongress appropriated funds for the U.S. Geological Survey (USGSbegin the National Water-Quality Assessment (NAWQA) Programhelp meet the continuing need for sound, scientific information on tareal extent of the water-quality problems, how these problemschanging with time, and an understanding of the effects of humactions and natural factors on water quality conditions.
The NAWQA Program is assessing the water-quality conditionsmore than 50 of the Nation's largest river basins and aquifers, knowStudy Units. Collectively, these Study Units cover about one-half of tUnited States and include sources of drinking water used by aboupercent of the U.S. population. Comprehensive assessments of aone-third of the Study Units are ongoing at a given time. Each StuUnit is scheduled to be revisited every decade to evaluate changewater-quality conditions. NAWQA assessments rely heavily on existiinformation collected by the USGS and many other agencies as wethe use of nationally consistent study designs and methods of sampand analysis. Such consistency simultaneously provides informaabout the status and trends in water-quality conditions in a particustream or aquifer and, more importantly, provides the basis to mcomparisons among watersheds and improve our understanding ofactors that affect water-quality conditions regionally and nationally.
This report is intended to summarize major findings that emergbetween 1992 and 1995 from the water-quality assessment of theGrande Valley Study Unit and to relate these findings to water-quaissues of regional and national concern. The information is primarintended for those who are involved in water-resource managemIndeed, this report addresses many of the concerns raised by regulawater-utility managers, industry representatives, and other scientengineers, public officials, and members of stakeholder groups whovided advice and input to the USGS during this NAWQA Study-Uninvestigation. Yet, the information contained here may also interthose who simply wish to know more about the quality of water in thrivers and aquifers in the area where they live.
Robert M. Hirsch, Chief Hydrologist
eological Survey Circular 1162 1
rink-t of
and
lls con-r com-cted
in an drink-
mplesssam-
en with-
in
easoncide use
Apriled in
oncen-
s the
a-ring
SUMMARY OF MAJOR ISSUES AND FINDINGS
COLORADO
NEWMEXICO
Issue: Ground water is the main source of drinking water in the Rio GrandeValley Study Unit; its quality is a major concern.
A variety of chemicals used in human activities, including pesticides, volatileorganic compounds (VOCs), and nitrate, were detected in ground-watersamples from shallow wells (within the top 10-15 feet of the water table).Samples from deeper ground water underlying the Rio Grande flood plain,which is more typically used as a drinking-water source, contained onepesticide, no VOCs, and nitrates (pages 10, 13, and 14).
• Nitrate concentrations exceeded the U.S. Environmental Protection Agency (EPA) ding-water standard in 31 percent of shallow wells in the San Luis Valley and 17 percenshallow wells in the Rincon Valley. Both of these areas are predominantly agricultural luse.
• Pesticides were detected in both agricultural and urban land-use areas, with 29 percent of shallow wetaining at least one pesticide. Prometon and metolachlor were the most frequently detected, yet neithepound exceeded EPA drinking-water standards, although standards do not exist for all pesticides deteOnly one pesticide was detected in the deeper ground water.
• Six VOCs were detected in shallow ground water from 11 percent of the wells sampled, most commonlyurban land-use area. No VOCs were found in deeper ground water. No concentrations exceeded EPAing-water standards; however, standards exist for only three of the six compounds detected.
• Radon, a naturally occurring radionuclide in the Rio Grande Valley, was detected in all ground-water sain concentrations that ranged from 190 to 2,300 picocuries per liter. The highest median concentrationoccurred in shallow wells in the San Luis Valley and in the deeper ground water. About 57 percent of theples exceeded 300 picocuries per liter, the proposed EPA drinking-water standard that has recently bedrawn for further evaluation.
Issue: Pesticides are present in surface water, bed sediment, and whole-body fish at sites sampledthe Rio Grande and its tributaries and drains.
No pesticide concentration detected in surface water exceeded EPA drinking-water standards orapplicable Federal or State ambient criterion or guideline. One or more pesticides were detected at94 percent of the sites sampled in the Rio Grande, its tributaries, or drains; most concentrations,however, were at or only slightly above the laboratory level of detection (pages 10, 11, and 12).
• In the Mesilla Valley, there were more detections of more different pesticides during the nonirrigation sthan during the irrigation season; as many as 27 percent of the pesticide detections attributed to pestiin the Mesilla Valley may be from urban sources.
• In the Rincon Valley, more pesticide compounds were detected more frequently in agricultural drains inthan in October or January; some individual pesticides detected in agricultural drains were not detectshallow ground water.
• Concentrations of DDE were detected in composited samples of fish collected at 10 of 11 sites; these ctrations, however, are below the national median reported by the U.S. Fish and Wildlife Service (FWS)National Contaminant Biomonitoring Program.
• The presence of DDT and its metabolites, DDE and DDD, in bed sediment and whole-body fish confirmpersistence of this pesticide in the environment.
• Cis-chlordane,trans-chlordane, and trans-nonachlor were detected in whole-body fish samples; concentrtions, however, were below the national median reported by the FWS National Contaminant BiomonitoProgram.
2 Water Quality in the Rio Grande Valley, Colorado, New Mexico, and Texas, 1992-95

SUMMARY OF MAJOR ISSUES AND FINDINGS
wereado,
) in the
ium,tribu-
t trace near
zincuence
m, ura-
r the
pledhrough
Rio
mita, Rio
Issue: Have elevated trace-element concentrations impaired reaches of the Rio Grande and itstributaries and, if so, can the sources be identified?
The water quality in reaches of the Rio Grande and some of its tributaries has been impaired byelevated concentrations of trace elements; however, data indicate that the concentrations tend todecrease downstream from the source. A combination of natural conditions and human activitiesappears to be associated with elevated trace-element concentrations (page 19).
• Highly elevated concentrations of antimony, arsenic, cadmium, copper, lead, mercury, silver, and zinc detected in bed sediment from Willow Creek and the Rio Grande, downstream from the Creede, ColorMining District.
• Elevated concentrations of arsenic, cadmium, copper, lead, and zinc were detected in fish tissue (liverRio Grande downstream from the Creede, Colorado, Mining District.
• Analysis of data collected using transplanted bryophytes (moss) indicates that concentrations of cadmcopper, lead, and zinc in bryophytes increased at sites on the Rio Grande immediately downstream fromtaries that drain mining districts but decreased with distance from the tributaries. Concentrations of moselements in bryophytes were lower in a tributary stream downstream from urban land use than at sitesmining or agricultural land use.
• Dissolved concentrations of beryllium, cadmium, cobalt, lithium, manganese, molybdenum, nickel, andwere moderately higher at a site on the lower Red River than in the Rio Grande downstream of its conflwith the Red River.
• Highly elevated concentrations of dissolved cadmium, cobalt, copper, iron, manganese, nickel, strontiunium, and vanadium were detected in the Alamosa River where it enters the San Luis Valley.
• Maximum total recoverable concentrations of most trace elements in bed sediment were detected neamouth of the Rio Puerco, an indication of the importance of sediment in trace-element transport.
Issue: Is the fish community structure in the Rio Grande Valley an indication that sites areenvironmentally stressed?
Based on the number of introduced, omnivorous, pollution-tolerant fish and the number of fishwith external anomalies, six of the ten sites sampled appear to show some indications ofenvironmental perturbation (page 20).
• Fish community-structure data indicate that introduced species predominate at four of the six sites samduring 1994. Stocking introduced species has probably resulted in the displacement of native species tcompetition or predation.
• The number of introduced, omnivorous, pollution-tolerant, and anomalous fish at sites sampled in the Grande indicate that sites are environmentally stressed.
Issue: Is significant habitat degradation occurring in the Rio Grande Valley?
Six of the 10 sites sampled appear to have significant habitat degradation based on streammodification, bank erosion, bank vegetation stability, and riparian vegetation density (page 21).
• Rio Grande near Del Norte, Colorado; Conejos River near Lasauses, Colorado; Rio Chama near ChaNew Mexico; Santa Fe River above Cochiti Lake, New Mexico; Rio Grande at Isleta, New Mexico; andGrande at El Paso, Texas, appear to have significant habitat degradation.
U.S. Geological Survey Circular 1162 3
ENVIRONMENTAL SETTING AND HYDROLOGIC CONDITIONS
Socorro
El Paso, Texas
Santa Fe
Alamosa
Albuquerque
Taos
Las Cruces
ColoradoNew Mexico
Southern RockyMountains Province
ColoradoPlateausProvince
Basin and RangeProvince
MexicoUnited States
0 30 60 MILES
0 30 60 KILOMETERS0 30 60 MILES
0 30 60 KILOMETERS
Urban
Agriculture
Forest
Barren andOther
Rangeland
EXPLANATION
LAND USE
0010
2030
405060
70
8090100
PE
RC
EN
TAG
E O
F T
OT
AL
WA
TER
WIT
HD
RAW
ALS
500
1,000
1,500
2,000
2,500
3,000
3,500
GROUND WATER
SURFACE WATER
WA
TER
WIT
HD
RA
WA
LS,
IN M
ILLI
ON
S O
F G
ALL
ON
S P
ER
DA
Y
TOT
AL
PU
BLI
C S
UP
PLY
(911
,000
ser
ved)
DO
ME
STI
C S
UP
PLY
(193
,000
ser
ved)
CO
MM
ER
CIA
L A
ND
LIV
ES
TOC
K
IND
US
TRIA
L A
ND
MIN
ING
IRR
IGA
TIO
N
ESTIMATED WATER WITHDRAWAL IN 1990
URBAN AGRI-CULTURE
RANGE-LAND
FOREST BARRENAND
OTHER
LAND USE30,000
0
5,000
10,000
15,000
20,000
25,000
AR
EA
, IN
SQ
UA
RE
MIL
ES
0
10
20
30
40
50
60
PE
RC
EN
TA
GE
OF
TO
TA
L A
RE
A
TOTAL AREA =45,900 SQUAREMILES
(430)(1820)
(880)
(16,500)
(26,300)
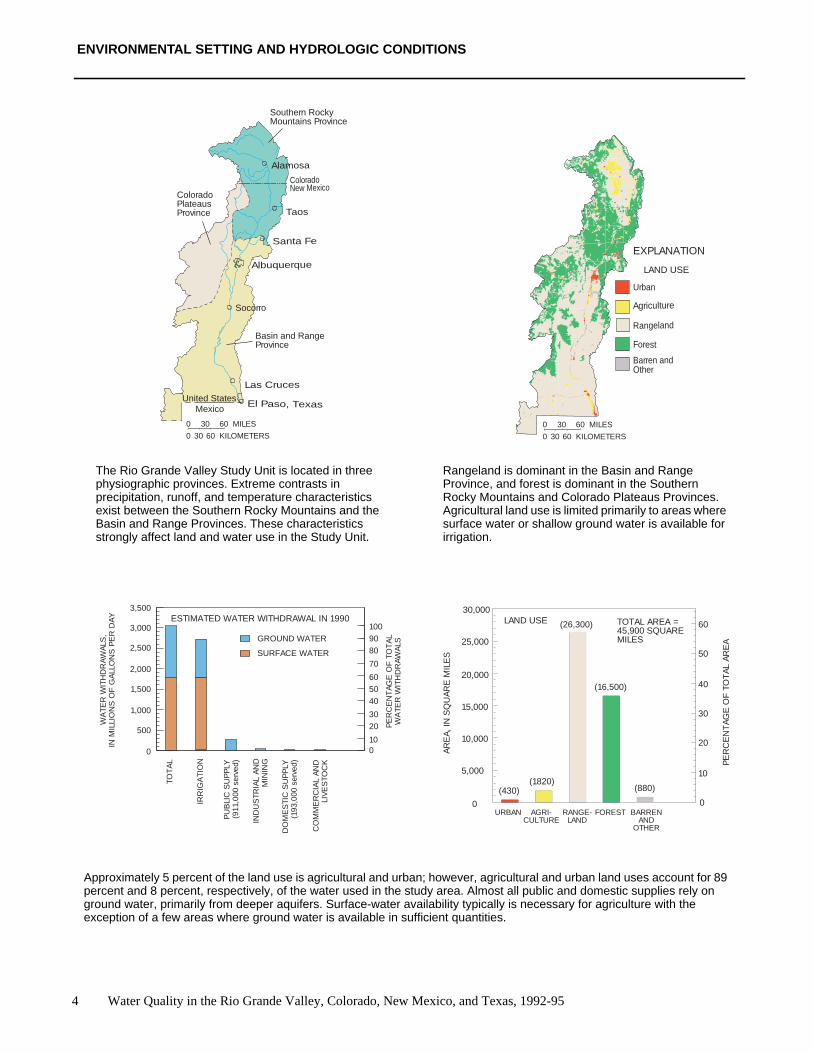
Rangeland is dominant in the Basin and RangeProvince, and forest is dominant in the SouthernRocky Mountains and Colorado Plateaus Provinces.Agricultural land use is limited primarily to areas wheresurface water or shallow ground water is available forirrigation.
The Rio Grande Valley Study Unit is located in threephysiographic provinces. Extreme contrasts inprecipitation, runoff, and temperature characteristicsexist between the Southern Rocky Mountains and theBasin and Range Provinces. These characteristicsstrongly affect land and water use in the Study Unit.
Approximately 5 percent of the land use is agricultural and urban; however, agricultural and urban land uses account for 89percent and 8 percent, respectively, of the water used in the study area. Almost all public and domestic supplies rely onground water, primarily from deeper aquifers. Surface-water availability typically is necessary for agriculture with theexception of a few areas where ground water is available in sufficient quantities.
4 Water Quality in the Rio Grande Valley, Colorado, New Mexico, and Texas, 1992-95

ENVIRONMENTAL SETTING AND HYDROLOGIC CONDITIONS
EXPLANATION
MONTHLY TOTALPRECIPITATION
HISTORICAL MEDIAN Forprecipitation, it is the medianof monthly total precipitation.For streamflow, it is themedian of monthly medianstreamflow. Period ofrecord is 1960-90
PR
EC
IPIT
ATI
ON
, IN
IN
CH
ES
0
5
10
15
JAN
19
93
JAN
19
94
JAN
19
95
Wolf Creek Pass
Red River
0
5
10
15
JAN
19
93
JAN
19
94
JAN
19
95
PR
EC
IPIT
ATI
ON
, IN
IN
CH
ES
Elephant Butte Dam
0
5
10
15
JAN
19
93
JAN
19
94
JAN
19
95
PR
EC
IPIT
ATI
ON
, IN
IN
CH
ES
PR
EC
IPIT
ATI
ON
, IN
IN
CH
ES
0
5
10
15
JAN
19
93
JAN
19
94
JAN
19
95
Albuquerque
Socorro
El Paso, Texas
Santa Fe
Alamosa
Albuquerque
Taos
Las Cruces
ColoradoNew Mexico
JAN
19
93
JAN
19
94
JAN
19
95
0
5,000
1,000
2,000
3,000
4,000
STR
EA
MFL
OW
, IN
CU
BIC
FE
ET
PE
R S
EC
ON
D
JAN
19
93
JAN
19
94
JAN
19
95
5,000
0
1,000
2,000
3,000
4,000
STR
EA
MFL
OW
, IN
CU
BIC
FE
ET
PE
R S
EC
ON
D
JAN
19
93
JAN
19
94
JAN
19
95
5,000
0
1,000
2,000
3,000
4,000S
TRE
AM
FLO
W, I
N C
UB
IC F
EE
TP
ER
SE
CO
ND
JAN
19
93
JAN
19
94
JAN
19
95
STR
EA
MFL
OW
, IN
CU
BIC
FE
ET
PE
R S
EC
ON
D
5,000
0
1,000
2,000
3,000
4,000
Rio Grande near Del Norte
Rio Grande near Lobatos
Rio Grande Conveyance Channeland Floodway at San Marcial
Rio Grande at El Paso
MONTHLY MEDIANSTREAMFLOW
A comparison of precipitation and streamflow at selected sites for the study period 1992-95 with the historical period 1960-90 isshown above. Monthly total precipitation during the study period was generally higher than the monthly median at the twonorthern sites, whereas precipitation at the two southern sites was near the median. The monthly median streamflow at the twonorthern sites was generally about the same as the historical median monthly streamflow except during spring runoff when themonthly median during the study period exceeded the historical median streamflow. The streamflow at the two southern sites iscontrolled primarily by reservoir releases, but did exceed the historical median during the irrigation season. The impact of theabove average precipitation and streamflow on the water quality of the Study Unit cannot be generalized, it must be evaluatedon a site by site basis. This detailed evaluation is necessary because of the complexity of the interaction of surface water andground water, irrigation withdrawal and return, and reservoir storage and release.
U.S. Geological Survey Circular 1162 5

MAJOR ISSUES AND FINDINGSWelcome to the Rio Grande Valley
d
,
r-
t
37Colorado
106
New Mexico
10738
MedanoCreek
Conejos R
Alamosa
DelNorte
RioGrandeReservoir
Saguache Cr
de
SanLuis
Valley
Red R
Alamosa R
Creede
A discussion of water-qualityissues, results, or findings in the RioGrande Valley Study Unit (fig. 1) nec-essarily emphasizes the historicalimportance of surface water in this aridto semiarid environment. Surfacewater has been the “lifeblood of theRio Grande Valley.” Records from thesixteenth-century Spanish expeditionsinto the area report that irrigated agri-culture was in use by some of theindigenous peoples. Where surfacewater and springs existed, peoplecould exist. As European colonizationof the area occurred, the introductionof new crops, such as wheat, barley,and oats, required the expansion ofirrigation systems. As a result, settle-ments were established on the floodplains of the streams where agricul-tural land could be irrigated. Onlywhen technological developmentsfacilitated access to water in deepaquifers did settlements begin toappear throughout the Study Unit.
The Rio Grande is the only river I ever saw that needed irrigation.
—Will Rogers
0 30 60 MILES
0 30 60 KILOMETERS
Rio
Puerc
o
Santa FeRiver
UN
ITST
UDY
BOUNDARY
32
33
34
35
36
108
MEXICO
UNITED STATES
Albuquerque
ElephantButte Res
CaballoRes
CochitiLake
El Paso,Texas
LasCruces
Taos
Rio Chama
Rio
Gra
nd
e
Rio
Gra
n
RinconValley
Mesilla Valley
Figure 1.—Rio Grande Valley StudyUnit.
-
For the people living in the RioGrande Valley, the importance ofwater—both quantity and quality—isan ongoing issue. Water-resourceissues of a local or regional natureappear in the news virtually everydayAs competition for the limited waterresource intensifies, major economicdecisions, both locally and regionally,will be controlled by the availabilityof usable quantities of ground and surface water.
The objective of the NAWQA Pro-gram is to assess the status of andtrends in the Nation’s water quality. Inthe Rio Grande Valley Study Unit, aseries of interrelated but separatestudy components were conductedduring 1992-95 to assess the quality oground and surface water (fig. 2). Theprimary focus was along the Rio
6 Water Quality in the Rio Grande
Grande flood plain. Limited work alsowas conducted on tributary and non-tributary streams in the northern partof the Study Unit. The only exceptionwas an agricultural land-use studycomponent assessing shallow groundwater in basin-fill deposits in the SanLuis Valley located primarily outsidethe flood plain. For a discussion of theobjectives, a brief description, and thewater-quality measures of these studycomponents, see the Study Design anData Collection section (page 26).Selected results and interpretationsbased on these study components arediscussed in the following sections.Detailed data interpretation forselected study components is reportein individual reports (see Referencessection, page 34).
The following discussion includesinterpretation of data collected foranalysis of pesticides, nutrients, radonvolatile organic compounds, dissolvedsolids, and trace elements and results
.
-
f
of ecological studies of biological com-munities and stream habitat. Whereapplicable, these constituents are compared to EPA maximum contaminantlevels (MCLs), secondary maximumcontaminant levels (SMCLs), or healthadvisories (HAs) for public water sys-tems (U.S. Environmental ProtectionAgency, 1996a). For ambient water, theEPA, National Academy of Sciences,and Environment Canada have estab-lished water-quality criteria or guide-lines for aquatic organisms. Thesecriteria may be used by State agenciesto establish local ambient criteria. TheFWS has reported median values fororganochlorine compounds and poly-chlorinated biphenyls as part of theirNational Biomonitoring Program(Schmitt and others, 1985, 1990;Schmitt and Brumbaugh, 1990).
Valley, Colorado, New Mexico, and Te
d
Not all data collected as part of theNAWQA Program have been compiledin reports. These data have been col-lected at specific sites throughout theStudy Unit and are available in projectfiles. For example, ground-water datawere collected at two sites in Albu-querque and at one site in the MesillaValley to determine the age of groundwater with depth. Biological commu-nity surveys conducted at selected suface-water sites include quantitativeand qualitative sampling methods foralgae and benthic invertebrates; habitacharacterization including stream-reach characterization, instream and
xas, 1992-95

MAJOR ISSUES AND FINDINGSWelcome to the Rio Grande Valley
r-
-
,
f
-
r
Figure 2.—Land-use studies, aquifer subunit survey, and surface-water sites.
bank vegetation species, density, andspecies dominance along transects pependicular to the stream; and streammeandering, gradient, elevation, andwater-management features (dams,bridges, canals, or diversions).
The Study Unit, approximately45,900 square miles, contains diversehydrologic and climatological regimes.Altitudes range from peaks exceeding14,000 feet in the northern part of theStudy Unit to approximately 3,700 feetat the lower basin boundary. The cli-mate in the high mountain headwaterareas of the Rio Grande and its north-ern tributaries is alpine tundra whereaverage annual precipitation mayexceed 50 inches; most of this precipitation is in the form of snow. Annualrunoff in mountainous areas mayexceed 30 inches. In contrast, 750miles downstream near the lower basinboundary of the Study Unit, the RioGrande flows through a portion of theChihuahuan Desert where averageannual precipitation is less than 8inches; most of this precipitation is inthe form of summer thunderstorms.Annual runoff is less than 0.01 inch. Inthe mountainous headwater areas,annual potential evaporation is lessthan 70 percent of annual precipitationwhereas in the southern part of theStudy Unit, annual potential evapora-tion may exceed 1,000 percent ofannual precipitation.
The existence of a reliable source osurface water in the southern part ofthe Study Unit is the result of humanalteration of the river system by theconstruction of reservoirs to controlrunoff. The storage of runoff in thespringtime allows for a dependablesource of water to support irrigationneeds throughout the long growingseason. This alteration of the river system has affected the water quality ofthe Rio Grande.
Within the Study Unit, two ground-water land-use studies and one aquifesubunit survey focused on the floodplain of the Rio Grande from CochitiLake in New Mexico, to El Paso,
U.S. Geological Survey Circular 1162 7

MAJOR ISSUES AND FINDINGSWelcome to the Rio Grande Valley
e
-
-
t
,
-
d
Table 1.—Rio Grande Valley Study Unit Basic Fixed Sites[Main-stem sites shown in blue]
Site number Station name1 Rio Grande near Del Norte, Colo.2 Saguache Creek near Saguache, Colo.3 Medano Creek near Mosca, Colo.4 Rio Grande above mouth of Trinchera Creek, near Lasauses, Colo.5 Conejos River near Lasauses, Colo.6 Rio Grande near Lobatos, Colo.7 Rio Grande below Taos Junction Bridge, near Taos, N. Mex.8 Rio Chama near Chamita, N. Mex.9 Rio Grande at Otowi Bridge near San Ildefonso, N. Mex.
10 Rito de los Frijoles in Bandelier National Monument, N. Mex.11 Santa Fe River above Cochiti Lake, N. Mex.12 Rio Grande at Isleta, N. Mex.13 Rio Puerco near Bernardo, N. Mex.14 Rio Grande Conveyance Channel at San Marcial, N. Mex.15 Rio Grande Floodway at San Marcial, N. Mex.16 Rio Grande below Leasburg Dam near Leasburg, N. Mex.17 Rio Grande at El Paso, Tex.
Texas. One land-use study was con-ducted in the basin-fill deposits in theSan Luis Valley in Colorado. Onlywhen the hydrologic system along theRio Grande is understood can the com-plexity of the many influences thataffect water quality throughout theStudy Unit be appreciated. A detaileddiscussion of the ground-water systemin the Study Unit is presented in Ellis
and others (1993). The following is abrief description of the ground-watersystem to aid in understanding the following water-quality discussions.
Complex interactions occurbetween ground water and surfacewater in the Rio Grande flood plain. Asystem of canals distributes surfacewater for agricultural irrigation and asystem of drains intercepts shallow
8 Water Quality in the Rio Grande Valley, Colorado, New Mexico, and Te
rr
-
Rio Grande Reservoir, in the headwaters of the Rio Grande, is used to storerunoff for irrigation at surface-water diversions in the San Luis Valley (photographby Sherman R. Ellis, U.S. Geological Survey).
-
ground water and returns it to the RioGrande. Surface water leaks from theRio Grande and canals to recharge thshallow ground-water system. Inplaces, deeper ground water flowsupward to recharge the shallowground-water system and/or to contribute flow to the Rio Grande. In addition,excess applied irrigation water infil-trates and recharges the shallowground-water system. Evapotranspiration losses from vegetation, land, andwater surfaces, can have a major effecon the quality of ground water.
Two land-use studies, in the Albu-querque area and in the Rincon Valleyfocused on the upper 10-15 feet ofground water in the flood-plain allu-vium (referred to as shallow groundwater in this report). This water generally is not used for domestic supply.However, because of the interactionwith surface water and, in isolatedareas, because declines in the waterlevel in the deeper aquifer have causethe shallow aquifer to be a rechargesource in some areas, knowing thequality of the shallow ground water isimportant in making managementdecisions.
The aquifer subunit survey, fromCochiti Lake to El Paso, focused ondeeper water underlying the flood-plain (referred to as deeper groundwater in this report). This water is usedfor domestic supply in some areas.
The land-use study in the San LuisValley was not entirely in the RioGrande flood plain. Most of the area isin the San Luis Closed Basin, which isboth a ground-water and surface-wateclosed basin. Neither ground water nosurface water flows out of the ClosedBasin. The shallow ground water is inunconsolidated basin-fill deposits. Thewater in these basin-fill deposits isused extensively for irrigation and, ona limited basis, for domestic supply.However, these wells generally tapseveral tens of feet of the aquifer. Thestudy wells were completed in theupper 10-15 feet of the saturated basinfill deposits.
xas, 1992-95

MAJOR ISSUES AND FINDINGSWelcome to the Rio Grande Valley
y
-
-
-
Typical ephemeral tributary channel to the Rio Grande in the lower part of theStudy Unit. Runoff occurs in response to precipitation (photograph by ShermanR. Ellis, U.S. Geological Survey).
Historically, streamflow in the RioGrande was caused by spring snow-melt (April through June) and summermonsoon thunderstorms (July andAugust). This natural streamflow pat-tern has been altered and regulated bthe construction of reservoirs on themain stem and tributaries that impoundand store water for later use, primarilyirrigation.
All surface water in the Rio Grandeis appropriated by various compacts,treaties, and individual water rights.Appropriated surface-water rights onthe Rio Grande in Colorado and NewMexico usually exceed the annualmean flow of the river (Ellis and oth-ers, 1993).
As the discussion of the water-quality data is presented, it is important torealize that 89 percent of water use inthe Study Unit in 1990 was for irriga-tion, 8 percent for public supply, and 3percent for all other uses. The effectthat irrigation and urban use has on thequality of surface water is related tothe processes to which the water issubjected as it moves downstream. It isrepeatedly diverted, applied to fields,returned to the Rio Grande directly orthrough drains, impounded in reser-voirs, lost to evapotranspiration, orconsumptively used. Urban areas contribute wastewater and anthropogenicorganic chemicals such as volatileorganic compounds and pesticides;agricultural areas contribute chemicalsfrom fertilizers and pesticides; miningareas contribute trace elements; atmospheric deposition contributes chemi-cals such as nitrate and phosphorus;and the use and reuse of waterincreases dissolved-solids concentra-tions because of evapotranspiration.All of these processes can contribute todeterioration in surface-water qualityof the Rio Grande as it moves throughthe basin.
U.S. Geological Survey Circular 1162 9
San Acacia Diversion Dam on the Rio Grande about 55 miles downstream fromAlbuquerque is one of several diversion dams established on the Rio Grande forsurface-water irrigation (photograph by Sherman R. Ellis, U.S. Geological Survey).

MAJOR ISSUES AND FINDINGSOrganics in Ground Water, Surface Water, Bed Sediment, and Fish Tissue
ti-
ee
-
s
a-
-
-
r
-
d
1Pesticide identified but concentration was not determined at a 99-percent confidence level.
Table 2.—Pesticide detections in ground water[µg/L, micrograms per liter; MCL, U.S. Environmental Protection Agencymaximum contaminant level; HA, U.S. Environmental Protection Agencylifetime health advisory; E, estimated;1 --, no MCL or HA established]
PesticideNumber ofdetections
Detectionconcentration
(µg/L)
MCL(µg/L)
HA(µg/L)
San Luis Valley agricultural land-use study (35 samples)Metribuzin 3 E0.005 - 0.017 -- 100Metolachlor 1 0.072 -- 70p,p’-DDE 1 E0.002 -- --Prometon 1 0.01 -- 100
Albuquerque urban land-use study (24 samples)Prometon 5 E0.005 - 0.27 -- 100Atrazine 1 0.016 3 3Bromacil 1 0.52 -- 90Carbaryl 1 E0.021 -- 700Carbofuran 1 E0.010 40 40
Rincon Valley agricultural land-use study (30 samples)Metolachlor 9 E0.005 - 5.4 -- 70Prometon 5 E0.005 - 0.32 -- 100Diazinon 1 0.077 -- --Napropamide 1 0.014 -- --p,p’-DDE 1 E0.002 -- --
Aquifer subunit survey (30 samples)Prometon 1 0.038 -- 100
Synthetic organic compounds havebeen detected in ground and surfacewater, sediment, and biota of the aquifers, rivers, and lakes throughout theUnited States. These organic com-pounds enter the hydrologic system inpoint-source discharges, nonpoint-source runoff, atmospheric depositionand ground-water discharges.
Why are Pesticides ofInterest?
Pesticides are used to control manydifferent types of weeds, insects, andother pests in a wide variety of agricul-tural and urban settings. Concernshave grown steadily about the potentiaadverse effects of pesticides on theenvironment and human healththrough contamination of the hydro-logic system. Water is one of the pri-mary means by which pesticides aretransported from their applicationareas to other parts of the environmentThrough physical processes such aserosion, surface runoff, and ground-water recharge, trace amounts of pescides used on lawns, gardens, roadrights-of-way, and crops can eventu-ally end up in the ground-water systemand in streams. Although many mod-ern pesticides are designed to degradrapidly, the short distance between thland surface and shallow water tablemakes shallow wells more susceptibleto contamination than deeper wells.
Organochlorine pesticides are syn-thetic hydrophobic organic chemicalsthat pose a threat to the environmentbecause of their persistence (their usehas been banned in the U.S. since theearly 1970’s) and toxicity to mostorganisms. They tend to adsorb toorganic carbon in suspended or bedsediments rather than dissolve in thewater column. Because of this characteristic, these compounds can bepresent in sediments in concentrationthat are much larger than those in thewater column. Sediments can providea mechanism by which organochlorinepesticides remain in a surface-watersystem many years after their initialintroduction and are available for
10 Water Quality in the Rio Grande
-
,
l
.
downstream transport and bioaccumu-lation in aquatic organisms.
Pesticides in Ground Water
During 1993-95, 65 wells that tapshallow ground water were sampled intwo agricultural land-use studies (table2). Eighteen wells had detectable pesti-cides, with 6 different pesticidesdetected a total of 23 times. Of the 24wells that represent urban land useoverlying shallow ground water, 8wells had detectable pesticides, with 5different pesticides detected a total ofnine times. The aquifer subunit survey,which sampled water from existingwells that are completed in the deeperaquifer, yielded only 1 pesticide detec-tion for 30 wells. The pesticidesdetected most often were prometon(12) and metolachlor (10) (table 2). Noconcentrations of pesticides exceededany EPA MCL or HA.
The small number of different pesti-cides detected and the small concentrtions of those pesticides indicate littleleaching of pesticides from land sur-face to shallow ground water in theseland-use areas. The detection of onlyone pesticide in the samples from theaquifer subunit survey suggests thatshallow ground water containing pesticides has not moved into deeper partsof the aquifer.
Pesticides in Surface Water
During 1994-95, 156 water sampleswere collected at 40 stream and drainsites to study the occurrence and seasonal variability of pesticides. Thesamples were collected as part of fouseparate study components (table 3).Collectively, 322 detections of 23 pes-ticides occurred in 125 of the 156 samples. The most commonly detectedpesticides were DCPA (65 samples),metolachlor (53), prometon (37), andsimazine (36). The pesticides detecte
Valley, Colorado, New Mexico, and Texas, 1992-95

MAJOR ISSUES AND FINDINGSOrganics in Ground Water, Surface Water, Bed Sediment, and Fish Tissue
-
r
s.
Table 3.—Surface-water pesticide study components
Study-Unitcomponent
Numberof sites
Number ofsamples
Number ofdetections
Mesilla Valley pesticidesynoptic study
19 51 100
Rincon Valley temporaldrain study
11 37 93
Basic Fixed Site study 9 45 120
Intensive Fixed Site study 1 23 9
Ground-water sampling at one of the monitoring wells in the San Luis Valley(photograph by Sherman R. Ellis, U.S. Geological Survey).
at the largest number of sites wereDCPA (25 sites), metolachlor (23),prometon (14), and carbofuran (14).The maximum pesticide concentrationdetected was an estimated 0.75 microgram per liter carbofuran. The pres-ence of pesticides in surface water iserratic and probably highly dependenton the amount applied and the timing,location, and method of application.
On the basis of data collected, pestcide concentrations are usually smalland do not presently appear to be amajor concern in the surface waters othe Rio Grande Valley. Table 4 lists theeight pesticides with the largest con-centrations; all but one site is locatedin the Rincon or Mesilla Valley. Ofthese pesticides, only carbofuran hasan established EPA MCL and it wasnot exceeded. No pesticide concentration exceeded EPA MCLs, HAs, or anyapplicable Federal or State ambientcriteria or exposure guidelines. Therelatively frequent detection of pesti-cides at low levels, however, indicatesongoing exposure that merits carefulmonitoring. Water-quality standardshave not been set for many pesticidesand existing standards do not considecumulative effects of several pesticidesin the water at the same time.
The pesticide synoptic study con-ducted in the Mesilla Valley enabled
-
i-
f
pesticide concentrations during theirrigation and the nonirrigation seasonsto be compared. There were moredetections of different pesticides dur-ing the nonirrigation season than dur-ing the irrigation season. The synopticstudy also allowed comparisonbetween urban contributions (samplesfrom wastewater-treatment plant efflu-ent) and agricultural contributions(drains). About one- fourth of the pes-ticide detections in the Mesilla Valleymay be from urban sources.
During the temporal study of drainsin the Rincon Valley, pesticides weredetected more frequently in drains inApril than in October or January. Also,
U.S. Ge
some pesticides were detected indrains but not in shallow ground water.This may mean that pesticides areentering drains as a result of surfacerunoff from fields or that the timing ofground-water sampling in the area(April-May) was not representative ofground-water quality throughout theyear.
Pesticides in Bed Sediment andWhole-Body Fish Tissue
As part of the pesticide sampling inthe Mesilla and Rincon Valleys, bedsediment also was sampled near themouths of nine drains. Samples of bedsediment from all nine drains con-tained detectable concentrations ofDDT, DDD, and DDE.
Bed sediment was sampled at 18sites between September 1992 andMarch 1993 to characterize the geo-graphic distribution of organochlorinepesticides and polychlorinated biphe-nyls (PCBs). Six of the bed-sedimentsamples had detectable concentrationof at least one DDT-related compoundNo other organochlorine pesticideswere reported in bed sediment.
As part of the whole-body fish-tis-sue contaminant study, fish were col-lected at 11 of the 18 bed-sedimentsites and analyzed for organochlorinepesticides and PCBs. Concentrationsof DDE were detected in compositedsamples of fish collected at 10 of the11 sites; these concentrations, how-ever, were below the median reported
ological Survey Circular 1162 11

MAJOR ISSUES AND FINDINGSOrganics in Ground Water, Surface Water, Bed Sediment, and Fish Tissue
r-
1Pesticide identified, but concentration was not determined at a 99-percent confidence level.
Table 4.—Eight largest pesticide concentrations detected in surface water [µg/L, micrograms per liter; MCL, U.S. Environmental Protection Agency maximum contaminant
level; E, estimated;1 --, no MCL; WWTP, wastewater-treatment plant]
PesticideConcentration
(µg/L)Date Location
MCL(µg/L)
Carbofuran E0.75 04/27/94 East Side Drain at levee road near Anthony, Tex. 40Metolachlor 0.41 01/04/95 Hatch Drain at Rio Grande, near Hatch, N. Mex. --DCPA 0.21 10/26/94 Rincon Drain at Rio Grande, near Rincon, N. Mex. --Diazinon 0.21 09/06/95 Santa Fe River above Cochiti Lake, N. Mex. --Chlorpyrifos 0.19 04/26/94 Las Cruces WWTP outflow at levee road, Las Cruces, N. Mex. --DCPA 0.17 04/22/94 Rincon Drain at Rio Grande, near Rincon, N. Mex. --Diazinon 0.16 04/28/94 Sunland Park WWTP at Sunland Park, N. Mex. --Carbofuran E0.15 04/20/94 Garfield Drain at Road 391, near Salem, N. Mex. 40
-
sh
by the FWS National ContaminantBiomonitoring Program. Cis-chlor-dane,trans-chlordane, andtrans-non-achlor were other compounds detectein whole-body samples of fish from atleast one site; these concentrations alswere below the median reported by theFWS National Contaminant Biomoni-toring Program.
Comparison of pesticide data forbed sediment and whole-body fish tis-sue indicates (1) organochlorine pesticides were reported more frequently infish samples and (2) more types of pesticides were detected in fish samples.The presence of DDT and its metabo-
12 Water Quality in the Rio Grand
A site in Elephant Butte Reservoir, oneof the Rio Grande, was cored for analySherman R. Ellis, U.S. Geological Surv
d
o
-
-
lites, DDD and DDE, in bed sedimentand whole-body fish confirms the persistence of this pesticide in the envi-ronment.
Pesticides in Elephant ButteReservoir Sediment Core
In July 1995, a site in ElephantButte Reservoir was cored and ana-lyzed for DDT metabolites (VanMetre and others, 1997). The core waage-dated by correlating sample deptwith the radioactive isotope cesium-137. Total DDT concentrations in thecore reached a maximum of about
e Valley, Colorado, New Mexico, and Te
d
o
-
- of four major reservoirs on the main stemsis of selected pesticides (photograph byey).
10.5µg/kg in sediments deposited inthe late 1960s, then decreased expo-nentially, indicating the gradualremoval of residual total DDT from thewatershed. The largest concentrationdetected in the core does not exceedsediment-quality guidelines publishedfor aquatic life (Environment Canada,1995, and Environmental ProtectionAgency, 1996b).
Volatile Organic Compoundsin Ground Water
Volatile organic compounds (VOCs)are carbon-containing chemicals thatreadily evaporate at normal air tempeature and pressure. They are containein many commercial products such asgasoline, paints, adhesives, solvents,wood preservatives, dry-cleaningagents, pesticides, fertilizers, cosmet-ics, and refrigerants. Some VOCs aresuspected carcinogens and are toxic thumans or wildlife.
Improper disposal of VOCs canresult in the leaching or infiltration ofthese compounds to the shallowground-water system. VOCs can alsobe removed from ground water byadsorption onto clays or organic materials, or they can be broken down bybacteria and other microbes in soils.The detection of VOCs in groundwater indicates compounds generallyassociated with human activities leaching into ground water.
xas, 1992-95

MAJOR ISSUES AND FINDINGSOrganics in Ground Water, Surface Water, Bed Sediment, and Fish Tissue
t
-
Table 5.—Volatile organic compounds detected inshallow ground water
[µg/L, micrograms per liter; MCL, U.S. Environmental Protection Agencymaximum contaminant level; HA, U.S. Environmental Protection Agencylifetime health advisory; --, no MCL or HA]
Volatile organiccompound
Number ofdetections
Detectionconcentration
(µg/L)
MCL(µg/L)
HA(µg/L)
San Luis Valley agricultural land-use study (35 samples)
Methyl tert-butyl ether 1 0.6 -- 20 - 200
Albuquerque urban land-use study (24 samples)
Methyl tert-butyl ether 1 7.9 -- 20 - 200Trichloroethene 1 1.1 5.0 --1,1-Dichloroethane 2 0.2 - 0.5 -- --p-Isopropyltoluene 1 0.4 -- --cis-1,2-Dichloroethene 2 0.3 70 --
Rincon Valley agricultural land-use study (20 samples)
Xylene 3 0.3 - 2.8 10,000 10,000
Samples were collected from 79shallow wells and 30 deeper wells foranalysis of 60 VOCs. No concentra-tions exceeded an EPA MCL or HA(table 5).
Water from 9 of the 79 wells sam-pled had detectable concentrations ofone or more VOCs. In the Albuquer-que urban land-use study, five differentVOCs, two of which were found inmore than one sample, were detectedin water from 5 of the 24 shallow wells(table 5). Four of the VOCs detectedare solvents or metal degreasers. Theother is methyltert-butyl ether(MTBE), a gasoline additive that wasdetected at a concentration of 7.9µg/L,which was the largest VOC concentra-tion measured in the Study Unit. In theRincon Valley agricultural land-usestudy, only one VOC, xylene, wasdetected in 3 of 20 samples. In the SanLuis Valley agricultural land-use study,MTBE was detected in one well.
Although few VOCs were detectedand the concentrations were relativelysmall, their presence in shallow groundwater means that shallow ground-water quality has been adverselyaffected by human activities. VOCswere detected more frequently in the
Albuquerque urban land-use studythan in the agricultural land-use stud-ies, perhaps because urban areas havmore sources of VOCs.
The wells sampled in the aquifersubunit survey had no VOC detectionsThis may mean that VOCs have notmoved into deeper parts of the aquife
Semivolatile OrganicCompounds in Bed Sediment
Semivolatile organic compounds area large group of environmentallyimportant organic compounds. Threegroups of compounds, polycyclic aro-matic hydrocarbons (PAHs), phenols,and phthalate esters, were included inthe analysis of bed sediment collectedat 17 sites in the Study Unit. Thesecompounds are abundant in the envi-ronment, are toxic and often carcino-genic to organisms, and couldrepresent a long-term source of con-tamination.
The analysis of the PAH data showone or more PAH compounds weredetected at 14 sites. Four of these sitehad about 60 percent of the detectionsthree sites had no detections. Two ofthe four sites are downstream fromurban land-use areas, one is down-
U.S. Ge
e
.
r.
s;
stream from a mining area, and one isin a forested area.
Phenol compounds were detected a13 sites with 50 percent of the detec-tions at 5 sites. Two sites had no detections. No relation to land use wasapparent for the phenol compounddetections.
Four phthalate ester compoundswere detected at 10 sites. Only onesite, downstream from an urban land-use area, had detections of more thanone phthalate ester.
ological Survey Circular 1162 13

MAJOR ISSUES AND FINDINGSNutrients in Ground Water and Surface Water
n--
-
r
-
-
-
Table 6.—Nitrate detected in ground water [mg/L, milligrams per liter; <, less than]
Ground-water studycomponent
Number ofsamples
Range inconcentration
(mg/L)
Median(mg/L)
San Luis Valley agriculturalland-use study
35 <0.05 - 58 2.7
Albuquerque urban land-usestudy
24 <0.05 - 2.8 <0.05
Rincon Valley agriculturalland-use study
30 <0.05 - 33 0.48
Aquifer subunit survey 30 <0.05 - 1.9 <0.05
Nutrients include nitrogen andphosphorus compounds that are necesary components for the growth ofplants and animals. However, in excessive concentrations, nutrients are awater-quality concern in drinkingwater and are a major contributor toeutrophication in rivers, lakes, and reservoirs. Large nutrient concentrationscan contribute to excessive growth ofalgae and other aquatic plants that cacause destruction of habitat and depletion of dissolved oxygen, which usu-ally results in the disappearance ofintolerant aquatic insect species andfish. Major sources of nutrients are fertilizers, sewage effluent, precipitation,and dissolution of naturally occurringminerals (Mueller and Helsel, 1996, p.10). Fertilizers, which include com-mercial fertilizers and animal manure,are applied in urban and agriculturalareas. Sewage effluent includes muniipal WWTP discharge to streams andwastewater from septic tanks or cess-pools. An estimate of nutrient loads tothe entire Study Unit indicated thatloading from fertilizers and WWTPeffluent is considerably larger thanloading from precipitation (Anderholmand others, 1995, p. 127). As a resultof human activities in the Rio GrandeValley Study Unit, nutrient concentra-tions in both ground water and surfacewater have exceeded established Federal and State standards.
The EPA has established an MCLfor nitrate in drinking water of 10 mil-ligrams per liter (mg/L) as nitrogen.The EPA recommends that total (notdissolved) phosphorus concentrationsshould be less than 0.1 mg/L in riversand less than 0.05 mg/L where riversenter lakes and reservoirs because cocentrations greater than this could contribute to eutrophication. The States ofColorado, New Mexico, and Texashave also established individualaquatic-life criteria for selected nutri-ents that apply to specific river reacheswithin the Study Unit.
14 Water Quality in the Rio Grande
s-
-
-
n-
-
c-
-
Nutrients in Ground WaterIn the San Luis Valley agricultural
land-use study, water from 11 of the 35wells sampled contained nitrate con-centrations greater than the EPA MCL;the largest concentration was 58 mg/L(table 6). In the Rincon Valley agricul-tural land-use study, water from 5 ofthe 30 wells sampled exceeded theEPA MCL; the largest concentrationwas 33 mg/L. These elevated nitrateconcentrations are indicative of leach-ing of fertilizers into shallow groundwater. However, the spatial variation innitrate concentrations indicates thatleaching of fertilizer is not uniformthroughout these areas. The spatialvariation may be the result of variablefertilizer application rates, timing offertilizer application, timing of appli-cation of irrigation water, and rechargerates controlled by soil type, texture,permeability, precipitation, and biolog-ical/geochemical processes in theunsaturated zone.
In the Albuquerque urban land-usestudy, the largest nitrate concentrationwas 2.8 mg/L, which is considerablybelow the EPA MCL. Although infil-tration of septic tank effluent results inconsiderable loading of nutrients to theshallow aquifer in this area, the smallnitrate concentrations suggest thatnitrogen compounds in the effluent arenot being converted to nitrate. This isprobably due to the lack of dissolvedoxygen and the relatively large dis-solved organic carbon concentrations
in shallow ground water in the area.Large ammonia concentrations, whichwould be expected, are not present inshallow ground water because ammonia is adsorbed on clays in the aquiferor soil zone.
Nitrate concentrations in water fromdeep wells sampled during the aquifesubunit survey ranged from less than0.05 to 1.9 mg/L. Throughout most ofthe area of the aquifer subunit survey,the small nitrate concentrations inwater from deeper parts of the basin-fill aquifers probably indicate thatshallow ground-water recharge into thedeeper parts of the aquifer is limited.
Nutrients in Surface Water
Dissolved Nutrients
Dissolved nutrient concentrationsare shown in Table 7. The largest concentrations of dissolved nutrients insurface water were detected at sitesdownstream from urban land use. Generally, a WWTP was associated withthe urban area and was locatedupstream from the sampling site. Ingeneral, dissolved nutrient concentra-tions were larger at Basic Fixed Sitesdownstream from Cochiti Lake. This isprobably the result of the increase inurban land use along the Rio Grandeand the associated WWTPs.
Dissolved nutrient concentrations inagricultural drains in the Mesilla andRincon Valleys were small. These concentrations could be small because of
Valley, Colorado, New Mexico, and Texas, 1992-95

MAJOR ISSUES AND FINDINGSNutrients in Ground Water and Surface Water
-
s
a
a-
-
t-
Table 7—Nutrients detected in surface water[mg/L, milligrams per lite; <, less than]
NutrientNumber ofanalyses
Range inconcentration,
(mg/L)
Median(mg/L)
Nitrite, dissolved 584 <0.01 - 1.2 <0.01
Nitrite plus nitrate,dissolved
582 <0.05 - 15 0.11
Ammonia, dissolved 584 <0.015 - 27 0.02
Ammonia plus organicnitrogen, dissolved
566 <0.2 - 29 0.2
Ammonia plus organicnitrogen, total
556 <0.2 - 57 0.3
Phosphorus, dissolved 579 <0.01 - 3.9 0.03
Phosphorus, total 555 <0.01 - 45 0.08
Orthophosphate,dissolved
577 <0.01 - 3.4 0.03
Wastewater-treatment plants affect nutrient concentrations in the Rio Grande(photograph by Sherman R. Ellis, U.S. Geological Survey).
biological uptake of nutrients and nowidespread excessive nitrate concen-trations in ground water that is dis-charging to drains. Comparison of datafor the Mesilla Valley synoptic studyshows that the inflow of nutrient loadsto the Rio Grande from urban sources(WWTPs) may equal or exceed theinflow from agricultural sources(drains).
Of 455 samples at sites whereaquatic-life criteria apply, un-ionizedammonia concentrations exceeded thapplicable criterion only twice. Noother dissolved nutrient concentrationin surface water exceeded any applicable Federal or State criterion or stan-dard.
The EPA has recommended totalphosphorus concentrations for streamnot discharging to a lake and forstreams near where they discharge tolake. These recommendations are notcriteria or standards. Out of 526 sam-ples from these sites, 250 equaled orexceeded the recommended concentrtions.
Total Nutrients
Total nutrient concentration in sur-face water is affected significantly bysuspended-sediment concentration
e
because nutrients adsorb to suspendesediment and are transported by wateThe largest concentrations of totalnutrients were detected at the BasicFixed Site on the Rio Puerco (fig. 2)and were associated with runoff fromsummer thunderstorms, which histori-cally have transported large loads ofsuspended sediment.
Approximately 35 percent of thesamples from the Basic Fixed Siteshave total phosphorus and total nitro-
U.S. Ge
dr.
gen concentrations in the eutrophic orhighly eutrophic range of most trophicclassification systems. Among theenvironmental effects of eutrophica-tion are large diurnal dissolved-oxygen(DO) fluctuations. In addition, thedecay of large amounts of dead vegetation puts a demand upon available DOconcentrations. During this study, DOconcentrations less than the EPA rec-ommended minimum ambient crite-rion of 5 mg/L for the health of anaquatic ecosystem were detected lessthan 7 percent of the time at sites inColorado.
Nutrients in Reservoirs
The effect that reservoirs can haveon water quality is evident when dis-solved and total nutrient concentra-tions are compared at sites upstreamand downstream from reservoirs.Although not directly addressed duringthis study, historical data for sites onthe Rio Grande show nutrient concen-trations in water decreasing signifi-cantly while stored in reservoirs(Anderholm and others, 1995). Thedecrease downstream from reservoirsis attributed to biological uptake ofnutrients and suspended sediment setling out of the water column.
ological Survey Circular 1162 15

MAJOR ISSUES AND FINDINGSRadon in Ground Water and Dissolved Solids in Surface Water
-
.
-
-
Radon in Ground Water
Radon, which can cause lung can-cer, is a radioactive, odorless, andchemically inert gas that occurs natu-rally in the air, soil, and ground water.Radon is a decay product of radium,which in turn is a decay product of ura-nium. Rocks break down mechanicallyand chemically to form sediments thatcontain differing amounts of uranium,depending on the source rocks. Thehigher the uranium concentration is inthe source rocks, the greater thechances are for radon in the air, soil, orground water. Other potential sourcesof uranium in the environment areimproper disposal of uranium miningwaste and nuclear fuel processing,combustion of wood and fossil fuels,or roasting of rocks in metal extractionor cement industries.
Radon in ground water affects radonconcentrations in indoor air in homesbecause it escapes to the indoor air aspeople use water. Open water-distribu-tion systems allow ground water toaerate and radon to escape. In small,closed water-distribution systems withshort transit times, radon cannotescape from the system; therefore, itescapes into the indoor air. Researchsuggests that ingestion of water withhigh radon concentrations also maypose risks, although these risks arebelieved to be much lower than thosefrom inhalation of radon.
Until late 1996, the EPA had pro-posed an MCL of 300 pCi/L for radonin drinking water. However, this pro-posed MCL was withdrawn by EPAfor further evaluation; thus, no pro-posed MCL currently exists. Radonconcentrations measured during thisstudy were larger than the previouslyproposed MCL in 57 percent of thewells.
Radon concentrations were equal toor greater than 512 pCi/L in waterfrom all shallow wells sampled in theSan Luis Valley land-use study (table8). Although the range in concentra-tion is not as large in the Albuquerqueland-use study, values for seven sam-ples were greater than 300 pCi/L. Inthe Rincon Valley land-use study, onlythree samples exceeded 300 pCi/L.The largest range in concentration wasfrom the aquifer subunit survey (table8), which also had the largest radonconcentration measured, 2,300 pCi/L.More than one-half the wells sampledfrom the deeper aquifer have waterwith a radon concentration greater than300 pCi/L.
On the basis of these reported con-centrations, it is apparent that radon inboth shallow and deeper ground wateis a potential human health concern.The likely source for the elevated concentrations of dissolved radon inground water is from naturally occur-ring minerals that contain uranium in
16 Water Quality in the Rio Grande Valley, Colorado, New Mexico, and Te
d
1
-
Table 8.—Radon detected in ground water [pCi/L, picocuries per liter]
Ground-water study componentNumber ofdetections
Range inconcentration
(pCi/L)
Median(pCi/L)
San Luis Valley agriculturalland-use study (29 samples)
29 512 - 1,798 1,190
Albuquerque urban land-usestudy (22 samples)
22 198 - 397 280
Rincon Valley agricultural land-use study (18 samples)
18 210 - 440 260
Aquifer subunit survey (29samples)
29 190 - 2,300 380
r
-
the sediments that compose the aqui-fer. There is no direct evidence thatland use has affected radon concentrations in shallow ground water in theStudy Unit.
Dissolved Solids in SurfaceWater
A knowledge of the dissolved-solidsconcentration in irrigation water canbe useful to water users in determiningapplication rates for different soil andcrop types and drainage requirementsDissolved-solids concentration is ameasure of the dissolved constituentsin water and is commonly used as ageneral indicator of salinity or waterquality. Although dissolved-solidsconcentration has an important effecton the use of irrigation water, there isno Federal or State standard.
Evaporation, transpiration, and dis-solution of minerals are the threemajor processes that result in anincrease of dissolved-solids concentration. All of these processes are majorcontributors to the increases in dis-solved solids measured in the StudyUnit.
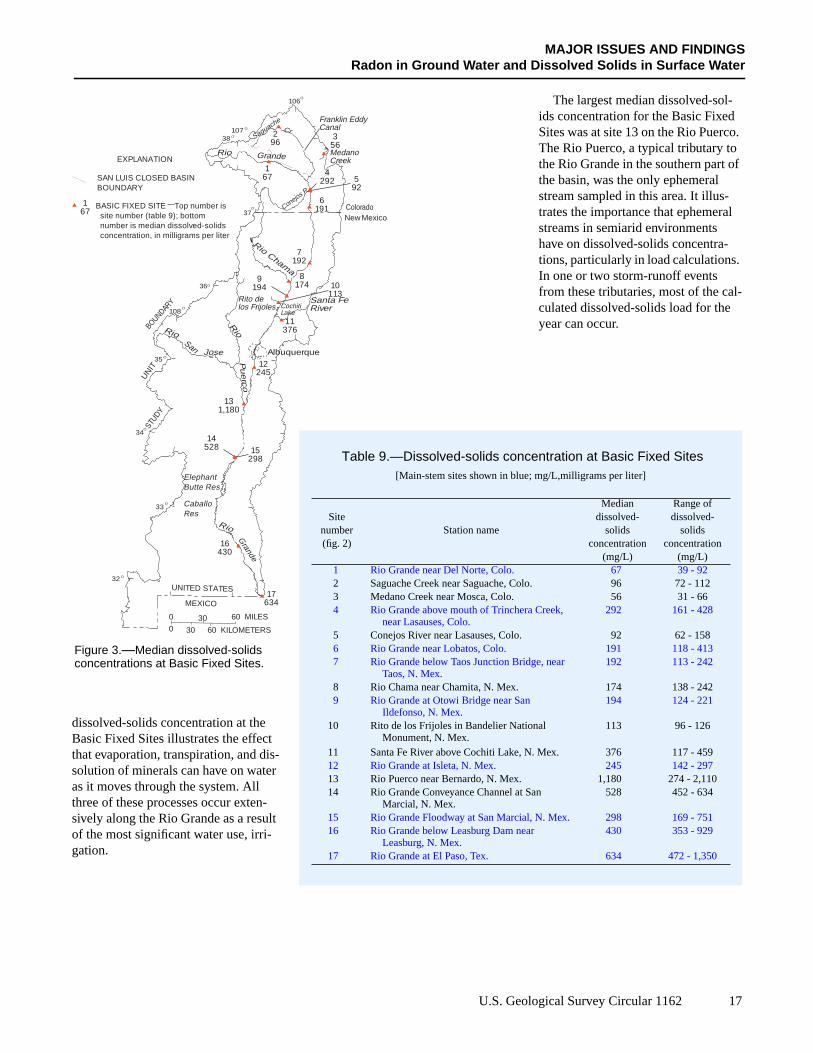
In general, the dissolved-solids concentration in surface water increaseswith the length of time that the waterhas been in the hydrologic system.This is illustrated by data from theBasic-Fixed-Site network. The smallerdissolved-solids concentrations are inthe northern part of the study area angenerally represent runoff derivedfrom snowmelt or water that has beensubjected to limited irrigation use (fig.3 and table 9). The median dissolved-solids concentration for main-stemsites increases downstream from siteto site 17, with the exception of site 4(sites are highlighted in blue in table9). The cause of the anomalously highmedian concentration at site 4 isunknown. Possible causes are groundwater recharge to the Rio Grande,introduction of ground water pumpedfrom the sump area of the ClosedBasin, or discharge from the AlamosaWWTP. The downstream increase in
xas, 1992-95
MAJOR ISSUES AND FINDINGSRadon in Ground Water and Dissolved Solids in Surface Water
0 30 60 MILES
0 30 60 KILOMETERS
Rio
Puerco
Rio
Jose
Rio Chama
Santa FeRiver
37
UN
ITST
UDY
BOUNDARY
Colorado
106
32
New Mexico
Rio
33
34
35
36
10738
108
Grande
Rio
San
MEXICO
UNITED STATES
Albuquerque
CrSaguach
e
MedanoCreek
Grande
15298
17634
16430
14528
131,180
12245
11376
10113
9194
8174
7192
6191
592
4292
356
296
167
167
ElephantButte Res
CaballoRes
Conejos R
Rito de los Frijoles Cochiti
Lake
BASIC FIXED SITE Top number issite number (table 9); bottomnumber is median dissolved-solidsconcentration, in milligrams per liter
SAN LUIS CLOSED BASINBOUNDARY
Franklin EddyCanal
EXPLANATION
Figure 3.—Median dissolved-solidsconcentrations at Basic Fixed Sites.
-
t
Table 9.—Dissolved-solids concentration at Basic Fixed Sites[Main-stem sites shown in blue; mg/L,milligrams per liter]
Sitenumber(fig. 2)
Station name
Mediandissolved-
solidsconcentration
(mg/L)
Range ofdissolved-
solidsconcentration
(mg/L)1 Rio Grande near Del Norte, Colo. 67 39 - 922 Saguache Creek near Saguache, Colo. 96 72 - 1123 Medano Creek near Mosca, Colo. 56 31 - 664 Rio Grande above mouth of Trinchera Creek,
near Lasauses, Colo.292 161 - 428
5 Conejos River near Lasauses, Colo. 92 62 - 1586 Rio Grande near Lobatos, Colo. 191 118 - 4137 Rio Grande below Taos Junction Bridge, near
Taos, N. Mex.192 113 - 242
8 Rio Chama near Chamita, N. Mex. 174 138 - 2429 Rio Grande at Otowi Bridge near San
Ildefonso, N. Mex.194 124 - 221
10 Rito de los Frijoles in Bandelier NationalMonument, N. Mex.
113 96 - 126
11 Santa Fe River above Cochiti Lake, N. Mex. 376 117 - 45912 Rio Grande at Isleta, N. Mex. 245 142 - 29713 Rio Puerco near Bernardo, N. Mex. 1,180 274 - 2,11014 Rio Grande Conveyance Channel at San
Marcial, N. Mex.528 452 - 634
15 Rio Grande Floodway at San Marcial, N. Mex. 298 169 - 75116 Rio Grande below Leasburg Dam near
Leasburg, N. Mex.430 353 - 929
17 Rio Grande at El Paso, Tex. 634 472 - 1,350
.
l-
dissolved-solids concentration at theBasic Fixed Sites illustrates the effectthat evaporation, transpiration, and dissolution of minerals can have on wateras it moves through the system. Allthree of these processes occur exten-sively along the Rio Grande as a resulof the most significant water use, irri-gation.
U.S. Geo
The largest median dissolved-sol-ids concentration for the Basic FixedSites was at site 13 on the Rio PuercoThe Rio Puerco, a typical tributary tothe Rio Grande in the southern part ofthe basin, was the only ephemeralstream sampled in this area. It illus-trates the importance that ephemeralstreams in semiarid environmentshave on dissolved-solids concentra-tions, particularly in load calculations.In one or two storm-runoff eventsfrom these tributaries, most of the caculated dissolved-solids load for theyear can occur.
logical Survey Circular 1162 17

MAJOR ISSUES AND FINDINGSTrace Elements
-
.
n
-
lr
i-
.
Table 10.—Trace elements in ground water that exceed U.S.Environmental Protection Agency standards or guidelines
[µg/L, micrograms per liter; MCL, U.S. Environmental Protection Agency(EPA) maximum contaminant level; SMCL, EPA secondary maximumcontaminant level; HA, EPA lifetime health advisory; --, no data]
Traceelement
Number ofwells
sampled
Number ofdetections
Detectionconcentration
(µg/L)
ProposedMCL(µg/L)
SMCL(µg/L)
HA(µg/L)
San Luis Valley agricultural land-use studyUranium 35 5 23 - 84 20 -- --Manganese 35 6 69 - 682 -- 50 --Molybdenum 35 1 52 -- -- 40
Albuquerque urban land-use studyUranium 24 5 21 - 89 20 -- --Iron 24 7 340 - 3,800 -- 300 --Manganese 24 21 130 - 3,600 -- 50 --
Rincon Valley agricultural land-use studyUranium 30 4 26 - 62 20 -- --Iron 30 5 980 - 1,900 -- 300 --Manganese 30 25 77 - 2,130 -- 50 --
Aquifer subunit surveyUranium 30 1 102 20 -- --Iron 30 2 360 - 550 -- 300 --Manganese 30 10 58 - 654 -- 50 --Molybdenum 30 1 59 -- -- 40
Many trace elements are essentialnutrients; however, certain trace ele-ments such as arsenic, cadmium, andmercury are known to be persistentenvironmental contaminants and toxicto most forms of life (Schmitt andBrumbaugh, 1990). Trace elements argenerally present in small concentra-tions in natural water systems. Theiroccurrence in ground and surfacewater can be due to natural sourcessuch as dissolution of naturally occur-ring minerals containing trace ele-ments in the soil zone or the aquifermaterial or to human activities such asmining, application of pesticides,burning of fossil fuels, smelting ofores, and improper disposal of indus-trial wastes.
The EPA has established primaryand secondary MCLs, HAs, and issuedguidelines for the establishment ofaquatic-life criteria as they apply totrace elements. The States of Colo-rado, New Mexico, and Texas havealso established individual aquatic-lifecriteria for selected trace elements thaapply to specific river reaches withinthe Study Unit. Acute exposure (shortterm, high concentration) to certainmetals can kill organisms directly,whereas chronic exposure (long term,low concentration) can result in eithermortality or nonlethal effects such asstunted growth, reduced reproductivesuccess, deformities, or lesions.
Trace Elements in GroundWater
During 1992-95, ground-water samples were collected for analysis oftrace elements during three land-usestudies and the aquifer subunit surveyMost trace-element concentrations inground water ranged from less than 1to 10 micrograms per liter (µg/L).Only four trace elements exceededEPA MCLs, SMCLs, or HAs (table10). Uranium concentrations in waterfrom 15 of 119 wells exceeded theEPA-proposed MCL of 20µg/L (U.S.Environmental Protection Agency,1996a). Water from two wells
18 Water Quality in the Rio Grande
e
t
exceeded the EPA HA of 40µg/L formolybdenum. The relatively low num-ber of detections and small concentra-tions of most trace elements indicatethat they are influenced more by natu-ral processes and less by land use.
Two trace elements that consistentlyexceeded SMCLs were manganese andiron, which can stain plumbing fixturesor impart a metallic taste to the water.Manganese concentrations in waterfrom 62 wells and iron concentrationsin water from 14 wells exceeded EPASMCLs. Large manganese and ironconcentrations are often associatedwith small dissolved-oxygen concen-trations. Where oxygen has been con-sumed, microorganisms will reducemanganese and iron, resulting in largeconcentrations. This commonly occursin areas of septic-system effluent dis-charge.
On the basis of analysis of the spa-tial distribution and range of trace-element concentrations (table 10),human activities have not caused wide-spread trace-element contamination inground water. The majority of traceelements detected are likely the result
of dissolution of naturally occurringminerals in the aquifer.
Trace Elements in theSurface-Water Environment
Since the late 1800’s, mining activi-ties have been prevalent in the northerpart of the Study Unit in Colorado andNew Mexico. Most mining activitieshave ceased, and several areas are invarious stages of remediation. To document the surface-water quality in andimmediately adjacent to the RioGrande, a synoptic study focusing ontrace elements in the water column,suspended sediment, and bed materiawas conducted in June and Septembe1994. In January 1995, selected traceelements were analyzed in samplescollected in the Mesilla and RinconValleys as part of a pesticide and nutrent synoptic study.
Water column
Analysis of trace-element data col-lected in the northern part of the studyarea confirmed previous study resultsModerately to highly elevated trace-
Valley, Colorado, New Mexico, and Texas, 1992-95

MAJOR ISSUES AND FINDINGSTrace Elements
.
f
-
-
l-l
-
-
-
element concentrations were detectedin the Creede, Colorado, and RedRiver, New Mexico, mining areas andin the Alamosa River, which drains amining area and also contains severalareas of naturally occurring mineralsthat contribute trace elements to thewater column.
For the entire reach of the RioGrande sampled in 1994, the largestconcentrations of dissolved antimony,beryllium, cadmium, cobalt, copper,iron, lead, mercury, nickel, silver, andzinc were detected at sites downstreamfrom areas of known mineral extrac-tion. Dissolved concentrations ofberyllium, cadmium, cobalt, lithium,manganese, molybdenum, nickel, andzinc were moderately higher at a siteon the lower Red River than in the RioGrande downstream of its confluence.At the site on the Alamosa River whereit enters the San Luis Valley, highlyelevated concentrations of dissolvedcadmium, cobalt, copper, iron, manga-nese, nickel, strontium, uranium, andvanadium were detected.
The largest concentrations of dis-solved arsenic, barium, boron, chro-mium, lithium, molybdenum, anduranium were detected at sites in theMesilla and Rincon Valleys. The ele-vated concentrations of these trace ele-ments may be related to dischargesfrom geothermal springs, the returnflow of irrigation water, or urban land-use discharges.
Concentrations of dissolved cad-mium, copper, manganese, iron, sil-ver, and zinc in the water columnexceeded the following applicablestandards at one or more sites. Dis-solved concentrations of cadmium,copper, iron, and zinc exceeded theColorado chronic aquatic-life standard(Colorado Water Quality ControlCommission, 1989) at the site on theAlamosa River and dissolved silverconcentrations exceeded the Coloradochronic aquatic-life standard for troutat four sites in Colorado . The copperconcentration at one site on the RedRiver exceeded the New Mexico cold-
water fishery chronic standard (NewMexico Water Quality Control Com-mission, 1991).
Bed sediment
Bed-sediment samples were col-lected to characterize the occurrenceand distribution of trace elements inthe Study Unit. Because of the largeareal extent of naturally occurringmineralized areas in the Study Unit,particularly in the northern one-third,the source of trace-element concentra-tions detected in bed-sediment samplesmay be natural rather than anthropo-genic.
Trace-element concentrations in bedsediment closely reflect the same pat-tern as water-column concentrations.Highly elevated concentrations of anti-mony, arsenic, cadmium, copper, lead,mercury, silver, and zinc were detectedin bed-sediment material from WillowCreek and the Rio Grande downstreamfrom the Creede mining area comparedto the rest of the study area. Concentra-tions of these elements in samplesfrom the Alamosa River and Red Riverareas were elevated compared with therest of the study area. At present, noFederal or State guidelines have beenestablished for trace-element concen-trations in bed sediment.
Fish tissue (liver)
As part of the fish-tissue contami-nant study, fish were collected at 12sites and their livers analyzed for trace-elements. The bioavailability of traceelements is an important factor inassessing threats to aquatic organisms,ecosystems, and public health. As withwater-column and bed-sediment sam-ples, the sample from the Rio Grandenear Creede contained elevated con-centrations of arsenic, cadmium, cop-per, lead, and zinc. Some traceelements were detected at higher con-centrations in liver samples than inbed-sediment samples from the samesite.
Accumulation of trace elements byfish appears to be species dependentZinc concentrations in liver samples ofcommon carp liver at certain sites werethree to four times those in samples owhite sucker at other sites. A browntrout sample contained significantlyhigher concentrations of arsenic, cop-per, mercury, and selenium than allother fish samples. To differentiatebetween environmental and species-dependent factors, however, the collection of multiple species at a number ofindividual sites would be necessary.
Bryophytes (moss)
Transplanted bryophytes (moss)were used to determine the spatial distribution of trace elements in relationto land-use practices, compare accu-mulation rates of trace elements inbryophytes at sites known to be con-taminated by trace elements, and evauate transplanted bryophytes as a toofor examining the bioavailability oftrace elements in relation to concentrations in water and bed sediment.
Thirteen sites on the Rio Grandeand tributary streams in southern Colorado and northern New Mexico weresampled for determination of 12 traceelements in transplanted bryophytes.Analysis of the data indicates that (1)concentrations of cadmium, copper,lead, and zinc in bryophytes increasedat sites on the Rio Grande immediatelydownstream from tributaries that drainthe mining districts, (2) concentrationsof these metals in bryophytesdecreased with distance from the tributaries, and (3) concentrations of mosttrace elements in bryophytes werelower in a tributary stream downstreamfrom an urban area than at sites nearmining or agricultural land use.
U.S. Geological Survey Circular 1162 19

MAJOR ISSUES AND FINDINGSFish Communities and Stream Habitat
t
-d
l
t--
l
d
Fish communities and stream habi-tat (instream and riparian) wereassessed at selected sites in three majorphysiographic provinces and three offour ecoregions of the Rio Grande Val-ley Study Unit. The structure of a com-munity can be influenced by naturaland human changes to physical andchemical characteristics of the stream.A stream reach, or section of stream,was selected to assess fish communi-ties and stream habitat that best repre-sented the condition of a longer riversegment. This allows for an integratedapproach to characterizing surface-water quality. A combination of quali-tative and quantitative sampling meth-ods was used to determine the speciespresent in a reach and to provide ameasure of structure, which can beexpressed in a variety of ways includ-ing species richness, relative abun-dance, trophic complexity, native/non-native composition, and tolerance tohuman disturbance. Samples of fishwere collected primarily during thesummer low-flow period in 1993-95.These samples, in addition to morethan 30 instream and riparian charac-teristics of stream habitat (includingstream modification, bank erosion,bank vegetation stability, and riparianvegetation density) were used todescribe water-quality conditions.
Fish Communities
Fish communities were assessed at10 sites in the Study Unit. In 25 sam-ples, 29 species representing 10 fami-lies were identified. Species richnessranged from 1 to 13. Species richnesswas lowest at Medano Creek nearMosca, Colorado, where the ColoradoDivision of Wildlife removed all otherspecies from the stream in an effort toreintroduce the Rio Grande cutthroattrout. Species richness increaseddownstream with increasing contribut-ing drainage area; the Rio Grande at ElPaso site had the most species. Warm-water fisheries generally support morespecies than cold-water fisheries; how-ever, the site at El Paso may have themost species because it is downstream
from a very large warm-water reser-voir which could provide seed popula-tions that are present downstream.
Fish, which are relatively long livedand can travel long distances, integratewater-quality conditions over a longerperiod of time and at a relatively largerspatial scale than algae and benthicinvertebrates. Four indicators of bioticintegrity (percentages of introducedspecies, omnivores, tolerant species,and anomalies) were used to provide abroad overview of the fish communitystructure.
At sites sampled during this study,13 native and 16 introduced species offish were identified. Introduced fishspecies predominate at four of six sitessampled in 1994, probably because ofstocking of some of these fish species.The dominance of omnivores in sam-ples from the Rio Grande below TaosJunction Bridge, Rio Chama nearChamita, Rio Grande at Isleta, and RioGrande at El Paso (fig. 2) can be anindication of environmental stress atthese sites. However, omnivores canalso be an indication of increasingstream size. In 1994, tolerant speciesaccounted for the entire fish commu-nity at Rio Grande at Isleta.
The occurrence of external anoma-lies on all fish samples was less than 2percent except for the sample from RioGrande at Isleta, which was 14 per-cent. Based on the relative percentagesof introduced, omnivorous, tolerantfish and the number of fish with exter-nal anomalies, six of the sampled sitesappear to show some indications ofenvironmental perturbation. The bioticintegrity at the Rio Grande at Isleta siteappears to be the most impaired of allsites.
In 1995, fish communities weresampled in three separate reaches inboth the Santa Fe River above CochitiLake and the Rio Grande near Isletasites to assess small-scale spatial pat-terns in the structure of fish communi-ties among the reaches at each site andto determine the influence of physicaland chemical characteristics of each
reach on the fish communities of eachstream. The fish communities showedsome variability among reaches at bothof these sites. The variability in thespatial pattern at both sites might bebecause of natural variability; how-ever, at the Santa Fe River site, thevariability also could be related to thepresence or absence of such importanhabitat features as shallow pools. Thestream physical or chemical characteristics among each reach at each site dinot seem to influence the spatial pat-tern of fish communities. No signifi-cant correlation existed between fishcommunities at each reach and eitherthe physical variables (such as channewidth, depth, and substrate composi-tion) or the chemical variables (such aswater temperature, DO, and specificconductance).
The relative abundance of fish spe-cies and the total number of individu-als varied in samples collected at sitessampled annually. All sites, except forRio Grande near Del Norte, had adecline in the total number of individu-als in a sample from 1993 to 1995.This temporal decline also could becaused by natural variability within thefish community or some artifact ofsampling.
Stream HabitatStream habitat characteristics are
used to describe the environmental seting at sites selected for ecological surveys. At the spatial scales of basin,stream segment, stream reach, andmicrohabitat, physical characteristicsof streams strongly influence waterquality and the capacity of a stream tosupport healthy biological communi-ties. Basin factors, such as physio-graphic province, ecoregion, andclimate, can be used to evaluate naturainfluence on biological communities.Stream segments are a more discreteunit that should have relatively homo-geneous physical, chemical, and bio-logical characteristics. Within a streamsegment, a stream reach was selectefor an intensive site evaluation. Micro-habitat features, such as macrophyte
20 Water Quality in the Rio Grande Valley, Colorado, New Mexico, and Texas, 1992-95

MAJOR ISSUES AND FINDINGSFish Communities and Stream Habitat
--
,
-
;
r
,
e
Stream habitat changes significantly from the upper to the lower part of the basin.Top photograph is Rio Grande near Del Norte, Colorado; lower photograph is RioGrande at El Paso, Texas (photographs by Lisa F. Carter, U.S. Geological Survey).
beds, woody debris, and bed substratealso were evaluated within each streamreach. The presence or absence of diferent biological communities atStudy-Unit sites is influenced to vary-ing degrees by the environmental set-ting at a particular site. For instance,fish communities are more influencedby climate, which is considered a basinfactor, than by specific microhabitatconditions.
Principal component analysis wasused to determine the overall variancein the combination of various streamhabitat characteristics. Physiographicprovince and ecoregion were the physical variables that explained most variance among sites. Physiographicprovinces are distinct areas that havecommon topography, rock types andstructure, and geologic and geomor-phic history. Ecoregions are relativelyhomogeneous ecological regions andare classified by spatially variablecombinations of geomorphology, soils,physiography, land use and land coverand potential natural vegetation.Because a combination of physicalvariables define both physiographicprovince and ecoregion, most varianceamong sites is explained by these twohabitat characteristics.
A habitat degradation index alsowas used to describe the physical condition of the sites selected for ecologi-cal surveys. The index included fourhabitat characteristics: stream modifi-cation, bank erosion, bank vegetationstability, and riparian vegetation den-sity. Use of these four habitat charac-teristics revealed that 6 of 10 sitessampled appear to have significanthabitat degradation. These sites areRio Grande near Del Norte, ColoradoConejos River near Lasauses, Colo-rado; Rio Chama near Chamita, NewMexico; Santa Fe River above CochitiLake, New Mexico; Rio Grande atIsleta, New Mexico; and Rio Grande atEl Paso, Texas. Saguache Creek neaSaguache, Colorado; Medano Creeknear Mosca, Colorado; and Rio Grandebelow Taos Junction Bridge near Taos
,
f-
New Mexico, were sites that havemoderate to minimal habitat degrada-tion. Rito de los Frijoles in BandelierNational Monument, New Mexico,was the only site that had minimal hab-
itat degradation. The habitat at Rito delos Frijoles was characterized by nostream modification, very little bankerosion, highly stable banks, and densriparian vegetation.
U.S. Geological Survey Circular 1162 21

22 Water Quality in the Rio Grande Valley, Colorado, New Mexico, and Texas, 1992-95
Nutrient concentrationsdownstream from urbanareas and in a sediment-laden tributary wereamong the highest in theNation. The impact ofreservoirs on reducingnutrient concentrationsis shown by the reducedconcentrations at the twolower sites.
Pesticide concentrationsin surface water rankedamong the lowest of allNAWQA sites nation-wide. Within the StudyUnit, the two sites withthe highest concentra-tions were below urbanland-use areas.
Albuquerque
El Paso
Rio
Gra
nde
NUTRIENTS in water
Albuquerque
El Paso
Rio
Gra
nde
PESTICIDES in water
Albuquerque
El Paso
Rio
Gra
nde
ORGANOCHLORINE PESTICIDES and PCBsin bed sediment and biological tissue
WATER-QUALITY CONDITIONS IN A NATIONAL CONTEXTComparison of Stream Quality in the Rio Grande Valleywith Nationwide NAWQA Findings
Greater than the 75th percentile(among the highest 25 percentof NAWQA stream sites)
Between the median and the 75th percentile
Between the 25th percentile and the median
Less than the 25th percentile(among the lowest 25 percentof NAWQA stream sites)
EXPLANATION
Ranking of stream quality relative to allNAWQA stream sites — Darker coloredcircles generally indicate poorer quality.Bold outline of circle indicates one or moreaquatic-life criteria were exceeded.
Seven major water-quality characteristics were evaluated for stream sites in eachNAWQA Study Unit. Summary scores for each characteristic were computed for allsites that had adequate data. Scores for each site in the Rio Grande Valley werecompared with scores for all sites sampled in the 20 NAWQA Study Units during1992–95. Results are summarized by percentiles; higher percentile values generallyindicate poorer quality compared with other NAWQA sites. Water-qualityconditions at each site also are compared to established criteria for protection ofaquatic life. Applicable criteria are limited to nutrients and pesticides in water, andsemivolatile organic compounds, organochlorine pesticides and PCBs in sediment.(Methods used to compute rankings and evaluate aquatic-life criteria are describedby Gilliom and others, in press.)
The largest concentra-tions of organochlo-rines and PCBs wereat sites downstreamfrom urban areas.Three sites had levelsabove the nationalNAWQA median.

U.S. Geological Survey Circular 1162 23
For the trace elementsmeasured for this compari-son, one site was in thehighest 25 percent nation-wide. Two sites in the low-er part of the Study Unithave levels greater than themedian for all NAWQAsites.
On the basis of attributes used toprovide a broad overview of the fishcommunity structure—introducedspecies, omnivorous species, per-cent tolerant species, and externalanomalies—all of the sites wereabove the national median. Theranking was strongly influenced bythe predominance of introduced andomnivorous species at many of thesites.
CONCLUSIONS
Compared to other NAWQA StudyUnits, in the Rio Grande Valley
• Based on the water-quality data col-lected and presented here, land use inthe middle part of the Study Unit hasa major impact on nutrient concentra-tions.
• Pesticide concentrations have notaffected the quality of surface waterat the sampled sites.
• Fish community rankings were stronglyinfluenced by the predominance ofintroduced and omnivorous species.
Albuquerque
El Paso
Rio
Gra
nde
TRACE ELEMENTS in bed sediment
Albuquerque
El Paso
Rio
Gra
nde
STREAM HABITAT DEGRADATION
Albuquerque
El Paso
Rio
Gra
nde
SEMIVOLATILE ORGANIC COMPOUND Sin bed sediment
Albuquerque
El Paso
Rio
Gra
nde
FISH COMMUNITY DEGRADATION
Four of 10 sites in theStudy Unit were above thenational median; however,all sites showed some signsof degradation. Two sitesranked as highly degradedcompared with other sites.The rankings were influ-enced most by the lack ofdense riparian vegetation.
Six of the nine sites haveconcentrations lower thanthe national median. Twosites located downstreamfrom urban areas rankedamong the highest in theNation for semivolatile or-ganic compounds in sedi-ment.
WATER-QUALITY CONDITIONS IN A NATIONAL CONTEXTComparison of Stream Quality in the Rio Grande Valley
with Nationwide NAWQA Findings

24 Water Quality in the Rio Grande Valley, Colorado, New Mexico, and Texas, 1992-95
Nitrate concentrations throughout mostof the Study Unit were among the lowestin the Nation. However, in the San LuisValley, nitrate concentrations were high-er than the national median and, alongwith the Rincon Valley area, exceededdrinking-water standards in some wells.
Radon concentrations in the San LuisValley were among the highest measurednationwide. However, radon concentra-tions in the rest of the Study Unit weresmaller than the national median value.
Alamosa
Albuquerque
El Paso
RADON
(RV)(SUS)
(ALB)
(SLV)
Alamosa
Albuquerque
El Paso
NITRATE
(RV)(SUS)
(ALB)
(SLV)
EXPLANATION
Aquifer subunit survey (SUS)
Agricultural area; Rincon Valley (RV)
Cropland area; San Luis Valley (SLV)
Urban area; Albuquerque area (ALB)
Drinking-water aquifers
Shallow ground-water areas
Ranking of ground-water qualityrelative to all NAWQA ground-water studies Darker colored circlesgenerally indicate poorer quality.Bold outline of circle indicatesone or more standards or criteriawere exceeded
Greater than the 75th percentile
Between the median and the 75th percentile
Between the 25th percentile and the median
Less than the 25th percentile(Among the lowest 25 percent ofNAWQA ground-water studies)
(Among the highest 25 percent ofNAWQA ground-water studies)
WATER-QUALITY CONDITIONS IN A NATIONAL CONTEXTComparison of Ground-Water Quality in the Rio Grande Valleywith Nationwide NAWQA Findings
Five major water-quality characteristics were evaluated for ground-water studies in eachNAWQA Study Unit. Ground-water resources were divided into two categories:(1) drinking-water aquifers, and (2) shallow ground water underlying agricultural orurban areas. Summary scores were computed for each characteristic for all aquifers andshallow ground-water areas that had adequate data. Scores for each aquifer and shallowground-water area in the Rio Grande Valley were compared with scores for all aquifersand shallow ground-water areas sampled in the 20 NAWQA Study Units during 1992–95. Results are summarized by percentiles; higher percentile values generally indicatepoorer quality compared with other NAWQA ground-water studies. Water-qualityconditions for each drinking-water aquifer also are compared to establisheddrinking-water standards and criteria for protection of human health. (Methods used tocompute rankings and evaluate standards and criteria are described by Gilliom andothers, in press.)
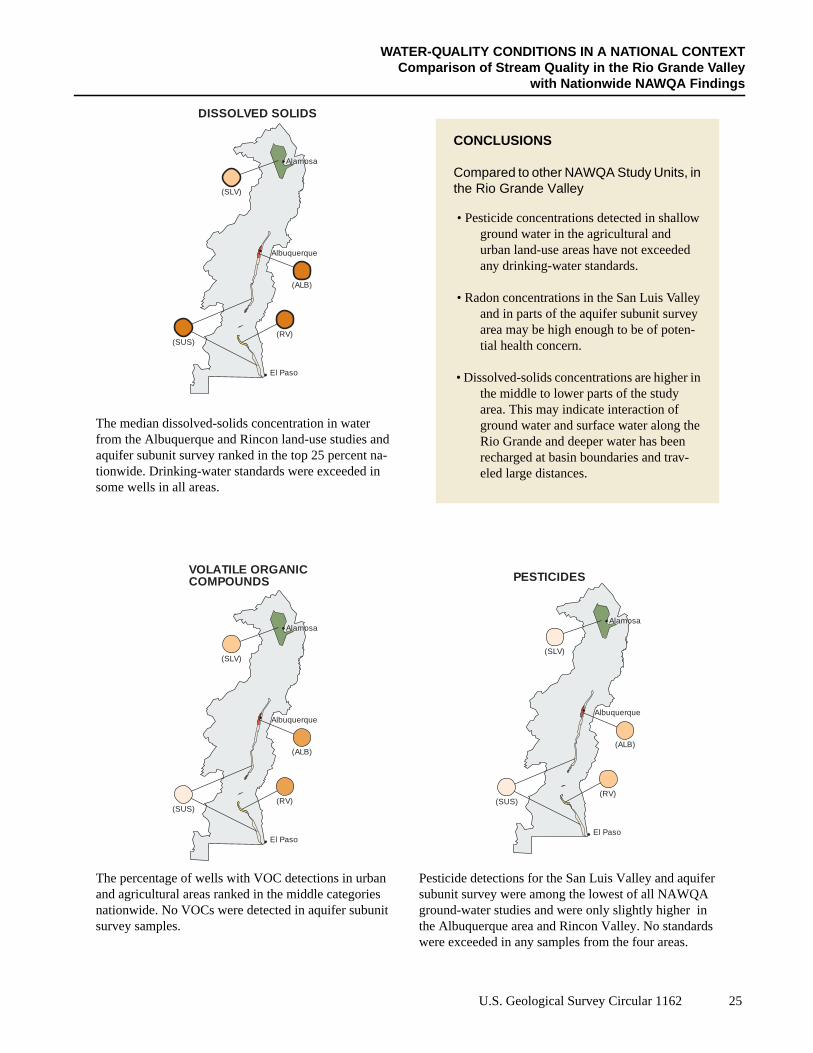
U.S. Geological Survey Circular 1162 25
Pesticide detections for the San Luis Valley and aquifersubunit survey were among the lowest of all NAWQAground-water studies and were only slightly higher inthe Albuquerque area and Rincon Valley. No standardswere exceeded in any samples from the four areas.
The percentage of wells with VOC detections in urbanand agricultural areas ranked in the middle categoriesnationwide. No VOCs were detected in aquifer subunitsurvey samples.
CONCLUSIONS
Compared to other NAWQA Study Units, inthe Rio Grande Valley
• Pesticide concentrations detected in shallowground water in the agricultural andurban land-use areas have not exceededany drinking-water standards.
• Radon concentrations in the San Luis Valleyand in parts of the aquifer subunit surveyarea may be high enough to be of poten-tial health concern.
• Dissolved-solids concentrations are higher inthe middle to lower parts of the studyarea. This may indicate interaction ofground water and surface water along theRio Grande and deeper water has beenrecharged at basin boundaries and trav-eled large distances.
The median dissolved-solids concentration in waterfrom the Albuquerque and Rincon land-use studies andaquifer subunit survey ranked in the top 25 percent na-tionwide. Drinking-water standards were exceeded insome wells in all areas.
Alamosa
Albuquerque
El Paso
VOLATILE ORGANICCOMPOUNDS
(RV)(SUS)
(ALB)
(SLV)
Alamosa
Albuquerque
El Paso
PESTICIDES
(RV)(SUS)
(ALB)
(SLV)
Alamosa
Albuquerque
El Paso
DISSOLVED SOLIDS
(RV)(SUS)
(ALB)
(SLV)
WATER-QUALITY CONDITIONS IN A NATIONAL CONTEXTComparison of Stream Quality in the Rio Grande Valley
with Nationwide NAWQA Findings

STUDY DESIGN AND DATA COLLECTION
EXPLANATION
0 30 60 MILES
0 30 60 KILOMETERS
SURFACE-WATER SITEWHERE CHEMICAL DATAWERE COLLECTED
0 30 60 MILES
0 30 60 KILOMETERS
EXPLANATION
SURFACE-WATER SITE WHEREECOLOGICAL DATA WERECOLLECTED
0 30 60 MILES
0 30 60 KILOMETERS
EXPLANATION
URBAN LAND-USE STUDY
AQUIFER SUBUNITSURVEY
AGRICULTURAL LAND-USESTUDY
Stream Chemistry
The primary objective of thestream chemistry component was toassess the relationship between landuse and chemical constituents ofsurface water. Surface-water siteswere distributed among land uses;site types include basic, intensive,and synoptic sites for pesticides,nutrients, and trace elements.
Ground-Water Chemistry
The primary objective of theground-water chemistry compo-nent was to determine if the chemi-cal constituents in the shallowaquifer were related to urban andirrigated agricultural land use. Asubunit survey of a deeper aquiferused for domestic supply was alsoconducted.
Stream Ecology
The primary objective of thestream ecology component was toassess surface-water quality by inte-grating the physical, chemical, andbiological factors. Ecology siteswere distributed among forest, irri-gated agriculture, urban, and range-land. Sites were classified as eitherintensive or synoptic on the basis ofthe level of the sampling effort orthe number of years data were col-lected. A special study on the appli-cability of transplanted bryophytes(moss) for trace-element accumula-tion was also conducted.
26 Water Quality in the Rio Grande Valley, Colorado, New Mexico, and Texas, 1992-95

STUDY DESIGN AND DATA COLLECTION
S
B
W
W
W
W
W
F
In te
r,
E
T
L
A
UMMARY OF DATA COLLECTION IN THE RIO GRANDE VALLEY STUDY UNIT, 1992-95
Study component
What data were collected and Why
Types of sites sampledNum-ber
of sites
Samplingfrequencyand period
Stream Chemistry
ed-sediment study Determine presence of potentially toxiccompounds attached to sediments inmajor streams.
Sample depositional zones of the Rio Grande and selected tributar-ies and non-tributaries for trace elements and hydrophobicorganic compounds.
18 11992-93
ater chemistry —Basic Fixed Site study
Describe concentrations and loads of chem-icals, suspended sediment, and nutrientsat selected sites throughout the StudyUnit.
Sample at or near sites where streamflow is measured continuouslyfor major constituents, nutrients, and suspended sediment.
17 Monthly,April 1993-Sept. 1995
ater chemistry —Intensive Fixed Sitestudy
Determine concentration and timing of pes-ticides transported by runoff to streams.
Select an agricultural basin where pesticides, dissolved solids,major constituents, and nutrients were sampled weekly and dur-ing selected runoff events.
1 Weekly,April-Sept.
1994
ater chemistry —Trace-element synop-tic study
Describe presence and distribution of traceelements in the water column, suspendedsediment, and bed material in the RioGrande and tributaries in the northernpart of the Study Unit.
Sample water column and suspended sediment during high flow(June) and water column and bed material during low flow (Sep-tember) for trace elements and major constituents.
34 11994
ater chemistry—Mesilla Valley pesti-cide and nutrient syn-optic study
Describe presence and distribution of pesti-cides and nutrients in the water columnin the Rio Grande and drains in theMesilla Valley.
Sample water column during high flow (irrigation season) for pesti-cides, nutrients, dissolved solids, and major constituents andduring low flow (nonirrigation season) for pesticides, nutrients,dissolved solids, major constituents, and trace elements. Samplebed material in drains during low flow for pesticides.
19 11994-95
ater chemistry—Rin-con Valley temporaldrain study
Describe temporal water-quality variationin surface drains and Rio Grande in anagricultural area flood irrigated with sur-face water.
Sample selected sites twice during nonirrigation season (low flow)and at the beginning and end of the irrigation season (high flow).Water analyzed for dissolved solids, major constituents, nutri-ents, organic carbon, trace elements, and pesticides.
11 41994-95
Stream Ecology
ish-tissue contaminantstudy
Determine the presence of contaminants infish tissue from species that can be foundin most streams of the Study Unit.
Sample composites of whole-body fish for:hydrophobic organic contaminantsfish livers for trace elements.
1112
11992-93
tensive ecologicalassessments
Assess fish, macroinvertebrates, and algaecommunities and habitat in streams rep-resenting three ecological regions.
Sample aquatic communities at a subset of water-chemistry basicsites; quantitatively describe stream habitat for these organisms.
Sample aquatic communities at a subset of water-chemistry basicsites; quantitatively describe stream habitat for these organisms.
2
8
3 reaches/ siin 1995;
1 reach/yea1993-95
cological synopticstudies
Assess aquatic and terrestrial communitiesand habitat in representative streamsthroughout the Study Unit.
Sample macroinvertebrates and algae at or near water-chemistrysites and describe habitat.
Sample adult insects using ultraviolet light traps at or near water-chemistry sites.
16
14
11994-95
ransplanted aquaticbryophyte study
Determine spatial distribution of trace ele-ments in the upper Rio Grande ValleyStudy Unit using transplanted aquaticbryophytes.
Transplant bryophyte samples (Hygrohypnum ochraceum)for vari-able lengths of time and analyze samples for trace-element con-centration.
13 11994
Ground-water Chemistry
and-use studies Examine natural and human factors thataffect the quality of shallow groundwater that underlies areas of urban land,overhead, center-pivot sprinkler-irrigatedagriculture land, or flood-irrigated agri-cultural land.
Install shallow wells and sample water from wells for analysis ofdissolved solids, major constituents, nutrients, dissolved organiccarbon, trace elements, pesticides, volatile organic compounds,and radionuclides.
(1) San Luis Valley agricultural land-use study of an area irrigatedwith ground water by overhead, center-pivot sprinklers.
(2) Albuquerque urban land-use study.(3) Rincon Valley agricultural land-use study of an area flood irri-
gated with surface water.
35
2430
1993
19931994
quifer subunit survey Describe the overall water quality in thepart of the basin-fill aquifer used fordomestic supply, public supply, or irriga-tion.
Randomly select and sample existing wells located in the RioGrande flood plain from Cochiti Lake, New Mexico, to El Paso,Texas, for analysis of major constituents, nutrients, dissolvedorganic carbon, trace elements, pesticides, volatile organic com-pounds, and radionuclides.
30 11995
U.S. Geological Survey Circular 1162 27
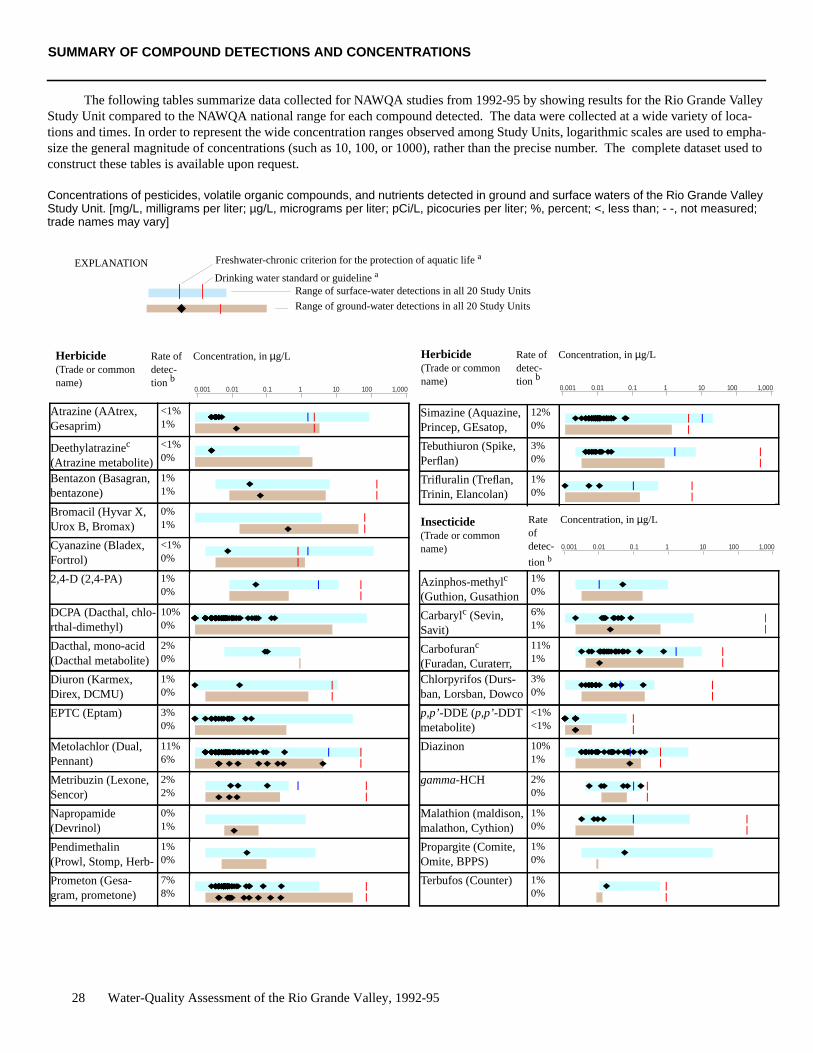
Herbicide(Trade or commonname)
Rate ofdetec-tion b
Concentration, inµg/L
0.001 0.01 0.1 1 10 100 1,000
The following tables summarize data collected for NAWQA studies from 1992-95 by showing results for the Rio Grande ValleyStudy Unit compared to the NAWQA national range for each compound detected. The data were collected at a wide variety of loca-tions and times. In order to represent the wide concentration ranges observed among Study Units, logarithmic scales are used to empha-size the general magnitude of concentrations (such as 10, 100, or 1000), rather than the precise number. The complete dataset used toconstruct these tables is available upon request.
Concentrations of pesticides, volatile organic compounds, and nutrients detected in ground and surface waters of the Rio Grande ValleyStudy Unit. [mg/L, milligrams per liter; µg/L, micrograms per liter; pCi/L, picocuries per liter; %, percent; <, less than; - -, not measured;trade names may vary]
EXPLANATION
Range of surface-water detections in all 20 Study Units
etections in all 20 Study Units
Drinking water standard or guidelinea
Freshwater-chronic criterion for the protection of aquatic lifea
SUMMARY OF COMPOUND DETECTIONS AND CONCENTRATIONS
Herbicide(Trade or commonname)
Rate ofdetec-tion b
Concentration, inµg/L
0.001 0.01 0.1 1 10 100 1,000
Range of ground-water d
Atrazine (AAtrex, <1%
Gesaprim) 1%
Deethylatrazinec
(Atrazine metabolite)
<1%0%
Bentazon (Basagran,bentazone)
1%1%
Bromacil (Hyvar X,Urox B, Bromax)
0%1%
Cyanazine (Bladex,Fortrol)
<1%0%
2,4-D (2,4-PA) 1%0%
DCPA (Dacthal, chlo-rthal-dimethyl)
10%0%
Dacthal, mono-acid(Dacthal metabolite)
2%0%
Diuron (Karmex,Direx, DCMU)
1%0%
EPTC (Eptam) 3%0%
Metolachlor (Dual,Pennant)
11%6%
Metribuzin (Lexone,Sencor)
2%2%
Napropamide(Devrinol)
0%1%
Pendimethalin(Prowl, Stomp, Herb-
1%0%
Prometon (Gesa-gram, prometone)
7%8%
28 Water-Quality Assessment of the Rio Grande Valle
Simazine (Aquazine,Princep, GEsatop,
12%0%
Tebuthiuron (Spike,Perflan)
3%0%
Trifluralin (Treflan,Trinin, Elancolan)
1%0%
Insecticide(Trade or commonname)
Rateofdetec-
tion b
Concentration, inµg/L
Azinphos-methylc
(Guthion, Gusathion
1%0%
Carbarylc (Sevin,Savit)
6%1%
Carbofuranc
(Furadan, Curaterr,
11%1%
Chlorpyrifos (Durs-ban, Lorsban, Dowco
3%0%
p,p’-DDE (p,p’-DDTmetabolite)
<1%<1%
Diazinon 10%1%
gamma-HCH 2%0%
Malathion (maldison,malathon, Cythion)
1%0%
Propargite (Comite,Omite, BPPS)
1%0%
Terbufos (Counter) 1%0%
0.001 0.01 0.1 1 10 100 1,000
y, 1992-95

Nutrient(Trade or commonname)
Rateofdetec-
Concentration, in mg/L
0.01 0.1 1 10 100 1,000 10,000 100,000
Volatile organiccompound(Trade or common
Rateofdetec-
b
Concentration, inµg/L
0.01 0.1 1 10 100 1,000
SUMMARY OF COMPOUND DETECTIONS AND CONCENTRATIONS
Trichloroethene(TCE)
--1%
cis-1,2-Dichloroet-hene ((Z)-1,2-Dichlo-
--2%
p-Isopropyltoluene(p-Cymene)
--1%
1,1-Dichloroethane(Ethylidene dichlo-ride)
--2%
Dimethylbenzenes(Xylenes, total)
--3%
Volatile organiccompound(Trade or commonname)
Rateofdetec-
tion b
Concentration, inµg/L
Methyl tert-butyld
ether (MTBE)
--2%
0.01 0.1 1 10 100 1,000 10,000 100,000
name) tion
Dissolved ammonia 75%78%
Dissolved ammoniaplus organic nitrogenas nitrogen
53%39%
Dissolved phospho-rus as phosphorus
82%72%
Dissolved nitrite plusnitrate
66%65%
Other Rateofdetec-
tion b
Concentration, in pCi/L
Radon 222 --100%
1 10 100 1,000 10,000 100,000
tion b
U.S. Geological Survey Circular 1162 29
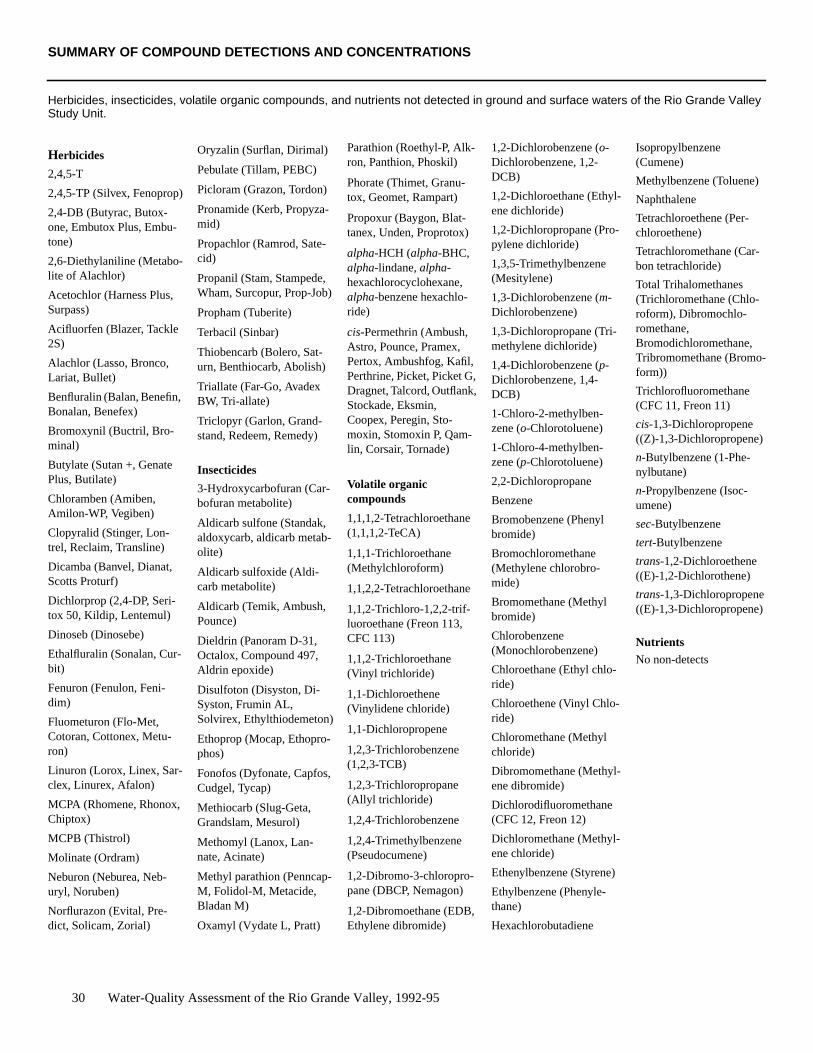
SUMMARY OF COMPOUND DETECTIONS AND CONCENTRATIONS
Herbicides, insecticides, volatile organic compounds, and nutrients not detected in ground and surface waters of the Rio Grande ValleyStudy Unit.
Herbicides
2,4,5-T
2,4,5-TP (Silvex, Fenoprop)
2,4-DB (Butyrac, Butox-one, Embutox Plus, Embu-tone)
2,6-Diethylaniline (Metabo-lite of Alachlor)
Acetochlor (Harness Plus,Surpass)
Acifluorfen (Blazer, Tackle2S)
Alachlor (Lasso, Bronco,Lariat, Bullet)
Benfluralin (Balan, Benefin,Bonalan, Benefex)
Bromoxynil (Buctril, Bro-minal)
Butylate (Sutan +, GenatePlus, Butilate)
Chloramben (Amiben,Amilon-WP, Vegiben)
Clopyralid (Stinger, Lon-trel, Reclaim, Transline)
Dicamba (Banvel, Dianat,Scotts Proturf)
Dichlorprop (2,4-DP, Seri-tox 50, Kildip, Lentemul)
Dinoseb (Dinosebe)
Ethalfluralin (Sonalan, Cur-bit)
Fenuron (Fenulon, Feni-dim)
Fluometuron (Flo-Met,Cotoran, Cottonex, Metu-ron)
Linuron (Lorox, Linex, Sar-clex, Linurex, Afalon)
MCPA (Rhomene, Rhonox,Chiptox)
MCPB (Thistrol)
Molinate (Ordram)
Neburon (Neburea, Neb-uryl, Noruben)
Norflurazon (Evital, Pre-dict, Solicam, Zorial)
30 Water-Quality
Oryzalin (Surflan, Dirimal)
Pebulate (Tillam, PEBC)
Picloram (Grazon, Tordon)
Pronamide (Kerb, Propyza-mid)
Propachlor (Ramrod, Sate-cid)
Propanil (Stam, Stampede,Wham, Surcopur, Prop-Job)
Propham (Tuberite)
Terbacil (Sinbar)
Thiobencarb (Bolero, Sat-urn, Benthiocarb, Abolish)
Triallate (Far-Go, AvadexBW, Tri-allate)
Triclopyr (Garlon, Grand-stand, Redeem, Remedy)
Insecticides
3-Hydroxycarbofuran (Car-bofuran metabolite)
Aldicarb sulfone (Standak,aldoxycarb, aldicarb metab-olite)
Aldicarb sulfoxide (Aldi-carb metabolite)
Aldicarb (Temik, Ambush,Pounce)
Dieldrin (Panoram D-31,Octalox, Compound 497,Aldrin epoxide)
Disulfoton (Disyston, Di-Syston, Frumin AL,Solvirex, Ethylthiodemeton)
Ethoprop (Mocap, Ethopro-phos)
Fonofos (Dyfonate, Capfos,Cudgel, Tycap)
Methiocarb (Slug-Geta,Grandslam, Mesurol)
Methomyl (Lanox, Lan-nate, Acinate)
Methyl parathion (Penncap-M, Folidol-M, Metacide,Bladan M)
Oxamyl (Vydate L, Pratt)
Assessment of the Rio G
Parathion (Roethyl-P, Alk-ron, Panthion, Phoskil)
Phorate (Thimet, Granu-tox, Geomet, Rampart)
Propoxur (Baygon, Blat-tanex, Unden, Proprotox)
alpha-HCH (alpha-BHC,alpha-lindane,alpha-hexachlorocyclohexane,alpha-benzene hexachlo-ride)
cis-Permethrin (Ambush,Astro, Pounce, Pramex,Pertox, Ambushfog, Kafil,Perthrine, Picket, Picket G,Dragnet, Talcord, Outflank,Stockade, Eksmin,Coopex, Peregin, Sto-moxin, Stomoxin P, Qam-lin, Corsair, Tornade)
Volatile organiccompounds
1,1,1,2-Tetrachloroethane(1,1,1,2-TeCA)
1,1,1-Trichloroethane(Methylchloroform)
1,1,2,2-Tetrachloroethane
1,1,2-Trichloro-1,2,2-trif-luoroethane (Freon 113,CFC 113)
1,1,2-Trichloroethane(Vinyl trichloride)
1,1-Dichloroethene(Vinylidene chloride)
1,1-Dichloropropene
1,2,3-Trichlorobenzene(1,2,3-TCB)
1,2,3-Trichloropropane(Allyl trichloride)
1,2,4-Trichlorobenzene
1,2,4-Trimethylbenzene(Pseudocumene)
1,2-Dibromo-3-chloropro-pane (DBCP, Nemagon)
1,2-Dibromoethane (EDB,Ethylene dibromide)
1,2-Dichlorobenzene (o-Dichlorobenzene, 1,2-DCB)
1,2-Dichloroethane (Ethyl-ene dichloride)
1,2-Dichloropropane (Pro-pylene dichloride)
1,3,5-Trimethylbenzene(Mesitylene)
1,3-Dichlorobenzene (m-Dichlorobenzene)
1,3-Dichloropropane (Tri-methylene dichloride)
1,4-Dichlorobenzene (p-Dichlorobenzene, 1,4-DCB)
1-Chloro-2-methylben-zene (o-Chlorotoluene)
1-Chloro-4-methylben-zene (p-Chlorotoluene)
2,2-Dichloropropane
Benzene
Bromobenzene (Phenylbromide)
Bromochloromethane(Methylene chlorobro-mide)
Bromomethane (Methylbromide)
Chlorobenzene(Monochlorobenzene)
Chloroethane (Ethyl chlo-ride)
Chloroethene (Vinyl Chlo-ride)
Chloromethane (Methylchloride)
Dibromomethane (Methyl-ene dibromide)
Dichlorodifluoromethane(CFC 12, Freon 12)
Dichloromethane (Methyl-ene chloride)
Ethenylbenzene (Styrene)
Ethylbenzene (Phenyle-thane)
Hexachlorobutadiene
Isopropylbenzene(Cumene)
Methylbenzene (Toluene)
Naphthalene
Tetrachloroethene (Per-chloroethene)
Tetrachloromethane (Car-bon tetrachloride)
Total Trihalomethanes(Trichloromethane (Chlo-roform), Dibromochlo-romethane,Bromodichloromethane,Tribromomethane (Bromo-form))
Trichlorofluoromethane(CFC 11, Freon 11)
cis-1,3-Dichloropropene((Z)-1,3-Dichloropropene)
n-Butylbenzene (1-Phe-nylbutane)
n-Propylbenzene (Isoc-umene)
sec-Butylbenzene
tert-Butylbenzene
trans-1,2-Dichloroethene((E)-1,2-Dichlorothene)
trans-1,3-Dichloropropene((E)-1,3-Dichloropropene)
Nutrients
No non-detects
rande Valley, 1992-95

Concentrations of semivolatile organic compounds, organochlorine compounds, and trace elements detected in fish tissue and bedsediment of the Rio Grande Valley Study Unit. [µg/g, micrograms per gram; µg/kg, micrograms per kilogram; %, percent; <, less than; - -, not measured; trade names may vary]
EXPLANATION
Range of detections in fish and clam tissue in all 20 Study Units
Detection in bed sediment or fish tissue in the Rio Grande Valley Study Unit
Range of detections in bed sediment in all 20 Study Units
Guideline for the protection of aquatic lifee
Semivolatile Rate Concentration, inµg/kg Semivolatilerganic compound
Rateofdetec-
b
Concentration, inµg/kg
10.1 10 100 1,000 10,000 100,000
SUMMARY OF COMPOUND DETECTIONS AND CONCENTRATIONS
organic compound ofdetec-
tion b10.1 10 100 1,000 10,000 100,000
o
1,6-Dimethylnaphtha-lene
--13%
1-Methylphenan-threne
--6%
1-Methylpyrene --6%
2,3,6-Trimethylnaph-thalene
--13%
2,6-Dimethylnaphtha-lene
--81%
2-Methylanthracene --6%
3,5-Dimethylphenol --13%
4,5-Methyle-nephenanthrene
--6%
9H-Carbazole --19%
9H-Fluorene --6%
Acenaphthylene --13%
Anthracene --38%
Anthraquinone --13%
Benz[a ]anthracene --38%
Benzo[a ]pyrene --31%
Benzo[b ]fluoran-thene
--19%
Benzo[ghi ]perylene --13%
tion
Benzo[k ]fluoran-thene
--19%
Butylbenzylphthalate--69%
Chrysene --50%
Di- n -butylphthalate --88%
Di- n -octylphthalate --6%
Dibenz[a,h ]anthracene
--6%
Dibenzothiophene --13%
Diethylphthalate --81%
Dimethylphthalate --19%
Fluoranthene --62%
Indeno[1,2,3-cd ]pyrene
--13%
Phenanthrene --62%
Phenanthridine --13%
Phenol --50%
Pyrene --56%
bis(2-Ethyl-hexyl)phthalate
--100%
p-Cresol --69%
U.S. Geological Survey Circular 1162 31

Organochlorinecompound(Trade name)
Rateofdetec-
tion b
Concentration, inµg/kg
0.01 0.1 1 10 100 1,000 10,000 100,000
Trace element Rateofdetec-
tion b
Concentration, inµg/g
0.01 0.1 1 10 100 1,000 10,000
SUMMARY OF COMPOUND DETECTIONS AND CONCENTRATIONS
total-Chlordane 9%0%
PCB, total 45%0%
p,p’-DDE 91%31%
total-DDT 91%31%
gamma-HCH (lin-dane,gamma-BHC,
9%--
Hexachlorobenzene 9%--
A
C
C
C
L
M
N
S
32 Water-Quality Assessment of the Rio Grande Valle
rsenic 92%100%
admium 83%100%
hromium 75%100%
opper 100%100%
ead 17%100%
ercury 75%73%
ickel 50%100%
elenium 100%100%
Zinc 100%100%
y, 1992-95
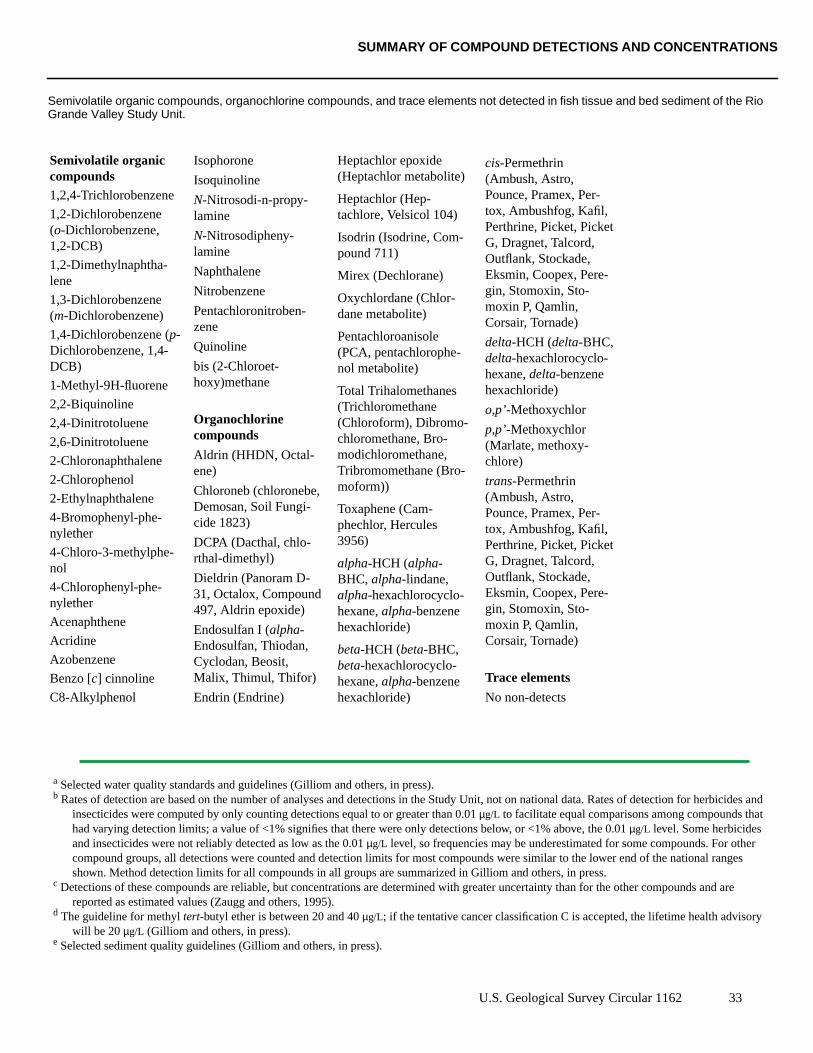
Semivolatile organic compounds, organochlorine compounds, and trace elements not detected in fish tissue and bed sediment of the RioGrande Valley Study Unit.
SUMMARY OF COMPOUND DETECTIONS AND CONCENTRATIONS
Semivolatile organiccompounds1,2,4-Trichlorobenzene
1,2-Dichlorobenzene(o-Dichlorobenzene,1,2-DCB)
1,2-Dimethylnaphtha-lene
1,3-Dichlorobenzene(m-Dichlorobenzene)
1,4-Dichlorobenzene (p-Dichlorobenzene, 1,4-DCB)
1-Methyl-9H-fluorene
2,2-Biquinoline
2,4-Dinitrotoluene
2,6-Dinitrotoluene
2-Chloronaphthalene
2-Chlorophenol
2-Ethylnaphthalene
4-Bromophenyl-phe-nylether
4-Chloro-3-methylphe-nol
4-Chlorophenyl-phe-nylether
Acenaphthene
Acridine
Azobenzene
Benzo [c] cinnoline
C8-Alkylphenol
Isophorone
Isoquinoline
N-Nitrosodi-n-propy-lamine
N-Nitrosodipheny-lamine
Naphthalene
Nitrobenzene
Pentachloronitroben-zene
Quinoline
bis (2-Chloroet-hoxy)methane
Organochlorinecompounds
Aldrin (HHDN, Octal-ene)
Chloroneb (chloronebe,Demosan, Soil Fungi-cide 1823)
DCPA (Dacthal, chlo-rthal-dimethyl)
Dieldrin (Panoram D-31, Octalox, Compound497, Aldrin epoxide)
Endosulfan I (alpha-Endosulfan, Thiodan,Cyclodan, Beosit,Malix, Thimul, Thifor)
Endrin (Endrine)
Heptachlor epoxide(Heptachlor metabolite)
Heptachlor (Hep-tachlore, Velsicol 104)
Isodrin (Isodrine, Com-pound 711)
Mirex (Dechlorane)
Oxychlordane (Chlor-dane metabolite)
Pentachloroanisole(PCA, pentachlorophe-nol metabolite)
Total Trihalomethanes(Trichloromethane(Chloroform), Dibromo-chloromethane, Bro-modichloromethane,Tribromomethane (Bro-moform))
Toxaphene (Cam-phechlor, Hercules3956)
alpha-HCH (alpha-BHC, alpha-lindane,alpha-hexachlorocyclo-hexane,alpha-benzenehexachloride)
beta-HCH (beta-BHC,beta-hexachlorocyclo-hexane,alpha-benzenehexachloride)
a Selected water quality standards and guidelines (Gilliom and others, in press).b Rates of detection are based on the number of analyses and detections in the S
insecticides were computed by only counting detections equal to or greater thhad varying detection limits; a value of <1% signifies that there were only deand insecticides were not reliably detected as low as the 0.01µg/L level, so frequencompound groups, all detections were counted and detection limits for most shown. Method detection limits for all compounds in all groups are summariz
c Detections of these compounds are reliable, but concentrations are determinedreported as estimated values (Zaugg and others, 1995).
d The guideline for methyltert-butyl ether is between 20 and 40µg/L; if the tentative cawill be 20µg/L (Gilliom and others, in press).
e Selected sediment quality guidelines (Gilliom and others, in press).
cis-Permethrin(Ambush, Astro,Pounce, Pramex, Per-tox, Ambushfog, Kafil,Perthrine, Picket, PicketG, Dragnet, Talcord,Outflank, Stockade,Eksmin, Coopex, Pere-gin, Stomoxin, Sto-moxin P, Qamlin,Corsair, Tornade)
delta-HCH (delta-BHC,delta-hexachlorocyclo-hexane,delta-benzenehexachloride)
o,p’-Methoxychlor
p,p’-Methoxychlor(Marlate, methoxy-chlore)
trans-Permethrin(Ambush, Astro,Pounce, Pramex, Per-tox, Ambushfog, Kafil,Perthrine, Picket, PicketG, Dragnet, Talcord,Outflank, Stockade,Eksmin, Coopex, Pere-gin, Stomoxin, Sto-moxin P, Qamlin,Corsair, Tornade)
Trace elements
No non-detects
U.S. Geological Survey Circular 1162 33
tudy Unit, not on national data. Rates of detection for herbicides andan 0.01µg/L to facilitate equal comparisons among compounds thattections below, or <1% above, the 0.01µg/L level. Some herbicidescies may be underestimated for some compounds. For othercompounds were similar to the lower end of the national rangesed in Gilliom and others, in press. with greater uncertainty than for the other compounds and are
ncer classification C is accepted, the lifetime health advisory

REFERENCES
t
-
Anderholm, S.K., 1996, Water-qualityassessment of the Rio GrandeValley, Colorado, New Mexico,and Texas—Shallow ground-water quality of a land-use area inthe San Luis Valley, south-centralColorado, 1993: U.S. GeologicalSurvey Water-Resources Investi-gations Report 96-4144, 94 p.
———1997, Water-quality assessmentof the Rio Grande Valley, Colo-rado, New Mexico, andTexas—Shallow ground-waterquality and land use in the Albu-querque area, central New Mex-ico, 1993: U.S. GeologicalSurvey Water-Resources Investi-gations Report 97-4067, 73 p.
Anderholm, S.K., Radell, M.J., andRichey, S.F., 1995, Water-qualityassessment of the Rio GrandeValley study unit, Colorado, NewMexico, and Texas—Analysis ofselected nutrient, suspended-sedi-ment, and pesticide data: U.S.Geological Survey Water-Resources Investigations Report94-4061, 203 p.
Barbash, J.E., and Resek, E.A., 1996,Pesticides in ground water—Dis-tribution, trends, and governingfactors: Chelsea, Mich., AnnArbor Press, Inc., Pesticides inthe hydrologic system series, v. 2,588 p.
Bexfield, L.M., and Anderholm, S.K.,1997, Water-quality assessmentof the Rio Grande Valley, Colo-rado, New Mexico, andTexas—Ground-water quality inthe Rio Grande flood plain,Cochiti Lake, New Mexico, to ElPaso, Texas, 1995: U.S. Geologi-cal Survey Water-ResourcesInvestigations Report 96-4249, 93p.
Carter, L.F., 1997a, Water-qualityassessment of the Rio GrandeValley, Colorado, New Mexico,and Texas—Fish communities atselected sites, 1993-95: U.S. Geo-logical Survey Water-ResourcesInvestigations Report 97-4017,27 p.
———1997b, Water-quality assess-ment of the Rio Grande Valley,Colorado, New Mexico, andTexas—Organic compounds andtrace elements in bed sedimentand fish tissue, 1992-93: U.S.Geological Survey Water-Resources Investigations Report97-4002, 23 p.
Carter, L.F., and Porter, S.D., 1997,Trace-element accumulation byHygrohypnum ochraceum in theupper Rio Grande Basin, Colo-rado and New Mexico: Environ-mental Toxicology andChemistry, v. 16, no. 12,p. 2521-2528.
Colorado Water Quality Control Com-mission, 1989, Classifications andnumeric standards Rio GrandeRiver Basin: Denver, 50 p.
Ellis, S.R., 1991, National Water-Quality Assessment Pro-gram—The Rio Grande Valley:U.S. Geological Survey Open-File Report 91-160, 2 p.
Ellis, S.R., Levings, G.W., Carter, L.F.,Richey, S.F., and Radell, M.J.,1993, Rio Grande Valley, Colo-rado, New Mexico, and Texas,inLeahy, P.P., Ryan, B.J., andJohnson, A.I., eds., AmericanWater Resources AssociationMonograph Series no. 19,p. 617-646.
Gilliom, R.J., Alley, W.M., and Gurtz,M.E., 1995, Design of theNational Water-Quality Assess-ment Program—Occurrence anddistribution of water-quality con-ditions: U.S. Geological SurveyCircular 1112, 33 p.
Gilliom, R.J., Mueller, D.K., and Now-ell, L.H., in press, Methods forcomparing water-quality condi-tions among national water-qual-ity assessment study units, 1992-1995: U.S. Geological SurveyOpen-File Report 97-589.
Healy, D.F., 1996, Water-qualityassessment of the Rio GrandeValley, Colorado, New Mexico,and Texas—Occurrence and dis-tribution of selected pesticides
and nutrients at selected surface-water sites in the Mesilla Valley,1994-95: U.S. Geological SurveyWater-Resources InvestigationsReport 96-4069, 85 p.
———1997, Water-quality assessmenof the Rio Grande Valley, Colo-rado, New Mexico, andTexas—Summary and analysis ofwater-quality data for the basic-fixed-site network, 1993-95: U.S.Geological Survey Water-Resources Investigations Report97-4212, 82 p.
Larson, S.J., Capel, P.D., and Majew-ski, M.S., 1997, Pesticides in sur-face waters—Distribution, trends,and governing factors: Chelsea,Mich., Ann Arbor Press, Inc.,Pesticides in the hydrologic sys-tem series, v. 3, 373 p.
Majewski, M.S., and Capel, P.D.,1995, Pesticides in the atmo-sphere—Distribution, trends, andgoverning factors: Chelsea,Mich., Ann Arbor Press, Inc.,Pesticides in the hydrologic sys-tem series, v. 1, 214 p.
Miller, L.K., Moquino, R.L., and Hill,B.A., 1997, Water-quality assess-ment of the Rio Grande Valley,Colorado, New Mexico, andTexas—Water-quality data forwater-column, suspended-sedi-ment, and bed-material samplescollected at selected surface-water sites in the upper RioGrande Basin, June and September, 1994: U.S. Geological Sur-vey Open-File Report 97-644,18 p.
Mueller, D.K., Hamilton, P.A., Helsel,D.R., Hitt, K.J., and Ruddy, B.C.,1995, Nutrients in ground waterand surface water of the UnitedStates—An analysis of datathrough 1992: U.S. GeologicalSurvey Water-Resources Investi-gations Report 95-4031, 74 p.
Mueller, D.K., and Helsel, D.R., 1996,Nutrients in the nation’swaters—Too much of a goodthing?: U.S. Geological SurveyCircular 1136, 24 p.
34 Water Quality in the Rio Grande Valley, Colorado, New Mexico, and Texas, 1992-95

REFERENCES
New Mexico Water Quality ControlCommission, 1991, Water-qual-ity standards for interstate andintrastate streams in New Mexico:Santa Fe, 49 p.
Nolan, B.T., and Ruddy, B.C., 1996,Nitrate in ground waters of theUnited States—Assessing therisk: U.S. Geological Survey FactSheet 092-96, 4 p.
Nowell, L.H., and Resek, E.A., 1994,National standards and guidelinesfor pesticides in water, sediment,and aquatic organisms—Applica-tion to water-quality assess-ments,in Ware, G.W., ed.,Reviews of environmental con-tamination and toxicology, v. 140:New York, Springer-Verlag,p. 1-164.
Richey, S.F., and Ellis, S.R., 1993,National Water-Quality Assess-ment Program—Water use in theRio Grande Valley, 1990: U.S.Geological Survey Open-FileReport 93-456, 2 p.
Schmitt, C.J., and Brumbaugh, W.G.,1990, National ContaminantBiomonitoring Program—Con-centrations of arsenic, cadmium,copper, lead, mercury, selenium,and zinc in U.S. freshwater fish,1976-1984: Archives of Environ-mental Contamination and Toxi-cology, v. 19, p. 731-747.
Schmitt, C.J., Zajicek, J.L., and Peter-man, P.H., 1990, National Con-taminant BiomonitoringProgram—Residues of orga-nochlorine chemicals in U.S.freshwater fish, 1976-1984:Archives of Environmental Con-tamination and Toxicology, v. 19,p. 748-781.
Schmitt, C.J., Zajicek, J.L., andRibick, M.A., 1985, NationalContaminant Biomonitoring Pro-gram—Residues of organochlo-rine chemicals in freshwater fish,1980-1981: Archives of Environ-mental Contamination and Toxi-cology, v. 14, p. 225-260.
Smith, J.A., Witowski, P.J., andFusillo, T.V., 1988, Manmade
organic compounds in the surfacewaters of the United States—Areview of current understanding:U.S. Geological Survey Circular1007, 92 p.
U.S. Environmental ProtectionAgency, 1996a, Drinking waterregulations and health advisories:Washington, D.C., U.S. Environ-mental Protection Agency, Officeof Water, 11 p.
———1996b,(Draft) National sedi-ment contaminant point-sourceinventory: EPA-823-D-96-001.
———1996c,The National SedimentQuality Survey—A report to Con-gress on the extent and severity ofsediment contamination in sur-face waters of the United States:U.S. Environmental ProtectionAgency, Office of Science andTechnology, Draft Report EPA823-D-96-002.
Van Metre, P.C., Mahler, B.J., and Cal-lender, Edward, 1997, Water-quality trends in the RioGrande/Río Bravo Basin usingsediment cores from reservoirs:U.S. Geological Survey FactSheet 221-96, 8 p.
Zaugg, S.D., Sandstrom, M.W., Smith,S.G., and Fehlberg, K.M., 1995,Methods of analysis by the U.S.Geological Survey NationalWater Quality Labora-tory—Determination of pesti-cides in water by C-18 solid-phase extraction and capillary-column gas chromatogra-phy/mass spectrometry withselected ion monitoring: U.S.Geological Survey Open-FileReport 95-181, 54 p.
U.S. Geological Survey Circular 1162 35

GLOSSARY
y
l
.
The terms in this glossary were com-piled from numerous sources. Somedefinitions have been modified andmay not be the only valid ones forthese terms.
Alluvial aquifer - A water-bearingdeposit of unconsolidated material(sand and gravel) left behind by a riveror other flowing water.
Anomalies- As related to fish, exter-nally visible skin or subcutaneous dis-orders, including deformities, erodedfins, lesions, and tumors.
Anthropogenic - Occurring becauseof, or influenced by, human activity.
Aquatic-life criteria - Water-qualityguidelines for protection of aquaticlife. Often refers to U.S. Environmen-tal Protection Agency water-qualitycriteria for protection of aquatic organ-isms.See also Water-quality guide-lines and Water-quality criteria.
Aquifer - A water-bearing layer ofsoil, sand, gravel, or rock that willyield usable quantities of water to awell.
Basic Fixed Sites- Sites on streams atwhich streamflow is measured andsamples are collected for temperature,salinity, suspended sediment, majorions and metals, nutrients, and organiccarbon to assess the broad-scale spatialand temporal character and transportof inorganic constituents of streamwa-ter in relation to hydrologic conditionsand environmental settings.
Bed sediment and tissue studies -Assessment of concentrations and dis-tributions of trace elements and hydro-phobic organic contaminants instreambed sediment and tissues ofaquatic organisms to identify potentialsources and to assess spatial distribu-tion.
Benthic - Refers to plants or animalsthat live on the bottom of lakes,streams, or oceans.
Bioaccumulation - The biologicalsequestering of a substance at a higherconcentration than that at which itoccurs in the surrounding environmentor medium. Also, the process wherebya substance enters organisms throughthe gills, epithelial tissues, dietary, orother sources.
Bioavailability - The capacity of achemical constituent to be taken up byliving organisms either through physi-cal contact or by ingestion.
Biodegradation - Transformation of asubstance into new compoundsthrough biochemical reactions or theactions of microorganisms such as bac-teria.
Community - In ecology, the speciesthat interact in a common area.
Concentration - The amount or massof a substance present in a given vol-ume or mass of sample. Usuallyexpressed as microgram per liter(water sample) or micrograms perkilogram (sediment or tissue sample).
Confluence- The flowing together oftwo or more streams; the place where atributary joins the main stream.
Constituent - A chemical or biologi-cal substance in water, sediment, orbiota that can be measured by an ana-lytical method.
Contamination - Degradation ofwater quality compared to original ornatural conditions due to human activ-ity.
Criterion - A standard rule or test onwhich a judgment or decision can bebased.
Degradation products - Compoundsresulting from transformation of anorganic substance through chemical,photochemical, and/or biochemicalreactions.
Detection limit - The concentrationbelow which a particular analyticalmethod cannot determine, with a highdegree of certainty, a concentration.
DDT - Dichloro-diphenyl-trichloroet-hane. An organochlorine insecticide nolonger registered for use in the UnitedStates.
Dissolved solids - Amount of miner-als, such as salt, that are dissolved inwater; amount of dissolved solids is anindicator of salinity or hardness.
Diversion - A turning aside or alter-ation of the natural course of a flow ofwater, normally considered physicallyto leave the natural channel. In someStates, this can be a consumptive usedirect from another stream, such as blivestock watering. In other States, adiversion must consist of such actionsas taking water through a canal, pipe,or conduit.
Drainage basin- The portion of thesurface of the Earth that contributeswater to a stream through overlandrun-off, including tributaries andimpoundments.
Drinking-water standard or guide-line - A threshold concentration in apublic drinking-water supply, designedto protect human health. As definedhere, standards are U.S. EnvironmentaProtection Agency regulations thatspecify the maximum contaminationlevels for public water systemsrequired to protect the public welfare;guidelines have no regulatory statusand are issued in an advisory capacity
Ecological studies - Studies of biolog-ical communities and habitat charac-teristics to evaluate the effects ofphysical and chemical characteristics
36 Water Quality in the Rio Grande Valley, Colorado, New Mexico, and Texas, 1992-95

GLOSSARY
n
-
-
r
of water and hydrologic conditions onaquatic biota and to determine howbiological and habitat characteristicsdiffer among environmental settings inNAWQA Study Units.
Ecoregion - An area of similar cli-mate, landform, soil, potential naturalvegetation, hydrology, or other ecolog-ically relevant variables.
Ecosystem - The interacting popula-tions of plants, animals, and microor-ganisms occupying an area, plus theirphysical environment.
Effluent - Outflow from a particularsource, such as a stream that flowsfrom a lake or liquid waste that flowsfrom a factory or sewage-treatmentplant.
Environmental setting - Land areacharacterized by a unique combina-tion of natural and human-related fac-tors, such as row-crop cultivation orglacial-till soils.
Ephemeral stream - A stream or partof a stream that flows only in directresponse to precipitation or snowmelt.Its channel is above the water table atall times.
Eutrophication - The process bywhich water becomes enriched withplant nutrients, most commonly phos-phorus and nitrogen.
Evapotranspiration - A collectiveterm that includes water lost throughevaporation from the soil and surface-water bodies and by plant transpira-tion.
FDA action level - A regulatory levelrecommended by the U.S. Environ-mental Protection Agency for enforce-ment by the FDA when pesticideresidues occur in food commodities forreasons other than the direct applica-tion of the pesticide. Action levels areset for inadvertent pesticide residues
resulting from previous legal use oraccidental contamination. Applies toedible portions of fish and shellfish ininterstate commerce.
Fixed Sites- NAWQA's most compre-hensive monitoring sites.See alsoBasic Fixed Sites and Intensive FixedSites.
Flood irrigation - The application ofirrigation water where the entire sur-face of the soil is covered by pondedwater.
Flood plain - The relatively level areaof land bordering a stream channel andinundated during moderate to severefloods.
Ground water - In general, any waterthat exists beneath the land surface, butmore commonly applied to water infully saturated soils and geologic for-mations.
Habitat - The part of the physicalenvironment where plants and animalslive.
Health advisory - Nonregulatory lev-els of contaminants in drinking waterthat may be used as guidance in theabsence of regulatory limits. Adviso-ries consist of estimates of concentra-tions that would result in no known oranticipated health effects (for carcino-gens, a specified cancer risk) deter-mined for a child or for an adult forvarious exposure periods.
Herbicide - A chemical or other agentapplied for the purpose of killing unde-sirable plants.See also Pesticide.
Human health advisory - Guidanceprovided by U.S. Environmental Pro-tection Agency, State agencies or sci-entific organizations, in the absence ofregulatory limits, to describe accept-able contaminant levels in drinkingwater or edible fish.
Index of Biotic Integrity (IBI) - Anaggregated number, or index, based oseveral attributes or metrics of a fishcommunity that provides an assess-ment of biological conditions.
Indicator sites - Stream sampling siteslocated at outlets of drainage basinswith relatively homogeneous land useand physiographic conditions; mostindicator-site basins have drainageareas ranging from 20 to 200 squaremiles.
Infiltration - Movement of water, typ-ically downward, into soil or porousrock.
Insecticide - A substance or mixtureof substances intended to destroy orrepel insects.
Integrator or Mixed-use site - Streamsampling site located at an outlet of adrainage basin that contains multipleenvironmental settings. Most integra-tor sites are on major streams with relatively large drainage areas.
Intensive Fixed Sites - Basic FixedSites with increased sampling fre-quency during selected seasonal peri-ods and analysis of dissolvedpesticides for 1 year. Most NAWQAStudy Units have one to two integratorIntensive Fixed Sites and one to fourindicator Intensive Fixed Sites.
Intermittent stream - A stream thatflows only when it receives water fromrainfall runoff or springs, or from somesurface source such as melting snow.
Intolerant organisms - Organismsthat are not adaptable to human alter-ations to the environment and thusdecline in numbers where human alterations occur.See also Tolerant species.
Irrigation return flow - The part ofirrigation applied to the surface that isnot consumed by evapotranspiration o
U.S. Geological Survey Circular 1162 37
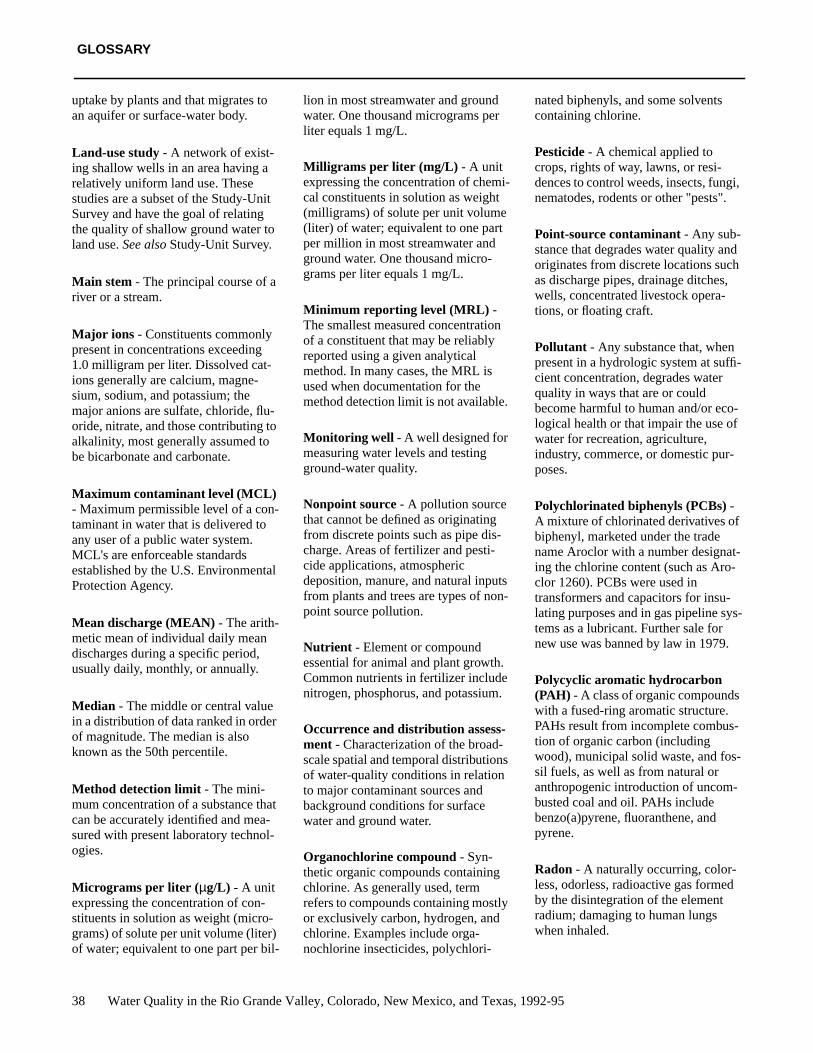
GLOSSARY
i,
d
-
-
-
-
-
uptake by plants and that migrates toan aquifer or surface-water body.
Land-use study - A network of exist-ing shallow wells in an area having arelatively uniform land use. Thesestudies are a subset of the Study-UnitSurvey and have the goal of relatingthe quality of shallow ground water toland use.See also Study-Unit Survey.
Main stem - The principal course of ariver or a stream.
Major ions - Constituents commonlypresent in concentrations exceeding1.0 milligram per liter. Dissolved cat-ions generally are calcium, magne-sium, sodium, and potassium; themajor anions are sulfate, chloride, flu-oride, nitrate, and those contributing toalkalinity, most generally assumed tobe bicarbonate and carbonate.
Maximum contaminant level (MCL)- Maximum permissible level of a con-taminant in water that is delivered toany user of a public water system.MCL's are enforceable standardsestablished by the U.S. EnvironmentalProtection Agency.
Mean discharge (MEAN)- The arith-metic mean of individual daily meandischarges during a specific period,usually daily, monthly, or annually.
Median - The middle or central valuein a distribution of data ranked in orderof magnitude. The median is alsoknown as the 50th percentile.
Method detection limit - The mini-mum concentration of a substance thatcan be accurately identified and mea-sured with present laboratory technol-ogies.
Micrograms per liter ( µg/L) - A unitexpressing the concentration of con-stituents in solution as weight (micro-grams) of solute per unit volume (liter)of water; equivalent to one part per bil-
lion in most streamwater and groundwater. One thousand micrograms perliter equals 1 mg/L.
Milligrams per liter (mg/L) - A unitexpressing the concentration of chemi-cal constituents in solution as weight(milligrams) of solute per unit volume(liter) of water; equivalent to one partper million in most streamwater andground water. One thousand micro-grams per liter equals 1 mg/L.
Minimum reporting level (MRL) -The smallest measured concentrationof a constituent that may be reliablyreported using a given analyticalmethod. In many cases, the MRL isused when documentation for themethod detection limit is not available.
Monitoring well - A well designed formeasuring water levels and testingground-water quality.
Nonpoint source- A pollution sourcethat cannot be defined as originatingfrom discrete points such as pipe dis-charge. Areas of fertilizer and pesti-cide applications, atmosphericdeposition, manure, and natural inputsfrom plants and trees are types of non-point source pollution.
Nutrient - Element or compoundessential for animal and plant growth.Common nutrients in fertilizer includenitrogen, phosphorus, and potassium.
Occurrence and distribution assess-ment - Characterization of the broad-scale spatial and temporal distributionsof water-quality conditions in relationto major contaminant sources andbackground conditions for surfacewater and ground water.
Organochlorine compound- Syn-thetic organic compounds containingchlorine. As generally used, termrefers to compounds containing mostlyor exclusively carbon, hydrogen, andchlorine. Examples include orga-nochlorine insecticides, polychlori-
nated biphenyls, and some solventscontaining chlorine.
Pesticide - A chemical applied tocrops, rights of way, lawns, or resi-dences to control weeds, insects, fungnematodes, rodents or other "pests".
Point-source contaminant - Any sub-stance that degrades water quality anoriginates from discrete locations suchas discharge pipes, drainage ditches,wells, concentrated livestock opera-tions, or floating craft.
Pollutant - Any substance that, whenpresent in a hydrologic system at sufficient concentration, degrades waterquality in ways that are or couldbecome harmful to human and/or ecological health or that impair the use ofwater for recreation, agriculture,industry, commerce, or domestic pur-poses.
Polychlorinated biphenyls (PCBs) -A mixture of chlorinated derivatives ofbiphenyl, marketed under the tradename Aroclor with a number designating the chlorine content (such as Aro-clor 1260). PCBs were used intransformers and capacitors for insu-lating purposes and in gas pipeline systems as a lubricant. Further sale fornew use was banned by law in 1979.
Polycyclic aromatic hydrocarbon(PAH) - A class of organic compoundswith a fused-ring aromatic structure.PAHs result from incomplete combus-tion of organic carbon (includingwood), municipal solid waste, and fossil fuels, as well as from natural oranthropogenic introduction of uncom-busted coal and oil. PAHs includebenzo(a)pyrene, fluoranthene, andpyrene.
Radon - A naturally occurring, color-less, odorless, radioactive gas formedby the disintegration of the elementradium; damaging to human lungswhen inhaled.
38 Water Quality in the Rio Grande Valley, Colorado, New Mexico, and Texas, 1992-95

GLOSSARY
r-
l
-
.
Riparian - Areas adjacent to riversand streams with a high density, diver-sity, and productivity of plant and ani-mal species relative to nearby uplands.
Secondary maximum contaminantlevel (SMCL) - The maximum con-tamination level in public water sys-tems that, in the judgment of the U.S.Environmental Protection Agency, arerequired to protect the public welfare.SMCLs are secondary (nonenforce-able) drinking water regulations estab-lished by the USEPA for contaminantsthat may adversely affect the odor orappearance of such water.
Sediment quality guideline - Thresh-old concentration above which there isa high probability of adverse effects onaquatic life from sediment contamina-tion, determined using modified EPA(1996c) procedures.
Semivolatile organic compound(SVOC) - Operationally defined as agroup of synthetic organic compoundsthat are solvent-extractable and can bedetermined by gas chromatogra-phy/mass spectrometry. SVOCsinclude phenols, phthalates, and poly-cyclic aromatic hydrocarbons (PAHs).
Species diversity - An ecological con-cept that incorporates both the numberof species in a particular sampling areaand the evenness with which individu-als are distributed among the variousspecies.
Specific conductance- A measure ofthe ability of a liquid to conduct anelectrical current.
Stream-aquifer interactions - Rela-tions of water flow and chemistrybetween streams and aquifers that arehydraulically connected.
Stream reach- A continuous part of astream between two specified points.
Study Unit - A major hydrologic sys-tem of the United States in whichNAWQA studies are focused. StudyUnits are geographically defined by acombination of ground- and surface-water features and generally encom-pass more than 4,000 square miles ofland area.
Study-Unit Survey - Broad assess-ment of the water-quality conditions ofthe major aquifer systems of eachStudy Unit. The Study-Unit Surveyrelies primarily on sampling existingwells and, wherever possible, on exist-ing data collected by other agenciesand programs. Typically, 20 to 30wells are sampled in each of three tofive aquifer subunits.
Subsurface drain - A shallow draininstalled in an irrigated field to inter-cept the rising ground-water level andmaintain the water table at an accept-able depth below the land surface.
Suspended (as used in tables of chem-ical analyses) - The amount (concen-tration) of undissolved material in awater- sediment mixture. It is associ-ated with the material retained on a0.45- micrometer filter.
Synoptic sites- Sites sampled during ashort-term investigation of specificwater-quality conditions duringselected seasonal or hydrologic condi-tions to provide improved spatial reso-lution for critical water-qualityconditions.
Tissue study- The assessment of con-centrations and distributions of traceelements and certain organic contami-nants in tissues of aquatic organisms.
Trace element - An element found inonly minor amounts (concentrationsless than 1.0 milligram per liter) inwater or sediment; includes arsenic,cadmium, chromium, copper, lead,mercury, nickel, and zinc.
Urban Site - A site that has greaterthan 50 percent urbanized and lessthan 25 percent agricultural area.
Volatile organic compounds (VOCs)- Organic chemicals that have a highvapor pressure relative to their watersolubility. VOCs include componentsof gasoline, fuel oils, and lubricants, aswell as organic solvents, fumigants,some inert ingredients in pesticides,and some by-products of chlorine dis-infection.
Wasteway- A waterway used to drainexcess irrigation water dumped fromthe irrigation delivery system.
Water-quality criteria - Specific lev-els of water quality which, if reached,are expected to render a body of wateunsuitable for its designated use. Commonly refers to water-quality criteriaestablished by the U.S. EnvironmentaProtection Agency. Water-quality cri-teria are based on specific levels ofpollutants that would make the waterharmful if used for drinking, swim-ming, farming, fish production, orindustrial processes.
Water-quality guidelines - Specificlevels of water quality which, ifreached, may adversely affect humanhealth or aquatic life. These are nonenforceable guidelines issued by a gov-ernmental agency or other institution.
Water-quality standards - State-adopted and U.S. Environmental Pro-tection Agency-approved ambientstandards for water bodies. Standardsinclude the use of the water body andthe water-quality criteria that must bemet to protect the designated use oruses.
Water table - The point below theland surface where ground water isfirst encountered and below which theearth is saturated. Depth to the watertable varies widely across the country
U.S. Geological Survey Circular 1162 39

Levings and others • W
ater Quality in the R
io Grande Valley
USG
S Circular 1162 •
1998
NEWMEXICO
El Paso, Texas
Rio
Gra
nde
Albuquerque
COLORADO
National Water-Quality Assessment (NAWQA) ProgramRio Grande Valley
NAWQA