Science Data Earth System Atlantic Ocean CARINA data ...
18
Earth Syst. Sci. Data, 2, 17–34, 2010 www.earth-syst-sci-data.net/2/17/2010/ © Author(s) 2010. This work is distributed under the Creative Commons Attribution 3.0 License. Earth System Science Data Atlantic Ocean CARINA data: overview and salinity adjustments T. Tanhua 1 , R. Steinfeldt 2 , R. M. Key 3 , P. Brown 4 , N. Gruber 5 , R. Wanninkhof 6 , F. Perez 7 , A. K ¨ ortzinger 1 , A. Velo 7 , U. Schuster 4 , S. van Heuven 8 , J. L. Bullister 9 , I. Stendardo 5 , M. Hoppema 10 , A. Olsen 11,12 , A. Kozyr 13 , D. Pierrot 14 , C. Schirnick 1 , and D. W. R. Wallace 1 1 Leibniz-Institut f¨ ur Meereswissenschaften, Marine Biogeochemie, Kiel, Germany 2 Institut f ¨ ur Umweltphysik, Univerit¨ at Bremen, Bremen, Germany 3 Atmospheric and Oceanic Sciences Program, Princeton University, Princeton, NJ 08544, USA 4 School of Environmental Sciences, University of East Anglia, Norwich, NR4 7TJ, UK 5 Environmental Physics, Institute of Biogeochemistry and Pollutant Dynamics, ETH Zurich, Zurich, Switzerland 6 Atlantic Oceanographic and Meteorological Laboratory, NOAA, Miami Fl, 33149, USA 7 Instituto de Investigaciones Marinas – CSIC, Eduardo Cabello 6, 36208 Vigo, Spain 8 Department of Ocean Ecosystems, University of Groningen, Groningen, The Netherlands 9 Pacific Marine Environmental Laboratory/NOAA, 7600 Sand Point Way NE, Seattle, WA 98115-6349, USA 10 Alfred Wegener Institute for Polar and Marine Research, Postfach 120161, 27515 Bremerhaven, Germany 11 Bjerknes Centre for Climate Research, UNIFOB AS, All´ egaten 55, 5007 Bergen, Norway 12 Department of Chemistry, University of Gothenburg, 412 96 G¨ oteborg, Sweden 13 Carbon Dioxide Information Analysis Center, Oak Ridge National Laboratory, Oak Ridge, TN 37922, USA 14 Cooperative Institute of Marine and Atmospheric Sciences, U. Miami, Miami, FL 33149, USA Received: 17 June 2009 – Published in Earth Syst. Sci. Data Discuss.: 20 August 2009 Revised: 15 January 2010 – Accepted: 21 January 2010 – Published: 1 February 2010 Abstract. Water column data of carbon and carbon-relevant hydrographic and hydrochemical parameters from 188 previously non-publicly available cruise data sets in the Arctic Mediterranean Seas, Atlantic and Southern Ocean have been retrieved and merged into a new database: CARINA (CARbon dioxide IN the Atlantic Ocean). The data have gone through rigorous quality control procedures to assure the highest possible quality and consistency. The data for the pertinent parameters in the CARINA database were objectively examined in order to quantify systematic differences in the reported values, i.e. secondary quality control. Systematic biases found in the data have been corrected in the three data products: merged data files with measured, calculated and interpolated data for each of the three CARINA regions, i.e. the Arctic Mediterranean Seas, the Atlantic and the Southern Ocean. These products have been corrected to be internally consistent. Ninety-eight of the cruises in the CARINA database were conducted in the Atlantic Ocean, defined here as the region south of the Greenland-Iceland-Scotland Ridge and north of about 30 ◦ S. Here we present an overview of the Atlantic Ocean synthesis of the CARINA data and the adjustments that were applied to the data product. We also report the details of the secondary QC (Quality Control) for salinity for this data set. Procedures of quality control – including crossover analysis between stations and inversion analysis of all crossover data – are briefly described. Adjustments to salinity measurements were applied to the data from 10 cruises in the Atlantic Ocean region. Based on our analysis we estimate the internal consistency of the CARINA-ATL salinity data to be 4.1 ppm. With these adjustments the CARINA data products are consistent both internally as well as with GLODAP data, an oceanographic data set based on the World Hydrographic Program in the 1990s, and is now suitable for accurate assessments of, for example, oceanic carbon inventories and uptake rates and for model validation. Correspondence to: T. Tanhua ([email protected]) Published by Copernicus Publications.
Transcript of Science Data Earth System Atlantic Ocean CARINA data ...
Earth Syst. Sci. Data, 2, 17–34, 2010www.earth-syst-sci-data.net/2/17/2010/© Author(s) 2010. This work is distributed underthe Creative Commons Attribution 3.0 License.
Earth SystemScience Data
Atlantic Ocean CARINA data:overview and salinity adjustments
T. Tanhua1, R. Steinfeldt2, R. M. Key3, P. Brown4, N. Gruber5, R. Wanninkhof6, F. Perez7,A. K ortzinger1, A. Velo7, U. Schuster4, S. van Heuven8, J. L. Bullister 9, I. Stendardo5, M. Hoppema10,
A. Olsen11,12, A. Kozyr13, D. Pierrot14, C. Schirnick1, and D. W. R. Wallace1
1Leibniz-Institut fur Meereswissenschaften, Marine Biogeochemie, Kiel, Germany2Institut fur Umweltphysik, Univeritat Bremen, Bremen, Germany
3Atmospheric and Oceanic Sciences Program, Princeton University, Princeton, NJ 08544, USA4School of Environmental Sciences, University of East Anglia, Norwich, NR4 7TJ, UK
5Environmental Physics, Institute of Biogeochemistry and Pollutant Dynamics, ETH Zurich, Zurich, Switzerland6Atlantic Oceanographic and Meteorological Laboratory, NOAA, Miami Fl, 33149, USA
7Instituto de Investigaciones Marinas – CSIC, Eduardo Cabello 6, 36208 Vigo, Spain8Department of Ocean Ecosystems, University of Groningen, Groningen, The Netherlands
9Pacific Marine Environmental Laboratory/NOAA, 7600 Sand Point Way NE, Seattle, WA 98115-6349, USA10Alfred Wegener Institute for Polar and Marine Research, Postfach 120161, 27515 Bremerhaven, Germany
11Bjerknes Centre for Climate Research, UNIFOB AS, Allegaten 55, 5007 Bergen, Norway12Department of Chemistry, University of Gothenburg, 412 96 Goteborg, Sweden
13Carbon Dioxide Information Analysis Center, Oak Ridge National Laboratory, Oak Ridge, TN 37922, USA14Cooperative Institute of Marine and Atmospheric Sciences, U. Miami, Miami, FL 33149, USA
Received: 17 June 2009 – Published in Earth Syst. Sci. Data Discuss.: 20 August 2009Revised: 15 January 2010 – Accepted: 21 January 2010 – Published: 1 February 2010
Abstract. Water column data of carbon and carbon-relevant hydrographic and hydrochemical parametersfrom 188 previously non-publicly available cruise data sets in the Arctic Mediterranean Seas, Atlantic andSouthern Ocean have been retrieved and merged into a new database: CARINA (CARbon dioxide IN theAtlantic Ocean). The data have gone through rigorous quality control procedures to assure the highest possiblequality and consistency. The data for the pertinent parameters in the CARINA database were objectivelyexamined in order to quantify systematic differences in the reported values, i.e. secondary quality control.Systematic biases found in the data have been corrected in the three data products: merged data files withmeasured, calculated and interpolated data for each of the three CARINA regions, i.e. the Arctic MediterraneanSeas, the Atlantic and the Southern Ocean. These products have been corrected to be internally consistent.Ninety-eight of the cruises in the CARINA database were conducted in the Atlantic Ocean, defined here as theregion south of the Greenland-Iceland-Scotland Ridge and north of about 30◦ S. Here we present an overviewof the Atlantic Ocean synthesis of the CARINA data and the adjustments that were applied to the data product.We also report the details of the secondary QC (Quality Control) for salinity for this data set. Procedures ofquality control – including crossover analysis between stations and inversion analysis of all crossover data– are briefly described. Adjustments to salinity measurements were applied to the data from 10 cruises inthe Atlantic Ocean region. Based on our analysis we estimate the internal consistency of the CARINA-ATLsalinity data to be 4.1 ppm. With these adjustments the CARINA data products are consistent both internallyas well as with GLODAP data, an oceanographic data set based on the World Hydrographic Program in the1990s, and is now suitable for accurate assessments of, for example, oceanic carbon inventories and uptakerates and for model validation.
Correspondence to:T. Tanhua([email protected])
Published by Copernicus Publications.
brought to you by COREView metadata, citation and similar papers at core.ac.uk
provided by OceanRep
18 T. Tanhua et al.: Atlantic Ocean CARINA data: overview and salinity adjustments
Data Product Data Product Exchange File Exchange File UnitsParameter Name Flag Name Parameter Name Flag Name
station STANBRday DATEmonth DATEyear DATElatitude LATITUDE decimal degreeslongitude LONGITUDE decimal degreescruisenodepth meterstemperature CTDTMP ◦Csalinity sf SALNTY SALNTY FLAG Wctdsal ctdsf CTDSAL CTDSALFLAG Wpressure CTDPRS decibars
For a complete list of all parameters available in CARINA see Key et al. (2009). Note the different names for the parameters in the individualcruise files and the merged data product.
Data coverage and parameter measured
Repository-Reference:doi:10.3334/CDIAC/otg.CARINA.ATL.V1.0Available at:http://cdiac.ornl.gov/oceans/CARINA/Carinainv.htmlCoverage: 60◦ S–75◦N; 80◦W–34◦ ELocation Name: Atlantic OceanDate/Time Start: 1977-10-7Date/Time End: 2006-02-02
1 Introduction
CARINA (CARbon IN the Atlantic Ocean) is a data set ofcarbon and carbon-relevant data from hydrographic cruisesin the Arctic Mediterranean Seas, Atlantic and SouthernOceans. The project started as an informal, unfunded projectin Delmenhorst, Germany, in 1999 during the workshop on“CO2 in the North Atlantic”, with the main goal to createa uniformly formatted data set of carbon relevant variablesin the ocean to be used for accurate assessments of oceaniccarbon inventories and uptake rates. Collection of data andthe quality control of the data have been a main focus ofthe CARINA project. Both primary and secondary qual-ity control (QC) of the data have been performed. This re-port provides an overview of the Atlantic Ocean part of theCARINA data set and describes the consistency analysis ofsalinity for this data set. A more comprehensive descriptionof the complete CARINA database can be found in Key etal. (2009) as well as in other, more specialized, papers in thisspecial issue. CARINA consists of two parts: the first partis formed by the set of individual cruise files where all thedata reported by the data originators are stored. The qual-ity flags that accompany the data are in many cases thoseoriginally reported, and augmented by those assigned byR. Key. These files are in the so-called WHP-exchange for-mat (http://whpo.ucsd.edu/format.html), where the first lines
consist of the condensed metadata. There are essentiallyno calculated or interpolated values in the individual cruisefiles, with the exceptions of pressure calculated from depthand some bottle salinities that were taken from CTD salinity(hereafter ctdsal). No adjustments have been applied to anyof these values with the exception that all pH measurementswere converted to the seawater pH scale at 25◦C.
The second part of CARINA consists of three mergedquality controlled and adjusted data files; one each for theAtlantic Ocean, Arctic Mediterranean Seas and SouthernOcean regions. Data that were found to be questionable(QC flag=3) or bad (QC flag=4) have been removed inthese data sets, but they are retained with appropriate flagsin the individual cruise files. Occasionally all values of cer-tain parameter obtained during a complete cruise was foundto be questionable, and while these data have not necessar-ily been flagged as such in the individual cruise files, theyhave been removed from the data product. In these cases theflags in the individual files are the ones assigned during theprimary QC. The merged files contain all the CARINA dataand also include: 1) interpolated values for nutrients, oxygenand salinity if those data are missing and the interpolationcould be made according to the criteria described in Key etal. (2009); and 2) calculated carbon parameters; e.g. if Totalinorganic Carbon Dioxide (TCO2) and Total Alkalinity (TA)were measured, pH was calculated, 3) instances where bot-tle salinity was missing or bad were replaced with ctdsal. Inmany cases there are additional parameters in the individualcruise files which have not undergone secondary QC, such as∆14C, δ13C and SF6. These are included in the merged datafiles as well.
This paper is an overview of the quality control of theAtlantic Ocean subset of the CARINA data (i.e. CARINA-ATL) and contains the specifics of the salinity quality con-trol. The Atlantic Ocean region of CARINA is loosely de-fined as the area between of the Greenland-Scotland Ridgeand 30◦ S, see Fig. 1. More details on other parameters for
Earth Syst. Sci. Data, 2, 17–34, 2010 www.earth-syst-sci-data.net/2/17/2010/
T. Tanhua et al.: Atlantic Ocean CARINA data: overview and salinity adjustments 19
CARINA salinity data in the North Atlantic
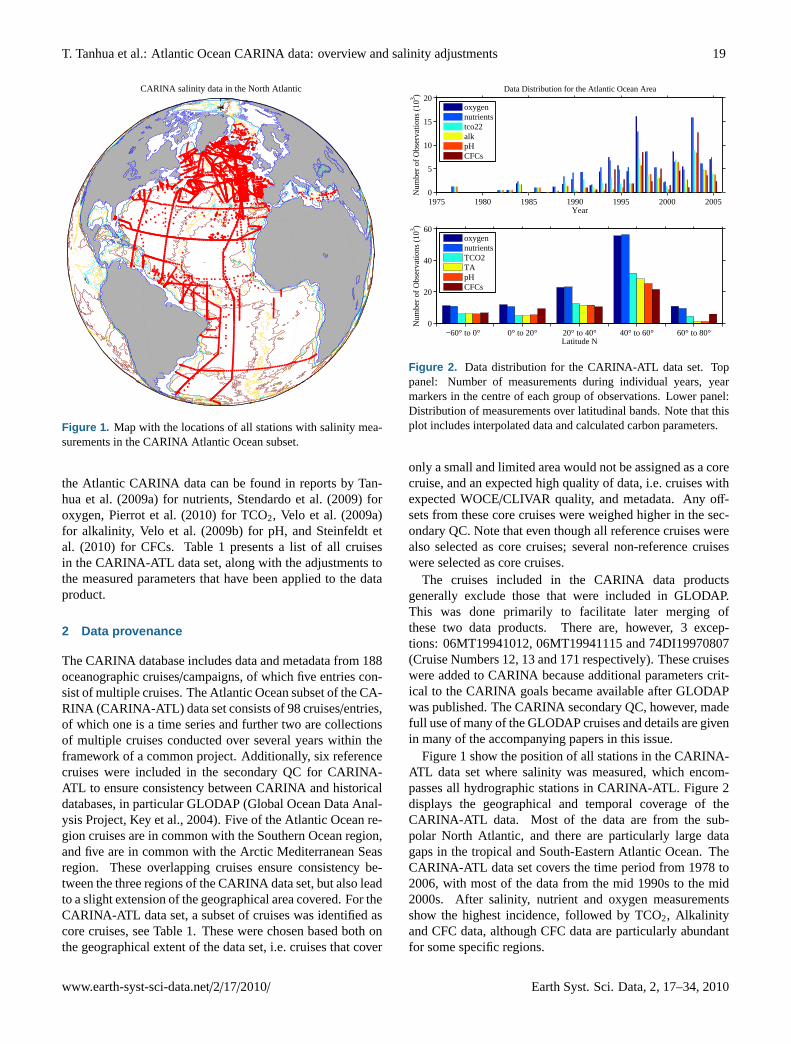
Figure 1. Figure 1. Map with the locations of all stations with salinity mea-
surements in the CARINA Atlantic Ocean subset.
the Atlantic CARINA data can be found in reports by Tan-hua et al. (2009a) for nutrients, Stendardo et al. (2009) foroxygen, Pierrot et al. (2010) for TCO2, Velo et al. (2009a)for alkalinity, Velo et al. (2009b) for pH, and Steinfeldt etal. (2010) for CFCs. Table 1 presents a list of all cruisesin the CARINA-ATL data set, along with the adjustments tothe measured parameters that have been applied to the dataproduct.
2 Data provenance
The CARINA database includes data and metadata from 188oceanographic cruises/campaigns, of which five entries con-sist of multiple cruises. The Atlantic Ocean subset of the CA-RINA (CARINA-ATL) data set consists of 98 cruises/entries,of which one is a time series and further two are collectionsof multiple cruises conducted over several years within theframework of a common project. Additionally, six referencecruises were included in the secondary QC for CARINA-ATL to ensure consistency between CARINA and historicaldatabases, in particular GLODAP (Global Ocean Data Anal-ysis Project, Key et al., 2004). Five of the Atlantic Ocean re-gion cruises are in common with the Southern Ocean region,and five are in common with the Arctic Mediterranean Seasregion. These overlapping cruises ensure consistency be-tween the three regions of the CARINA data set, but also leadto a slight extension of the geographical area covered. For theCARINA-ATL data set, a subset of cruises was identified ascore cruises, see Table 1. These were chosen based both onthe geographical extent of the data set, i.e. cruises that cover
1975 1980 1985 1990 1995 2000 20050
5
10
15
20
Year
Num
ber
of O
bser
vatio
ns (
103 )
Data Distribution for the Atlantic Ocean Area
oxygennutrientstco22alkpHCFCs
−60° to 0° 0° to 20° 20° to 40° 40° to 60° 60° to 80°0
20
40
60
Latitude N
Num
ber
of O
bser
vatio
ns (
103 )
oxygennutrientsTCO2TApHCFCs
Figure 2. Data distribution for the CARINA-ATL data set. Toppanel: Number of measurements during individual years, yearmarkers in the centre of each group of observations. Lower panel:Distribution of measurements over latitudinal bands. Note that thisplot includes interpolated data and calculated carbon parameters.
only a small and limited area would not be assigned as a corecruise, and an expected high quality of data, i.e. cruises withexpected WOCE/CLIVAR quality, and metadata. Any off-sets from these core cruises were weighed higher in the sec-ondary QC. Note that even though all reference cruises werealso selected as core cruises; several non-reference cruiseswere selected as core cruises.
The cruises included in the CARINA data productsgenerally exclude those that were included in GLODAP.This was done primarily to facilitate later merging ofthese two data products. There are, however, 3 excep-tions: 06MT19941012, 06MT19941115 and 74DI19970807(Cruise Numbers 12, 13 and 171 respectively). These cruiseswere added to CARINA because additional parameters crit-ical to the CARINA goals became available after GLODAPwas published. The CARINA secondary QC, however, madefull use of many of the GLODAP cruises and details are givenin many of the accompanying papers in this issue.
Figure 1 show the position of all stations in the CARINA-ATL data set where salinity was measured, which encom-passes all hydrographic stations in CARINA-ATL. Figure 2displays the geographical and temporal coverage of theCARINA-ATL data. Most of the data are from the sub-polar North Atlantic, and there are particularly large datagaps in the tropical and South-Eastern Atlantic Ocean. TheCARINA-ATL data set covers the time period from 1978 to2006, with most of the data from the mid 1990s to the mid2000s. After salinity, nutrient and oxygen measurementsshow the highest incidence, followed by TCO2, Alkalinityand CFC data, although CFC data are particularly abundantfor some specific regions.
www.earth-syst-sci-data.net/2/17/2010/ Earth Syst. Sci. Data, 2, 17–34, 2010

20 T. Tanhua et al.: Atlantic Ocean CARINA data: overview and salinity adjustments
Table 1. This table lists all cruises in the CARINA dataset that are part of the Atlantic Ocean subset, and the additional reference cruisesthat were used for consistency with historical cruises (i.e. GLODAP). The table lists: CARINA cruise #; EXPOCODE; cruises used ascore cruises (1) in the analysis; and adjustment values applied to the data product, additive for: Salinity (ppm), ctdsal (ppm), total alkalinity(µmol kg−1), TCO2 (µmol kg−1), and pH; multiplicative for: nitrate, phosphate, silicate, oxygen, CFC12, CFC11, CFC113, CCl4. ND denotes“no data”, i.e. the parameter was not measured, NC denotes “not considered”, i.e. no adjustments was applied due to ambiguous evidence;“poor” indicates that the data quality was of low quality and is therefore not included in the data product.
# EXPOCODE core salinity ctd-sal tco2 alkalinity pH nitrate phosphate silicate oxygen F12 F11 F113 CCl4
5 06BE20001128 0 −3 −3 ND ND ND ND ND ND ND 1 1 ND ND6 06GA19960613 0 10 NC 0 ND ND ND ND ND ND ND ND ND ND7 06GA20000506 1 0 NC 0 0 ND 1 1 1.06 0.99 ND ND ND ND8 06MT19920316 0 NC NC poor NC ND NC NC NC ND ND ND ND ND9 06MT19920509 0 −20 NC 0 0 ND 1 0.90 1 0.96 ND ND ND ND10 06MT19920701 0 0 NC poor 0 ND ND ND ND ND ND ND ND ND11 06MT19940219 0 0 NC ND ND ND ND ND ND 1 1 1 ND ND12 06MT19941012 0 0 NC 0 −25 poor 1 1 1 1 1 1 1 113 06MT19941115 1 0 NC 0 ND ND 0.98 1 1 1 1 1 ND ND14 06MT19960613 0 −10 NC 5 0 ND 1 1.15 1.11 0.98 ND ND ND ND15 06MT19960910 0 0 NC ND 0 −0.007 1 1 1.05 0.985 ND ND ND ND16 06MT19970107 0 0 NC NC 0 NC 1 1.05 1.13 0.95 ND ND ND ND17 06MT19970515 1 10 NC 0 0 ND 1.05 0.95 1 0.99 1 1 ND ND18 06MT19970707 1 0 NC 0 0 ND 1.02 ND 1 1 1 1 ND ND19 06MT19970815 1 0 NC 0 ND ND 1 1 1 1 ND 1 ND ND20 06MT19990610 0 ND 5 0 ND 0 1 1 1 0.99 1 1 ND ND21 06MT19990711 0 ND 0 0 ND 0 1 1.04 1 0.99 1 1 ND ND22 06MT19990813 0 0 NC ND ND ND ND ND ND ND 1 1 ND ND23 06MT20010507 0 0 NC 0 0 −0.008 1 1.11 1 0.99 1 1 ND ND24 06MT20010620 0 ND 0 ND ND ND ND ND ND ND 1 1 ND ND25 06MT20010717 0 0 NC 0 0 −0.005 1 1.25 1 1 1 1 ND ND26 06MT20011018 0 NC NC NC NC ND ND ND ND NC NC NC NC ND27 06MT20020607 0 0 0 ND ND ND ND ND ND 0.99 1 1 ND ND28 06MT20021013 0 ND 20 NC NC ND 1 1 0.92 NC ND ND ND ND29 06MT20030626 0 ND 0 ND ND ND ND ND ND ND 1 1 ND ND30 06MT20030723 1 0 0 0 0 0 1 1 1 1 1 1 ND ND31 06MT20030831 0 ND 0 ND ND ND ND ND ND ND 1 1 ND ND32 06MT20040311 1 ND 0 0 0 ND 1 0.97 1 1 1 1 ND 137 18HU19920527 0 0 NC −9 ND ND 1 0.98 1 1 1.05 1 ND 138 18HU19930405 0 NC NC NC ND ND NC NC NC NC ND ND ND ND39 18HU19930617 1 0 NC 0 ND ND 1 1 1 1 1 1 1 140 18HU19931105 0 0 NC 0 ND ND 1 1 1 0.98 1 1 poor 141 18HU19940524 0 0 NC 0 ND ND 1 0.89 1 0.99 1 1.05 poor 142 18HU19941012 0 0 NC 0 ND ND 1 1 1 0.98 poor poor 1 143 18HU19950419 0 0 NC 0 ND ND 1 1 1 1 poor 1 1 poor44 18HU19970509 1 0 NC 0 6 ND 1 1 1 1 1 1 poor poor51 29CS19771007 0 NC ND ND NC NC NC NC NC NC ND ND ND ND52 29CS19930510 0 0 NC ND 7 0.017 1.03 1 NC 1 ND ND ND ND53 29GD19821110 0 0 NC ND 0 0.024 1.02 0.98 ND 1.04 ND ND ND ND54 29GD19831201 0 NC ND ND NC NC NC NC NC NC ND ND ND ND55 29GD19840218 0 0 NC ND 6 0.023 0.95 1 1 1 ND ND ND ND56 29GD19840711 0 0 NC ND 0 −0.017 1 1 1 0.98 ND ND ND ND57 29GD19860904 0 0 NC ND 6 0.032 1 1 1 1 ND ND ND ND60 29HE19980730 0 ND −10 0 0 0 1.07 poor 1.14 1 ND ND ND ND61 29HE20010305 0 ND 0 ND −6 0.005 1 1 1 0.99 ND ND ND ND62 29HE20020304 1 ND 0 ND 0 0 1 1 1 1 ND ND ND ND63 29HE20030408 0 0 ND NC 0 0 1 1.12 1.08 1 ND ND ND ND64 31AN19890420 0 0 NC 0 −10 ND 1 1 1 1 ND ND ND ND65 316N19971005 0 0 ND 0 8 ND ND ND ND 1 ND ND ND ND66 316N20010627 0 0 ND NC NC ND ND ND ND ND ND ND ND ND68 316N20030922 1 0 ND 0 0 ND 1 1 1 1 1 1 1 169 316N20031023 1 0 ND 0 0 ND 1 1.03 1 1 1 1 1 171 32EV19910328 0 0 ND ND ND ND 1.05 1 1 1 ND ND ND ND81 32OC19950529 0 0 ND NC ND ND ND ND ND 1 ND ND ND ND84 33LK19960415 0 0 NC 5 ND −0.018 1 1 1 1 1.1 1 ND ND85 33RO19980123 1 0 ND 0 0 0 1 1 1 0.99 1 1 1 186 33RO20030604 1 0 ND 0 0 0 1 1 1 1 1 1 1 ND87 33RO20050111 1 0 ND 0 0 0 1 1.03 1 1 1 1 1 ND89 33SW20010102 0 NC ND NC NC ND NC NC NC NC ND ND ND ND90 33SW20030418 0 NC ND NC NC ND ND ND ND ND ND ND ND ND
Earth Syst. Sci. Data, 2, 17–34, 2010 www.earth-syst-sci-data.net/2/17/2010/

T. Tanhua et al.: Atlantic Ocean CARINA data: overview and salinity adjustments 21
Table 1. Continued.
# EXPOCODE core salinity ctd-sal tco2 alkalinity pH nitrate phosphate silicate oxygen F12 F11 F113 CCl4
91 34AR19970805 0 ND NC ND ND ND 1.05 1.04 1.15 NC 1 0.95 1 192 35A320010203 0 0 ND ND 0 0 0.98 1 ND 1 ND ND ND ND93 35A320010322 0 NC ND ND 0 0 0.98 1 ND 1 ND ND ND ND94 35LU19890509 0 0 ND ND 0 0.024 1 1 1 1 ND ND ND ND95 35LU19950909 0 0 NC 9 ND −0.028 1 1 1 1 1 0.9 ND ND106 35TH19990712 0 ND 0 6 −6 −0.008 1 poor 1 1 ND 0.85 ND ND107 35TH20010823 0 NC ND ND 0 0 1 0.96 1.07 1 ND ND ND ND108 35TH20020611 1 0 ND ND 0 0 1 0.96 1 1 ND ND ND ND109 35TH20040604 1 5 ND ND 0 0 0.96 1.10 0.98 1 ND ND ND ND113 49NZ20031106 1 0 ND 0 0 0 1 1 1 1 1 0.95 ND ND125 58AA20010527 0 0 ND 0 0 ND ND ND ND 1 0.95 1 ND ND130 58JH19920712 0 NC ND NC ND ND NC NC NC NC ND ND ND ND135 58JH19940723 0 NC NC NC ND ND NC poor NC NC poor poor poor poor151 64PE19960618 0 0 ND ND ND ND 1 1 1 1 ND ND ND ND152 64PE20000926 0 ND 0 9 ND ND 1 0.96 1 1.01 ND ND ND ND153 64TR19890731 0 0 ND 0 14 ND 0.96 poor 1 1 ND ND ND ND154 64TR19900417 0 ND 0 poor 14 ND 1 0.96 1 1 ND ND ND ND155 64TR19900701 1 0 0 7 ND ND 1 1 1 1.02 ND ND ND ND156 64TR19900714 0 0 ND 0 ND ND 1 1 1 1.015 ND ND ND ND157 64TR19910408 1 0 ND 6 ND ND 1 0.93 1 1.015 ND ND ND ND158 67SL19881117 0 NC ND ND NC NC NC ND NC NC ND ND ND ND159 74AB19900528 0 NC ND NC ND ND 1.11 1 NC poor ND ND ND ND160 74AB19910501 0 0 NC ND 5 0.022 1 1 0.97 1 ND ND ND ND161 74AB19910614 0 NC ND NC NC ND NC NC NC ND ND ND ND ND162 74AB19910712 0 NC ND ND ND ND NC ND 0.90 1.07 ND ND ND ND164 74AB20050501a 0 0 ND 0 0 ND 0.98 0.97 0.93 0.94 ND ND ND ND164 74AB20050501b 0 0 ND 0 0 ND 0.98 0.97 0.93 1 ND ND ND ND165 74DI19890511 0 0 NC NC ND NC NC ND ND poor ND ND ND ND166 74DI19890612 0 20 ND NC ND ND poor ND poor poor ND ND ND ND167 74DI19890716 0 0 ND ND ND ND poor poor 1 poor ND ND ND ND168 74DI19900425 0 NC NC NC ND NC NC NC NC NC ND ND ND ND169 74DI19900515 0 0 NC NC ND ND NC NC NC ND ND ND ND ND170 74DI19900612 0 0 NC −7 15 NC 0.95 1.10 poor ND ND ND ND ND171 74DI19970807 1 0 ND 0 0 −0.005 1 0.97 1 1 1 1 ND ND172 74DI19980423 1 0 ND ND −8.5 0.018 1 1 1 1 ND ND ND ND173 74DI20040404 1 0 NC 0 0 ND 0.97 1 0.98 1 1 1 1 1185 IrmingerSea 0 NC NC NC ND ND NC NC NC NC ND ND ND ND187 OMEX1NA 0 ND 0 poor poor poor 1 1 1 1 ND ND ND ND188 OMEX2 0 0 0 ND -8 ND 1 1 NC 1 ND ND ND NDND 316N19970815 1 0 NC 0 0 −0.01 1 1 1 1 1 1 1 NDND 316N19970717 1 0 NC 0 0 −0.009 1 ND 1 1 1 1 ND NDND 29HE19920714 1 0 NC poor 0 poor 1 poor 0.97 1 1 1 ND NDND 316N19961102 1 0 NC 0 0 0 1 0.96 1 1 ND ND ND NDND 323019940104 1 0 NC 0 −8 −0.009 1 1 0.98 1 1 1 ND NDND 317519930704 1 0 NC 0 0 0 1 1 1.03 1.02 1 0.95 ND ND
a Stations 1:43b Stations 44:end
The individual cruises/campaigns are uniquely identifiedby an EXPOCODE. These identifiers consist of two charac-ters identifying the country code of the research vessel, fol-lowed by the two character research vessel NODC (NationalOceanographic Data Center) code. The last eight charactersdenote the starting date of the cruise (as YYYYMMDD). Forinstance, the EXPOCODE 06MT20040311 means that thiscruise was conducted on the German (06) ship Meteor (MT)
and that the cruise departed on 11 March 2004. In a fewcases when the sailing date was unknown, the EXPOCODEis derived from the date of the first station occupied. The CA-RINA Atlantic Ocean collection contains data collected byseveral nations on a large number of research vessels in theframework of several nationally and internationally fundedprojects; see Table 2 for a listing.
www.earth-syst-sci-data.net/2/17/2010/ Earth Syst. Sci. Data, 2, 17–34, 2010

22 T. Tanhua et al.: Atlantic Ocean CARINA data: overview and salinity adjustments
Table 2. List of ships that contribute to the CARINA Atlantic dataset. Ships with an * symbol are included in the CARINA-ATLdata set under the entry “OMEX1NA”, NA denotes unknown EX-POCODE.
NODC Ship CODE Ship name Country
06GA Gauss Germany06MT Meteor Germany18HU Hudson Canada29CS Cornide de Saavedra Spain29GD Garcia del Cid Spain29HE Hesperides Spain316N Knorr USA3175 Baldrige USA3230 Maurice Ewing USA32EV Endeavor USA33LK Edwin Link USA33RO Ronald H. Brown USA33SW Seward Johnson USA34AR Aranda Finland35A3 L’Atalante France35LU LeNoroit France35TH Thalassa France49NZ Mirai Japan58JH Johan Hjort Norway64PE Pelagia Netherlands64TR Tyro Netherlands67SL Professor Siedlecki Poland74AB Charles Darwin UK74DI Discovery UKNA Bjarni Saemundsson* Iceland46FR Arni Fridriksson* Iceland06PO Poseidon* Germany11BE Belgica* Belgium06AZ Valdivia* GermanyNA Madornina* Spain
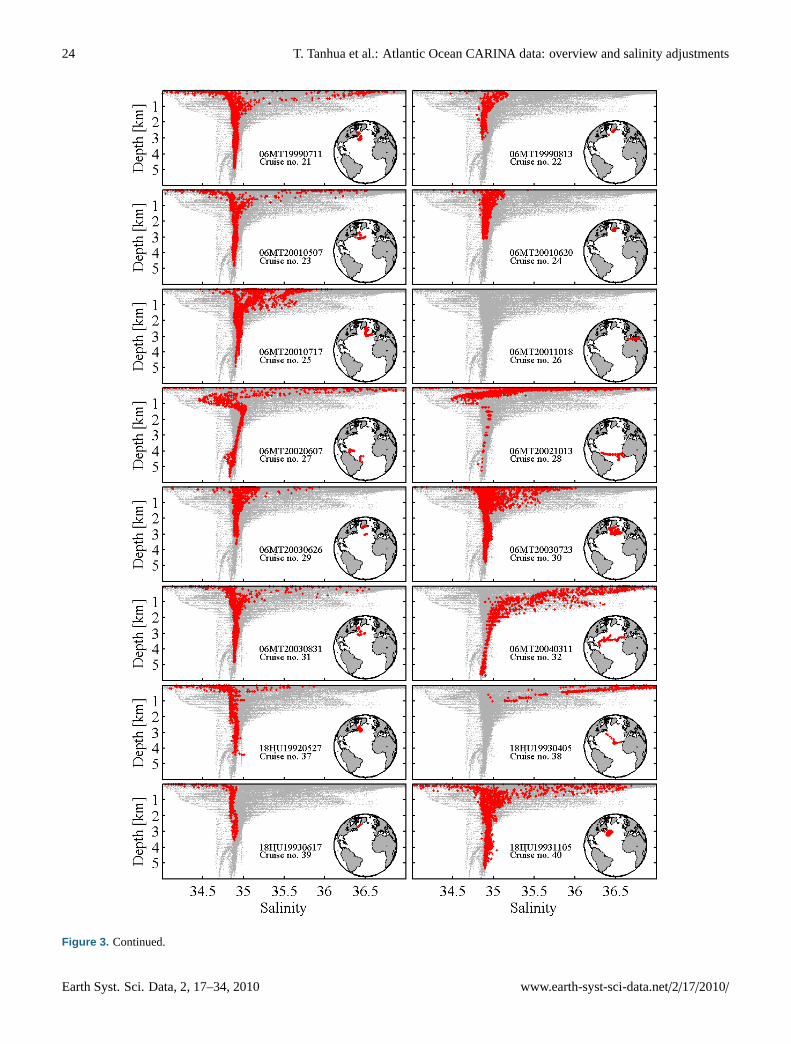
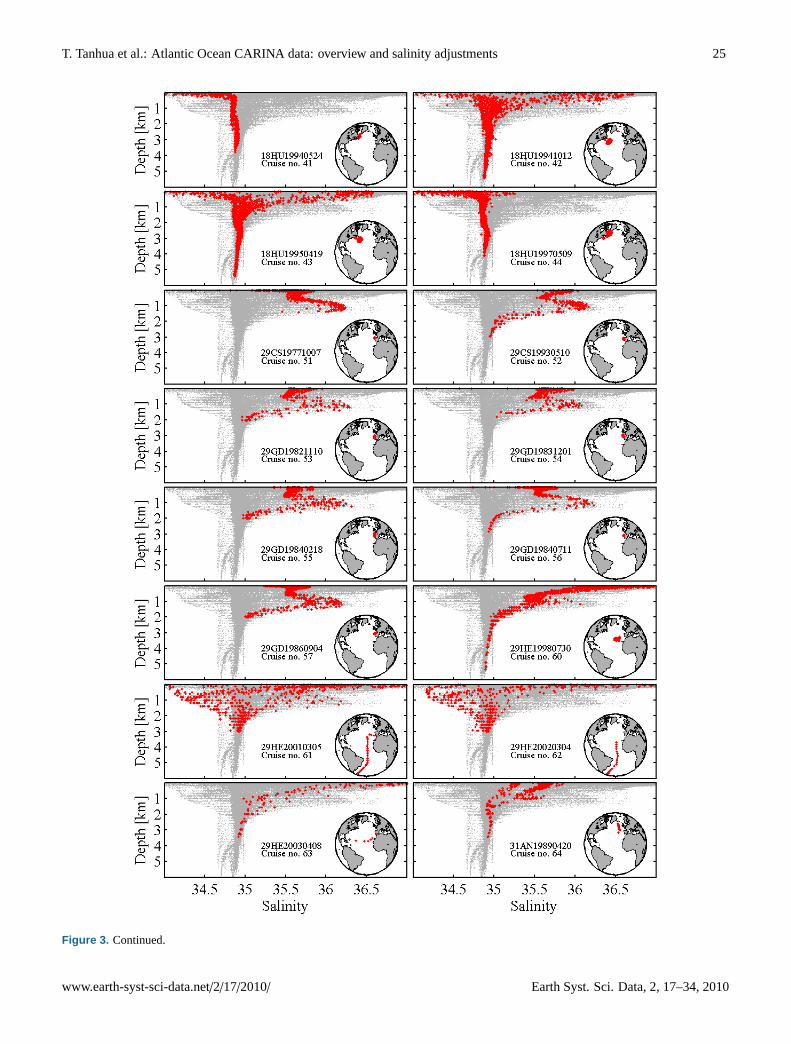
The individual cruise tracks are shown in Fig. 3, alongwith the salinity profiles after application of the adjustments.Note that a common salinity range is used for easy compari-son, but it causes the salinity data for the Mediterranean Seato be off-scale.
3 Computational analysis approach
Our quality control procedures are comprised of two distinctsteps. First the reported measurements are objectively stud-ied in order to identify outliers and obvious errors, i.e. 1stlevel QC. Secondly, we quantify systematic differences in thereported values in a process called secondary QC. These QCprocesses were performed on the post-cruise data sets as re-ported by the data originators, and are distinct from the qual-ity assurance (QA) procedures originally performed by eachcruise measurement team.
The single most important tool in the secondary QC of thesalinity data was the crossover analysis. Crossover analysisis an objective comparison of deep water data from one cruisewith data from other cruises in the same area (e.g. Sabineet al., 1999; Gouretski and Jancke, 2001; Johnson et al.,2001; Sabine et al., 2005), see alsohttp://cdiac.esd.ornl.gov/oceans/glodap/crossover.html, where the concept was laidout. For the six reference cruises used in this study and forthree cruises present in both CARINA and GLODAP, sec-ondary QC has been performed previously (Gouretski andJancke, 2001; Sabine et al., 2005), and adjustments were in-corporated in the GLODAP data product. In Table 3 we havecompared our results with those applied to GLODAP. Sincethere are differences in the use of additive and multiplica-tive adjustments between the work by Gouretski and Jancke(2001) and CARINA, the results are not directly comparable.Differences in adjustments between the two data products arediscussed in this report, by Stendardo et al. (2009) and byTanhua et al. (2009a).
Details on the methodology used in this work can be foundin Tanhua et al. (2009b). Cruise tracks that crossed eachother, or came within∼120 nm, were considered a crossover.For each crossover, comparisons of the salinity values weremade on surfaces of equal pressure (≈ constant depth) atdepths>1500 m depth. The use of equal pressure surfaces asopposed to equal density surfaces for salinity crossovers isdue to the direct influence of any salinity offsets to the den-sity, see Tanhua et al. (2009b). The results of each crossoveranalysis are an offset and a standard deviation of the off-set. These offsets and uncertainties were used to generatea set of suggested corrections for each cruise with a set ofleast square models, i.e. inversions, see Tanhua et al. (2009b).The corrections were critically examined with regards to lo-cal variability, time between the cruises and crossovers withcore cruises by the team. After the crossover analysis, andaided by the corrections suggested by the inversion analysis,the offsets in measured salinity were carefully scrutinized foreach cruise, and an adjustment was applied to the data prod-uct if all lines of evidence warranted such an adjustment.The adjustments were applied to the entire depth range ofthe cruise, but the adjustment can vary for parts of a cruise,Table 1. All suggested adjustments were vetted within theCARINA-ATL working group during a meeting in Paris inJune 2008.
4 Atlantic Ocean salinity analyses
In the CARINA data set there are two different salinity en-tries: “salinity” and “ctdsal”, where “salinity” refers to “bot-tle” salinity measured on board from discrete samples on wa-ter drawn from the water sampling bottles, whereas “ctdsal”refers to the equivalent salinity measurement derived fromthe CTD conductivity sensor at the depth the sampling bot-tle was “tripped”. It was often difficult to unambiguously
Earth Syst. Sci. Data, 2, 17–34, 2010 www.earth-syst-sci-data.net/2/17/2010/

T. Tanhua et al.: Atlantic Ocean CARINA data: overview and salinity adjustments 23
Figure 3. Salinity profiles and station locations of all the CARINA-ATL data; gray dots are all the salinity data; red dots the salinitybelonging to that particular cruise. Note that these are the adjusted data.
www.earth-syst-sci-data.net/2/17/2010/ Earth Syst. Sci. Data, 2, 17–34, 2010
24 T. Tanhua et al.: Atlantic Ocean CARINA data: overview and salinity adjustments
Figure 3. Continued.
Earth Syst. Sci. Data, 2, 17–34, 2010 www.earth-syst-sci-data.net/2/17/2010/
T. Tanhua et al.: Atlantic Ocean CARINA data: overview and salinity adjustments 25
Figure 3. Continued.
www.earth-syst-sci-data.net/2/17/2010/ Earth Syst. Sci. Data, 2, 17–34, 2010

26 T. Tanhua et al.: Atlantic Ocean CARINA data: overview and salinity adjustments
Figure 3. Continued.
Earth Syst. Sci. Data, 2, 17–34, 2010 www.earth-syst-sci-data.net/2/17/2010/

T. Tanhua et al.: Atlantic Ocean CARINA data: overview and salinity adjustments 27
Figure 3. Continued.
www.earth-syst-sci-data.net/2/17/2010/ Earth Syst. Sci. Data, 2, 17–34, 2010

28 T. Tanhua et al.: Atlantic Ocean CARINA data: overview and salinity adjustments
Figure 3. Continued.
Earth Syst. Sci. Data, 2, 17–34, 2010 www.earth-syst-sci-data.net/2/17/2010/

T. Tanhua et al.: Atlantic Ocean CARINA data: overview and salinity adjustments 29
Figure 3.
Figure 3. Continued.
Table 3. Table with comparison of previously applied adjustments for the reference cruises in CARINA-ATL; the first numbers are theadjustments suggested by the CARINA team, the number after the slash are the adjustments applied to the GLODAP data base (Gouretskiand Jancke, 2001; Sabine et al., 2005). The cruises above the bold line are reference cruises (i.e. are not part of CARINA), the three cruisesbelow the line are cruises that are included both in CARINA and GLODAP. The salinity adjustments are in ppm, all other adjustments inµmol/kg (when not a multiplicative factor). Note that all adjustments to the GLODAP data are additive whereas the nutrients and oxygencorrections for CARINA are multiplicative. All adjustments different from 0 (or 1 for multiplicative adjustments) for CARINA are printedin bold letters.
Cruise Salinity TCO2 Alk Nitrate Phosphate Silicate Oxygen
316N19970815 0/0.1 0/0 0/0 1/−0.37 1/−0.058 1/0.0 1/1.80316N19970717 0/0.7 0/0 0/0 1/−0.08 ND/−0.042 1/−0.8 1/0.2629HE19920714 0/−0.3 Poor/0 0/0 1/−0.34 Poor/−0.03 0.97/−1.9 1/0.31316N19961102 0 0/0 0/0 1/−0.29 0.96/−0.04 1/0.6 1/−0.48323019940104 0/−1.8 0/0 0/0 1/−0.06 1/−0.024 0.98/−1.6 1/−0.044317519930704a 0/−1.5 (−2.8) 0/0 (0) 0/0 (0) 1/0 (0) 1/0.038 (0.032) 1.03/0.4 (2.6) 1.02/0 (5.10)
06MT19941012 0/−0.6 0/NA −25/NA 1/0.07 1/−0.04 1/1.8 1/−3.0106MT19941115 0/1.5 0/NA NA 0.98/−0.79 1/−0.061 1/0.7 1/−0.1774DI19970807 0/2 0/NA 0/NA 1/−0.58 0.97/−0.115 1/−1.0 1/−6.79
a Station range for previous work is 1:37 (38:83).
distinguish between the two for some cruises due to lack ofmetadata, i.e. it is almost certain that some ctdsal values havebeen reported as “bottle” salinity. During the secondary QCwe always used salinity if available, but inserted ctdsal valuesif salinity data were missing. Note that the typical differencesbetween salinity and ctdsal (usually a few parts in∼35 000)or the differences between uncorrected and corrected salinity(typically less than 10 parts in 35 000) are relatively small,but within the cut-off limit of 0.005 salinity units (=5 ppm)for adjustments to salinity. For most geochemical measure-ments which require a correction for salinity (or for density),these differences do not significantly impact the precision ofthe reported geochemical measurement. Following the salin-ity QC procedures, the adjustments are then either applied to:1) salinity, if the secondary QC was solely based on the salin-ity values; 2) ctdsal if the secondary QC was based solely onctdsal values; or 3) to both salinity and ctdsal if those val-ues are consistent and the secondary QC was based on bothvalues. For the merged data product, ctdsal values have beenused to fill in gaps in the salinity values.
Additive adjustments were used for salinity, as opposed tolinear correction factors applied to oxygen and nutrient data,since an offset in the reference material, or lack of correction
to a reference material, is the most likely cause of the off-sets, as discussed in Tanhua et al. (2009b). However, giventhe relatively limited range of salinity values encountered inthe open ocean, multiplicative corrections would not haveyielded significantly different results. With one exception(cruise 06BE20001128, see below), no adjustments smallerthan 5 ppm (0.005 on the practical salinity scale PSS) wereapplied to the salinity, a threshold based on the typically re-ported values of precision of salinity measurements and theexpected natural variability of salinity distribution in the deepwater of the Atlantic Ocean.
Three lines of evidence were used for the determinationof adjustments for the salinity values: the corrections sug-gested by the inversion; the average of the crossover offsetfor a particular cruise; and the results of crossovers with corecruises. The final decision to perform an adjustment was fur-ther based on considerations of known hydrographic featuresin the Atlantic Ocean. The cruises included in the analy-sis span a time frame of about two decades, which meansthat the observations used in the inversions could have beeninfluenced by variability on annual to decadal time scales.Note that seasonal variability is most likely absent at depthsgreater than 1500 m. For example, the salinity in the deep
www.earth-syst-sci-data.net/2/17/2010/ Earth Syst. Sci. Data, 2, 17–34, 2010

30 T. Tanhua et al.: Atlantic Ocean CARINA data: overview and salinity adjustments
0 20 40 60 80 100 120 140 160 180−40
−20
0
20
40
Cor
rect
ion
Cruise Number
Salinity
Figure 4
Figure 4. Corrections for the CARINA-ATL salinity data as suggested by two WDLSQ inversions. The black symbols are results obtainedusing original (i.e. unadjusted) data; the red symbols are obtained using the adjusted data set. The black horizontal lines denote the thresholdof 5 ppm, no smaller adjustments were applied to the data.
waters of the Atlantic is influenced by decadal scale changessuch as the depth and intensity of convection in the LabradorSea, the salinity of the northern overflow waters, and thesalinity of the Mediterranean outflow. The Labrador Sea con-vection reached its maximum depth during the first half ofthe 1990s, resulting in very fresh and cold Labrador Sea Wa-ter (Yashayaev et al., 2007). Later on, the convection wasrestricted to shallower depths, and the Labrador Sea Waterbecame more saline due to mixing with other water massesadvected into the Labrador Sea from surrounding areas. Thenorthern overflow waters show a freshening trend from 1965until 2000 (Dickson et al., 2002), but this long term trendis overlaid by sub-decadal salinity variations. The tempo-ral and spatial salinity variability within the deep waters ismost pronounced in the following areas, 1) in the vicinityof the northern overflows, 2) in the Labrador Sea, and 3) inareas influenced by the Mediterranean outflow, i.e. Meddies(e.g. McDowell and Rossby, 1978; Richardson et al., 2000).Along the Deep Western Boundary Current, the variabilityof water mass properties is still detectable, but the amountof variability becomes smaller southwards. By strictly fol-lowing the results of the inversions, this variability could beerroneously removed from the data.
In the Eastern Atlantic south of the Iceland Basin andin the subtropical/tropical Atlantic remote from the westernboundary, the variability of water mass properties is muchsmaller. Thus, if the inversion suggests an adjustment for aspecific cruise in a region of high variability, it was checkedwhether crossovers of this certain cruise exist with othercruises in regions of lower variability. If these crossoverssupported the result from the inversion, the inversion resultwas taken as basis for the adjustment. Otherwise no adjust-ment was applied, or the magnitude of the correction is mod-ified compared to the inversion result.
As a last step in the secondary QC a second inversionwas conducted using the adjusted CARINA-ATL data, andall remaining corrections larger than 5 ppm were evaluatedagain. This process led to a small number of changes to theadjustments. All results and analyses made by the group
0 200 400 600
−50
0
50
100
F= 69 %WM = 4.1 ppm
L= 702
sal
offs
et
Figure 5. Offsets calculated for the salinity crossovers in theCARINA-ATL data after adjustments have been applied. WM: theweighted mean of the offsets (see text);F: the percentage of offsetsindistinguishable from 0 within their uncertainty;L: the number ofcrossovers.
for the secondary QC (crossovers and inversions), includ-ing figures for each individual crossover can be found onthe CARINA website (Tanhua et al., 2009b) athttp://cdiac.ornl.gov/oceans/CARINA/CARINA QC.html. In Fig. 4 wepresent the results of the WDLSQ (Weighted DampenedLeast Squares) inversions of the crossover offsets before andafter the adjustments were applied.
We used the offsets of the crossovers calculated for theadjusted data product to estimate the level of internal consis-tency of the salinity data, Fig. 5. We calculated the weightedmean (WM) using the absolute value of the offset (D) of Lcrossovers with the uncertainty (σ):
WM=
L∑i=1
D(i)/(σ(i))2
L∑i=1
1/(σ(i))2
Based on this analysis we estimate the internal consistencyof the CARINA-ATL salinity data to 4.1 ppm.
Earth Syst. Sci. Data, 2, 17–34, 2010 www.earth-syst-sci-data.net/2/17/2010/

T. Tanhua et al.: Atlantic Ocean CARINA data: overview and salinity adjustments 31
Table 4. Salinity corrections suggested by the WLSQ (WeightedLeast Square) and WDLSQ (Weighted Damped Least Square) in-versions used for the salinity adjustments for the Atlantic Oceanpart of CARINA, and the adjustments that were actually applied tothe data. Note that salinity is expressed in a thousands of a salinity(i.e. ppm). Only cruises for which the inversions suggest a signifi-cant (i.e.>5 ppm) correction are listed. NC stands for “Not Consid-ered” and no adjustment is applied, as described in the text.
CRUISE EXPOCODE Inversion Result Adjustment# WLSQ WDLSQ
5 06BE20001128 −6.62±2.22 −6.65±0 −36 06GA19960613 12.65±1.14 12.01±0.29 109 06MT19920509 −21.7±g1.3 −22.33±0.03 −2010 06MT19920701 −7.58±1.4 −8.06±0.07 014 06MT19960613 −10.37±1.15 −10.99±0.13 −1016 06MT19970107 11.91±1.88 11.26±0.05 017 06MT19970515 13.12±1.23 12.44±0.04 1020 06MT19990610 9.33±1.18 8.67±0.11 522 06MT19990813 18.23±4.27 17.32±0 023 06MT20010507 11.65±1.22 11.08±0.05 028 06MT20021013 20.37±1.96 19.68±0.01 2040 18HU19931105 −10.24±2.9 −10.62±0 055 29GD19840218 16.35±12.23 13.23±0 056 29GD19840711 23.76±2.42 23.04±0 060 29HE19980730 −9.46±1.21 −10.07±0.24 −1061 29HE20010305 12.49±4.09 11.5±0 091 34AR19970805 7.36±3.48 6.75±0 NC109 35TH20040605 4.98±1.02 4.32±0.12 5152 64PE20000926 12.7±1.95 12.03±0.01 0159 74AB19900528 25.23±1.37 24.56±0.1 NC162 74AB19910712 −14.29±3.07 −14.75±0 NC166 74DI19890612 17.17±1.28 16.52±0.07 20188 OMEX2 −8.66±1.31 −9.33±0.22 0
4.1 Salinity adjustments
In this section we present evidence supporting the adjust-ments applied to the NA salinity data set. Cruises wherelarge corrections were implied by the inversions but were notapplied are discussed as well. CARINA-ATL cruises not dis-cussed in this section all have salinity data consistent withthe majority of the CARINA-ATL cruises and the referencecruises. Corrections suggested by the inversions used for thisanalysis and the adjustment that were applied to salinity dataare listed in Table 4. The adjustments suggested to salinityfor the 9 GLODAP cruises included in the CARINA 2nd QCare all smaller than 5 ppm, with one exception.
A crossover results in anoffset for the cruise of inter-est (cruise A) relative to another cruise (cruise B), i.e. off-set= cruise A – cruise B. Thus if the offset is negative, thevalues from cruise A is lower than those from cruise B. Sim-ilarly, if the average of all crossovers for cruise A is negative,the values from cruise A are lower than the values from othercruises in the area. The inversion process results in a sug-gestion for acorrectionto cruise A. If cruise A is lower thanother cruises in the area, the correction will most likely bepositive, i.e. the data from cruise A will have to be corrected
upwards for consistency with other cruises. When we dis-cussadjustment, we refer to the correction that was actuallyapplied to the data.
06BE20001128, cruise #5
The inversion suggests a correction of−6 ppm. The offsetsfor the crossovers are, however, only in the range between 0and 4 ppm. As this is a tropical Atlantic cruise, the deep wa-ter crossovers are only slightly influenced by temporal salin-ity changes. A correction of−3 ppm has been suggested be-fore by an independent quality control from a repeated sec-tion along 16◦N (Steinfeldt, unpublished data). The sug-gested correction may be due to a salinity reference materialbatch problem during cruise 06BE20001128. Based on thisevidence, an adjustment of−3 ppm was applied to the salin-ity and ctdsal data.
06GA19960613, cruise #6
The inversions suggest corrections between 12 and 13 ppm.All crossovers in the eastern Atlantic have offsets rangingfrom −10 ppm and−15 ppm, independent of the time of thecruise. In the western Atlantic, the discrepancies of thecrossovers are larger, but this is not taken into account dueto the temporal variability in this region. Based on this ev-idence, an adjustment of 10 ppm was applied to the salinitydata.
06MT19920509, cruise #9
The crossover analysis indicates that the salinity is 10–30 ppm too high. Some crossovers involve cruises con-ducted a long time after this cruise, but as they are locatedwithin the North Eastern Atlantic, the temporal variabilityshould be small. The inversion suggests a correction of−20 ppm, which is well within the range of the offsets fromthe crossovers. Based on this evidence, an adjustment of−20 ppm was applied to the salinity data.
06MT19920701, cruise #10
The inversions suggest a correction of−8 ppm, but there areonly a few deep data south of the Scotland-Iceland ridge withhigh variability in the offsets. For instance, the crossoverwith the nearly synoptic 316N200310236 shows no offset;neither do the crossovers with the Nordic Seas cruises. Basedon this evidence, no adjustment was applied to the salinitydata.
06MT19960613, cruise #14
The inversions suggest a correction of−10 ppm for thiscruise. Most crossovers show an offset of about 10, at least
www.earth-syst-sci-data.net/2/17/2010/ Earth Syst. Sci. Data, 2, 17–34, 2010
32 T. Tanhua et al.: Atlantic Ocean CARINA data: overview and salinity adjustments
in the deep water range below the Mediterranean outflowwhere the temporal variability is large. One exception isthe crossover with 06MT20030723, with an offset between15 and 20 ppm. Based on this evidence, an adjustment of−10 ppm was applied to the salinity data.
06MT19970107, cruise #16
Only a few crossovers exist for 06MT19970107, all of whichare all located south of the Mediterranean outflow. The inver-sions suggest a correction on the order of 10 ppm. The depthstructures of the crossovers are such that the differences withthe other cruise are decreasing with depth, where the influ-ence of the Mediterranean water is smaller. The few deepprofiles in the crossovers are not sufficient to determine anoffset for this cruise. Based on this evidence, no adjustmentwas applied to the salinity data.
06MT19970515, cruise #17
The inversions suggest a correction of 10 ppm. This agreeswith most of the crossovers in the eastern North Atlantic.Only the crossovers directly south of Iceland have a higheroffset, but also a large spread of the salinity data. Based onthis evidence, an adjustment of 10 ppm was applied to thesalinity data.
06MT19990610, cruise #20
Only ctdsal data are available for this cruise. The mean off-set and the inversion results indicate that the salinity is about10 ppm too low. For the adjustment, however, we followthe crossovers from the deep North Eastern Atlantic sincethe variability is lower there. These have an offset of only−5 ppm. Based on this evidence, an adjustment of 5 ppm wasapplied to the ctdsal data.
06MT19990813, cruise # 22
This cruise was conducted in the Irminger Sea where hightemporal variability is expected. Although the mean of thecrossover offsets is−17 pm and the inversions suggest a cor-rection of 18 ppm; this might all be due to natural variabil-ity. Based on this evidence, no adjustment was applied to thesalinity data.
06MT20010507, cruise #23
The single crossover results suggest an offset of about−10 ppm, which is also reflected in the correction suggestedby the inversions. However, the data are from the NorthWestern Atlantic only, where the variability of water massproperties even in the deep water is large. Moreover, 2001was the year with the lowest salinity in the DSOW in the
Labrador Sea, which may explain the offset in the crossoverstowards the other cruises. Based on this evidence, no adjust-ment was applied to the salinity data.
06MT20021013, cruise #28
Only ctdsal data are available for this cruise, and only twocrossovers exist. These are both located in the tropical At-lantic, and both have an offset of around−20 ppm. This valueis also reflected in the 20 ppm correction suggested by theinversion. Based on this evidence, an adjustment of 20 ppmwas applied to the ctdsal data.
18HU19931105, cruise #40
The inversion result and the mean of the crossovers suggestthat the salinity for this cruise is about 10 ppm too high.However, the data are from the North Western Atlantic wherethe variability of water mass properties is large. This isalso reflected within the crossovers, where the salinity offsetsvaries with depth, i.e. water mass, so that no constant offsetcan be determined. Based on this evidence, no adjustmentwas applied to the salinity data.
29GD19840218 and 29GD19840711,cruises #55 and 56
Both cruises are located close to the Mediterranean out-flow region, where the spatial and temporal variability ofsalinity is extremely large. There are only very few datapoints deeper than 2000 m, below which the influence of theMediterranean waters decreases. Based on the lack of infor-mation, no adjustment was applied to the salinity data.
29HE19980730, cruise #60
Only ctdsal data are available for this cruise. The crossoversindicate a salinity offset between 5 and 10 ppm. A correctionof this magnitude is supported by the inversions. The data arefrom the Eastern Subtropical Atlantic, where the variabilityof salinity is low, at least below the Mediterranean outflowlayer. Based on this evidence, an adjustment of−10 ppm wasapplied to the ctdsal data.
29HE20010305, cruise #61
While some of the crossovers for this cruise have an offset,they are mostly located close to the Mediterranean outflowregion. The crossovers from the deep tropical Atlantic, onthe other hand, reveal only small offsets, and we put moreweight on these crossovers in the analysis. Based on thisevidence, no adjustment was applied to the salinity data.
Earth Syst. Sci. Data, 2, 17–34, 2010 www.earth-syst-sci-data.net/2/17/2010/

T. Tanhua et al.: Atlantic Ocean CARINA data: overview and salinity adjustments 33
34AR19970805, cruise #91
This cruise covers the region north and south of the overflowsfrom the Nordic Seas to the Atlantic, which is a region withlarge variability of water mass properties. Some crossovershave a positive offset, others a negative offset, which can beascribed to this variability. Based on this variability, adjust-ments were not considered for salinity.
35TH20040605, cruise #109
The mean salinity offset of all crossovers is almost zero forthis cruise, but the crossovers from the North Eastern At-lantic all have a negative offset. The inversions suggest acorrection of about 5 ppm. Based on this evidence, an ad-justment of 5 ppm was applied to the salinity data.
58AA20010527, cruise #125
The analysis of salinity data in the Nordic Seas from thiscruise showed no significant offset, see Olsen et al. (2009).The inversion for the NA region uses data close to theGreenland-Scotland ridge, whose results are not used due tothe large variability. Based on this evidence, no adjustmentwas applied to the salinity data.
58JH19920712, cruise #130
This cruise is from the Greenland-Scotland ridge, an areawith very large variability. Therefore, adjustments were notconsidered for salinity.
58JH19940723, cruise #135
This cruise is from the Greenland-Scotland ridge, an areawith very large variability. Therefore, adjustments were notapplied for salinity.
5 64PE20000926, cruise #152
Both the mean of the crossovers and the inversion suggeststhat the salinity should be adjusted by about 10 ppm. How-ever, the cruise was conducted in the Northern East Atlantic,where the variability of the ISOW is still pronounced. Somecrossovers have mean offsets smaller than−5 ppm in the deepwater. Based on this evidence, no adjustment was applied tothe salinity data.
74AB19900528, cruise #159
This cruise covers a region influenced by the Mediterraneanoutflow. A salinity offset which is not impacted by naturalvariability can thus only be determined from profiles deeperthan about 2000 m. However, only five such profiles exist for
this cruise, and they have a large spread in their salinity val-ues, which makes the determination of an offset problematic.Based on this evidence, adjustments were not considered forsalinity.
74AB19910712, cruise #162
This cruise has only a few deep stations, all just south of Ice-land where natural variability is expected to be large. Basedon this evidence, adjustments could not be considered forsalinity.
74DI19890612, cruise #166
The mean of all crossovers is−15 ppm, which is reflected inthe corrections suggested by the inversions ranging between15 and 20 ppm. As this is one of the earliest cruises in CA-RINA and the salinity in NADW mainly decreased duringthe 1990s, we chose to follow the higher of those sugges-tions. Based on this evidence, an adjustment of 20 ppm wasapplied to the salinity data.
OMEX2, cruise #188
The mean of all the crossovers is almost zero, which isquite different from the correction suggested by the inver-sion (−10 ppm). The individual crossovers typically havesmall offsets at depths below 3000 m, whereas in the shal-lower range included in the inversion, the differences tendto be larger. We ascribe these discrepancies to the variabil-ity of the Mediterranean outflow, which influences the areawhere this cruise was carried out. Based on this evidence, noadjustment was applied to the salinity data.
6 Data access
The complete CARINA database set is published athttp://cdiac.ornl.gov/oceans/CARINA/Carinainv.html. It contains188 individual cruise files in comma-separated, WHPO ex-change format. Condensed metadata is contained in theheader of each data file. In addition, the CARINA data setcontains three merged, comma-separated, data files with thedata products. These files are divided into the three geo-graphical regions of CARINA. No special software is neededto access the data, but software for MATLAB users is offeredat the site to facilitate reading of the data.
Acknowledgements. This work has been performed and fundedas part of the EU project CarboOcean (Project 511176-2). Addi-tional support from the International Ocean Carbon CoordinationProject IOCCP (Maria Hood) and the Hanse Institute for AdvancedStudy (HWK Delmenhorst, Germany) are gratefully acknowledged.Additional support provided as follows for: A. Olsen, ResearchCouncil of Norway grant 178167/S30 (A-CARB); R. M. Key,NOAA grant NA08OAR4320752 and NA08OAR4310820; X. Lin,
www.earth-syst-sci-data.net/2/17/2010/ Earth Syst. Sci. Data, 2, 17–34, 2010

34 T. Tanhua et al.: Atlantic Ocean CARINA data: overview and salinity adjustments
NOAA grant NA08OAR4310820; P. J. Brown, NERC AwardNER/S/A/2004/12255; N. Gruber and I. Stendardo, ETH Zurich;A. Rios, A. Velo and F. Perez, PGIDIT05OXIC40203PM Xuntade Galicia and CTM200627116E/MAR MEC; J. L. Bullisterand R. Wanninkhof, NOAA Office of Atmospheric and OceanicResearch and Climate Program Office. Without the dedication andhard work of all investigators and analysts who collected the dataused in this study, sometimes under adverse conditions, this projectwould not have been possible. We gratefully acknowledge thosewho have contributed their data to the CARINA project.
Edited by: V. Gouretski
References
Dickson, B., Yashayaev, I., Meincke, J., Turrell, B., Dye, S., andHolfort, J.: Rapid freshening of the deep North Atlantic Oceanover the past four decades, Nature, 416, 832–837, 2002.
Gouretski, V. V. and Jancke, K.: Systematic errors as the cause foran apparent deep water property variability: global analysis ofthe WOCE and historical hydrographic data, Prog. Oceanogr.,48, 337–402, 2001.
Johnson, G., Robbins, P. E., and Hufford, G. E.: Systematic adjust-ments of hydrographic sections for internal consistency, J. At-mos. Ocean. Technol., 18, 1234–1244, 2001.
Key, R. M., Kozyr, A., Sabine, C. L., Lee, K., Wanninkhof,R., Bullister, J. B., Feely, R. A., Millero, F., Mordy, C.,and Peng, T.-H.: Results from the Global Data AnalytisProject (GLODAP), Global Biogeochem. Cy., 18, GB4031,doi:10.1029/2004GB002247, 2004.
Key, R. M., Tanhua, T., Olsen, A., Hoppema, M., Jutterstrom, S.,Schirnick, C., van Heuven, S., Kozyr, A., Lin, X., Velo, A., Wal-lace, D. W. R., and Mintrop, L.: The CARINA data synthesisproject: introduction and overview, Earth Syst. Sci. Data Dis-cuss., 2, 579–624, 2009,http://www.earth-syst-sci-data-discuss.net/2/579/2009/.
McDowell, S. E., and Rossby, H. T.: Mediterranean water: anintense mesoscale eddy off the Bahamas, Science, 202, 1085–1087, 1978.
Olsen, A., Key, R. M., Jeansson, E., Falck, E., Olafsson, J., vanHeuven, S., Skjelvan, I., Omar, A. M., Olsson, K. A., Anderson,L. G., Jutterstrom, S., Rey, F., Johannessen, T., Bellerby, R. G.J., Blindheim, J., Bullister, J. L., Pfeil, B., Lin, X., Kozyr, A.,Schirnick, C., Tanhua, T., and Wallace, D. W. R.: Overview ofthe Nordic Seas CARINA data and salinity measurements, EarthSyst. Sci. Data, 1, 25–34, 2009,http://www.earth-syst-sci-data.net/1/25/2009/.
Pierrot, D., Brown, P., Van Heuven, S., Tanhua, T., Schuster, U.,Wanninkhof, R., and Key, R. M.: CARINA TCO2 data in theAtlantic Ocean, Earth Syst. Sci. Data Discuss., 3, 1–26, 2010,http://www.earth-syst-sci-data-discuss.net/3/1/2010/.
Richardson, P. L., Bower, A. S., and Zenk, W.: A census of Meddiestracked by floats, Prog. Oceanogr., 45, 209–250, 2000.
Sabine, C. L., Key, R. M., Johnson, K. M., Millero, F. J., Pois-son, A., Sarmiento, J. L., Wallace, D. W. R., and Winn, C. D.:Anthropogenic CO2 inventory of the Indian Ocean, Global Bio-geochem. Cy., 13(1), 179–198, 1999.
Sabine, C. L., Key, R. M., Kozyr, A., Feely, R. A., Wanninkhof, R.,Millero, F., Peng, T. H., Bullister, J., and Lee, K.: Global OceanData Analysis Project (GLODAP): Results and Data, NDP-083,Carbon Dioxide Information Analysis Center, Oak Ridge Na-tional Laboratory, US Department of Energy, Oak Ridge, TN,2005.
Steinfeldt, R., Tanhua, T., Bullister, J. L., Key, R. M., Rhein, M.,and Kohler, J.: Atlantic CFC data in CARINA, Earth Syst. Sci.Data, 2, 1–15, 2010,http://www.earth-syst-sci-data.net/2/1/2010/.
Stendardo, I., Gruber, N., and Kortzinger, A.: CARINA oxygendata in the Atlantic Ocean, Earth Syst. Sci. Data, 1, 87–100,2009,http://www.earth-syst-sci-data.net/1/87/2009/.
Tanhua, T., Brown, P. J., and Key, R. M.: CARINA: nutrient data inthe Atlantic Ocean, Earth Syst. Sci. Data, 1, 7–24, 2009a,http://www.earth-syst-sci-data.net/1/7/2009/.
Tanhua, T., van Heuven, S., Key, R. M., Velo, A., Olsen, A., andSchirnick, C.: Quality control procedures and methods of theCARINA database, Earth Syst. Sci. Data Discuss., 2, 205–240,2009b,http://www.earth-syst-sci-data-discuss.net/2/205/2009/.
Velo, A., Perez, F. F., Brown, P., Tanhua, T., Schuster, U., and Key,R. M.: CARINA alkalinity data in the Atlantic Ocean, Earth Syst.Sci. Data, 1, 45–61, 2009a,http://www.earth-syst-sci-data.net/1/45/2009/.
Velo, A., Perez, F. F., Lin, X., Key, R. M., Tanhua, T., de la Paz,M., van Heuven, S., Jutterstrom, S., and Rıos, A. F.: CARINAdata synthesis project: pH data scale unification and cruise ad-justments, Earth Syst. Sci. Data Discuss., 2, 421–475, 2009b,http://www.earth-syst-sci-data-discuss.net/2/421/2009/.
Yashayaev, I., van Aken, H. M., Holliday, N. P., and Bersch,M.: Transformation of the Labrador Sea Water in the sub-polar North Atlantic, Geophys. Res. Lett., 34, L22605,doi:10.1029/2007GL301812, 2007.
Earth Syst. Sci. Data, 2, 17–34, 2010 www.earth-syst-sci-data.net/2/17/2010/