Schroders Economic and Strategy Viewpoint Probability of ... · 1: Impact of Trump and Clinton’s...
19
October 2016 For professional investors only 1 Schroders Economic and Strategy Viewpoint Keith Wade Chief Economist and Strategist (44-20)7658 6296 Azad Zangana Senior European Economist and Strategist (44-20)7658 2671 Craig Botham Emerging Markets Economist (44-20)7658 2882 US election: odds on Trump are rising (page 2) The opinion polls are narrowing and post the Brexit shock we would not rule out a Trump victory in the presidential election. Both candidates favour fiscal expansion, but Trump’s are on a larger scale. Unfortunately, when combined with his protectionist trade policies they will only bring stagflation to a late cycle US. The US equity market remains buoyant, a sign that Hillary Clinton, as the candidate of the incumbent party, will win. However, there is still time for this to reverse. The rise in populism is underpinned by anti-globalisation sentiment such that the greatest threat to our 2.5% global growth forecast is not economic, but political in the form of a surge in populism. Europe’s political roadmap (page 6) Investors in Europe face another tough year navigating through lots of political risk. Brexit seems to have galvanised protest parties across the union, which is prompting investors to carefully consider the discount they apply to European risk assets. Many of the upcoming events either carry a low risk of happening, or a low impact. The two most notable are the Italian referendum and Dutch election, where the former could see the Prime Minister lose his job, while the latter would propel a far right nationalist party into power. Elections in France and Germany in 2017 should be more straightforward, but Brexit has taught us not to underestimate protest movements. Bank flows and the state of EM (page 13) Recent data on international banking flows offers a chance to take stock of how easy monetary policy globally may have built vulnerabilities in emerging market economies. China is a problem, but there are other causes for concern, with Turkey, Colombia and Thailand looking riskiest in their respective regions. Views at a glance (page 17) A short summary of our main macro views and where we see the risks to the world economy Chart: Polls continue to back Clinton for the Presidential race Source: FiveThirtyEight.com, Schroders Economics Group, Updated 30 September 2016. 63.7 36.2 0 20 40 60 80 100 5-Jul 19-Jul 2-Aug 16-Aug 30-Aug 13-Sep 27-Sep The probability of Clinton winning is 63.7% Trump Clinton Probability of candidate winning, %
Transcript of Schroders Economic and Strategy Viewpoint Probability of ... · 1: Impact of Trump and Clinton’s...

October 2016 For professional investors only
1
Schroders
Economic and Strategy Viewpoint
Keith Wade Chief Economist and Strategist (44-20)7658 6296
Azad Zangana Senior European Economist and Strategist (44-20)7658 2671
Craig Botham Emerging Markets Economist (44-20)7658 2882
US election: odds on Trump are rising (page 2)
The opinion polls are narrowing and post the Brexit shock we would not rule out a Trump victory in the presidential election. Both candidates favour fiscal expansion, but Trump’s are on a larger scale. Unfortunately, when combined with his protectionist trade policies they will only bring stagflation to a late cycle US.
The US equity market remains buoyant, a sign that Hillary Clinton, as the candidate of the incumbent party, will win. However, there is still time for this to reverse.
The rise in populism is underpinned by anti-globalisation sentiment such that the greatest threat to our 2.5% global growth forecast is not economic, but political in the form of a surge in populism.
Europe’s political roadmap (page 6)
Investors in Europe face another tough year navigating through lots of political risk. Brexit seems to have galvanised protest parties across the union, which is prompting investors to carefully consider the discount they apply to European risk assets.
Many of the upcoming events either carry a low risk of happening, or a low impact. The two most notable are the Italian referendum and Dutch election, where the former could see the Prime Minister lose his job, while the latter would propel a far right nationalist party into power. Elections in France and Germany in 2017 should be more straightforward, but Brexit has taught us not to underestimate protest movements.
Bank flows and the state of EM (page 13)
Recent data on international banking flows offers a chance to take stock of how easy monetary policy globally may have built vulnerabilities in emerging market economies. China is a problem, but there are other causes for concern, with Turkey, Colombia and Thailand looking riskiest in their respective regions.
Views at a glance (page 17)
A short summary of our main macro views and where we see the risks to the world economy
Chart: Polls continue to back Clinton for the Presidential race
Source: FiveThirtyEight.com, Schroders Economics Group, Updated 30 September 2016.
63.7
36.2
0
20
40
60
80
100
5-Jul 19-Jul 2-Aug 16-Aug 30-Aug 13-Sep 27-Sep
The probability of Clinton winning is 63.7%
Trump
Clinton
Probability of candidate winning, %

October 2016 For professional investors only
2
1Trump speech to New York economic club, 16 September 2016, https://www.donaldjtrump.com/press-releases/trump-
delivers-speech-on-jobs-at-new-york-economic-club.
US election: odds on Trump are rising
Brexit vote demonstrates that we should not rule out a Trump presidency
Trump policies would bring stagflation
“We must replace the present policy of globalism – which has moved so many jobs and so much wealth out of our country – and replace it with a new policy of Americanism.” Donald Trump, 16 September 2016.
This time last year political pundits ruled out Donald Trump as the Republican candidate, now they are watching him fight a tight race for the Presidency with Hillary Clinton. He has surprised everyone by riding a wave of populist sentiment for change which could take him to the White House. As we know, the Brexit vote in the UK demonstrated that a large number of people can vote for change, even though they are not sure what that change actually is.
For the US election, the opinion polls still point to a Clinton victory. The polls had been narrowing, especially after Clinton took time off from her campaign for health reasons. The widely respected website www.fivethirtyeight.com had put a probability of 55% on a Clinton win on 26
of September, just before the first TV
debate. At the beginning of September this was over 75% (see chart front page). The latest reading shows a bounce to 63.7% for Hillary, reflecting what is widely seen as a victory for the Democratic party candidate during the debate.
Nate Silver, who runs this aforementioned site, correctly predicted all the state results at the last presidential election. He may do the same again, but has to contend with two factors which will make it more difficult to predict the 2016 result. The first is the large number of unknowns, those voters who have yet to decide and could swing the vote in either direction. Neither candidate is particularly liked, many may vote tactically if at all. The second is that people may be reticent about admitting to pollsters that they will be voting for Trump. This would mean that his vote is being systematically underestimated by the polls.
Macro impact
In terms of economics, we need to distinguish between policies at face value and what happens when they reach Washington. At face value, both parties offer fiscal expansion. Trump’s policies focus on significant personal tax cuts offset by significant spending cuts. At face value they will boost growth; however, they are also likely to bring forward a tightening of monetary policy by the Federal Reserve (Fed). In addition we will see higher tariffs on imported products adding to inflation and slowing growth as retaliatory trade barriers increase on US exports.
Although Trump promises to “…massively increase jobs, wages, incomes and opportunities for the people of our country”
1, the economy is late cycle, already
running at a low unemployment rate and does not have the capacity to deliver “massive” job gains without inflation. According to Moody’s the result is a short-lived boom followed by a stagflationary downturn (chart 1). The budget deficit increases significantly. Other economic forecasters such as Oxford Economics reach similar conclusions.

October 2016 For professional investors only
3
Congress is likely to scale back the plans of both candidates, but will have less influence on trade policies
Chart 1: Impact of Trump and Clinton’s policies on the US economy
Face Value
In Washington
Source: Moody’s Analytics, Schroders Economics Group, June and July 2016.
Hillary Clinton’s policies are more of the tax and spend variety, and provide an initial boost to activity, albeit smaller than in the Trump case. Again, the Fed is expected to tighten, but growth gains are sustained for longer in part due to the lesser scale of the stimulus and in part due to the absence of protectionist trade policies.
Once policies reach Washington the story is different. We expect the House to remain Republican, although there is a reasonable chance that the Democrats regain control of the Senate. Overall though whoever wins the presidential race will be constrained by Congress as fiscal hawks on the Republican side scale back tax cuts and spending increases. This might change if Trump can build support in Congress and oust those considered to be Republican in name only (RINO’s), but it is not clear that he has the support to do this even if elected President.
The area where there is less constraint is on trade policy where the President has more freedom to act without congressional approval if a country is found to maintain “unfair, unreasonable, or discriminatory practices that restrict US exports to their markets”. This would mean that Trump is likely to impose tariffs on China and Mexico and renegotiate NAFTA. As a result, although his fiscal plans are likely to be scaled back, some of the stagflation remains due to trade policy.
-0.5
0.0
0.5
1.0
1.5
GDP, y/y CPI, y/y Fed funds Deficit/GDP
%
Clinton
2017 2018 2019 2020
-8
-6
-4
-2
0
2
4
GDP, y/y CPI, y/y Fed funds Deficit/GDP
%
Trump
2017 2018 2019 2020
-2
-1
0
1
2
GDP, y/y CPI, y/y Fed funds Deficit/GDP
%
Trump
2017 2018 2019 2020
-0.5
0.0
0.5
1.0
GDP, y/y CPI, y/y Fed funds Deficit/GDP
%
Clinton
2017 2018 2019 2020

October 2016 For professional investors only
4
Market signalling a Clinton win
Little impact from Brexit so far, but the focus should be on business not consumer spending
Market impact
The opinion polls are the first source of information on the likely outcome of the vote, but we would note that the US equity market has a good track record. There is a well-established rule that the S&P500 sells off in the run-up to the presidential vote when the incumbent party loses. Markets are more concerned about change than whether the President is Republican or Democrat. This has proven correct in 19 of the past 22 elections going back to 1928. There is still time for a sell-off to develop, but so far the S&P has been robust, reaching record highs, suggesting that Clinton will win (chart 2).
Chart 2: The S&P is currently signalling a Clinton win
Source: Strategas, Schroders Economics Group. 27 September 2016.
Brexit Britain three months on
As we brace ourselves for a potential Trump win, it is worth seeing how the UK is faring some three months after its own populist shock at the Brexit vote. Indeed, the UK is now in the process of finding out what change really means.
From an economic perspective, so far it means very little. However, we have very little hard data to go on. Consumer spending is holding up, but as we have argued before, the real impact of Brexit will be felt through investment by business on which the signs are not good. Business confidence has fallen and is consistent with sharp cuts in business capex (chart 3). Cuts in investment will be accompanied by cuts in employment, an effect which will feed through to the consumer. Household spending will also be squeezed by the rise in inflation in coming months. On this basis the adverse impact will build up in coming months as corporates retrench.
89
92
95
98
101
104
107
110
Jan Feb Mar Apr May Jun Jul Aug Sep Oct Nov Dec
Incumbent Party Lost Incumbent Party Won 2016
Election
S&P 500 Avg: Presidential Election Years and Incumbent Party Outcome, 1933 – 2015
October 2016 For professional investors only
5
Government division and delay over Brexit negotiations will increase the drag on the economy
Is 2.5% global growth politically unsustainable?
Chart 3: Business confidence signals sharp fall in UK business investment
Source: Thomson Reuters, Schroders Economics Group, Updated 26 September 2016.
Politically the UK has been fortunate; it has lost a leader who gambled once too often and gained a widely respected replacement. In the meantime, the new Prime Minister can hardly believe her luck at the implosion of the opposition parliamentary Labour party. It will not be plain sailing though as the Cabinet has to agree on what Brexit actually means in terms of the trade-off between border controls and access to the single market. There are clear divisions between the “Brexiteers” who emphasise the former and want a “hard” Brexit and others such as Chancellor Hammond who emphasise access to the single market.
Such division will feed back into the economy by delaying a trade deal, prolonging uncertainty and causing business to vote with its feet. Prime Minister May’s political honeymoon will soon be over.
Meanwhile, the government can be expected to try and paper over the cracks with fiscal support in the Autumn statement on 23
rd November. Alongside the fall
in the pound this will be helpful in the near term, but who would have thought that Brexit would mean the embrace of fiscal expansion and devaluation?
More generally, the Brexit vote and the presidential election highlight the fact that the “muddle along” tepid growth rates experienced since the global financial crisis are not good enough for many people. The world economy has experienced growth of 2.5% since 2012 compared with 5% before the crisis. The growth rate has halved. Combine this with an uneven distribution of those gains and the outcome for many is clearly worse than the headline macro growth figures would imply.
Of course, the 5% pre-crisis growth rate was unsustainable as it was based on an irresponsible boom in bank lending, so perhaps the comparison is unfair. We forecast the 2.5% muddle-through can continue into 2017. However, there is a question now as to whether such a growth rate is sustainable, not from an economic perspective, but from a political one as voters turn to populist solutions. Those solutions vary but all identify globalisation, the free movement of goods and people as a threat to living standards. Reversing such trends will only weaken rather than accelerate growth.
-80
-60
-40
-20
0
20
40
-20
-15
-10
-5
0
5
10
15
2007 2008 2009 2010 2011 2012 2013 2014 2015 2016 2017
y/y %
UK Business investment y/y% (RH scale)
CBI Business Optimism, 6m lag
Recession

October 2016 For professional investors only
6
Europe’s political roadmap
Investors in Europe face a tough year with plenty of political risk
Hungary’s government is using a referendum on migrants to pick a fight with the EU
Political crises seem to have become synonymous with Europe in recent years. The union can barely get through a quarter without another episode promising to destroy the returns of investors. Unlike past incidents, the next 12 months are full of crucial events that have the potential to change the direction of the eurozone and the European Union. Brexit has focused the minds and efforts of anti-establishment/protest political movements, highlighting the growing tide of anger and frustration with the status quo. While change is always inevitable in a political cycle, the potential transformation of the political landscape may require markets to re-examine the current investment paradigm, and to demand greater premiums for future risk.
Check your calendar
Brexit was the first of many potential upsets on the horizon. Table 1 lists seven events that pose adverse risk scenarios for investors including the UK triggering Article 50 as discussed in the previous section. In assessing the risk of each event, we have given a qualitative assessment of the probability of each occurring, along with the likely market impact for risk assets.
Table 1: European political risk roadmap
Country Event risk Date Probability Market impact
Hungary Migrant quota rejected in referendum 2 October 2016 High Low
Austria Re-run of presidential election with far-right Freedom party winning
4 December 2016 Medium Low
Italy Constitutional referendum, leading to Renzi losing his job
4 December 2016 Medium High
Netherlands General election with the Party for Freedom calling an EU referendum
15 March 2017 High Medium
France Presidential elections with the National Front winning
23 April and 7 May 2017
Low Extreme
Germany Federal election with Alternative for Deutschland winning
Aug – Oct 2017 Very low Extreme
UK Article 50 triggered Early 2017 High Low
Source: Schroders Economics Group. 30 September 2016.
Early signs of “Huxit”?
Starting with the near-immediate Hungarian referendum on the EU’s migrants quota. Victor Orban’s right-wing populist government announced a referendum on the issue in February following an EU agreement to re-locate 120,000 asylum seekers over two years from frontline member states (Italy, Greece and Hungary) to all other EU countries. Hungary voted against the motion, and there is broad opposition across the political spectrum. The issue seems to revolve around the EU not counting the tens of thousands of asylum seekers that Hungary has already accepted, but also Hungary’s reluctance to accept migrants that are essentially only passing through to other member states.
“Do you want the European Union to be able to mandate the obligatory resettlement of non-Hungarian citizens into Hungary even without the approval of the National Assembly?” The referendum question is heavily loaded, and is very likely to return a “no” vote on 2 October with support of between 65–80% based on polling. Whether that then puts a stop to the relocation agreement is another matter. As a member of the EU, Hungary will be obliged to adhere to the agreement or face legal consequences. Anti-immigrant rhetoric bordering on xenophobia has prompted anger from other member states. Luxembourg’s foreign

October 2016 For professional investors only
7
Austria’s presidential election re-run could see the far right take up the ceremonial position
Italy’s prime minister may be forced to quit if his reforms are rejected in the upcoming referendum…
minister, Jean Asselborn, said that Budapest had “massively violated” the EU’s fundamental values and as a result, Hungary “should be excluded temporarily or if need be forever from the EU.”
2 This is the first time any political leader or minister
has called for the expulsion of another member state. Could we see “Huxit” in the future? While we doubt the EU would go so far as to boot Hungary out, we would not rule out Hungary’s own government heading in that direction. Indeed, a number of political commentators think the referendum is a red herring, and that it is being used to stoke tensions between the electorate and the EU.
While we expect Hungary to vote against the EU’s migrant relocation quotas, we doubt the event will have much of an impact on markets.
Austria’s protest
In Austria, a closely fought election for the largely ceremonial position of President ended with Alexander Van der Bellen (Greens) beating Norbert Hofer (Freedom Party of Austria) back in May by under a percentage point. That result was annulled due to irregularities in ballots and so a re-run is due to take place on 2 December. Investors are concerned by the possibility of the Freedom Party of Austria (FPO) taking power as it is a right-wing populist party with strong opposition to immigration along with anti-euro sentiment. The party has recently advocated the introduction of a “hard-north euro” and “soft-south euro” in reaction to the sovereign debt crisis.
The FPO does have a history of holding power in coalition with the Austrian People Party back in 1999 and again in 2002, although its support collapsed in the latter election, and since then, the party has been more on the fringe of Austrian politics.
The average of the last five opinion polls put Hofer ahead of Van der Bellen by 50.4% to 49.6%. Note that Hofer has a higher lead of around five points just before the last contest and still lost. This suggests that Van der Bellen may have a slight edge again, although there is still a high chance that Hofer could win. Despite this, given that the presidential position is largely ceremonial, it is unlikely to have much of an impact on risk assets. However, it would provide another signal of the direction Europe could be heading in.
The Renzi referendum
Italy is where the risk begins to escalate for investors. Its size means that many investors will have either direct or indirect exposure to Italy and its political problems. Of course, messy politics is the norm in Italy, although the impact on investors has largely been due to the lack of action in terms of structural reforms, rather than unpredictable players. The rise of Beppe Grillo’s Five-Star Movement (M5S) has changed this in recent years. The former comedian’s party is populist anti-establishment, anti-austerity, anti-globalisation and eurosceptic, while advocating direct democracy (regular referendums) instead of traditional government.
On 4 December, Italy will hold a referendum on constitutional reforms which will reduce the powers of the second legislative chamber, while making it easier for the largest party in an election to take power. In theory, these reforms are positive and will give the government more power to push through badly-needed economic reforms. However, in an odd twist, Prime Minister Matteo Renzi has promised to step down if he fails to win the referendum. This has prompted opposition parties to campaign not on the issue at hand, but to take advantage of the opportunity to get rid of Renzi. Indeed, recent polls suggest more than half that are likely to vote are voting on his future, and not on the merit of the reforms.
2 Welt Newspaper. 13 September 2016.

October 2016 For professional investors only
8
…although his party are unlikely to call an election, reducing the risk of an extremist party in power.
Dutch politics has shifted to the far right…
Based on a five-poll moving average, the “yes” is winning by the slightest of margins (chart 4). We suspect those voting against will have a stronger motivation to turn-out and vote than those who favour the reforms (and Renzi). This means there is a medium chance of Renzi losing the referendum, which would suggest he would then step down as leader. It is worth noting that Renzi has been backing away from this promise to quit, but we believe that even if he remains in place, he would become weak and ineffective as prime minister until the 2018 election.
Chart 4: Italy’s referendum on Renzi
Source: Schroders Economics Group. 28 September 2016.
A further concern often cited is that in the event of Renzi’s resignation, a general election could be called, which could create an opportunity for the M5S to take power. Polling for the next general election puts the M5S just five points behind Renzi’s Democratic Party (PD). In our view, the PD would not call an early election, but instead either insist Renzi continue, or nominate and elect a new prime minister. Remember that Renzi only rose to power after Pier Luigi Bersani was ousted soon after winning the 2013 general election.
In any case, the outlook remains poor, and Renzi’s resignation would have a high impact on risk assets, particularly Italian equities, although Italian government bonds would also face increased pressure. Italy has the highest level of government debt in Europe, and with it, the largest debt market. Given the lack of growth in Italy, any rise in bond yields will prompt investors to take fright. The event has the potential to become a major market event. So why are Italian government bond yields still so low? The European Central Bank’s bond buying continues to support the market. Whether it can continue to do so if Renzi steps down is questionable, but what other choice do policy makers have?
The Dutch dilemma
The Netherlands is yet another Northern European country flirting with the far right. Current polls suggest that Geert Wilders’s Party for Freedom (PVV) is on course to win the most seats in the House of Representatives on 15 March 2017 (chart 5). The current Prime Minister Mark Rutte, leader of the People’s Party for Freedom and Democracy (VVD), puts the rise of the PVV down to a failure of the establishment to communicate with the population. The other interesting development has been the collapse in popularity of the Labour Party (PvdA) since the last election. It is set to go from being runner-up in the 2012 election to potentially seventh place next year.
20
25
30
35
40
45
50
55
Jan 16 Feb 16 Mar 16 Apr 16 May 16 Jun 16 Jul 16 Aug 16 Sep 16
Polling share (%), 5-poll moving average
Yes No Don't know

October 2016 For professional investors only
9
…but without a majority, the PVV will need to temper their policy to form a coalition.
President Hollande’s dismal performance has helped France’s National Front gain momentum
In addition to the nationalist, anti-immigration and authoritarian stances, the main cause for concern for investors is the PVV’s strong stance on the withdrawal from the EU. Wilders has called for a Brexit-style referendum on the Netherland’s membership of the EU, which we presume would also include the euro.
Chart 5: The far right are on course to take power
Source: Schroders Economics Group. 28 September 2016.
So is “Nexit” inevitable? Probably not for two reasons. First, it is against the Dutch constitution to hold a binding referendum on its EU membership. Referendums can only cover new legislation and treaties, and would only be advisory. Second, while the PVV will probably win the 2017 election, it cannot form a government without the support of other parties, most of which are pro-EU. Indeed, there is a chance that the PVV fails to find enough support to form a government, giving Rutte another chance to rule with a broader coalition.
Regardless of the outcome of the negotiations that will follow the election, markets are likely to react negatively to a PVV victory. The Netherlands is a significantly large member state, and any suggestion that it could leave the EU will be a concern.
France: No hope for Hollande
If approval ratings are a measure of political success, then President Francois Hollande’s term in office has been a total disaster. He is the most unpopular French President in modern times and the first to see his approval rating fall below 20%. Indeed, the latest polling conducted by the Paris based Elabe institute for Radio Classique and Les Echos daily showed his approval rating down to just 15% for September – a joint new low since he took office.
As the 2017 election approaches, primary elections are likely to decide the main candidates for each party. Then, on 23 April, the first round ballot will be held in order to determine the top two candidates, who will then face off against each other in the second round election on 7 May.
The main cause for concern for investors is the rise of Marine Le Pen’s the National Front (FN) – a far-right nationalist party that advocates protectionism, is anti-immigration, and is in favour of leaving the EU and euro. The FN has been on the rise for a number of years and is expected to perform well at the next election. Indeed, for first round voting, polls show that Le Pen would only be behind the Republicans’ Alain Juppé (chart 6). This suggests that Le Pen will make it past the first round at the very least – an improvement on finishing third at the 2012 election
0
5
10
15
20
25
30
35
40
45
VVD PvdA PVV SP CDA D66 CU GL SGP PvdD 50+
2012 election results Last 5 polls
%

October 2016 For professional investors only
10
Marine Le Pen is expected to make it through the first round of voting…
…but is then unlikely to make it any further.
Chart 6: First round voting polls
Source: Schroders Economics Group. 28 September 2016.
Her opponent in the second round is likely to be the Republican party candidate. As mentioned above, former Prime Minister Alain Juppé is currently favourite to win the primary ahead of five other candidates including the previous President Nicolas Sarkozy.
As for the Socialist party, Francois Hollande has little hope of making it past the first round, but his former colleague, the young and dynamic Emmanuel Macron would do well. The former investment banker was appointed as Minister of Economy in 2014, where he introduced a set of business friendly changes dubbed the Macron reforms. He resigned at the end of August in order to launch a centrist movement “En Marche” which could become a spring board for a bid for the presidency.
In the second round, polls suggest Alain Juppé would beat any of the other popular candidates (table 2). However, if Sarkozy was to take his place as the Republican candidate, then he too would also beat the remaining rivals, with the exception of Macron. Macron would not only beat Sarkozy, but also Le Pen comfortably. Indeed, Le Pen is likely to lose against any other candidate with the exception of Hollande – such is the public’s dislike for him.
Table 2: Second round head to head polls*
Source: Schroders Economics Group. 28 September 2016. *Based on an average of the three most recent polls where available.
If the polls remain the same, then we see very little risk of the National Front gaining the presidency. However, if Le Pen was to somehow win, it would be a disaster for euro investors, as it may herald not only the start of France leaving the EU, but also the end of the EU altogether given the important role the French play.
0
5
10
15
20
25
30
35
40
Jan Feb Mar Apr May Jun Jul Aug Sep
Projected share of votes (%)
Marine Le Pen(National Front)
Alain Juppé(Republicans)
Nicolas Sarkozy(Republicans)
Emmanuel Macron(Independent)
Francois Hollande(Socialists)
Jean-Luc Mélenchon(Left)
François Bayrou(Socialists)
Cécile Duflot (Greens)
Sarkozy Juppé Le Pen
Hollande 43-57 30-70 49-51
Macron 64-36 39-61 63-37
Valls 48-52 59-41
Sarkozy 58-42
Juppé 69-31
October 2016 For professional investors only
11
In Germany, far right and far left parties are on the rise, not helped by Merkel’s “welcome culture”
While Merkel’s party has lost popularity, it remains in first place, and primed to retain power in a coalition…
Germany: Low risk…this time
Chancellor Angela Merkel is facing mounting criticism over her handling of the migrant crisis last summer. Her “willkommenskultur” (welcome culture) arguably helped encourage over a million migrants to head to Germany to the dismay of her conservative opponents and parts of her own party. Since the start of this year, Merkel has slowly backed away from the suggested open-door policy for asylum seekers, negotiating deals with Turkey to limit flows and an EU relocation quotas which would help share the burden of accommodating the refugees. However, it was only after the Alternative for Germany (AfD) won 14% of the votes in elections in Berlin’s regional assembly that Merkel publically admitted her policy was “unpopular”, and was open to changing it.
Given Germany’s history, and mention of the far-right gaining momentum and power will concern investors. The AfD was started in 2013 as a soft euro-sceptic party, in favour of the EU, but anti-bailouts for Greece and others. It called for the abolition of the eurozone, and the introduction of direct democracy. However in 2015, the party split, with the centrists leaving the party, leaving the far right-wing members to take control. Anti-immigration became the primary focus of the party, although it continues to harbour euro sceptic views.
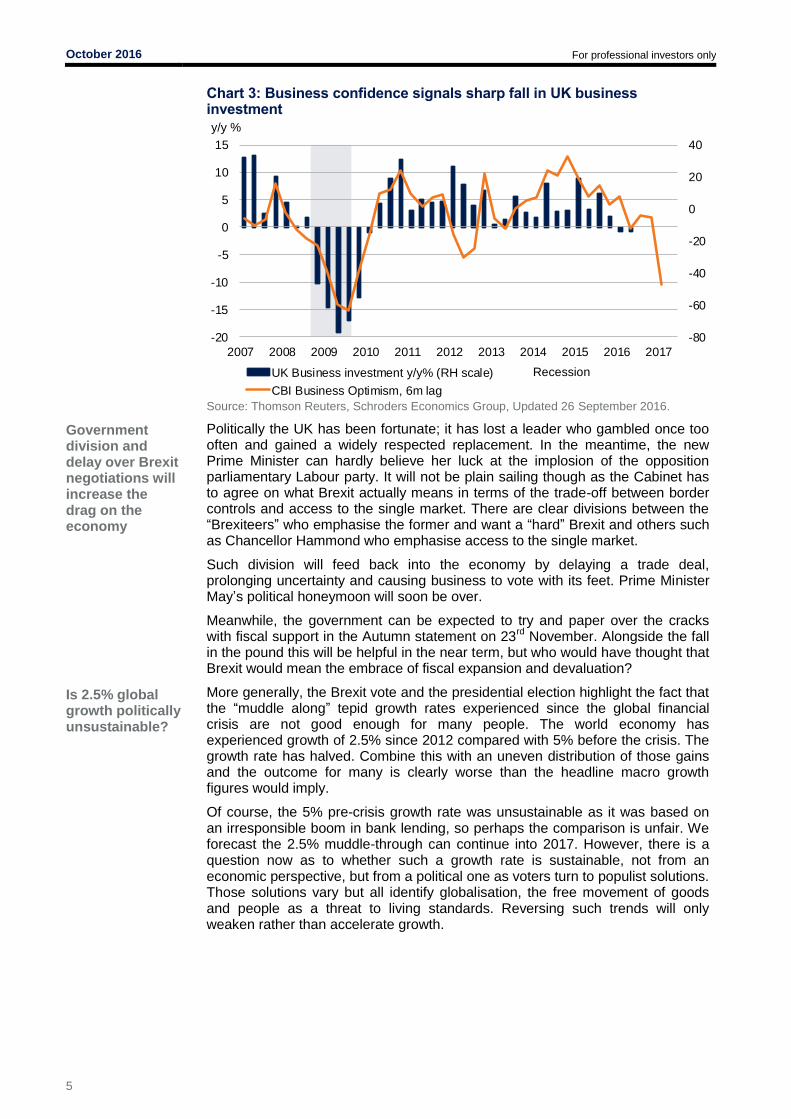
The gains seen in the polls for the AfD over the last year are significant and certainly linked to the migration crisis (chart 7). However, the AfD is still a long way from taking power in Germany.
Chart 7: AfD unlikely to upset the German apple cart
Source: Schroders Economics Group. 28 September 2016.
If the election were to follow the latest polls, the AfD would finish third behind the current coalition partners, Merkel’s CDU/CSU coalition, and Sigmar Gabriel’s Socialist Democrats (SPD). The current coalition could potentially continue, or the Green party may be invited to join if polling for the two were to continue to deteriorate.
The other party worth mentioning is “the Left”, which is also focused on anti-globalisation themes. Its array of factions from communists to social democrats give is a wide range of policy ideology. Doing away with capitalist, but include Keynesian fiscal expansion to boost demand. It also blames the wealthy for tax avoidance and for austerity measures. It also seeks to impose heavier government regulation on financial markets, and the introduction of a federal minimum wage. The Left is currently in fifth place in the polls, and while it has had some influence on Merkel’s policy (transactions tax for example), it is
0
5
10
15
20
25
30
35
40
45
01/15 04/15 07/15 10/15 01/16 04/16 07/16
CDU/CSU SPD Left Green FDP AfD

October 2016 For professional investors only
12
…assuming Merkel stands for re-election.
As political risk events approach, European equities continue to lag behind US equities
unlikely to do much more than that.
So Germany is at very low risk of seeing an extreme party come to power. However, it is worth noting that Merkel has not yet announced her intention to continue beyond her term. Most expect her to, but if she did decide to walk away, opinion polls could swing away from the CDU/CSU partnership if they cannot find a candidate that is at least a fraction as popular as Merkel.
Conclusions
There is plenty of political risk to worry about in Europe over the next year, although many of the events will either have little impact on markets, or have a low risk of happening. The Italian referendum and the Dutch election are the two that are most likely to cause a panic, but as we have learnt from Brexit, we cannot rule out the risk of Le Pen in France or the AfD in Germany. Moreover, the events discussed in this note are only those that we can currently see. There is always a risk of more arising, for example, the possibility of a third election in Spain later this year.
Elevated risk may be the reason why European equities have struggled to keep up with their US counterparts, despite having more attractive valuations. Banking problems remain, but are well known. Deflationary risks are also priced in. But political risk is the type of risk that can be extremely costly for investors, and as a result, they demand a greater discount (chart 8).
Chart 8: European equities lag behind their US counterparts
Source: Thomson Datastream, Schroders Economics Group. 28 September 2016.
80
85
90
95
100
105
110
Jan Feb Mar Apr May Jun Jul Aug Sep
Index of total returns (100 = 31/12/2016)
S&P 500 DJ EUROSTOXX 600

October 2016 For professional investors only
13
Bank flows and the state of EM
New data offers a more granular look at lending to EMEs
Risks likely to be concentrated in Asia and Latin America
The Bank for International Settlements (BIS) recently released its quarterly update, including a plethora of statistics on lending across borders. For the first time, the BIS also made available a breakdown of country to country flows, rather than dealing only with aggregate claims. In what follows, we take this opportunity to examine which emerging markets (EM) may be building up credit risks, and which countries are helping to finance them.
Dividing EM into broad regions, it is clear that capital flows have increased far more rapidly to Asia and Latin America than to the Europe, Middle East and Africa (EMEA) region. This would indicate a build up of risks is more likely in the first two regions than in the latter. China, as ever, is in a league of its own, with cross-border flows at one point over seven times their March 2009 levels (chart 9). Over the last 18 months, however, all regions have seen these flows decline, with a combination of Federal Reserve (Fed) and China worries likely drivers. Whilst encouraging in that this indicates that deleveraging and a reduction of risk may be underway, it will also serve as a drag on regional activity. Arguably there is scope for a rebound in EMEA lending at least, given that current activity is below 2009 levels.
Chart 9: EMEA seems to have missed out on the foreign credit rush
Source: Bank for International Settlements, Schroders Economics Group. 26 September 2016. EMEA consists of the Czech Republic, Hungary, Poland, South Africa, Turkey, Russia. Asia ex China consists of India, Indonesia, Malaysia, Philippines, Thailand. EM LatAm consists of Brazil, Chile, Colombia, Peru.
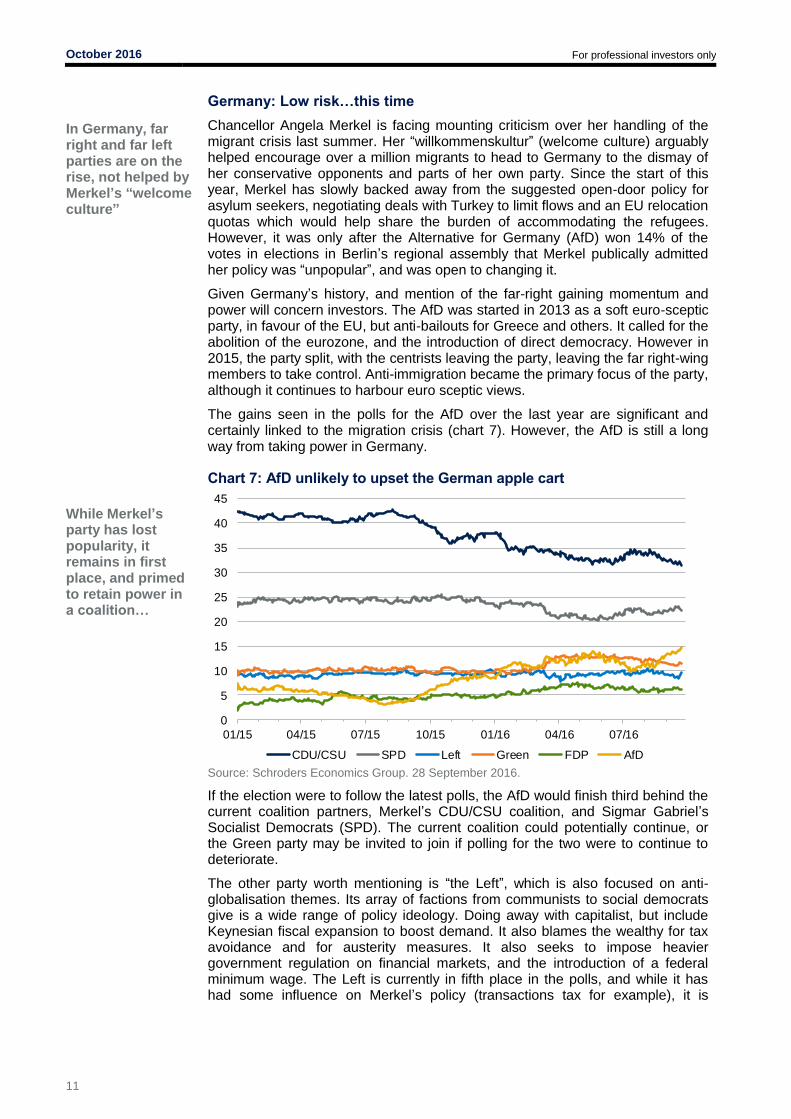
The BIS also provide data on the currency composition of these flows, showing that the euro vies with the dollar for dominance in EMEA, but elsewhere the dollar dominates (chart 10). There is little evidence in Asia that easy policy by the Bank of Japan has encouraged much uptake of yen – the share of yen in total financing has actually fallen from 13.6% in March 2009 to 5.4% in March 2016. US quantitative easing (QE) instead looks to have been the dominant monetary policy force in Asia and Latin America. Borrowers in EMEA have turned marginally towards euro financing, though both in EMEA and China the bigger increase has been in “unallocated” (non-reported) denominations.
70
170
270
370
470
570
670
770
870
70
90
110
130
150
170
190
09 10 11 12 13 14 15 16
EMEA Asia ex China EM LatAm China (rhs)
Foreign bank claims, index (March 2009 = 100)
October 2016 For professional investors only
14
High use of the dollar emphasises the importance of the Fed
Colombia bucks the declining trend despite a negative backdrop
Chart 10: The dollar still reigns supreme outside Europe
Source: Bank for International Settlements, Schroders Economics Group. 26 September 2016.
EMEA consists of the Czech Republic, Hungary, Poland, South Africa, Turkey, Russia. Asia ex
China consists of India, Indonesia, Malaysia, Philippines, Thailand. EM LatAm consists of
Brazil, Chile, Colombia, Peru. Data as of Q1 2016. Claims are in gross terms.
Region by region: where do the problems lie?
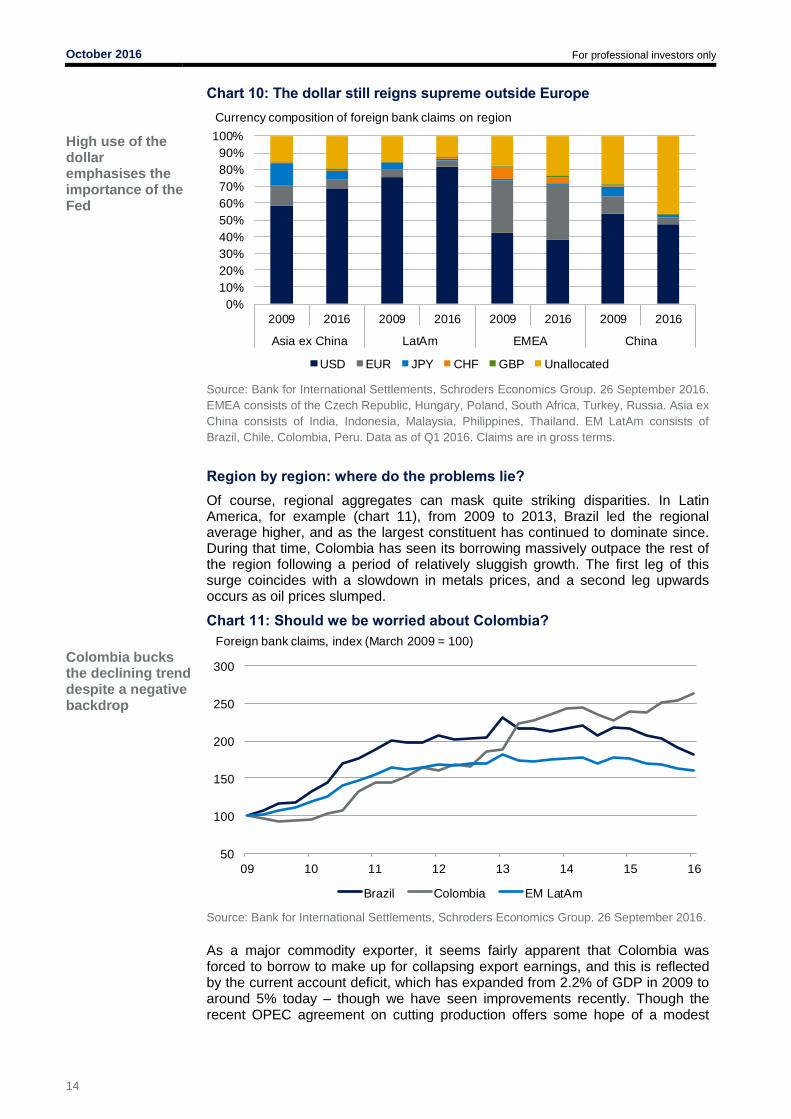
Of course, regional aggregates can mask quite striking disparities. In Latin America, for example (chart 11), from 2009 to 2013, Brazil led the regional average higher, and as the largest constituent has continued to dominate since. During that time, Colombia has seen its borrowing massively outpace the rest of the region following a period of relatively sluggish growth. The first leg of this surge coincides with a slowdown in metals prices, and a second leg upwards occurs as oil prices slumped.
Chart 11: Should we be worried about Colombia?
Source: Bank for International Settlements, Schroders Economics Group. 26 September 2016. As a major commodity exporter, it seems fairly apparent that Colombia was forced to borrow to make up for collapsing export earnings, and this is reflected by the current account deficit, which has expanded from 2.2% of GDP in 2009 to around 5% today – though we have seen improvements recently. Though the recent OPEC agreement on cutting production offers some hope of a modest
0%
10%
20%
30%
40%
50%
60%
70%
80%
90%
100%
2009 2016 2009 2016 2009 2016 2009 2016
Asia ex China LatAm EMEA China
USD EUR JPY CHF GBP Unallocated
Currency composition of foreign bank claims on region
50
100
150
200
250
300
09 10 11 12 13 14 15 16
Brazil Colombia EM LatAm
Foreign bank claims, index (March 2009 = 100)
October 2016 For professional investors only
15
Growth for Turkey but large declines in Russia and Hungary
recovery in oil prices, a return to pre-shale pricing seems very unlikely, and so the ongoing growth in cross border claims (in contrast to the prevailing trend for the rest of EM) is a cause for concern.
The question then is, which foolhardy country is bankrolling this spree? The country’s largest international lender is the US, whose banks accounted for 39% of all cross border claims in Q1 2016, and while this share has climbed slightly over the last two years, the more significant increase has been led by eurozone banks (16% of cross border claims, up from 7% in 2009), particularly the French. This diversification can provide some mitigation of risks, but 80% of the claims are still denominated in USD, so tighter dollar liquidity remains a big risk.
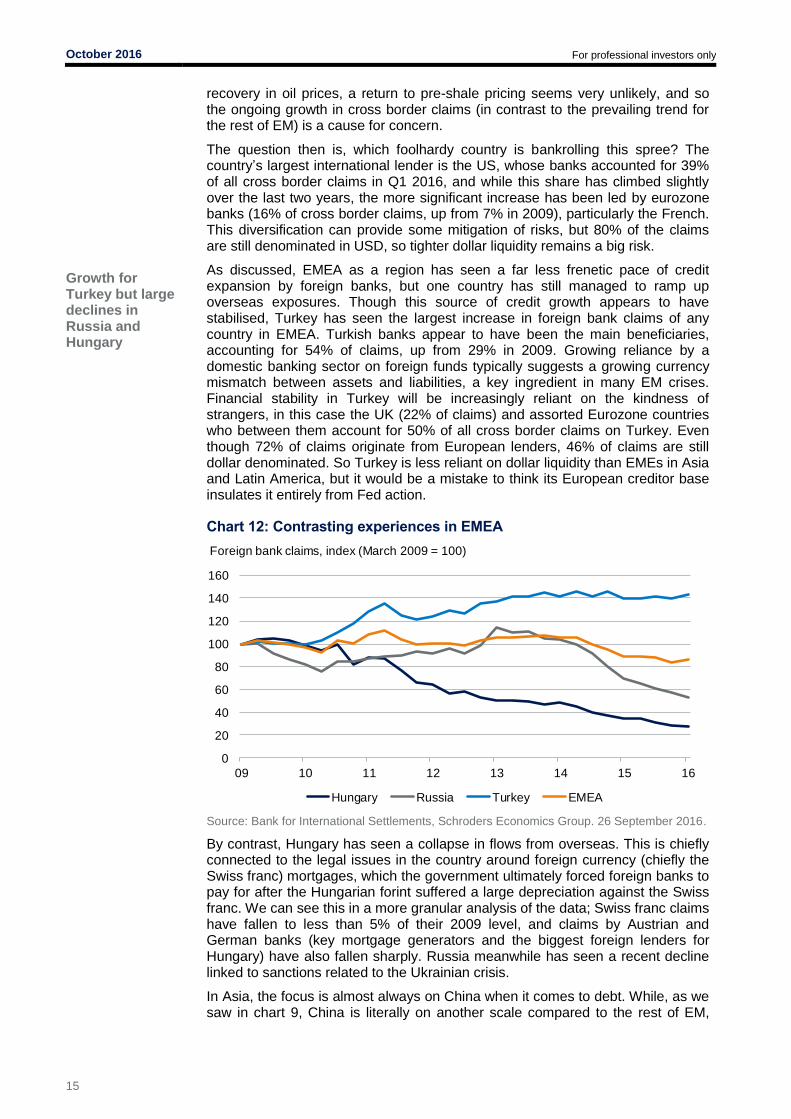
As discussed, EMEA as a region has seen a far less frenetic pace of credit expansion by foreign banks, but one country has still managed to ramp up overseas exposures. Though this source of credit growth appears to have stabilised, Turkey has seen the largest increase in foreign bank claims of any country in EMEA. Turkish banks appear to have been the main beneficiaries, accounting for 54% of claims, up from 29% in 2009. Growing reliance by a domestic banking sector on foreign funds typically suggests a growing currency mismatch between assets and liabilities, a key ingredient in many EM crises. Financial stability in Turkey will be increasingly reliant on the kindness of strangers, in this case the UK (22% of claims) and assorted Eurozone countries who between them account for 50% of all cross border claims on Turkey. Even though 72% of claims originate from European lenders, 46% of claims are still dollar denominated. So Turkey is less reliant on dollar liquidity than EMEs in Asia and Latin America, but it would be a mistake to think its European creditor base insulates it entirely from Fed action.
Chart 12: Contrasting experiences in EMEA
Source: Bank for International Settlements, Schroders Economics Group. 26 September 2016.
By contrast, Hungary has seen a collapse in flows from overseas. This is chiefly connected to the legal issues in the country around foreign currency (chiefly the Swiss franc) mortgages, which the government ultimately forced foreign banks to pay for after the Hungarian forint suffered a large depreciation against the Swiss franc. We can see this in a more granular analysis of the data; Swiss franc claims have fallen to less than 5% of their 2009 level, and claims by Austrian and German banks (key mortgage generators and the biggest foreign lenders for Hungary) have also fallen sharply. Russia meanwhile has seen a recent decline linked to sanctions related to the Ukrainian crisis.
In Asia, the focus is almost always on China when it comes to debt. While, as we saw in chart 9, China is literally on another scale compared to the rest of EM,
0
20
40
60
80
100
120
140
160
09 10 11 12 13 14 15 16
Hungary Russia Turkey EMEA
Foreign bank claims, index (March 2009 = 100)

October 2016 For professional investors only
16
Thailand stands out in Asia, after China
Data on flows to China still opaque
there are other economies in Asia which have seen sizeable increases in foreign claims (chart 13). Thailand, in particular, stands out for the rate of increase. Indonesia and Malaysia are also notable for their above average growth in reliance on foreign banks. Perhaps unsurprisingly, Japan is a more active lender in the region than other major economies, accounting for 37% of foreign bank claims on Thailand and 20% of claims on Indonesia. Interestingly, Hong Kong banks rank second for Thailand and Indonesia, and actually have the biggest share of claims on Malaysia, at 15%. Our suspicion is that Hong Kong will often be a proxy for Chinese involvement in bank lending, with Chinese bank claims not reported. Given China’s global ambitions, it would be odd if there were not a significant Chinese lending presence, and this perhaps accounts for the large share of “unallocated” bank claims. Around 40–50% of bank claims on these three economies are not assigned to a particular country. Fed policy then perhaps matters less here, especially when we combine the low presence of US banks with the relatively low share of USD denominated lending (chart 10). The bigger risks here stem from the Japanese and Chinese monetary authorities, and we think liquidity problems in China would not take long to spread to these three regional economies as a result.
Chart 13: China is not the only Asian economy of concern
Source: Bank for International Settlements, Schroders Economics Group. 26 September 2016.
As for China, it turns out that 42% of foreign bank claims on the country come from banks located in Hong Kong, with Taiwanese banks in a distant second at 9%. Capital controls in China likely mean that Hong Kong banks are used as channels for overseas capital, so we should also consider the overseas claims on Hong Kong. The largest lender here is Japan (18%), followed by the UK (11%). The US comes in after Taiwan and Macao, with 7% of bank claims. The Eurozone as a whole accounts for some 13%, and there is also a reasonable Australian presence. Lending to China is most probably a fairly global industry. As for the recipients, 60% of claims on China are made on the banking sector, implying a sizeable chunk going to non-banks, but the data does not reveal whether the remainder is channelled towards non-bank financial institutions (shadow finance) or non-financial corporates. Either way, the rapid build up is troubling for what it says about China’s growing reliance on foreign capital, which is much harder to control than domestic flows. However, we would note that the rapid decline since mid-2015 (when the authorities devalued the currency and sparked a wave of FX repayments by firms nervous about further increases in the cost of their FX debt) has reduced vulnerabilities somewhat, even if there is much further to go.
50
100
150
200
250
300
350
400
09 10 11 12 13 14 15 16
Indonesia Malaysia Thailand Asia ex China
Foreign bank claims, index (March 2009 = 100)

October 2016 For professional investors only
17
Schroder Economics Group: Views at a glance
Macro summary – October 2016
Key points Baseline
We have trimmed our global growth forecast at 2.3% for 2016 as a result of downgrades to the US and Europe. For 2017, our forecasts are little changed, with growth strengthening modestly as a result of more stable emerging market activity. Global inflation rises modestly as a result of the recovery in oil prices.
The US Fed is expected to raise rates in December by 25 bps, so taking fed funds to 0.75% by end year. With inflation rising, further rate increases are expected in 2017 to 1.25% by end year, with the Fed moving cautiously on concerns about its impact on the rest of the world and the strength of domestic recovery.
UK to slow sharply following Brexit vote. The initial shock will cause business investment to fall, eventually leading to lower employment and wage growth. By 2017, the household sector will also feel the impact, but the economy narrowly avoids recession. The pound has fallen sharply which will result in higher inflation, but there are further downside risks to the currency. The BoE cut rates in August, and is likely to cut again to 0.1% in November. QE has also been expanded, but the BoE may need to extend purchases until the end of 2017.
Eurozone recovery continues in 2016, but at a marginally slower pace owing to the Brexit shock. It is likely to slow further in 2017 as inflation starts to rise, eating into the real disposable income of households. Inflation is still too low, and so the ECB is to cut rates further with the deposit rate falling to -0.5% by the end of the year where it stays through 2017. QE is likely to be extended to the end of 2017.
Japanese growth now forecast at 0.7% this year and inflation at -0.1%. Following the strengthening of the yen, the BoJ cuts rates and adds more QE over the forecast period. Easier fiscal policy provides a temporary boost to growth is eased in 2016 and the consumption tax hike pushed out from the end of 2016 and into 2017.
Emerging economies benefit from modest advanced economy demand growth and firmer commodity prices, but tighter US monetary policy weighs on activity. Concerns over China’s growth to persist, further fiscal support and easing from the PBoC is expected.
Risks
Risks skewed towards weaker growth on fears of secular stagnation, Brexit impact on Europe and a US recession. Inflationary risks stem from an increase in tariffs on trade, a significant wage acceleration in the US, or a global push toward reflation by policymakers.
Chart: World GDP forecast
Source: Thomson Datastream, Schroders Economics Group, August 2016 forecast. Please note the forecast warning at the back of the document.
4.9
2.6
3.1
3.8
4.94.5
5.1 5.1
2.3
-1.0
4.8
3.5
2.6 2.6 2.8 2.62.3
2.6
-3
-2
-1
0
1
2
3
4
5
6
00 01 02 03 04 05 06 07 08 09 10 11 12 13 14 15 16 17
Contributions to World GDP growth (y/y), %
US Europe Japan Rest of advanced
BRICS Rest of emerging World
Forecast
October 2016 For professional investors only
18
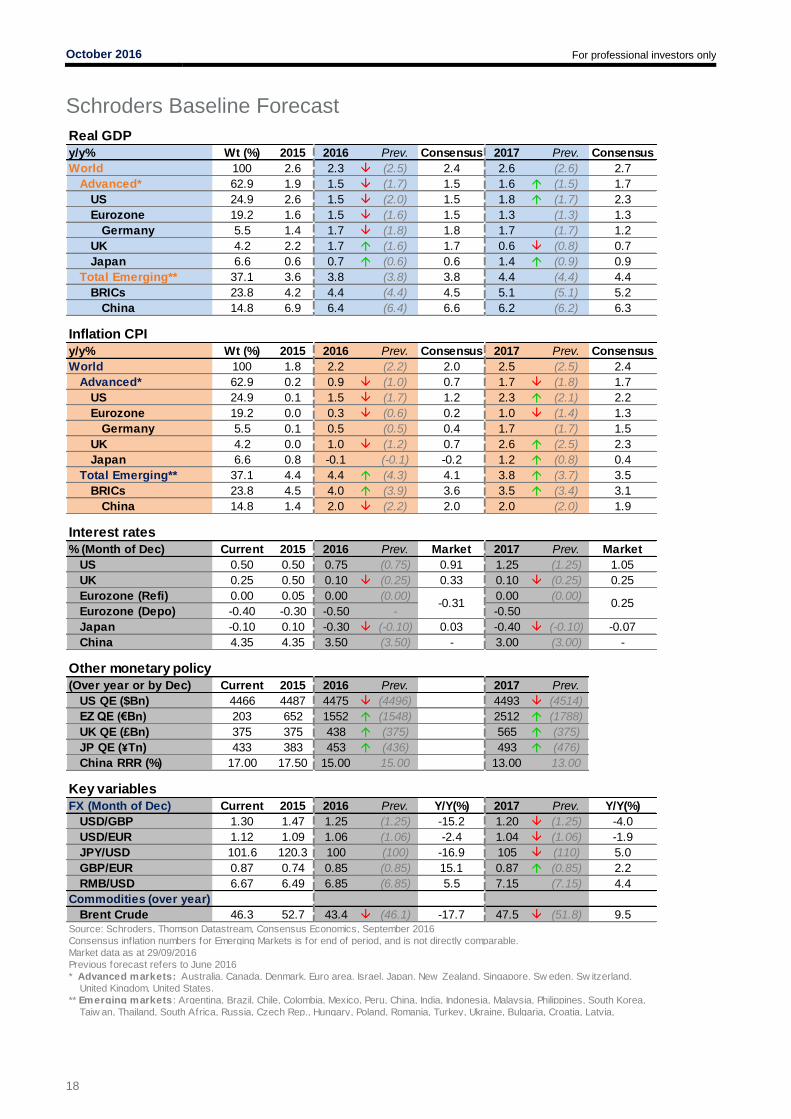
Schroders Baseline Forecast
Real GDP
y/y% Wt (%) 2015 2016 Prev. Consensus 2017 Prev. Consensus
World 100 2.6 2.3 (2.5) 2.4 2.6 (2.6) 2.7
Advanced* 62.9 1.9 1.5 (1.7) 1.5 1.6 (1.5) 1.7
US 24.9 2.6 1.5 (2.0) 1.5 1.8 (1.7) 2.3
Eurozone 19.2 1.6 1.5 (1.6) 1.5 1.3 (1.3) 1.3
Germany 5.5 1.4 1.7 (1.8) 1.8 1.7 (1.7) 1.2
UK 4.2 2.2 1.7 (1.6) 1.7 0.6 (0.8) 0.7
Japan 6.6 0.6 0.7 (0.6) 0.6 1.4 (0.9) 0.9
Total Emerging** 37.1 3.6 3.8 (3.8) 3.8 4.4 (4.4) 4.4
BRICs 23.8 4.2 4.4 (4.4) 4.5 5.1 (5.1) 5.2
China 14.8 6.9 6.4 (6.4) 6.6 6.2 (6.2) 6.3
Inflation CPI
y/y% Wt (%) 2015 2016 Prev. Consensus 2017 Prev. Consensus
World 100 1.8 2.2 (2.2) 2.0 2.5 (2.5) 2.4
Advanced* 62.9 0.2 0.9 (1.0) 0.7 1.7 (1.8) 1.7
US 24.9 0.1 1.5 (1.7) 1.2 2.3 (2.1) 2.2
Eurozone 19.2 0.0 0.3 (0.6) 0.2 1.0 (1.4) 1.3
Germany 5.5 0.1 0.5 (0.5) 0.4 1.7 (1.7) 1.5
UK 4.2 0.0 1.0 (1.2) 0.7 2.6 (2.5) 2.3
Japan 6.6 0.8 -0.1 (-0.1) -0.2 1.2 (0.8) 0.4
Total Emerging** 37.1 4.4 4.4 (4.3) 4.1 3.8 (3.7) 3.5
BRICs 23.8 4.5 4.0 (3.9) 3.6 3.5 (3.4) 3.1
China 14.8 1.4 2.0 (2.2) 2.0 2.0 (2.0) 1.9
Interest rates
% (Month of Dec) Current 2015 2016 Prev. Market 2017 Prev. Market
US 0.50 0.50 0.75 (0.75) 0.91 1.25 (1.25) 1.05
UK 0.25 0.50 0.10 (0.25) 0.33 0.10 (0.25) 0.25
Eurozone (Refi) 0.00 0.05 0.00 (0.00) 0.00 (0.00)
Eurozone (Depo) -0.40 -0.30 -0.50 - -0.50
Japan -0.10 0.10 -0.30 (-0.10) 0.03 -0.40 (-0.10) -0.07
China 4.35 4.35 3.50 (3.50) - 3.00 (3.00) -
Other monetary policy
(Over year or by Dec) Current 2015 2016 Prev. 2017 Prev.
US QE ($Bn) 4466 4487 4475 (4496) 4493 (4514)
EZ QE (€Bn) 203 652 1552 (1548) 2512 (1788)
UK QE (£Bn) 375 375 438 (375) 565 (375)
JP QE (¥Tn) 433 383 453 (436) 493 (476)
China RRR (%) 17.00 17.50 15.00 15.00 13.00 13.00
Key variables
FX (Month of Dec) Current 2015 2016 Prev. Y/Y(%) 2017 Prev. Y/Y(%)
USD/GBP 1.30 1.47 1.25 (1.25) -15.2 1.20 (1.25) -4.0
USD/EUR 1.12 1.09 1.06 (1.06) -2.4 1.04 (1.06) -1.9
JPY/USD 101.6 120.3 100 (100) -16.9 105 (110) 5.0
GBP/EUR 0.87 0.74 0.85 (0.85) 15.1 0.87 (0.85) 2.2
RMB/USD 6.67 6.49 6.85 (6.85) 5.5 7.15 (7.15) 4.4
Commodities (over year)
Brent Crude 46.3 52.7 43.4 (46.1) -17.7 47.5 (51.8) 9.5
Consensus inflation numbers for Emerging Markets is for end of period, and is not directly comparable.
Previous forecast refers to June 2016
** Emerging markets : Argentina, Brazil, Chile, Colombia, Mexico, Peru, China, India, Indonesia, Malaysia, Philippines, South Korea,
Taiw an, Thailand, South Africa, Russia, Czech Rep., Hungary, Poland, Romania, Turkey, Ukraine, Bulgaria, Croatia, Latvia,
-0.31 0.25
Source: Schroders, Thomson Datastream, Consensus Economics, September 2016
Market data as at 29/09/2016
* Advanced markets: Australia, Canada, Denmark, Euro area, Israel, Japan, New Zealand, Singapore, Sw eden, Sw itzerland,
United Kingdom, United States.

October 2016 For professional investors only
19
Updated forecast charts – Consensus Economics
For the EM, EM Asia and Pacific ex Japan, growth and inflation forecasts are GDP weighted and calculated using Consensus Economics forecasts of individual countries.
Chart A: GDP consensus forecasts
2016 2017
2016 2017
The forecasts included should not be relied upon, are not guaranteed and are provided only as at the date of issue. Our forecasts are based on our own
assumptions which may change. We accept no responsibility for any errors of fact or opinion and assume no obligation to provide you with any changes to
our assumptions or forecasts. Forecasts and assumptions may be affected by external economic or other factors. The views and opinions contained herein
are those of Schroder Investments Management’s Economics team, and may not necessarily represent views expressed or reflected in other Schroders
communications, strategies or funds. This document does not constitute an offer to sell or any solicitation of any offer to buy securities or any other instrument
described in this document. The information and opinions contained in this document have been obtained from sources we consider to be reliable. No
responsibility can be accepted for errors of fact or opinion. This does not exclude or restrict any duty or liability that Schroders has to its customers under the
Financial Services and Markets Act 2000 (as amended from time to time) or any other regulatory system. Reliance should not be placed on the views and
information in the document when taking individual investment and/or strategic decisions. For your security, communications may be taped or monitored.
0
1
2
3
4
5
6
7
8
Jan-15 Apr-15 Jul-15 Oct-15 Jan-16 Apr-16 Jul-16 Oct-16
%
EM
EM Asia
Pac ex Jap
UK
Japan
US
Eurozone
0
1
2
3
4
5
6
7
8
Jan Feb Mar Apr May Jun Jul Aug Sep
%
EM
EM Asia
Pac ex Jap
UK
Japan
US
Eurozone
-1
0
1
2
3
4
5
Jan-15 Apr-15 Jul-15 Oct-15 Jan-16 Apr-16 Jul-16 Oct-16
%
EM
EM Asia
Pac ex Jap
UK
Japan
USEurozone
0
1
2
3
4
5
Jan Feb Mar Apr May Jun Jul Aug Sep
%
EM
EM Asia
Pac ex JapUK
Japan
US
Eurozone
Chart B: Inflation consensus forecasts
Source: Consensus Economics (September 2016), Schroders.
Pacific ex. Japan: Australia, Hong Kong, New Zealand, Singapore.
Emerging Asia: China, India, Indonesia, Malaysia, Philippines, South Korea, Taiwan, Thailand.
Emerging markets: China, India, Indonesia, Malaysia, Philippines, South Korea, Taiwan, Thailand, Argentina, Brazil, Colombia, Chile, Mexico, Peru, Venezuela, South Africa, Czech Republic, Hungary, Poland, Romania, Russia, Turkey, Ukraine, Bulgaria, Croatia, Estonia, Latvia, Lithuania.