Schroder ISF* Global Corporate Bond - Schroders - … management... · Yields for all fixed income...
96
For professional advisors only. Not suitable for retail clients. *Schroder International Selection Fund is referred to as Schroder ISF Schroder ISF* Global Corporate Bond Portfolio positioning & global credit market outlook March 2013 Wesley Sparks, CFA Head of US Fixed Income Lead Fund Manager, Schroder ISF Global Corporate Bond
Transcript of Schroder ISF* Global Corporate Bond - Schroders - … management... · Yields for all fixed income...

For professional advisors only. Not suitable for retail clients.
*Schroder International Selection Fund is referred to as Schroder ISF
Schroder ISF* Global Corporate Bond Portfolio positioning & global credit market outlook
March 2013
Wesley Sparks, CFA
Head of US Fixed Income
Lead Fund Manager, Schroder ISF Global Corporate Bond

Topics for discussion
Global Credit market review
– A brief recap of 2012
Global Credit market outlook
– Opportunities & risks in 2013
– The macro backdrop
– Assessing the corporate bond market today
Schroder ISF Global Corporate Bond
– Portfolio positioning
– Performance & performance attribution
Schroders approach to Global Credit
– Team & process
Appendix
– Biographies of investment professionals
– Compliance disclosures
1

Global Credit
market review
A brief recap of 2012

16.35
10.3510.26
13.29
4.644.495.305.72
16.00
18.2318.14
0
5
10
15
20
Global
Aggregate
Global
Treasury
Global Agg
Agencies
Global Agg
Securitized
Global Agg
Covered
Bonds
Global Agg
Credit*
Global Agg
Sovereigns
Global
Emerging
Markets
Global
High Yield**
S&P
500
Russell
2000
Performance of broad market indices in 2012 Investment grade corporate bonds performed well, in-line with their beta profile
3
2012 total return by asset class (in %)
*Barclays Capital Global Aggregate Credit Index, USD Hedged ** Barclays Capital Global High Yield Corporate ex CMBS &EMG 2% Issuer Capped Bond Index, USD Hedged Note: All fixed income sectors reflect Barclays Capital indices; total returns for equity indices include the reinvestment of dividends; all total returns are expressed in USD for the 2012 year-to-date period through 31 December 2012 Source: Barclays Capital Live, Bloomberg

Returns across the credit quality spectrum in 2012 Lower quality credit outperformed higher-rated bonds
* Barclays Capital Global Aggregate Credit Index, USD Hedged
** Barclays Capital Global High Yield Corporate 2% Issuer Capped Bond Index, USD Hedged
Note: Total returns for all quality tiers reflect Barclays Capital indices; YTW is the average yield-to-worst of each quality tier
Source: Barclays Capital Live; 2012 data through 31 December 2012
Past performance is no guarantee of future results
6.08 7.2310.37
13.66
17.94 17.1820.89
32.54
-5
0
5
10
15
20
25
30
35
40
AAA AA A BBB BB B CCC CC
GAC Index* = +10.35%
GHY Index** = +18.23%
YTW: 1.33% 1.73% 2.26% 3.28% 4.80% 6.00% 9.42% 22.07%
OAS: +38 +81 +123 +208 +367 +502 +834 +1927
4
2012 total return (in %)

Returns across investment grade sectors in 2012 Insurance & banking were star performers; technology and non-corporates lagged
4.9
10.1
13.3
7.7 7.2
8.7
10.010.4 11.1
9.1
12.0 11.7
17.7
14.4
10.7
8.4
10.0
7.2 7.1
8.9
3.4
10.7
8.38.5
0
5
10
15
20
Basic
Industr
y
Capital G
oods
Com
munic
ations
Consum
er
Cyclic
al
Cons N
on-C
ycl
Energ
y
Technolo
gy
Tra
nsport
ation
Oth
er
Industr
ial
Ele
ctr
ic
Natu
ral G
as
Oth
er
Utilit
y
Bankin
g
Bro
kera
ge
Fin
ance C
o's
Insura
nce
RE
ITS
Oth
er
Fin
ancia
l
Gov't G
uara
nte
e
Gov't O
wned
Gov't S
ponsore
d
Local A
uth
ority
Sovere
ign
Supra
national
2012 total return by sector (in %)
Global Aggregate Credit Index = +10.35%
Note: Data reflect the total returns of the sectors of the Barclays Capital Global Aggregate Credit Index, USD Hedged, for the full year 2012 through 31 December 2012
Source: Barclays Capital Live
5

Various macro risks flared up at different times during 2012 Macro risks sparked a wave of volatility in Q2, but cleared the way for a Q3 rally
US fiscal policy mismanagement (falling over the “fiscal cliff” in 2013) ▲
Spain & renewed European contagion crisis ▲
Eurozone austerity measures
Soft patch (“growth scare”) in US in Q2/Q3 ▲
China hard landing & slowdown across EM ▲
French election & policy rift with Germany on policy issues for fiscal unity in Eurozone ▼
Oil price spike & rising gasoline prices ▼… then ▲ …and then… ▼
Surge in corporate bond supply and shareholder friendly activities ▲
6
As some of the macro risks dissipated in recent months, credit rallied significantly
The views contained herein are those of the Fund Manager; comments as of 31 December 2012; direction of arrows indicate whether risks were ascendant or descendant Forecast risk warning: Please refer to the important information slide at the end of the presentation

Global Credit
market outlook
Opportunities & risks in 2013

3.39
2.39
1.80
2.422.13
1.33 1.411.70
2.24
6.13
4.28
0
2
4
6
8
Global
Aggregate
Global
Treasury
Global Agg
Agencies
Global Agg
Securitized
Global Agg
Covered
Bonds
Global
Aggregate
Credit
Global Agg
Sovereigns
Global
Emerging
Markets
Global
High Yield
S&P
500
DAX
Yield as a starting point to estimate total returns in 2013 Coupon income will likely be the predominant driver of total returns this year
8
Yield (in %)
Yields for all fixed income sectors reflect the yield-to-worst of the respective Barclays Capital index; yields for equity indices reflect the dividend yield; The Global Credit index is the Barclays Capital Global Aggregate Credit Index, and the Global HY index is the Barclays Capital Global High Yield Corporate ex CMBS & EMG 2% Issuer Capped Bond Index ;all data as of year-end 31 December 2012 Sources: Barclays Capital Live, Bloomberg
Aa1/Aa2 Aa1/Aa2 Aaa/Aa1 Aa1/Aa2 A2/A3 A3/Baa1 Baa3/Ba1 B1/B2
average ratings of index

Investors contend with a low yield world in 2013 In seeking positive real returns, investors will take various risks to pick up yield
Extend duration
Go down the credit quality
Go down in liquidity
Accept worse bond structures (less call protection, less covenant protection)
Go down the capital structure
9
These risks must be managed as the market environment changes
The views and opinions contained herein are those of the Fund Manager; comments as of 31 January 2013 Forecast risk warning: Please refer to the important information slide at the end of the presentation

Investment grade returns exceeded expectations in 2012 2013 has gotten off to a tougher start than last year did for several reasons
2013 year-to-date total return (in %)
Data reflect the total returns of the Barclays Capital Global Aggregate Credit USD Hedged Index; data through 28 February 2013
Source: Barclays, Bloomberg
2012 total return (in %)
-2
0
2
4
6
8
10
12
Ja
n-1
2
Ma
y-1
2
Au
g-1
2
De
c-1
2
-2
0
2
4
6
8
10
12
01
-Ja
n-1
3
31
-Ja
n-1
3
02
-Ma
r-1
3
YTD 2013 total return
-0.07% as at 28 Feb
2012 total return
+10.36%
10

120
140
160
180
200
220
240
260
Okt-
11
Nov-1
1
Dez-1
1
Jan
-12
Feb
-12
Mrz
-12
Ap
r-12
Mai-1
2
Jun
-12
Jul-
12
Au
g-1
2
Se
p-1
2
Okt-
12
Nov-1
2
Dez-1
2
Jan
-13
Feb
-13
Global Aggregate Credit OAS*
Time for a potential pause after a 7-month rally? A key question is whether this is a healthy consolidation or the start of a correction
*OAS reflects the option-adjusted spread of the Barclays Global Aggregate Credit Index
Source: Barclays, Bloomberg; data through 28 February 2013
+130 bps as at 28 Feb
(in basis points)
11

Global Credit
market outlook
The macro backdrop

Policy stimulus & muted volatility support tighter spreads Accommodative policies worldwide can dampen volatility and tighten spreads
Monetary & fiscal stimulus surged in 2012
13
0
10
20
30
40
Se
p-1
1
Oct-1
1
No
v-1
1
De
c-1
1
Ja
n-1
2
Fe
b-1
2
Ma
r-12
Ap
r-12
Ma
y-1
2
Ju
n-1
2
Ju
l-12
Au
g-1
2
Se
p-1
2
Oct-1
2
No
v-1
2
De
c-1
2
Number of stimulative policy initiatives globally
Source: ISI, Daily Economic Report, 13 September 2012; Schroders comments through 31 December 2012
Global stimulus supports risk sentiment
– There were 275 policy easings worldwide in 2012
– The Fed, ECB, UK, Japan & China were all active
– Monetary stimulus already announced is likely to
boost growth in coming quarters
ECB actions under Mario Draghi represented a departure from former policy approach
– Reflects increased willingness to use ECB balance
sheet to address peripheral funding needs
The Fed’s unconventional policies work in several ways to boost high yield valuations
– Low rates encourage the reach for yield
– Fed asset purchases in MBS & Treasuries cause
investors to redeploy cash into other asset classes
– Lower mortgage and consumer rates encourage
refinancing activity as well as fresh borrowing
– Higher asset prices contribute to the wealth effect

Interest Rate volatility is measured by the MOVE Index which is calculated as the weighted average of implied volatility of 1 month option expirations on the current 2-, 5-, 10- and
30-year Treasuries; Equity Volatility is measured by the VIX Index which is an exchange traded contract on the CBOE based on real-time prices of options on the S&P 500 Index
Sources: Bloomberg, Bank of America Merrill Lynch and Chicago Board of Options Exchange; daily data through 14 February 2013
Monetary policy in action…reducing market volatility Volatility waves are less severe as central banks have become more active
Measures of Implied Volatility
European break-
up fears and
global slowdown
VIX (in %)
US downgrade by S&P
and European contagion Greek debt crisis
US financial
crisis
MOVE (in basis points)
Latest data (14 Feb 2013):
MOVE 59.1
VIX 12.6
14

Unemployment Rate
US monetary policy to remain extremely accommodative Dec FOMC statement: The Fed will be patient before removing the punch bowl
15
0
1
2
3
4
5
6
7
8
9
10
11
12
De
c-8
8
De
c-9
0
De
c-9
2
De
c-9
4
De
c-9
6
De
c-9
8
De
c-0
0
De
c-0
2
De
c-0
4
De
c-0
6
De
c-0
8
De
c-1
0
De
c-1
2
De
c-1
4
December 2012:
7.8%
avg. UE rate since 1989 = 6.0%
(US unemployment rate total in labor force, SA)
FOMC stated threshold = 6.5%
?
Personal Consumption Expenditure Core Index
0
1
2
3
4
5
6
De
c-8
8
De
c-9
0
De
c-9
2
De
c-9
4
De
c-9
6
De
c-9
8
De
c-0
0
De
c-0
2
De
c-0
4
De
c-0
6
De
c-0
8
De
c-1
0
De
c-1
2
De
c-1
4
November 2012:
1.5%
Avg. Core PCE since 1989 = 2.24%
(US PCE Deflator Core, year-over-year change, SA)
FOMC stated threshold = 2.5%
?
Fed Threshold: 6.5% UE Rate
Fed Threshold: 2.5% Core PCE Deflator
Sources: Federal Open Market Committee statement, 12 December 2012, and Bloomberg; data through 31 December 2012

US Labor Participation Rate
US monetary policy to remain extremely accommodative Better growth will draw back workers, tepid consumption will restrain inflation
16
62
63
64
65
66
67
68
Dec-8
8
Dec-9
0
Dec-9
2
Dec-9
4
Dec-9
6
Dec-9
8
Dec-0
0
Dec-0
2
Dec-0
4
Dec-0
6
Dec-0
8
Dec-1
0
Dec-1
2
Dec-1
4
December 2012:
63.6%
20 year average prior to 2009 = 66.5%
(Percent of US population in labor force, SA)
?
Consumer Credit
-10
-5
0
5
10
15
20
25
Dec-8
8
Dec-9
0
Dec-9
2
Dec-9
4
Dec-9
6
Dec-9
8
Dec-0
0
Dec-0
2
Dec-0
4
Dec-0
6
Dec-0
8
Dec-1
0
Dec-1
2
Dec-1
4
October 2012:
1.05%
(Revolving consumer credit, year-over-year, SA)
Credit growth is barely positive
?
Lower participation = ~3.0% lower u/e rate
Lower credit creation restraining inflation
Sources: Federal Reserve, Bureau of Labor Statistics

Latest data (14 Feb 2013):
G10 +12.8
US -5.0
EM -10.8
Citigroup Economic Surprise Index (CESI)
Sources: Citigroup and Bloomberg; daily data from 2007 through 14 February 2013
The Citigroup Economic Surprise Indices (CESI) are objective and quantitative measures of economic news defined as weighted historical standard deviations of data surprises
(actual releases versus the median of Bloomberg surveys); a negative reading of a CESI indicates that economic releases have been below consensus on balance. CESI data are
calculated daily in a rolling 3-month window. The weights of economic indicators are derived from relative high-frequency spot FX impacts of 1 standard deviation data
surprises. The indices also employ a time decay function to replicate the limited memory of markets. The Bloomberg tickers for the three data series are CESIUS <Index>,
CESIG10 <Index>, and CESIEM <Index>
The latest data isn’t reassuring… Downtrends in the CESI have led to “risk off” periods & eventual policy response
17

ECB balance sheet has shrunk over the past
6 months – accelerating since beginning of
year
Falling by 10% since July 2012
(including the recent LTRO repayment)
Central bank balance sheets
Sources: Bloomberg, Credit Suisse
Modest liquidity withdrawal in Europe
50
100
150
200
250
300
350
400
450
2008 2009 2010 2011 2012 2013
ECB Fed BoE BoJ
Normalised from Jan-2008
12.5%
8.7%
5.1%
-9.6%
-15%
-10%
-5%
0%
5%
10%
15%
BoE BoJ Fed ECB
% change in balance sheet since July 2012
18

Global Credit
market outlook
Assessing the
corporate bond market today

The outlook for Global Credit in 2013
20
Key market drivers appear balanced this year, after the rally in 2012
Credit fundamentals are solid, but are no longer improving
– Credit ratios starting to deteriorate as shareholder-friendly activities increase
– Management teams remain cautious and continue to protect their liquidity profile
– Slow economic growth and persistent macro headwinds will keep monetary policy extremely accommodative
Technical conditions are supportive of spreads at current or tighter levels
– New institutional mandates in IG credit continue to fuel demand for corporate bonds
– IG mutual funds continue to experience consistent net inflows even during market volatility
– Dealer inventories remain light
– Net supply will be quite low over the next 12 months, especially after accounting for coupon payments
Valuations remain attractive on a relative basis
– Spreads still have room to tighten further, based on fundamental valuation frameworks
– Yields are still attractive relative to cash equivalents and government bonds
– Investment grade corporate bonds have much lower volatility than equities or high yield bonds
The views and opinions contained herein are those of the Fund Manager; please note these are forecasted views; views as of 28 February 2013
Refer to the end of this presentation for important information
Total returns in investment grade corporate bond are likely to be in mid- single digits
… not much more than the current yield of ~2.5%, but better than cash & governments

The outlook for Global Credit in 2013 What risks are most likely to upset the market…or drive spreads tighter yet?
Key market drivers
Interest rate risk
Default risk (and fallen angel risk)
Event risk
Changes in the risk premium
21
Changes in the risk premium will be the key driver of returns in credit in 2013
The views and opinions contained herein are those of the Fund Manager; comments as of 28 February 2013 Forecast risk warning: Please refer to the important information slide at the end of the presentation

Corporate governance and accounting standards in “newly” developed markets
Corporate fundamentals are deteriorating
U.S. companies are re-leveraging
New issues quality is worsening (dividends, share buybacks)
Equity holders are increasingly favoured over bondholders
Valuation gap between acquirers and targets is closing as equity prices have rallied
Unintended effects of QE
European consumer squeeze to continue for the next couple of years
Currency war and loss of competitiveness
Inflation in real asset prices across the globe
Key market hurdles for 2013 Several mid-cycle themes could surface in the first half of the year
The views and opinions contained herein are those of the Fund Manager; please note these are forecasted views; views as of 28 February 2013
Refer to the end of this presentation for important information
22

Surveys on bank lending standards
US corporate lending conditions improved in 2012 Fed bank survey showed net easing in Q2 & Q3, and loan volumes are up >10%
(percentage of banks tightening standards)
23
Bank lending volume growth
(12-month percentage change)
Sources: Federal Reserve, ECB, IIF, Bank of America Merrill Lynch Global Research, High Yield Credit Chartbook, 4 December 2012; data through 30 November 2012
Compared to US bank lending conditions, EU conditions remain much worse:
■ The ECB survey of EU lending conditions has shown tightening in each of the past 6 quarters
■ EU corporate lending volumes have contracted by -2.1% yoy

Fundamental backdrop is one of slow growth Earnings reports are showing slow growth on both the top line & bottom line
Revenue growth (S&P500 ex-financials*) (year-over-year growth)
Earnings growth (S&P500 ex-financials*) (year-over-year growth)
*Data through 4Q 2012 earnings reports for S&P500 companies; Q4 data include 318 companies (ex-financials) which have reported so far through Thursday, 14 February 2013 Sources: Standard & Poor’s, Compustat, First Call, Worldscope, FactSet and UBS; UBS 4Q Earnings Season Summary, 15 February 2013
■ 71% of companies beat consensus on Earnings, and
22% of companies missed in Q4 ■ 54% of companies beat consensus on Revenues,
and 26% of companies missed so far in Q4
24

Revenues & EPS growth are slowing down Leverage has ticked up in recent quarters
Corporates are spending more cash
Balance sheet re-leveraging in investment grade credit Earnings have flat-lined; leverage is ticking up; cash is being spent but not on capex
25
CapEx has slowed in 2H12
1.00
1.25
1.50
1.75
2.00
2.25
3Q05 3Q06 3Q07 3Q08 3Q09 3Q10 3Q11 3Q12
Gross Leverage Net Leverage
12%
14%
16%
18%
20%
22%
24%
26%
3Q05 3Q06 3Q07 3Q08 3Q09 3Q10 3Q11 3Q12
Cash as % Tot Debt
-5
0
5
10
15
20
25
30
1'500
1'700
1'900
2'100
2'300
2'500
2'700
2'900
3'100
4Q07 4Q08 4Q09 4Q10 4Q11
($) ($bn)
Revenue EPS
6.2
6.4
6.6
6.8
7.0
7.2
7.4
7.6
7.8
8.0
8.2
92
94
96
98
100
102
104
106
108
Dec-02 Dec-03 Dec-04 Dec-05 Dec-06 Dec-07 Dec-08 Dec-09 Dec-10 Dec-11
% Index
Leading Indicators Capex as a % of GDP
S&P 500 EPS
Sources: Barclays 2013 Investment Grade Supply Outlook, January 2013

0
500
1'000
1'500
2'000
2'500
3'000
3'500
0
100
200
300
400
500
600
Dec-05 Dec-06 Dec-07 Dec-08 Dec-09 Dec-10 Dec-11
# deals ($bn)
Volume Deal Count
Corporates are looking to create value for shareholders ($bn)
S&P Dividend Yld vs. avg industrial long YTM
Global announced M&A volumes
Re-leveraging likely to be a driver of IG industrial issuance More shareholder-friendly activities could threaten the US IG market in 2013
26
0
100
200
300
400
500
600
700
800
1Q06 1Q07 1Q08 1Q09 1Q10 1Q11 1Q12Dividends Share Repurchases
3.5
4.5
5.5
6.5
7.5
8.5
9.5
1.5
2.5
3.5
4.5
Dec-02 Dec-03 Dec-04 Dec-05 Dec-06 Dec-07 Dec-08 Dec-09 Dec-10 Dec-11
Index Yield Dividend Yield
Dividend Yield (Gross) (SPX Index) (R1)
Invest. Grade: Industrial - Long - Yield to Maturity
M&A activity has the potential to significantly impact industrial supply
M&A volumes
4Q10: $659
1Q11: $595
2Q11: $651
3Q11: $547
(in $ billions)
4Q11: $418
1Q12: $491
2Q12: $567
3Q12: $484
Sources: Barclays 2013 Investment Grade Supply Outlook, January 2013

(US$ billions)
Total spread product net issuance and Fed adjusted supply
With the Fed actively buying Treasuries & MBS, net supply for the private sector will be negative
Net supply across all spread product will be negative! There will be a dearth of bonds with any yield for the private sector in 2013
27
Note that in 2013, the Fed will be buying $40 billion per month in MBS and $45 billion per month in Treasuries, versus a forecasted total of $93 billion per month in total net
spread product supply & Treasury supply; there were no Fed purchases of securities during the 2004-2008 period
Source: JP Morgan, 14 December 2012
364
-116
-800
-400
0
400
800
1,200
1,600
200
4
200
5
200
6
200
7
200
8
200
9
201
0
201
1
201
2
F20
13
Total spread product net issuance Fed-adjusted total spread product net issuance

Note: Mutual fund sectors are listed in order of the % change in total net fund flows during 2012 Source: EPFR Global, Bank of America Merrill Lynch; data through 31 December 2012
Mutual fund net flows (including ETFs) – various asset classes
Mutual fund flows: A key barometer of investor demand There’s plenty of “dry powder” left for a continued shift out of cash & gov’t bonds
28
Quantitative easing and financial repression should
drive cash out of money market funds in 2013
Mutual Fund Sector
2012 YE Assets (in $mn)
2012 Change (in $mn)
2012 Net Fund Flows by Sector as a % of Asset Base
Non-US High Yield 207,635 40,135
EM Debt (Global) 303,561 56,595
Leveraged Loans 75,307 10,755
US High Yield 313,129 32,219
High Grade Corporates 1,735,715 166,141
All Fixed Income 3,385,695 327,706
Munis 638,870 51,609
Commodities 167,646 12,105
Money Markets 2,655,934 21,063
Equities 6,427,534 -26,762
36.7
30.8
20.3
13.3
9.7
8.1
0.8
-0.5
12.2
11.9

($ billions)
US Investment Grade mutual fund flows – 2012-2013
Investment grade mutual funds continue to have net inflows Demand was strong in 2012 and inflows have remained positive in 2013
Source: EPFR Global, Bank of America Merrill Lynch; data through 27 February 2013
29
+$1.7 billion net inflows in latest week – ending February 27th

The "Great Rotation" is unlikely to be the reality in 2013
Sources: Federal Reserve Flow of Funds, Barclays Capital; graphs based on annual observations since 1955 and the flows reflect the sum of life insurance, property & casualty insurance, private pension fund, and state & local pension fund categories; data through 31 December 2012
Many investors can’t shift asset allocation from Fixed Income & HY into equities
30
Demand for corporate bonds by Insurance Companies and Pension Funds versus changes in the 10-Year Treasury yield
Net flows into Credit T10 Yield
Historically there has been virtually zero correlation between changes in 10-year Treasury yields and institutional demand
Flows into Credit – annual data since 1955
■ Regulatory & risk constraints will prevent some investors from rotating into equities
■ There were only two instances in the past 60 years when insurance co’s & pension funds were net sellers of credit – in 2000 and 2008 – both of which were periods of falling interest rates and “risk off”

0
100
200
300
400
500
Ja
n-0
3
Ja
n-0
4
Ja
n-0
5
Ja
n-0
6
Ja
n-0
7
Ja
n-0
8
Ja
n-0
9
Ja
n-1
0
Ja
n-1
1
Ja
n-1
2
Ja
n-1
3
0
1
2
3
4
5
6
7
8
Ja
n-0
3
Ja
n-0
4
Ja
n-0
5
Ja
n-0
6
Ja
n-0
7
Ja
n-0
8
Ja
n-0
9
Ja
n-1
0
Ja
n-1
1
Ja
n-1
2
Ja
n-1
3
(in basis points)
+129 bps OAS as at
31 Jan 2013
average OAS since 2003 = +139
(in %)
average yield since 2003 = 4.32 %
2.55% yield as at
31 Jan 2013
Global Credit Index yield* Global Credit Index spread**
Investment grade credit market valuations Corporate bond spreads remain relatively attractive even after the recent rally
*Yield” reflects the yield-to-worst of the Barclays Capital Global Aggregate Credit Index; data available since January 2001
** Spread” is the Option-Adjusted Spread (OAS)
Source: Barclays Capital; data through 31 January 2013
31

The Fed will keep short-term rates extremely low into 2014…investors will seek yield
Yield
Investment grade credit market valuations Corporate bond yields are compelling relative to cash equivalents
0
1
2
3
4
5
6
7
8
Ja
n-0
1
Ja
n-0
2
Ja
n-0
3
Ja
n-0
4
Ja
n-0
5
Ja
n-0
6
Ja
n-0
7
Ja
n-0
8
Ja
n-0
9
Ja
n-1
0
Ja
n-1
1
Ja
n-1
2
Ja
n-1
3
Barclays Global Aggregate Credit Index 3-month LIBOR 3-month T-bills
(in %)
0.30% 3m LIBOR
0.07% 3m T-bills
2.55% yield at
31 Jan 2013
“Yield” reflects the yield-to-worst for the Barclays Capital Global Aggregate Credit Index; data available since January 2001
Source: Barclays Capital; data through 31 January 2013
32
The last time the Fed normalized rates

EM corporates are an area of opportunity in 2013
Source: JPMorgan, Bloomberg; data through 7 January 2013
33
EM IG Corp Relative to US IG Corp Spreads
0
20
40
60
80
100
120
140
0
50
100
150
200
250
300
350
400
450
Jan 2
01
0
Apr
20
10
Jul 201
0
Okt 20
10
Jan 2
01
1
Apr
20
11
Jul 201
1
Okt 20
11
Jan 2
01
2
Apr
20
12
Jul 201
2
Okt 20
12
Jan 2
01
3
Difference (RHS) CEMBI BD IG (LHS) JULI Ex-EM (LHS)
EM IG Corporate spread basis to US IG remains wide

0.0 1.0 2.0 3.0 4.0
A
BBB
BB
B
0 50 100 150 200 250 300 350
A
BBB
BB
B
Investors are well compensated for balance sheet leverage in EM
EM corporates are an area of opportunity in 2013
Note: Leverage is debt / EBITDA, and the leverage multiple is expressed in the number of turns of leverage (“x”)
Source: Bank of America Merrill Lynch; data as of August 2012
34
Turns of net leverage Spread per turn of leverage
EM Corporates US Corporates
Basis points / x Net leverage, x
EM Corporates have lower
leverage than similarly
rated US Corporates
EM Corporates provide more
compensation per unit of leverage
than do US credits

Outlook for Global Credit: Possible shifts in sentiment
35
Monetary policy loses its potency and concerns of
recession re-emerge
Global trade slows – no regional engine of growth
Corporate earnings expectations prove difficult to
meet – costs grow but pricing power deteriorates
Zombies fail – losses escalate, banks foreclose,
defaults rise
Growth/inflation trade-off tips toward inflation over
growth – stagflation is bad for nominal asset prices
Exchange rate battles turn to war – many nations
attempt to boost their competitive landscape
Social unrest destabilises political norm – high
unemployment, negative real income growth leaves
people irritable and hungry
Supply starts to overwhelm demand
Household & business confidence improves
Improving household balance sheets and/or improving new order to sales ratio for businesses
Investment intentions rise
Global trade accelerates
Employment accelerates, real incomes rise, corporate profits increase through orders rather than cost cutting
Decreased need for austerity measures
Monetary policy remains accommodative
Indicators for risk avoidance Indicators for risk seeking
Signposts to monitor for potential market turns & the need for tactical hedges
The views and opinions contained herein are those of the Fund Manager; comments as of 28 February 2013 Forecast risk warning: Please refer to the important information slide at the end of the presentation

Outlook for Global Credit: Possible shifts in sentiment Schroders Global Quant Scorecard – monthly update at 7 Feb 2013: HIGHER
36
Sources: Schroders Fixed Income Quantitative team; data as of 5 February 2013
Credit Index is going up
– Fund flows have been positive in January, the
decrease of positive flows has stopped so the
score is still negative (but less so from -2 to -1)
– On the contrary, custody flow in HY bonds are
extremely strong (mutual bond funds have been
buying a lot of HY bonds at an increasing pace),
the last time we had such a level of buying was in
Jul-12 and prior to that Jan-11 (the score goes
from -1 to +2)
– Equity sentiment and valuation are stable

Outlook for Global Credit in 2013 Summary of key trends likely to dominate this year
■ Dispersion of returns across issuers and across industries becomes greater over the next year
■ Event risk will become a greater risk as the year progresses
■ The Emerging Markets share of the global credit universe will continue to grow
■ Market segmentation will prevent a major asset allocation rotation out of credit into equity
■ A punctuated volatility market environment may require tactical hedging & nimble repositioning
37
The views and opinions contained herein are those of the Fund Manager; comments as of 28 February 2013 Forecast risk warning: Please refer to the important information slide at the end of the presentation
Changes in the risk premium will be the key driver of returns in credit in 2013

Schroder ISF
Global Corporate Bond
Portfolio positioning

Schroder ISF Global Corporate Bond Active management in the face of changing market conditions is key
– the majority of the portfolio’s total assets will be invested in corporate bonds at all times
– up to 20% of the portfolio may be invested in High Yield
– no currency speculation; focus is on picking best credit opportunities anywhere globally
–
This is a “pure play”
corporate bond fund
– cash & cash equivalents may be held (no specific limitation)
– government bonds (up to 20% of total portfolio assets)
– a portfolio management focus on maintaining liquidity of fund investments
Defensive tools
use of credit default swaps to hedge exposure and tail risk:
– single-name CDS (both long risk and short risk positions)
– CDS indices (iTraxx in Europe and CDX in the US)
– options on CDS indices (typically, buying a payer option with a 3-month expiry)
CDS can provide protection
– use of interest rate futures to manage duration exposure
– yield curve positioning is coordinated with Schroders government specialists based on
outlook for changes in monetary policy and technical factors impacting curve shape
Duration management
can also help
39
The views and opinions contained herein are those of the Fund Manager; comments as of 28 February 2013 Forecast risk warning: Please refer to the important information slide at the end of the presentation

“Fund” is Schroder ISF Global Corporate Bond, and “Benchmark” reflects the Barclays Capital Global Aggregate Credit Index
The number of cash bond holdings excludes cash and cash equivalents and derivatives positions (CDS, interest rate futures, and f/x forwards)
“OAS” reflects the option-adjusted spread vs Treasuries
Sources: Schroders Fixed Income Analytics, Barclays Capital; all data as of 28 February 2013
Schroder ISF Global Corporate Bond The portfolio provides greater income than the index
■ We own <20% of the total number of
issuers and only <6% of the bonds in
the index
■ The Fund provides a pick-up in yield
and in spread relative to the benchmark
■ We extended portfolio duration in
February after the yield back-up
■ DTS overweight reflects our outlook for
lower-rated, higher-yielding credit to
outperform and for spread compression
among mid-duration corporate bonds
40
Summary statistics Fund Benchmark Difference
Number of issuers 416 2229
Number of cash bond holdings 496 9336
Market value $ 3.75 bn $ 9.50 tn
Avg. credit rating A- A
Avg. effective yield (in %) 2.94 2.43 +0.51
Avg. OAS (in bps) +187 +129 +57
Avg. convexity 0.76 0.68 +0.08
Avg. effective duration (years) 6.23 6.02 +0.21
Avg. spread duration (years) 6.34 5.98 +0.36
Duration-times-spread (DTS) 11.92 8.30 +3.62
Fund spread beta 1.44x

3.36.4
17.3
1.8
10.0
39.1
7.54.2
0.23.3
7.1
14.0
38.5
33.9
0.0 0.8
-20
0
20
40
60
Cash &T-bills
Treasuries AAA AA A BBB BB B CCC NR NetDerivatives
Offset
Fund Benchmark
Credit quality composition (in market value %)
Fund positioning by credit quality We are positioned with a credit barbell to avoid the event risk of AA/A credits
Fund data represent Schroder ISF Global Corporate Bond holdings of bonds and net CDS exposure in each ratings category
“Benchmark” is the Barclays Capital Global Aggregate Credit Index
Note: the quality composition is based on the middle credit ratings of Moody’s, S&P, and Fitch (benchmark classification rules)
Sources: Schroders Fixed Income Analytics, Barclays Capital; all data as of 28 February 2013
41
very underweight AA & A credit
11.9% High Yield exposure
conservative leg of credit barbell
overweight BBBs

54.1
15.019.0
4.0 3.4 1.9 0.2 0.2 2.3
42.5
7.8
22.9
3.9 2.68.3
0.3 2.39.3
0
20
40
60
80
NorthAmerica
UnitedKingdom
Europe PeripheralEurope
SouthAmerica
Asia Africa Oceania Supra-nationals
Fund Benchmark
Portfolio positioning by geography & currency bloc Avoiding regions with tight valuations or structural headwinds
Regional exposure (in market value %)
65.7
14.7 17.9
1.7
60.4
24.1
7.03.0 5.4
0
20
40
60
80
USD GBP EUR JPY Other
42
“Fund” refers to Schroder ISF Global Corporate Bond; “Benchmark” is the Barclays Capital Global Aggregate Credit Index
“Peripheral Europe” includes Spain, Italy, Greece, Ireland & Portugal; “Other “ in currency exposure for the Fund includes P&L from FX forwards
Sources: Schroders Fixed Income Analytics, Barclays Capital; all data as of 28 February 2013
all currency exposures are hedged to USD in the Fund
Currency allocation (in market value %)
Fund’s total exposure in EM
(by country of risk): 9.8%

Duration (in years)
The Fund’s duration has been managed neutral to short duration since 2009
43
“Fund” refers to Schroder ISF Global Corporate Bond; “Benchmark” is the Barclays Capital Global Aggregate Credit Index
Source: Schroders Fixed Income Analytics; data through 28 February 2013
4.0
4.5
5.0
5.5
6.0
6.5
Nov 0
9
Fe
b 1
0
Mai 10
Au
g 1
0
Nov 1
0
Fe
b 1
1
Mai 11
Au
g 1
1
Nov 1
1
Fe
b 1
2
Mai 12
Au
g 1
2
Nov 1
2
Fe
b 1
3
Fund Benchmark
Portfolio positioning – managing interest rate risk
Portfolio duration has been neutral to short duration,
…but spread duration (and DTS) has been overweight

Portfolio positioning – key drivers of portfolio construction Our recent trading activity is aligned with our investment themes
Positioning comments are as of 28 February 2013; please note that portfolio holdings can change at any time
44
■ Maintaining exposure to credits that should fare well in a slow growth environment
■ Avoiding event risk: selling (or buying protection in CDS on) credits vulnerable to re-leveraging
■ Carrying ~7-10% exposure to High Yield credits in sectors with favorable industry dynamics
■ Allocating toward Emerging Markets
■ Executing relative value swaps along the credit curve or within the capital structure
■ Managing interest rate risk, especially in the 7-10-year duration range
■ Utilizing CDS as tools to navigate volatility and capitalize on pricing anomalies
■ Continuing to favour liquid issues and preserve fund liquidity

0.1
2.5
0.2
0.1
1.8
0.1
0.6
0.5
1.6
0.6 0
.8
0.3
0.1
0.7
0.7
0.2 0.2
0.0
0.9
0.1 0.2
0.1
0.1
1.6
0.1 0
.2
0.0
0.7
0.1
0.4
0.2
0.8
0.4
0.6
0.4
0.1 0.2 0.2
0.5
0.3
0.1
0.0
0.0
0.5
0.3
0.0
0.4
0.1
-0.5
0.0
0.5
1.0
1.5
2.0
2.5
3.0
Cove
red
Bankin
g
Bro
ke
rage
Fin
ance
Co
's
Fin
ancia
l O
ther
Insura
nce
Reits
Basic
In
dustr
y
Capital G
oods
Com
munic
atio
ns
Consum
er
Cycl
Consum
er
Non
-Cycl
Energ
y
Ind
ustr
ial O
ther
Technolo
gy
Tra
nsport
ation
Ele
ctr
ic
Natu
ral G
as
Utility
Oth
er
Gov't G
uara
nte
e
Gov't S
po
nsore
d
Gov't O
wn
ed
Local A
uth
orities
DM
Sov'n
EM
Sov'n
Supra
natio
nal
Whole
Busin
ess
Fund Benchmark
Portfolio positioning by sector We carry the most credit exposure in financials and communications
45
Sector allocation (in DTS)
“Fund” refers to Schroder ISF Global Corporate Bond; “Benchmark” is the Barclays Capital Global Aggregate Credit Index; ”DTS” is duration-times-spread;
“o/w” denotes those sectors that the Fund is overweight on a DTS basis versus its benchmark; CDS positions are reflected above in the appropriate sector classification
Sources: Schroders Fixed Income Analytics, Barclays Capital; all data as of 28 February 2013

0.1
0.9
-0.1 0.0
0.1
1.1
0.0
0.3
0.2
0.7
0.3
0.2
-0.1
-0.6
-0.1
0.5
0.1
-0.1
0.2
0.0
0.0
0.5
-0.2
0.0
-0.3 -0
.1
0.1
-1.0
-0.5
0.0
0.5
1.0
1.5
Cove
red
Bankin
g
Bro
ke
rage
Fin
ance
Co
's
Fin
ancia
l O
ther
Insura
nce
Reits
Basic
In
dustr
y
Capital G
oods
Com
munic
atio
ns
Consum
er
Cycl
Consum
er
Non
-Cycl
Energ
y
Ind
ustr
ial O
ther
Technolo
gy
Tra
nsport
ation
Ele
ctr
ic
Natu
ral G
as
Utility
Oth
er
Gov't G
uara
nte
e
Gov't S
po
nsore
d
Gov't O
wn
ed
Local A
uth
orities
DM
Sov'n
EM
Sov'n
Supra
natio
nal
Whole
Busin
ess
Portfolio positioning by sector We carry the most credit exposure in financials and communications
46
Active risk by sector (Fund DTS overweight or underweight vs. benchmark)
“Fund” refers to Schroder ISF Global Corporate Bond; “Benchmark” is the Barclays Capital Global Aggregate Credit Index; ”DTS” is duration-times-spread
Positive numbers denote those sectors that the Fund is overweight on a DTS basis versus its benchmark; CDS positions are reflected above in the sector classifications
Sources: Schroders Fixed Income Analytics, Barclays Capital; all data as of 28 February 2013
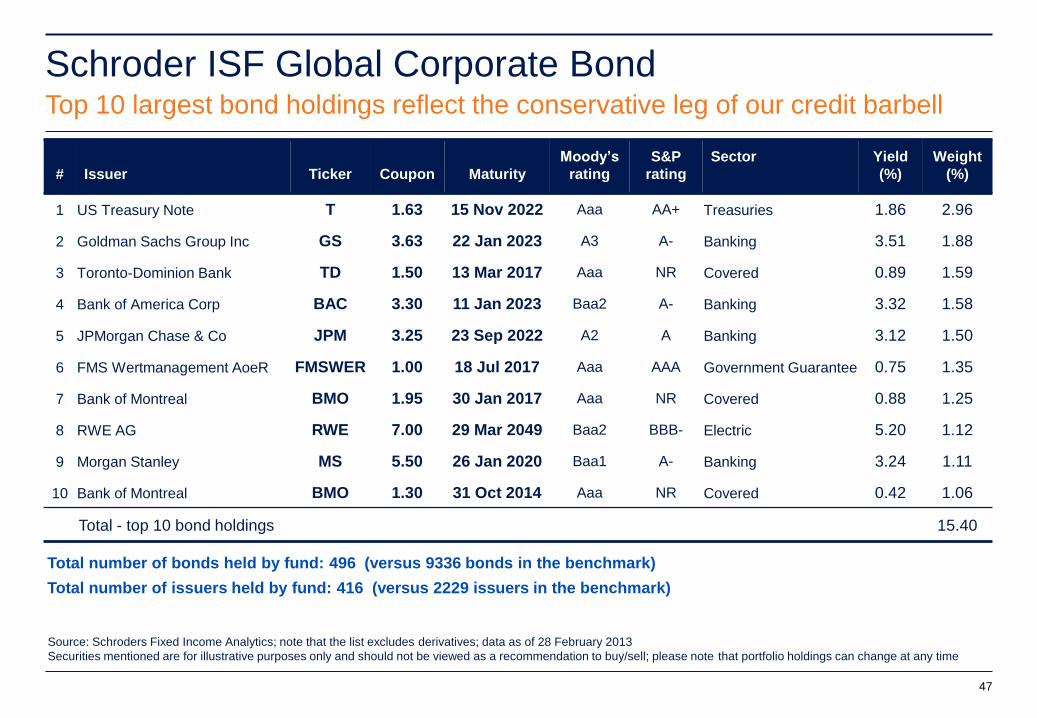
Schroder ISF Global Corporate Bond Top 10 largest bond holdings reflect the conservative leg of our credit barbell
Source: Schroders Fixed Income Analytics; note that the list excludes derivatives; data as of 28 February 2013
Securities mentioned are for illustrative purposes only and should not be viewed as a recommendation to buy/sell; please note that portfolio holdings can change at any time
Total number of bonds held by fund: 496 (versus 9336 bonds in the benchmark)
Total number of issuers held by fund: 416 (versus 2229 issuers in the benchmark)
47
#
Issuer
Ticker
Coupon
Maturity
Moody’s
rating
S&P
rating
Sector Yield
(%)
Weight
(%)
1 US Treasury Note T 1.63 15 Nov 2022 Aaa AA+ Treasuries 1.86 2.96
2 Goldman Sachs Group Inc GS 3.63 22 Jan 2023 A3 A- Banking 3.51 1.88
3 Toronto-Dominion Bank TD 1.50 13 Mar 2017 Aaa NR Covered 0.89 1.59
4 Bank of America Corp BAC 3.30 11 Jan 2023 Baa2 A- Banking 3.32 1.58
5 JPMorgan Chase & Co JPM 3.25 23 Sep 2022 A2 A Banking 3.12 1.50
6 FMS Wertmanagement AoeR FMSWER 1.00 18 Jul 2017 Aaa AAA Government Guarantee 0.75 1.35
7 Bank of Montreal BMO 1.95 30 Jan 2017 Aaa NR Covered 0.88 1.25
8 RWE AG RWE 7.00 29 Mar 2049 Baa2 BBB- Electric 5.20 1.12
9 Morgan Stanley MS 5.50 26 Jan 2020 Baa1 A- Banking 3.24 1.11
10 Bank of Montreal BMO 1.30 31 Oct 2014 Aaa NR Covered 0.42 1.06
Total - top 10 bond holdings 15.40

Note: “o/w” denotes those issuers that the portfolio is overweight versus its benchmark; “u/w” denotes the underweights; underweights exclude the CDS index options positions
Source: Schroders Fixed Income Analytics; the Fund’s benchmark is the Barclays Capital Global Aggregate Credit USD Hedged Index; data as of 28 February 2013
Securities mentioned are for illustrative purposes only and should not be viewed as a recommendation to buy/sell; please note that portfolio holdings can change at any time
Issuer overweight exposures (in DTS) Issuer underweight exposures (in DTS)
48
Schroder ISF Global Corporate Bond The Fund's largest active risk exposures by issuer reflect our conviction views
Ticker: Issuer name Portfolio Benchmark DTS
o/w
OLDMUT: Old Mutual 0.41 - 0.41
TENN: Tennet 0.33 - 0.33
GS: Goldman Sachs 0.35 0.12 0.22
RWE: RWE 0.24 0.03 0.21
EDF: Electricite de France 0.25 0.05 0.20
CMCSA: Comcast 0.26 0.06 0.20
VOTORA: Votorantim Cimentos 0.19 0.01 0.18
BAC: Bank of America 0.27 0.09 0.18
C: Citigroup 0.28 0.10 0.18
MS: Morgan Stanley 0.24 0.07 0.17
Total – top 10 DTS overweights 2.81 0.54 2.27
Ticker: Issuer name Portfolio Benchmark DTS
u/w
XTALN: Xstrata -0.05 0.02 -0.07
MEX: Mexico Government - 0.07 -0.07
TELEFO: Telefonica 0.00 0.06 -0.06
RABOBK: Rabobank 0.01 0.06 -0.06
VZ: Verizon - 0.06 -0.06
PETBRA: Petrobras - 0.05 -0.05
BACR: Barclays - 0.05 -0.05
EIB: European Investment Bank 0.03 0.08 -0.05
AXASA: AXA - 0.05 -0.05
TITIM: Telecom Italia 0.02 0.07 -0.05
Total – top 10 DTS underweights -0.00 0.57 -0.57

Sample credit picks: Tennet BV Go down in the capital structure of credits with solid fundamentals
49
Credit stats are based on Schroders analysis of company financial statements through HY 2012; Schroders Credit Analyst – Charlotte Peat, Recommendation = “2-S”
Source: Bloomberg all bond data as of 29 January 2013
– High voltage electricity grid owner and transmission system operator in the Netherlands and owns 40% of the high voltage grid in Germany
– Low risk regulated monopoly with a supportive framework
– Owned by Kingdom of the Netherlands
– More than 95% of earnings are regulated
– The security is a perpetual but it has coupon step-ups in 2017 of 5-yr swaps + 360 bps and in 2022 of 6-month EURIBOR + 460 bps
– There is an incentive to redeem at first call due to lack of equity recognition from ratings agencies after that date
Credit stats
– Operating profit HY12 €134
– 43% net debt to fixed assets
0
1
2
3
4
5
6
7
8
Feb-10 Sep-10 Apr-11 Nov-11 Jun-12 Jan-13
TENN 6.655 Perp TENN 4½ 2022
TENN 6.655 Perp (Baa3/BBB) versus TENN 4.50 2022 (A3/A-)
Going down the capital structure provides a pickup in yield versus the senior dated bond: +167 bps in yield as at January 29th
Yield (in %)
Bond issue Issue size Rating Price Yield-to-Worst Duration
TENN 6.655 Perp $500 mn Baa3/BBB $109.4 4.24% 4.13
TENN 4.50 2022 $500 mn A3/A- $116.6 2.43% 7.46
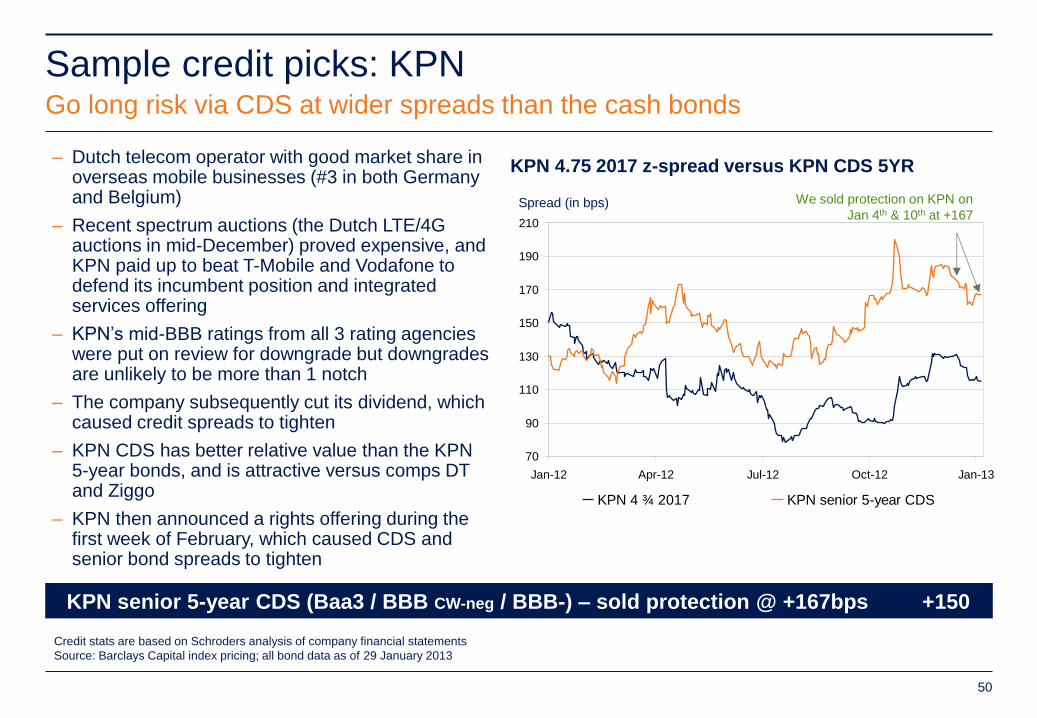
Sample credit picks: KPN Go long risk via CDS at wider spreads than the cash bonds
50
Credit stats are based on Schroders analysis of company financial statements
Source: Barclays Capital index pricing; all bond data as of 29 January 2013
– Dutch telecom operator with good market share in overseas mobile businesses (#3 in both Germany and Belgium)
– Recent spectrum auctions (the Dutch LTE/4G auctions in mid-December) proved expensive, and KPN paid up to beat T-Mobile and Vodafone to defend its incumbent position and integrated services offering
– KPN’s mid-BBB ratings from all 3 rating agencies were put on review for downgrade but downgrades are unlikely to be more than 1 notch
– The company subsequently cut its dividend, which caused credit spreads to tighten
– KPN CDS has better relative value than the KPN 5-year bonds, and is attractive versus comps DT and Ziggo
– KPN then announced a rights offering during the first week of February, which caused CDS and senior bond spreads to tighten
70
90
110
130
150
170
190
210
Jan-12 Apr-12 Jul-12 Oct-12 Jan-13
KPN 4 ¾ 2017 KPN senior 5-year CDS
KPN 4.75 2017 z-spread versus KPN CDS 5YR
We sold protection on KPN on
Jan 4th & 10th at +167 Spread (in bps)
KPN senior 5-year CDS (Baa3 / BBB CW-neg / BBB-) – sold protection @ +167bps +150

Investment opportunities along the yield curve Taking advantage of volatility and supply/demand technicals in Citigroup ( C )
“Spread” is the Option-Adjusted Spread (OAS); the “curve” represents the OAS differential of the Citi 2022 maturity bond versus the Citi 2017 maturity bond
Source: Barclays Capital; data through 15 February 2013
Citigroup bond spreads – 10yr vs. 5yr curve
51
Swap trade on Citi curve 24 May 2012 23 Aug 2012 Current
Short maturity Citi bond Bot C 4.45% ‘17@ +298/T5 Sold C 4.45% ‘17 @ +199/T5 C 4.45% ‘17 @ +93/T5
Longer mat Citi bond Sold C 4.50% ‘22 @ +258/T10 Bot C 4.50% ‘22 @ +224/T10 C 4.50% ‘22 @ +118/T10
The trade we executed We shortened from C 2022
to C 2017 @ +40 bps
We extended from C 2017
to C 2022 @ +25 bps
We currently prefer
10-year maturities
– We typically own more than one issue across the curve for
large issuers, and we shift or concentrate our exposure when
dislocations occur from market stress or technically-driven
anomalies
– As the market recovered in early 2012, most bank sector
spread curves began to normalize (steepen), and then
Citigroup starved the market of 10-year issuance and focused
supply in the 5-year part of the curve in mid-2012
– This eventually created the opportunity to pick up incremental
spread while shortening duration because of the strong
technical bid for Citi 10-yr paper vs. a saturation of 5-yr paper
– The curve normalized once again as many holders of the
10-year switched into the 5-year and as Citigroup issued more
of the 2022 bond to take advantage of the curve anomaly itself
A reversal of
65 bps in the
spread curve
generated
nearly 500 bps
of excess return
(OAS in basis points)
-60
-40
-20
0
20
40
60
Dez-1
1
Jan
-12
Fe
b-1
2
Mrz
-12
Ap
r-12
Ma
i-1
2
Jun
-12
Jul-
12
Au
g-1
2
Se
p-1
2
Okt-
12
Nov-1
2
Dez-1
2
Jan
-13
We extended from 5yr to 10yr Citi bonds
We shortened from 10yr to 5yr Citi bonds

Insurance
Industry overweight
“Fund” is Schroder ISF Global Corporate Bond; “DTS” is duration-times-spread
Sources: Schroders, and Bloomberg for Bank of America Merrill Lynch Global Corporates Indices; all data as at 31 December 2012
52
Top DTS overweights in insurance in the Fund
Ticker Ratings Schroders
Rec/Opinion*
OAS
(bps)
Fund
DTS
Active
DTS
OLDMUT Baa3/BB 2 – S +213
+511 0.24 0.24
RSALN Baa1/A 1 – S +246 0.13 0.12
DLGLN Baa1/BBB+ 1 – S +506 0.12 0.12
WLP Baa2/A- 1 – S +195 0.12 0.10
SRENVX A1/AA-
Baa1/A 2 – S
+151
+294 0.08 0.08
Investment thesis
– The insurance sector is attractive versus banking with individual stock selection reliant on inflation and interest rate views
Key industry trends & fundamental outlook
– Liabilities are stable, predictable and long term
– Lack of capital recognition from ratings agencies after the first call date means that rollover risk is low when compared to the banking sector
– A recent deflationary backdrop has meant that P&C firms have been booking positive reserve releases
Valuations
– The spread differential between insurance and the broader global corporate market is still high compared to historical levels; there is still room for convergence here
0
200
400
600
800
1000
Dec-02 Dec-04 Dec-06 Dec-08 Dec-10 Dec-12
Difference Insurance Index Global Corporate Index**
OAS (in bps)

CDS index receiver
Tactical portfolio positioning via CDS index options Buying options can produce attractive, asymmetric payoff profiles
We can pay a small premium to either offset existing credit exposure or provide active risk with an asymmetric payoff profile that
puts a floor on the downside risk
When implied volatility has fallen because of a rally in risk assets, purchasing an option is a good way to hedge a credit portfolio
against widening spreads should volatility rise again
However, in times of more certainty, purchasing (or selling) the index outright could prove a more efficient way of expressing a
view due to the small performance drag incurred by the option premium
53
CDS index payer
P&L option position P&L index position Probability
Spread
Sell protection on CDS index
Option premium
Buy protection on CDS index
Option premium
Spread

Schroder ISF
Global Corporate Bond
USD I Shares
Performance &
Performance attribution

Schroder ISF Global Corporate Bond Fund performance as at 31 December 2012
55
Schroder ISF Global Corporate Bond USD I Class Accumulation Shares
Note: performance shown is net of all management fees and fund expenses for the Fund’s USD I class of shares (ticker SCHHGIA LX)
Sources: Schroders, Barclays Capital
Past performance is no guarantee of future results. The value of an investment may go down as well as up and is not guaranteed. Please see the performance notes at the end
of this presentation for more information. Performance for periods longer than one year are annualized
2.02%
10.86%
7.05%7.64%
6.92%
1.65%
10.36%
7.39%
6.51%6.18%
0%
2%
4%
6%
8%
10%
12%
3 months 1 year 3 year p.a. 5 year p.a. 10 year p.a.
Schroder ISF Global Corporate Bond USD I Acc Shares Barclays Capital Global Aggregate Credit Index, USD Hedged
Alpha: +37 bp +50 bp –34 bp +112 bp +75 bp (I-shares)

Schroder ISF Global Corporate Bond Quarterly performance attribution summary over the past year
Schroder ISF Global Corporate Bond USD I Class Accumulation Shares
“Fund” refers to Schroder ISF Global Corporate Bond USD I Accumulation class of shares (ticker SCHHGIA LX); returns shown are net of all fund expenses
“Benchmark” is the Barclays Capital Global Aggregate Credit Index, USD Hedged; “o/w” denotes Fund overweights versus its benchmark and “u/w” denotes underweights
Sources: Schroders, Barclays Capital; data through 31 December 2012. Past performance is no guarantee of future results. The value of an investment may go down as well as
up and is not guaranteed. Please see the performance notes at the end of this presentation for more information.
56

Schroder ISF Global Corporate Bond Gross total returns and excess returns vs benchmark – 2012
57
Note: performance shown is gross of management fees and fund expenses, not based on the Funds USD I class of shares (ticker SCHHGIA LX). Performance attribution results
are calculated relative to the benchmark using gross performance based on end of day pricing. Returns are calculated internally by Schroders based on index pricing or other 3rd
party vendor pricing for securities not in the benchmark. If fees and expenses were reflected, performance figures would be lower. Performance calculations are not adjusted for
the effect of taxation and assume reinvestment of dividends and capital gains. Index returns do not incur management fees, transaction costs, or other expenses. Sources:
Schroders, Barclays Capital; data for periods during 2012.

Schroder ISF Global Corporate Bond Performance attribution by gross total returns vs benchmark – 2012
58
Headings terminology:
• “Issue Selection” is based on a given security’s idiosyncratic return after accounting for the credit sector allocation by currency, ratings, sector, and duration; Sector Allocation
and Issue Selection figures should be considered together since much of the decision to buy a security is based on the factors that contribute to its sector classification
• “Valuation Effect” represents the difference between the Schroders pricing methodology and the Barclays Capital index pricing methodology
• “Trading Impact” represents transaction costs (bid/offer) as well as pricing differential between executed prices on portfolio transactions and the end-of-day index prices
Note: performance shown is gross of management fees and fund expenses, not based on the Funds USD I class of shares (ticker SCHHGIA LX)
Sources: Schroders; data for periods during 2012. Past performance is no guarantee of future results; please refer to prior page for more information.

Schroder ISF
Global Corporate Bond
USD A Accumulation Shares
Performance &
Performance attribution
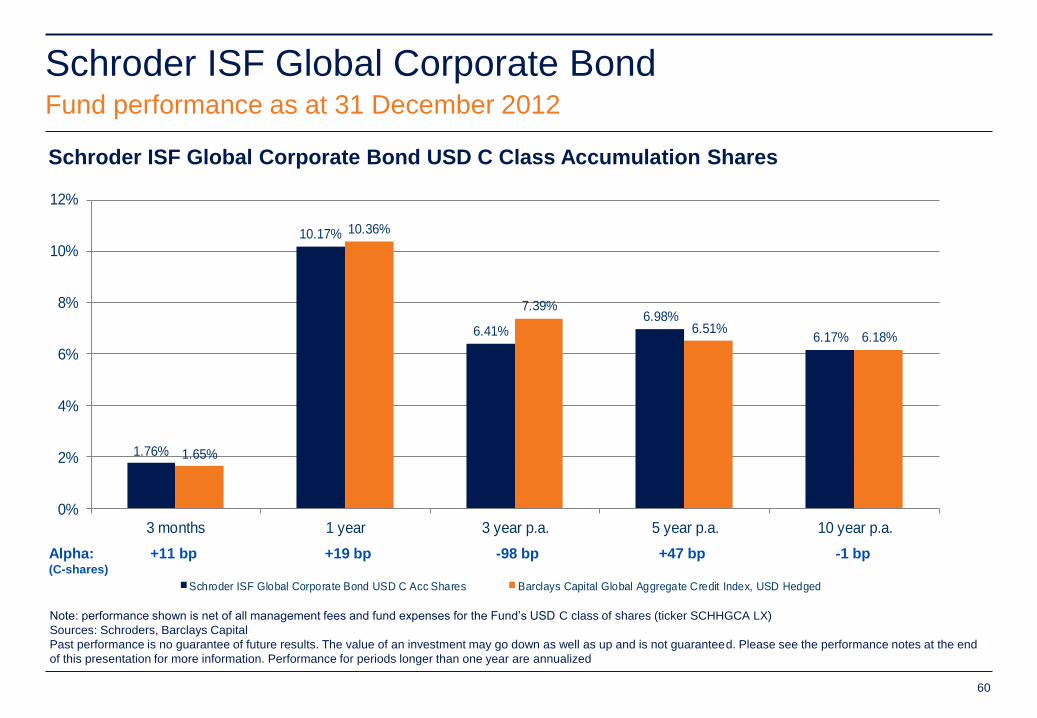
Schroder ISF Global Corporate Bond Fund performance as at 31 December 2012
60
Schroder ISF Global Corporate Bond USD C Class Accumulation Shares
Note: performance shown is net of all management fees and fund expenses for the Fund’s USD C class of shares (ticker SCHHGCA LX)
Sources: Schroders, Barclays Capital
Past performance is no guarantee of future results. The value of an investment may go down as well as up and is not guaranteed. Please see the performance notes at the end
of this presentation for more information. Performance for periods longer than one year are annualized
1.76%
10.17%
6.41%6.98%
6.17%
1.65%
10.36%
7.39%
6.51%6.18%
0%
2%
4%
6%
8%
10%
12%
3 months 1 year 3 year p.a. 5 year p.a. 10 year p.a.
Schroder ISF Global Corporate Bond USD C Acc Shares Barclays Capital Global Aggregate Credit Index, USD Hedged
Alpha: +11 bp +19 bp -98 bp +47 bp -1 bp (C-shares)

Schroder ISF Global Corporate Bond Fund performance as at 31 December 2012
61
Schroder ISF Global Corporate Bond USD A Class Accumulation Shares
Note: performance shown is net of all management fees and fund expenses for the Fund’s USD A class of shares (ticker SCHHGBA LX)
Sources: Schroders, Barclays Capital
Past performance is no guarantee of future results. The value of an investment may go down as well as up and is not guaranteed. Please see the performance notes at the end
of this presentation for more information. Performance for periods longer than one year are annualized
1.69%
9.67%
5.97%6.54%
5.67%
1.65%
10.36%
7.39%
6.51%6.18%
0%
2%
4%
6%
8%
10%
12%
3 months 1 year 3 year p.a. 5 year p.a. 10 year p.a.
Schroder ISF Global Corporate Bond USD I Acc Shares Barclays Capital Global Aggregate Credit Index, USD Hedged

Schroder ISF Global Corporate Bond Quarterly performance attribution summary over the past year
Schroder ISF Global Corporate Bond USD A Class Accumulation Shares
“Fund” refers to Schroder ISF Global Corporate Bond USD A Accumulation class of shares (ticker SCHHGBA LX); returns shown are net of all management fees & fund expenses
“Benchmark” is the Barclays Capital Global Aggregate Credit Index, USD Hedged; “o/w” denotes Fund overweights versus its benchmark and “u/w” denotes underweights
Sources: Schroders, Barclays Capital; data through 31 December 2012. Past performance is no guarantee of future results. The value of an investment may go down as well as
up and is not guaranteed. Please see the performance notes at the end of this presentation for more information.
62

0
1
2
3
4
5
6
7
8
9
10
0 2 4 6 8 10 12 14
Schroder ISF Global Corporate Bond The Fund provides attractive risk-adjusted performance after fees
Schroder ISF Global Corporate Bond USD A Class Accumulation Shares vs.
Funds in the Morningstar peer universe – 5 years through 31 December 2012
Note: performance shown is net of all management fees and fund expenses for the Fund’s USD A Accumulation class of shares (ticker SCHHGBA LX)
“Benchmark” is the Barclays Capital Global Aggregate Credit Index, USD Hedged
*Peer Group average is based on the Morningstar USD Corporate Bond universe with 24 funds with 5-year data
Sources: Schroders, Barclays Capital, Morningstar. Past performance is no guarantee of future results. The value of an investment may go down as well as up and is not
guaranteed. Please see the performance notes at the end of this presentation for more information.
Average Annual Total Return (in %)
Volatility (annualized standard deviation of monthly returns, in %)
Schroder ISF Global Corporate Bond
USD A Accum Shares 2008 – 20012
Avg. Annual
Total Return
Stnd Dev
(Ann’l)
Sharpe
Ratio
SCHHGBA 6.54 5.05 1.73
Peer Group
average* 6.14 6.70 1.27
Benchmark 6.51 4.95 n/a
Benchmark
*Peer Group average is based on the Morningstar USD
Corporate Bond universe with 24 funds with 5-year data
63

Schroders approach to
Global Credit
Team & process

Summary of recent developments
65
What’s changed in the past year?
Significant resource additions and upgrades across the global team
Enhanced integration and collaboration between the credit analysts and portfolio managers
Sarang Kulkarni, Pan-European Credit Portfolio Manager and a member of the London portfolio
management team for the past 4 years, was named Co-Fund Manager of the Fund
Performance across portfolios was solid – ahead of benchmarks
Continuing to see strong client interest & inflows in investment grade credit
What hasn’t changed?
Our overall philosophy and process remains consistent
Our team-based approach to portfolio management, capitalizing on regional sector specialists
Our focus on fundamental research
Schroder Global Credit team and process
Source: Schroders; as of 31 January 2013

Resources: Specialist Fixed Income Portfolio Management Teams
Multi Sector US European Credit Australia Asia (EM+DM) Latin America Quant Research / Systematic Macro
9 portfolio
managers and
analysts
14 portfolio
managers and
analysts*
7 portfolio
managers*
6 portfolio
managers and
analysts
10 portfolio
managers and
analysts
9 portfolio
managers and
analysts
5 portfolio
managers and
analysts
European Credit Research Americas Credit Research Asia & Australia Credit Research
Patrick McCullagh Jack Davis Richard Brown
7 credit analysts 14 credit analysts 9 credit analysts
Global Credit Portfolio Managers
Sarang Kulkarni, Co-Lead Mgr (15 years) Wes Sparks, Lead Manager (24 years) Chris Tackney, EM Corporates (17 years)
Lucette Yvernault, European IG (13 years) Gregg Moore, US IG (16 years) Ryan Mostafa, US IG (10 years)
66
Schroder Global Credit portfolio management team A core group of 6 portfolio managers, supplemented by the full credit team
Source: Schroders; as of 31 January 2013

C. Ames (NY)
E. Fitzpatrick (NY)
D. Harris (NY)
L. Hornby (NY)
T. Hui (NY)
M. Metcalf (NY)
G. Moore (NY)
R. Mostafa (NY)
L.Patterson (NY)
W. Sparks (NY)
Fund Management
Assistants Risk Management
R. Brown (SIN)
T. Cha (NY)
R. Chia (SIN)
C. Croteau (NY)
J. Davis (NY)
R. Doig (LN)
E. Friedland (NY&PHL)
H. Fullam (NY)
P. Fullerton (SYD)
A. Harnetty (LN)
B. Hill (NY)
E. Kelly (PHL)
S. Kiran (LN)
S. Kong (SIN)
N. Krol (LN)
A. Low (SYD)
V. Maniar (LN)
H. Mason (SYD)
P. McCullagh (LN)
T. Nagato (TYO)
P.F. Ng (HKG)
S. Park (NY)
C. Peat (LN)
A. Quadri (NY)
E. Richter* (NY)
L. Tiphanie (BA)
H. Thomas (NY)
J. Widener (NY)
M. Wong (SIN)
M. Yee (NY)
P. Yudhana (JAK)
N. Adatia (NY)
W. Clayton-Howe (LN)
A. Finlayson (SYD)
T. Hoffer (NY)
B. Khoo (SIN)
A. Lee (HKG)
M. Smith (LN)
C. Su (SIN)
P. Vespa (LN)
R. Warr (LN)
B. Wu (NY)
H.L. Yu (HKG)
A. Arthur (NY)
H. Choon (SIN)
T Stephane (BA)
J. Stewart (LN)
H. Webb (LN)
A. Burt (LN)
G. Canavan (LN)
K. Chow (SYD)
S. Dow (NY)
D. Enlund (SIN)
M. George (LN)
A. Gendron-Judd (LN)
J. Harris (LN)
N.G. Kim (SEL)
B. Lee (TPE)
S. Mead (LN)
T. Miyata (TYO)
I. Morita (TYO)
R. Omensetter (PHL)
E. Reilly (LN)
S. Scott (NY)
M. Shankar (NY)
W. Sweeney (PHL)
C. Tams (LN)
M. Tolcher (LN)
A. Wang (TPE)
D. Welch (NY)
V. Yong (SIN)
L. Binns (LN)
D. Bristow (LN)
M. Lynch (LN)
A. Patel (LN)
Schroder Global Credit team and resources
67
Karl Dasher
Head of Fixed Income
B. Bahra (LN)
A. Blair (LN)
F. Bourgoin (LN)
S. Dear (SYD)
S. Doyle (SYD)
S. Gray (SYD)
M. Kase (SYD)
S. Stevenson (SYD)
K. Wood (SYD)
S. Beck (PHL)
D. Darling (PHL)
R. Haynes (PHL)
D. Scholl (PHL)
P. Albina (BA)
J. Barrineau (NY)
M. De Callis (SP)
M. Fiorito (BA)
F. Grisales (NY)
A. Moseley (NY)
J. Seixas (SP)
C. Tackney (NY)
Research & Systematic
Macro
US Taxable Fixed Income
Australian Fixed Income
Asian Fixed Income Europe & UK Credit US Tax-Exempt Fixed Income
EMD Relative & Latin American Fixed Income
Philippe Lespinard
Fixed Income CIO
C.Y. Ang (SIN)
D. Carrell (SIN)
L. Chua (SIN)
R. de Mello (SIN)
S. Hartawan (JAK)
J. Ho (SIN)
A. Hui (HKG)
T. Kanemaru (TYO)
N.K.Kim (SEL)
B. Lee (TPE)
P. van der Schaft (HKG)
A. Wang (TPE)
Other Resources available to the investment team. This also includes an Equity Research team of over 90 analysts globally
Source: Schroders as at January 2013; Names in bold are team leaders, and names in orange are the portfolio managers for Schroder ISF Global Corporate Bond; note that professionals in offices
other than London are indicated by city codes after their names;
S. Bense (LN)
N. Biggs (LN)
A. Coy (LN)
S. Doyle (LN)
A. Hassan (LN)
C. Jankowski (PHL)
C. Kirby (LN)
J. Lauder (LN)
C. Matthew (LN)
A. Moscow** (LN)
R. Patel (LN)
G. Povey (LN)
A. Pryce-Robertson (LN)
A. Rawlinson (LN)
D. Sharrad (LN)
S. Stewart (NY)
F. Walfridsson (LN)
Economics
Fixed Income Dealers
J. Bilson (LN)
T. Fong (LN)
K. Wade (LN)
A. Zangana (LN)
J. Baulch (NY)
G. J. Choi (SEL)
D. Fenwick (LN)
M. Field (LN)
W. Lee (SIN)
P. Meakin (LN)
K. Ow (SIN)
N. Robinson (LN)
T. Ukim (JAK)
Product Management
Fixed Income IT & Operations Credit Research
S.Kulkarni (LN)
K. Leidman(LN)
D Manek (LN)
M. Scott (LN)
A. Stewart (LN)
R. Shah (LN)
P. Vogel (LN)
L. Yvernault (LN)
F.I. Derivative Operations
Global, UK & Euro
Multi Sector
B. Choda (LN)
J. Fairest (LN)
E. Halley (LN)
G. Isaac (LN)
B. Jolly (LN)
B. Popovici (LN)
T. Sartain (LN)
D. Scammell (LN)
J. Tisserand (LN)

Jim Barrineau – Co-Head of Emerging Markets Relative Return Strategies as EM sovereigns specialist
Fernando Grisales – Senior Portfolio Manager, Emerging Markets
Alec Moseley – Senior Portfolio Manager & Emerging Markets Sovereign Research Analyst
Chris Tackney – Emerging Markets corporate bond trading specialist with more than 15 years of experience
Alix Stewart – Lead Portfolio Manager, UK Credit
Konstantin Leidmann – Lead Portfolio Manager, Pan-European High Yield
Patrick Vogel – Head of European Credit and Lead Portfolio Manager, European Credit
We have added to our roster of senior investment professionals with recent hires
Note: Professionals listed above have joined the Schroders Global Fixed Income team within the past year as of 31 December 2012
We have deepened our skill base in key areas
Schroder Global Fixed Income – team evolution
68

Schroder Global Fixed Income Global integration of resources facilitates sharing of ideas
Meeting description Timing Participants Issues discussed and focus of meeting
Quarterly Investment Forum Quarterly – PMs
– Quantitative Analysts
– Economists
– Long-term economic direction
– Debates on market outlook and special topics
– Development of strategy roadmap; signposts to monitor
Macro Economic Monthly – PMs
– Quantitative Analysts
– Economists
– Near term economic direction
– Quantitative model review
Global Fixed Income Weekly – PMs
– Credit Analysts
– Economists
– Global fixed income views, macro themes and strategy
Fixed Income Strategy
(US / Pan-European / Asian)
Weekly:
Tuesdays
– PMs
– Economists
– Regional bond market investment themes & outlook
– Asset allocation across broad fixed income sectors,
duration bias and curve preferences
Credit Strategy:
Top-Down
Weekly:
Wednesdays
– PMs
– Credit Analysts
– Quantitative Analysts
– Credit strategy themes, macro market outlook and
regional credit market technical factors, and also
quantitative tool input
Credit Strategy:
Bottom-Up
Weekly – PMs
– Credit Analysts
– Credit analysts’ top ideas and changes to credit views or
industry views
– Navigator tool discussion of sector & industry views
Trading Update (US) Daily – All US investment
professionals
– Latest market-moving news and implications for valuations and
equity & fixed income portfolio positioning
Frequent meetings foster discussion and promote accountability
69

Schroder Global Credit investment process Our focus on six alpha drivers can lead to strong performance
1) Sector and industry selection – by overweighting or underweighting specific
market segments out of the of 18 sectors and 50 industries that comprise the index
2) Quality tilt – by overweighting or underweighting BBBs versus higher-rated credit,
as well as allocations to high yield credit
3) Issue selection – by picking specific issuers, and relative value decisions across
such alternatives as bonds vs CDS, secured vs unsecured, senior vs subordinated,
covenant protection vs covenant-light bonds, bonds with or without change of
control put provisions, fixed-rate vs floating rate notes, and callable vs non-callable
bonds
4) Geographic region – by country exposure and currency selection (hedged)
5) Duration and curve positioning
6) Liquidity management and net credit risk exposure – by use of cash holdings,
active government bond duration management, and net CDS exposure
70

Schroder Global Credit investment process
Three different levels of strategy analysis shape overall portfolio construction
Macro Strategy
– Global investment themes
– Quantitative valuation tools
– Country risk analysis
– Duration and yield curve management
Sector Strategy
– PM & Analyst 1-3 Sector View
– IG and HY Navigator tool
– Credit sector Z-scores
– Portfolio manager input on technicals
Single Name Strategy
– Analyst Opinion
(fundamental credit direction)
– Analyst 1-4 Issuer Recommendation
– Movers & Shakers report
– Valuation screens by PMs
Expected returns
Geographic bias
Quality tilt
Duration & curve
Portfolio hedges
Issue selection
Schroder ISF
Global
Corporate Bond
portfolio
Bottom-up
input
Top-down
input
Sector allocation
Industry selection
71

Risk budgeting and risk management drives overall portfolio construction
Schroder Global Credit investment process
Q3: How do we monitor overall portfolio risk?
Q2: What risks need to be managed?
Q1: What risks do we want
to take? (Risks where we are
well compensated)
Beta
VaR
ICLs
Tracking Error
Currency
Regions
Sectors
Curve
Structure
Tactical hedges
Industry Views
Investment Themes
Analyst Issuer Recommendations
72

Macro strategy – use of both qualitative and quantitative tools Various tools contribute to our outlook on the macroeconomic backdrop
Economics
Valuation
Models
Technicals
Fundamental sector scorecards Quantitative credit scorecard
Equity market
Non-farm payrolls
Industrial production
Retail sales
Personal income
– Disciplined monthly framework for discussion and validation of investment themes –
– Common process across regions and markets enables useful comparison –
73

0%
25%
50%
75%
100%
Dec '07 Jun '08 Dec '08 Jun '09 Dec '09 Jun '10 Dec '10 Jun '11 Dec '11 Jun '12
Source: Schroders internal quantitative risk aversion indicator, the Schroders Panic Index; data through 31 December 2012
Quant tools can guide when to use tactical hedges as market shifts to “risk off”
Schroders Panic Index Panic scale
Latest data (31 Dec 2012):
Panic scale 0%
Our own indicator of risk aversion includes >30 financial market data series worldwide
74
Macro strategy – use of quantitative indicators

Issuer selection
Three facets of our approach guide the credit selection process
75
* Note: The portfolio’s benchmark is Barclays Capital Global Aggregate Credit Index, USD hedged Source: Schroders
View Angle Scale Description
Opinion Credit quality direction Improving
Moderately Improving
Stable
Moderately Declining
Declining
– Fundamental view on the expected direction of credit
based on a 6 to 12 month outlook
– Not a measure of absolute quality
– Trajectory of the issuer is the key focus to determine the
fundamental credit opinion, not just a snapshot analysis
of credit metrics at one point in time
Recommendation
within each analyst’s
Issuer Universe
Credit view versus market
expectations 1 “buy”
2 “overweight”
3 “underweight”
4 “sell”
– Measure of relative strength of Schroders’ view versus
the market consensus – in both magnitude and direction
– Rating based on potential undervaluation compared to
market expectations
– Cannot go long issuers ranked “4 – D”
– Cannot be short issuers ranked “1”
Issuer
Concentration
Limits
Maximum issuer
weightings determined by
current ratings and
potential volatility
Maximum overweight vs benchmark* – Issuer Concentration Limits (ICL %) are based on
current credit ratings and potential downside price
volatility
– For any credit owned that experiences substantial
downside price volatility, we assemble Special Credit
Situation (“SCS”) swat teams to objectively analyze such
an issuer’s prognosis
– Risk management step applies to total portfolio; in
addition to Issuer Concentration Limits to force
diversification, we actively manage overall portfolio
Tracking Error Volatility (TEV)
A – AAA, stable credits
B
C
D
E – Low-rated, volatile
credits
5.00%
3.00%
1.80%
1.20%
0.60%
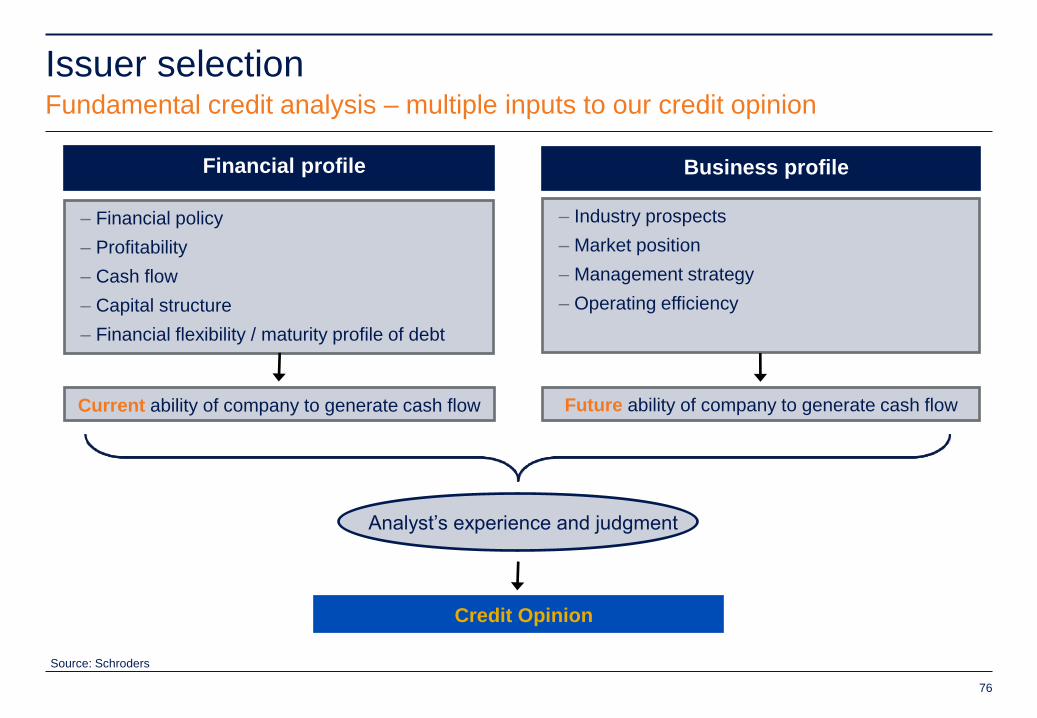
Issuer selection
Fundamental credit analysis – multiple inputs to our credit opinion
Source: Schroders
– Financial policy
– Profitability
– Cash flow
– Capital structure
– Financial flexibility / maturity profile of debt
Financial profile
– Industry prospects
– Market position
– Management strategy
– Operating efficiency
Business profile
Current ability of company to generate cash flow
Credit Opinion
Future ability of company to generate cash flow
Analyst’s experience and judgment
76

Sector strategy
Collaborative process with both fundamental & quantitative inputs
77
*Horizon used to evaluate Industry Views (or Sector Views) is over the next 3-month period, and these views are comprehensively reviewed on a bi-monthly basis during
the weekly Credit Strategy Meetings; Industry Views are jointly determined by credit analysts and portfolio managers
Source: Schroders
Industry View*
macroeconomic and fundamental credit trends
1 = Sectors expected to outperform Index
2 = Sectors expected to perform in-line with Index
3 = Sectors expected to underperform Index
Analyst Portfolio Manager
• Fundamental sector opinion
(Positive, Stable or Negative)
• Analysis of sector valuations
valuation metrics such as yields, spreads (OAS, STW),
spreads per unit of leverage, spreads per unit of duration
• Relative value of issuers in sector
• Sector performance
• Sector and industry trends
• Sector performance and beta
• Relative value across sectors
• Inputs from quantitative analysis
• Index composition and characteristics
• Technical market conditions
discussion

Portfolio construction Our credit matrix combines Issuer Recommendation and Industry Views
Source: Schroders
a These issuer/industry combinations can be good candidates to be used as a short leg on a CDS paired trade
b These issuer/industry combinations must be re-evaluated quickly at major market turning points
1 outperform
2 in-line
3 underperform
1 buy
strong buy buy hold b
2 overweight
buy hold avoid / reduce b
3 underweight
hold b avoid / reduce a sell a
4 sell
avoid a sell a strong sell a
Industry View
Issu
er
Reco
mm
en
dati
on
Issuer Recommendation
1 = strongest (buy) 2 (overweight) 3 (underweight) 4 = weakest (sell) 4D = toxic (cannot own)
Industry View
1 = strongest (outperform index) 2 = neutral (expect in-line performance) 3 = weakest (underperform index)
Legend of color codes
= overweight bias
= underweight bias / avoid
= sell / buy protection in CDS
78

Portfolio construction Sample credit matrix – Tom Cha – North American investment grade TMT
Data as of 31 January 2013; at that time, Tom Cha had 60 issuers under his Investment Grade Primary Coverage Universe, 16 of which were 1s, 17 were 2s, 19 were 3s, and
8 were 4s (for a distribution of 27%, 28%, 32%, and 13%, respectively, versus the idealized distribution of 20%, 30%, 30%, and 20%)
Securities mentioned are not necessarily holdings in any portfolio, and the views and opinions expressed in this presentation may change
79

EuropeINDEX FUND INDEX FUND INDEX FUND INDEX FUND DIFF INDEX FUND DIFF INDEX FUND DIFF
CHEMICALS 105 - 3.77 - 28 - 0.52 0.00 (0.52) 0.02 0.00 (0.02) 0.02 0.00 (0.02)
METALS_AND_MINING 396 351 4.86 6.64 81 53 0.29 0.56 0.27 0.01 0.04 0.02 0.06 0.11 0.06
PAPER 110 - 3.18 - 35 - 0.01 0.00 (0.01) 0.00 0.00 (0.00) 0.00 0.00 (0.00)
AEROSPACE/DEFENSE 295 - 5.13 - 58 - 0.09 0.00 (0.09) 0.00 0.00 (0.00) 0.01 0.00 (0.01)
BUILDING_MATERIALS 154 331 4.78 3.90 32 85 0.38 0.45 0.07 0.02 0.02 (0.00) 0.03 0.06 0.03
CONSTRUCTION_MACHINERY 118 458 4.42 2.28 27 201 0.11 0.07 (0.04) 0.01 0.00 (0.00) 0.00 0.01 0.00
DIVERSIFIED_MANUFACTURING 120 - 5.51 - 22 - 0.49 0.00 (0.49) 0.03 0.00 (0.03) 0.03 0.00 (0.03)
ENVIRONMENTAL - 868 - 2.01 - 433 0.00 0.07 0.07 0.00 0.00 0.00 0.00 0.01 0.01
PACKAGING - 356 - 0.48 - 738 0.00 0.14 0.14 0.00 0.00 0.00 0.00 0.00 0.00
TECHNOLOGY 189 - 5.07 - 37 - 0.05 0.00 (0.05) 0.00 0.00 (0.00) 0.00 0.00 (0.00)
MEDIA_CABLE 177 340 0.98 1.17 180 291 0.01 0.26 0.25 0.00 0.00 0.00 0.00 0.01 0.01
MEDIA_NONCABLE 140 285 4.19 7.55 33 38 0.31 0.26 (0.05) 0.01 0.02 0.01 0.01 0.06 0.04
WIRELINES 221 280 5.75 6.79 38 41 1.96 1.07 (0.89) 0.11 0.07 (0.04) 0.25 0.18 (0.07)
WIRELESS - 748 - 4.52 - 166 0.00 0.21 0.21 0.00 0.01 0.01 0.00 0.07 0.07
AUTOMOTIVE 121 0 3.18 1.89 38 0 1.14 -0.05 (1.19) 0.04 0.00 (0.04) 0.03 0.00 (0.03)
CONSUMER_CYCLICAL_SERVICES 171 284 3.40 1.76 50 161 0.07 0.14 0.07 0.00 0.00 0.00 0.00 0.01 0.00
ENTERTAINMENT 310 - 6.41 - 48 - 0.01 0.00 (0.01) 0.00 0.00 (0.00) 0.00 0.00 (0.00)
GAMING - 1915 - 2.24 - 856 0.00 0.06 0.06 0.00 0.00 0.00 0.00 0.02 0.02
HOME_CONSTRUCTION - - - - - - - - - - - - - - -
LODGING 153 - 2.99 - 51 - 0.01 0.00 (0.01) 0.00 0.00 (0.00) 0.00 0.00 (0.00)
RESTAURANTS - - - - - - - - - - - - - - -
RETAILERS 108 - 2.94 - 37 - 0.03 0.00 (0.03) 0.00 0.00 (0.00) 0.00 0.00 (0.00)
TEXTILE - - - - - - - - - - - - - - -
OAS OASD OAS / OASD MV % CTOASD CTDTS
United KingdomINDEX FUND INDEX FUND INDEX FUND INDEX FUND DIFF INDEX FUND DIFF INDEX FUND DIFF
CHEMICALS - - - - - - - - - - - - - - -
METALS_AND_MINING 158 138 5.81 8.02 27 17 0.18 0.30 0.12 0.01 0.02 0.01 0.02 0.03 0.02
PAPER 204 - 5.33 - 38 - 0.01 0.00 (0.01) 0.00 0.00 (0.00) 0.00 0.00 (0.00)
AEROSPACE/DEFENSE 170 - 6.03 - 28 - 0.07 0.00 (0.07) 0.00 0.00 (0.00) 0.01 0.00 (0.01)
BUILDING_MATERIALS 152 - 8.89 - 17 - 0.01 0.00 (0.01) 0.00 0.00 (0.00) 0.00 0.00 (0.00)
CONSTRUCTION_MACHINERY - - - - - - - - - - - - - - -
DIVERSIFIED_MANUFACTURING 186 - 6.16 - 30 - 0.01 0.00 (0.01) 0.00 0.00 (0.00) 0.00 0.00 (0.00)
ENVIRONMENTAL - - - - - - - - - - - - - - -
PACKAGING - - - - - - - - - - - - - - -
TECHNOLOGY - - - - - - - - - - - - - - -
MEDIA_CABLE 286 380 4.45 6.16 64 62 0.05 0.44 0.39 0.00 0.03 0.02 0.01 0.10 0.09
MEDIA_NONCABLE 165 192 4.97 6.70 33 29 0.15 0.93 0.78 0.01 0.06 0.06 0.01 0.11 0.10
WIRELINES 157 0 6.53 2.12 24 0 0.16 -0.04 (0.20) 0.01 0.00 (0.01) 0.02 0.00 (0.02)
WIRELESS 103 241 5.41 4.73 19 51 0.37 0.12 (0.25) 0.02 0.01 (0.01) 0.02 0.01 (0.01)
AUTOMOTIVE 174 - 2.76 - 63 - 0.03 0.00 (0.03) 0.00 0.00 (0.00) 0.00 0.00 (0.00)
CONSUMER_CYCLICAL_SERVICES 129 200 5.30 6.21 24 32 0.12 0.07 (0.05) 0.01 0.00 (0.00) 0.01 0.01 0.00
ENTERTAINMENT - - - - - - - - - - - - - - -
GAMING - - - - - - - - - - - - - - -
HOME_CONSTRUCTION - - - - - - - - - - - - - - -
LODGING 140 196 1.80 3.57 78 55 0.02 0.31 0.29 0.00 0.01 0.01 0.00 0.02 0.02
RESTAURANTS - - - - - - - - - - - - - - -
RETAILERS 244 225 5.49 6.43 45 35 0.04 0.32 0.28 0.00 0.02 0.02 0.01 0.04 0.04
TEXTILE - - - - - - - - - - - - - - -
CONSUMER_PRODUCTS - - - - - - - - - - - - - - -
FOOD_AND_BEVERAGE 97 171 4.83 5.64 20 30 0.22 0.17 (0.04) 0.01 0.01 (0.00) 0.01 0.02 0.00
OAS OASD OAS / OASD MV % CTOASD CTDTS
Portfolio construction
Industry views are comprehensively reviewed with the aid of our Navigator Tool
This is an excerpt from Navigator Tool report from the Credit Meeting on 16 November 2012; the Global Credit Navigator shows portfolio positioning vs. index by industry and
sector by region.
Sources: Schroders, Barclays Capital; data as of 16 November 2012
Sectors are shown for illustrative purposes only and should not be viewed as a recommendation to buy/sell
North AmericaINDEX FUND INDEX FUND INDEX FUND INDEX FUND DIFF INDEX FUND DIFF INDEX FUND DIFF
CHEMICALS 129 178 6.38 8.66 20 20 0.67 0.62 (0.05) 0.04 0.05 0.01 0.07 0.10 0.03
METALS_AND_MINING 224 232 7.63 8.03 29 29 0.63 0.92 0.29 0.05 0.07 0.03 0.12 0.20 0.08
PAPER 195 199 7.26 5.91 27 34 0.17 0.30 0.13 0.01 0.02 0.01 0.03 0.03 0.01
AEROSPACE/DEFENSE 112 117 7.41 7.69 15 15 0.34 0.15 (0.19) 0.03 0.01 (0.01) 0.03 0.01 (0.02)
BUILDING_MATERIALS 267 721 6.83 5.14 39 140 0.06 0.01 (0.05) 0.00 0.00 (0.00) 0.01 0.00 (0.01)
CONSTRUCTION_MACHINERY 68 191 5.79 4.38 12 44 0.44 0.38 (0.06) 0.03 0.02 (0.01) 0.02 0.05 0.03
DIVERSIFIED_MANUFACTURING 103 117 7.90 16.59 13 7 0.77 0.31 (0.45) 0.06 0.05 (0.01) 0.07 0.07 0.00
ENVIRONMENTAL 160 148 8.07 7.41 20 20 0.14 0.14 0.00 0.01 0.01 (0.00) 0.02 0.01 (0.01)
PACKAGING 189 583 8.04 1.39 24 420 0.02 0.16 0.14 0.00 0.00 0.00 0.00 0.01 0.01
TECHNOLOGY 135 135 6.26 7.99 22 17 1.67 3.56 1.89 0.10 0.28 0.18 0.16 0.33 0.17
MEDIA_CABLE 168 217 8.24 7.23 20 30 0.99 1.44 0.45 0.08 0.10 0.02 0.17 0.26 0.10
MEDIA_NONCABLE 160 240 8.29 12.12 19 20 0.63 1.55 0.91 0.05 0.19 0.13 0.10 0.42 0.32
WIRELINES 154 190 8.14 13.67 19 14 1.48 0.15 (1.32) 0.12 0.02 (0.10) 0.22 0.04 (0.18)
WIRELESS 138 170 6.98 6.69 20 25 0.62 1.55 0.94 0.04 0.10 0.06 0.07 0.14 0.08
AUTOMOTIVE 189 305 4.43 4.72 43 65 0.51 0.74 0.23 0.02 0.03 0.01 0.05 0.11 0.06
CONSUMER_CYCLICAL_SERVICES 163 578 6.70 5.74 24 101 0.11 0.38 0.26 0.01 0.02 0.01 0.01 0.12 0.11
ENTERTAINMENT 144 180 8.17 15.39 18 12 0.45 0.09 (0.35) 0.04 0.01 (0.02) 0.06 0.03 (0.04)
GAMING 324 860 4.30 5.18 75 166 0.01 0.04 0.03 0.00 0.00 0.00 0.00 0.02 0.02
HOME_CONSTRUCTION 211 - 8.11 - 26 - 0.01 0.00 (0.01) 0.00 0.00 (0.00) 0.00 0.00 (0.00)
LODGING 178 265 4.69 8.15 38 33 0.05 0.14 0.09 0.00 0.01 0.01 0.00 0.03 0.03
RESTAURANTS 106 181 8.43 11.85 13 15 0.17 0.05 (0.12) 0.01 0.01 (0.01) 0.02 0.01 (0.01)
RETAILERS 117 131 8.73 8.62 13 15 1.31 1.86 0.56 0.11 0.16 0.05 0.16 0.23 0.07
TEXTILE 130 - 10.61 - 12 - 0.01 0.00 (0.01) 0.00 0.00 (0.00) 0.00 0.00 (0.00)
CONSUMER_PRODUCTS 89 - 6.91 - 13 - 0.45 0.00 (0.45) 0.03 0.00 (0.03) 0.03 0.00 (0.03)
FOOD_AND_BEVERAGE 110 129 6.84 7.57 16 17 1.47 1.65 0.18 0.10 0.13 0.02 0.14 0.18 0.04
HEALTHCARE 121 225 6.27 7.72 19 29 0.82 0.87 0.05 0.05 0.07 0.02 0.07 0.16 0.09
CTDTSOAS / OASDOAS OASD MV % CTOASD
80

Portfolio construction
Fixed Income Analytics provides custom reports for insights into portfolio risks
81
Source: Schroders

Equity & debt analysts share common research platform An integrated approach to company analysis
Source: Schroders as at November 2012
Company Name
Schroders Equity
Analyst’s view
Schroders Credit
Analyst’s view
82

Schroder Global Credit investment process
We actively manage the Fund – our buy & sell discipline
Buys
– Evaluate investment ideas with credit analysts
– “Opportunities now”
– “Opportunities waiting to happen”
– “Cheap for a reason” (leads to our decision to pass on investing in an issuer)
– Identify positive catalysts that may shift market sentiment
Sells
– To trim credit exposure when bonds are appreciating through “fair value”
– To capitalize on relative value trading opportunities
(swap for a yield pick-up, or dollar take-out, for comparable credit risk, etc.)
– To manage either credit-specific or overall portfolio risk*
*Note: Schroders assembles Special Credit Situations (“SCS”) swat teams to determine prognosis on credits with bad news developments
83

Schroder Global Credit investment process
A few final comments about portfolio management
How size of new position is determined
– Analyst Credit Opinion and Issuer Recommendation are primary drivers of positioning
– Several other key factors influence the sizing of a position – such as liquidity, availability/source-ability
in secondary trading, available cash, conviction in total return opportunity in the trade
– Issuer Concentration Limit caps the maximum percentage allowed to be owned
How portfolio is reviewed on an on-going basis
– On a daily basis by the US and European portfolio management & trading desks
– On a weekly basis in two weekly credit strategy meetings and in two other portfolio management
meetings (different meetings cover different topics)
Role of analysts
– Each analyst covers approximately 50-70 credits in each analyst’s “Primary Coverage Universe”
– Analysts’ annual bonuses are partially determined by the outperformance of credits rated 1 & 2 versus
their credits rated 3 & 4 (underweight or sell)
– Analysts have “skin in the game” – they feel an ownership stake in portfolio performance
84

Risk management & compliance Risk control is as much about philosophy as it is about the specific systems used
Fixed income Analytics*
Position monitoring
Allocation by:
– Market value percent
– Duration – rate & spread
– Yield curve
– Country exposure
– Currency
– Sector
– Rating
– OAS & ASW
– Credit beta
– DTS
Portfolio liquidity monitoring
Charles River
Execution and compliance
– Online pre-trade compliance
– Trade execution system
– On-going portfolio compliance
– Derivative team sheet
application
Barclays Capital POINT
Risk analysis
Detailed tracking error analysis:
post trade
Tracking error contribution:
– Credit & EMG spreads
– Default risk
– Idiosyncratic risk
– Swap spread
– Yield curve
– Volatility
– FX
– Other
*Proprietary to Schroders
Fixed Income Risk Committee
85

Risk management – utilizing a multi-factor model
Portfolio and Index Tool (POINT) provides flexibility to monitor many risk metrics
Barclays Capital’s Global Risk Model*
– allows portfolio managers to quantify expected performance (tracking error volatility) between a portfolio and
benchmark
– allows managers to find optimal transactions to reflect specific views
– includes well-tested modeling techniques that are widely viewed as the industry standard
Applications of the risk model and the POINT system
– structuring efficient active portfolios in fixed income
– evaluating proposed trades and how they would impact aggregate portfolio risk exposures
– defining plausible market scenarios for stress testing
– risk budgeting, what-if analysis, total return projections based on historical price volatilities & correlations across
securities
*Note that prior to November 2008, this Global Risk Model was branded under the Lehman Brothers name
Access to the model is provided through the Barclays Capital Portfolio and Index Tool (POINT)
Source: The Lehman Brothers Global Risk Model: A Portfolio Manager’s Guide, April 2005
86

Risk management – utilizing the Barclays POINT system
Portfolio risk report summary
Source: Barclays Capital POINT
Risk factors and their contribution
to Tracking Error Volatility
Idiosyncratic risk
attributable to specific
issuers – based on both
overweights and
underweights vs
benchmark
87

Risk management
Monitoring Issuer Concentration Limits on Schroders FIA
Source: Schroders Fixed Income Analytics (FIA)
Monitoring exposure to individual issuers to avoid outsized idiosyncratic risk
This report identifies the Fund’s
exposures to individual issuers
and flags any tickers that are in
breach of the Issuer
Concentration Limits
Issuer Concentration Limit (ICL%)
(an internal risk system)
Maximum issuer weightings are
determined by current ratings of
Moody’s and S&P, as well as by the
potential for downside price volatility
88

Risk management
Special Credit Situations (SCS) – Handling bad news on a company
Special Credit Situations defined
– whenever there is material adverse news on an issuer we own in portfolios
– and/or when an individual bond sells off materially relative to the general market
SCS swat team (task force)
– An ad hoc team is assembled & a thorough review of the credit situation is conducted
– SCS swat team involves the original credit analyst and the original portfolio manager involved in buying the
bond, as well as the regional Head of Credit Research and at least one other portfolio manager and one other
analyst with relevant expertise to the industry and credit being scrutinized
– The motivation is to remove any inclination of analysts to “dig in their heels” and continue recommending a
credit that is materially underperforming, and to avoid “doubling down” on losing bets that don’t have prospects
of recovering
– After the facts are reviewed, various viewpoints are solicited amongst the SCS team members and a decision is
made as to whether to cut the position in half, sell it all, or hold it
– A determination is made of what additional information may need to be gathered, and the credit analyst covering
the issuer is required to provide high frequency communication to the team on continuing news developments
Our SCS approach to troubled credits fosters an early exit before a potential default
89

Why Schroders for Global Credit?
90
Fundamental approach research-driven, bottom-up approach to portfolio construction with top-down strategy input
Global platform,
local presence
– strength of presence in both Europe and Asian credit markets
– optimal size in the “sweet spot” of institutional corporate credit investing
Active fund management
orientation
– benchmark aware, but not a quasi- index fund
– credit specialists with concentrated focus
– medium sized positions creates advantages (we’re nimble)
Big toolbox
use of CDS to tail risk and generate alpha from credit selection
– single-name CDS (both long risk and short risk)
– CDS indices (iTraxx in Europe; CDX in the US) and options on indices
Focus on risk
management strong risk management – use of issuer concentration limits, special credit situations task
force teams, and active management of the portfolio’s tracking error volatility
You choose your currency we don’t mix currency speculation with our management of corporate bond portfolios
– all non-USD bond positions are hedged to USD in the portfolio
– you choose your currency share class: USD, SGD hedged, AUD, GBP, or EUR hedged shares

Appendix
DTS: A preferred measure of credit risk
Biographies of key professionals

DTS: A preferred measure of credit risk Duration Times Spread (DTS) is a useful metric to compare credit beta
Spread volatility of credit securities is proportional to spread level across a wide range of spreads
A long-dated bond with a wide spread would be more volatile than a short-dated bond with a tight spread
Example: Long-dated Bank of America Corp versus short-dated JP Morgan Chase Bank NA
– BAC 5.875% Jul 2042 has a DTS of 2449 (spread duration 14.40 x spread 170)
– JPM 6.00% Jan 2017 has a DTS of 460 (spread duration 4.11 x spread 112)
During a period of credit market weakness, the bonds with the higher DTS can be expected to sell off more than the bond with the
lower DTS but would outperform during a period of strength
Excess return volatility is proportional to DTS
For every 100 bps of increase in DTS there is a 9 bps pickup in excess return volatility, based on historical evidence
Exposures to both credit sectors and individual issuers should be measured in terms of contributions to DTS rather than to duration
alone
The DTS concept is applicable to corporate bonds, emerging markets bonds, European sovereign bonds, and CDS
Sizing of positions in a credit portfolio may be based on DTS
A 1% market value exposure to an 8-year duration bond at a spread of +100 bps will tend to exhibit similar price volatility as a 0.5%
exposure to a 4-year duration bond with a spread of +400 bps
Source: Barclays Capital (formerly Lehman Brothers) Quantitative Portfolio Strategies publications on DTS from 2005 to 13 April 2011; data for example as of 28 February 2013
92

Schroder Global Credit Biographies of the portfolio managers
93
Ryan Mostafa, CFA US Credit Portfolio Manager
2005 Schroders
2004 Blackrock, Portfolio Analytics Analyst and Risk
Management Analyst
2002 JP Morgan Chase, Credit Derivatives Analyst and
P&L Analyst
BSc, Duke University
General Course Degree Economics, London School of
Economics
10 years of investment experience
7 years with Schroders
Gregg Moore, CFA US Credit Portfolio Manager
2001 Schroders
1999 Aeltus Investment Management, Inc., Quantitative
Research Analyst
1998 CIGNA Investment & Management, Quantitative
Research Analyst
1996 CIGNA Investment & Management, Financial
Analyst
BA, University of Connecticut
16 years of investment experience
11 years with Schroders
Wesley A. Sparks, CFA Head of US Fixed Income Lead Fund Manager, Schroder ISF Global Corporate Bond 2000 Schroders 1999 Aeltus Investment Management, Inc., Vice
President and Portfolio Manager 1996 Trust Company of the West, Vice President and
Portfolio Manager 1994 Fischer Francis Trees & Watts, Assistant Portfolio
Manager 1989 Goldman Sachs Asset Management, Associate 1988 Goldman, Sachs & Co., Financial Analyst The Wharton School, University of Pennsylvania, MBA Northwestern University, BA 24 years of investment experience 12 years with Schroders
Sarang Kulkarni, CFA Co-Lead Fund Manager, Schroder ISF Global Corporate Bond
2008 Schroders
2002 Aerion Fund Management, Senior Portfolio Manager
2000 Anderson Corporate Finance, Investment Banker,
specialising in structured debt financing for utilities and
infrastructure projects
IIM Calcutta, Post Graduate Diploma in Management
University of Bombay, BE
15 years of investment experience
4 years with Schroders

Schroder Global Credit Biographies of the portfolio managers
94
Lucette Yvernault Global Credit Portfolio Manager
2005 Schroders
2003 CAM Global Credit, Vice President
2001 Citigroup, Fund Manager, currencies and
investment grade credit
2000 CMG First State Investment Hong Kong,
Associate Fund Manager
EPF Sceaux, Mastaire of Engineering in Management and Financial Analysis
13 years of investment experience
7 years with Schroders
Christopher Tackney, CFA Senior Portfolio Manager, Emerging Markets Fixed Income
2012 Schroders
2010 Credit Suisse, Director, Trader – Asia Credit
2005 Black-River Asset Management, MD of Emerging
Market Corporate Credit
1995 TIAA-CREF, Director of Emerging Market Debt
Portfolio Manager
New York University, MBA
Bucknell University, BA
17 years of investment experience
<1 year with Schroders

Important information
95
Schroder ISF Global Corporate Bond: Investments in debt securities are primarily subject to interest rate, credit and default risks and, potentially, to currency exchange rate risk. This fund may use financial derivative instruments as a part of the investment process. This may increase the fund’s price volatility by amplifying market events. This presentation does not constitute an offer to anyone, or a solicitation by anyone, to subscribe for shares of Schroder International Selection Fund (the “Company”). Nothing in this presentation should be construed as advice and is therefore not a recommendation to buy or sell shares. Subscriptions for shares of the Company can only be made on the basis of its latest prospectus together with the latest audited annual report (and subsequent unaudited semi-annual report, if published), copies of which can be obtained, free of charge, from Schroder Investment Management (Luxembourg) S.A. An investment in the Company entails risks, which are fully described in the prospectus. Past performance is not a reliable indicator of future results, prices of shares and the income from them may fall as well as rise and investors may not get the amount originally invested. The forecasts included in this presentation should not be relied upon, are not guaranteed and are provided only as at the date of issue. Our forecasts are based on our own assumptions which may change. We accept no responsibility for any errors of fact or opinion and assume no obligation to provide you with any changes to our assumptions or forecasts. Forecasts and assumptions may be affected by external economic or other factors. Schroders has expressed its own views and opinions in this presentation and these may change. Source for rating: Morningstar as at July 2012 This presentation is issued in January 2013 by Schroder Investment Management Limited, 31, Gresham Street, EC2V 7QA, who is authorised and regulated by the Financial Services Authority. For your security, all telephone calls are recorded. UK03427