Schools’ use of data in teaching and learningResearch Report No 671 Schools’ Use of Data in...
210
Schools’ Use of Data in Teaching and Learning Catherine Kirkup, Juliet Sizmur, Linda Sturman and Kate Lewis National Foundation for Educational Research Research Report RR671 R ESEARCH
Transcript of Schools’ use of data in teaching and learningResearch Report No 671 Schools’ Use of Data in...

Schools’ Use of Data inTeaching and Learning
Catherine Kirkup, Juliet Sizmur, Linda Sturman and Kate LewisNational Foundation for Educational Research
Research Report RR671
RESEARCH

Research Report No 671
Schools’ Use of Data in Teaching and Learning
Catherine Kirkup, Juliet Sizmur, Linda Sturman and Kate Lewis National Foundation for Educational Research
The views expressed in this report are the authors’ and do not necessarily reflect those of the Department for Education and Skills. © NFER Trading Ltd 2005 ISBN 1 84478 551 3
Table of Contents
1 Executive Summary....................................................................................... 1
1.1 Introduction ..................................................................................................... 1
1.2 Key findings .................................................................................................... 1
1.3 Aims................................................................................................................ 2
1.4 Methodology.................................................................................................... 3
1.5 Other research findings .................................................................................... 3
1.6 Recommendations............................................................................................ 6
2 Introduction................................................................................................... 7
2.1 Objectives........................................................................................................ 8
2.2 Methodology.................................................................................................... 9
2.3 Sample composition....................................................................................... 12
3 Primary school findings .............................................................................. 17
3.1 Key findings .................................................................................................. 18
3.2 Data sources and systems............................................................................... 21
3.3 Impact on teaching and learning: the purposes for which data are being used at
school level ................................................................................................... 35

3.4 Impact on teaching and learning: the purposes for which data are being used at
class or pupil level......................................................................................... 42
3.5 Dissemination and sharing of data.................................................................. 50
3.6 Challenges to the use of data.......................................................................... 56
3.7 Accountability or self evaluation.................................................................... 61
3.8 Summary of findings and recommendations................................................... 69
4 Special school findings................................................................................ 70
4.1 Key findings .................................................................................................. 71
4.2 Data sources and systems............................................................................... 73
4.3 Impact on teaching and learning: the purposes for which data are being used at
school level ................................................................................................... 81
4.4 Impact on teaching and learning: the purposes for which data is being used at
class or pupil level......................................................................................... 86
4.5 Dissemination and sharing of data.................................................................. 88
4.6 Challenges to the use of data.......................................................................... 90
4.7 Accountability or self evaluation.................................................................... 92
4.8 Summary of findings and recommendations................................................... 97
5 Secondary school findings ........................................................................... 98
5.1 Key findings .................................................................................................. 99
5.2 Data sources and systems............................................................................. 103
5.3 Impact on teaching and learning: the purposes for which data are being used at
school or department level........................................................................... 119

5.4 Impact on teaching and learning: the purposes for which data are being used at
class or pupil level....................................................................................... 128
5.5 Dissemination and sharing of data................................................................ 133
5.6 Challenges to the use of data........................................................................ 139
5.7 Accountability or self evaluation.................................................................. 144
5.8 Summary of findings and recommendations................................................. 155
6 Summary of findings and recommendations............................................ 157


0
Appendix 1: Copies of Questionnaires
Appendix 2: Schedule for Focus Group Meetings
Appendix 3: Glossary
Appendix 4: Project Team

Executive summary
1
1 Executive Summary
1.1 Introduction
The National Foundation for Educational Research (NFER) was commissioned by the Department for Education and Skills (DfES) to conduct a study of primary, secondary and special maintained schools in England to assess the use of data in teaching and learning.
1.2 Key findings
• In all types of schools, it was found that data was perceived to promote teaching
and learning by facilitating:
– more effective allocation of staff and resources
– performance management
– monitoring the effectiveness of initiatives and strategies
– evidence-based discussions with the Office for Standards in Education (OFSTED), local education authorities (LEAs), governors, etc
– challenging expectations of staff, pupils, parents, among others
– transitions and transfers – particularly transitions between key stages within schools
– identification of pupils’ achievements and setting of targets.
• ‘Good practice’ emerged from the use to which the data was put rather than specific systems or tools. A recurrent theme was that data only becomes effective if it stimulates questions about the actual learning that is taking place and how it can be developed further.
• Schools reported that effective use of data resulted from meaningful dialogue between staff, and was supported by user-friendly systems. Useful discussions of data amongst staff tended to occur in schools where one person took a proactive role in using data to move learning forward, either by focussing on specific areas or supporting colleagues in the interpretation of outcomes.
• Rather than closed data analysis packages, school-devised systems and Excel spreadsheets were the most popular data management tools because they tracked
2
individual pupils and allowed schools the flexibility to input internally generated data such as interim assessments and targets; i.e. such tools were easier to customise to the school and its particular needs and circumstances.
• The greatest challenge to the effective use of data for primary and secondary schools was finding time to update and analyse the data.
• The key challenges for special schools were finding systems that enabled them to monitor pupil progress in sufficient detail, and obtaining reliable comparable data by which they could evaluate their school performance. To this end, some special schools wanted a system of moderation for the P scales.
• Focus groups reported that inadequacies of training or support could result in staff experiencing lack of ownership of their data systems and viewing data as a threat.
• Users of the Pupil Achievement Tracker software (PAT) provided by the DfES generally made positive comments about the visual presentation of data and the ability to compare groups of pupils. However, many questionnaire respondents and focus group participants found PAT very difficult to use and were confused as to how to input data. Back-up information provided with the package and the training offered by LEAs were both considered to be poor. There were also complaints of incompatibility with other school systems.
1.3 Aims
The aims of the study were:
• to identify how data is used to promote learning in primary, middle, secondary and special maintained schools in England;
• to identify good practice in the effective use of data to promote learning;
• to investigate possible challenges to using data of this nature;
• to provide recommendations to support school staff in making effective use of data to promote learning, including the future development of the Pupil Achievement Tracker (PAT).
The ethos or assumption underlying the provision of data to schools is that such information leads to improvements in performance. This study gathered evidence as to the impact of the use of data in schools and the perceptions of users as to how successful this has been in raising attainment.

Executive summary
3
1.4 Methodology
The research was carried out during the period January – June 2005. Quantitative and qualitative data were collected by means of questionnaires and focus groups.
• Four separate questionnaires were developed: one questionnaire was sent to the headteachers of 300 primary schools and 120 special schools and a set of three questionnaires were sent to 400 secondary schools and addressed heads of departments in English, mathematics and science respectively. On-line versions of the questionnaires were available for respondents to complete if they preferred.
• Six focus groups were held: three for primary headteachers together with special school representatives and three for secondary school heads of departments. Participants were recruited from amongst the questionnaire respondents.
The school samples were drawn from the NFER database of schools in England and were stratified according to school performance in national curriculum tests, school type and geographical region. For special schools, teacher assessment results were used in place of national curriculum test results.
Of the 1820 questionnaires despatched, a total of 529 responses were received from 187 primary schools, 50 special schools and 292 secondary school heads of departments (an overall response rate of 29 per cent). The achieved samples were checked against the relevant school populations and the primary sample and the secondary sample were found to be representative of schools in England as a whole.
1.5 Other research findings
Uses for data in teaching and learning
The findings suggest that the impact of data on teaching and learning operates at two levels: directly by means of interventions targeted at individual pupils; and indirectly by means of whole-school approaches.
Commonly reported uses for data in all schools were:
• to track pupil progress
• to set targets
• to identify underachieving pupils for further support

4
• to inform teaching and learning and strategic planning.
A key use of data in secondary schools was to inform the setting and grouping of pupils.
In special schools, important uses of data included monitoring the effectiveness of staff and initiatives, and providing reports to parents.
At the classroom or pupil level, effective use of data enabled schools to:
• highlight specific weaknesses for individual pupils
• identify weaknesses in topics for the class as a whole
• inform accurate curricular targets for individual pupils
• provide evidence to support decisions as to where to focus resources and teaching.
Specific uses of data to promote learning in the classroom were identified, i.e. the most common types of interventions employed by schools, where data analysis had highlighted issues to be addressed.
• The most frequently reported interventions, across all schools, were providing additional support (booster groups, one-to-one support, etc) and making changes to the teaching programme or curriculum, e.g. more personalised or differentiated teaching and learning.
• Primary schools employed a large number of literary or numeracy strategies, such as Additional Literacy Support (ALS), Reading Recovery and Springboard.
• Special schools identified whole school approaches, such as behaviour management programmes, and used data to informing training needs.
• Secondary schools commonly reviewed pupil settings or teacher groups. Other strategies employed by secondary schools were to involve parents through home-school partnerships and to encourage mentoring and peer mentoring of pupils.
Challenges to the use of data
The main challenges to the effective use of data for primary schools were reported to be:
• lack of time, particularly time to update and analyse the data
• difficulties in applying data to classroom situations

Executive summary
5
• limitations of data, i.e. that the data collected/recorded was too narrow/academic or did not accommodate individual needs
• ICT-related issues, e.g. insufficient resources or restricted access.
Challenges to the effective use of data for secondary schools were similar to those experienced by primary schools. However, having sufficient trust in the data was also of concern to secondary schools (some respondents believed either that it was unreliable or arrived too late to be of use).
Special schools reported two key challenges to the effective use of data:
• data systems that do not accommodate the complex needs of individual pupils
• insufficient comparable data (year-on-year or with similar schools).
Data management systems
In order to make more effective use of data schools need systems that are simple to use, are well supported and therefore quickly build levels of confidence and familiarity. All schools wanted data management systems that:
• are easy to use
• produce outcomes that are easy to interpret
• allow flexibility of input
• have compatible school management and assessment components
• offer comprehensive training and support
• are accessible to staff
• encourage engagement and ownership.
For pupils with special educational needs it was considered particularly important to record achievements at a much finer level of detail than was possible with many commercial data management packages, in order to demonstrate and celebrate progress.

6
1.6 Recommendations
The report makes a number of recommendations for schools, LEAs and policy makers.
General recommendations
• Raise awareness of data systems and their potential capabilities and availability.
• Encourage the use of linkable or compatible systems – to prevent difficulties with the input or transfer of data.
• Promote training and support in the use of data - not only software training but also how to use the outcomes from data analysis and how to share such outcomes with colleagues.
• Review demands on schools (Workforce Reform) to ensure staff have sufficient time to analyse data at a meaningful level.
• Encourage the sharing of good practice, e.g. through networks/ clusters of schools/ workshops.
• Encourage the appointment of dedicated co-ordinators to drive the process of interpretation and action (not just the input of data).
• Provide a means of comparing the performance of very low attaining pupils with special educational needs (e.g. moderation of the P scales).
Recommendations for the Pupil Achievement Tracker
• Improve the compatibility of PAT with other schools’ systems.
• Improve tracking capabilities
– year-on-year
– progress in smaller steps.
• Make PAT easier to use, particularly the input of data.
• Clarify instructions and provide an ‘At a Glance’ Guide.
• Offer more information, training and support.
.

Introduction
7
2 Introduction
The National Foundation for Educational Research (NFER) was commissioned by the Department for Education and Skills (DfES) to conduct a study of primary, secondary and special maintained schools in England to assess the use of data in teaching and learning.
Schools in England have access to an increasingly wide range of educational statistics,
including school performance and value-added measures, background variables of pupils
and schools, inspection reports, benchmarking data and detailed information relating to
performance in the statutory national curriculum tests. In addition to data published by
DfES, the Office for Standards in Education (OFSTED) and the Qualifications and
Curriculum Authority (QCA) schools may use alternative sources of data or analysis,
such as the Fischer Family Trust analyses, Local Education Authority (LEA) systems, or
alternatively, commercial packages such as those from Curriculum, Evaluation and
Management Centre, University of Durham (CEM): (Middle Years Information System
(MidYIS) or Performance Indicators in Primary Schools (PIPS) etc) or NFER
Performance Analysis Service for Schools (PASS).
There has been recent evidence of the government’s determination to make the use of data one of the central planks of its ‘New Relationship with Schools’ (see Miliband, 20041). National data is to be used in three ways:
• to generate new ‘contextualised value added’ performance measures for accountability
• to produce a new ‘school profile’ for local information
• to provide confidential and detailed feedback to schools on their performance to assist in self-evaluation and hence school improvement.
There is thus a rapidly changing and dynamic environment in England for the discussion of educational data and how it is used effectively in schools.
1 Miliband, D. (2004). Personalised Learning: Building a New Relationship with Schools. Speech by David Miliband, Minister of State for School Standards. North of England Education Conference, Belfast, 8 January 2004. London: DfES.

Introduction
8
The availability, quality, and fitness for purpose of public education statistics is one issue,
but the other side of the coin is the extent to which the published statistics are understood,
appreciated, and used. An important issue here is the level of ‘statistical literacy’ which
can be expected, by which we mean the extent to which individuals can interpret
statistical information and extract meaning and understanding from it, while critically
evaluating its validity and applicability.
There is another large issue in the current context in England. This is the underlying ethos
of the use of information. Largely as the result of the work of Black and Wiliam, as
represented in articles such as Inside the Black Box (1998a2), assessment for learning has
been acknowledged as an important means of raising standards in the classroom and
ensuring that teaching and learning goals are being met. Thus the assumption underlying
the provision of data to schools is that such information leads to improvements in
performance.
2.1 Objectives
The objectives of the study were:
• To identify how data is used to promote learning in primary, middle, secondary and special maintained schools in England
• To identify good practice in the effective use of data to promote learning
• To investigate possible challenges to using data of this nature
• To provide recommendations to support school staff in making effective use of data to promote learning, including the future development of the Pupil Achievement Tracker (PAT).
In relation to these objectives, a more detailed series of research questions was to be addressed.
• Which sources of data are used to promote learning, to what extent and why?
2 Black, P. and Wiliam, D. (1998a) Inside the black Box: raising standards through classroom assessment. London: School of Education, King’s College.

Introduction
9
• Which tools are used to analyse data to promote learning, to what extent and why?
• How are data and tools used to promote learning? How are the data and tools used in primary, middle, secondary and special schools?
• How are the data and tools used at class level, departmental/subject level and at whole school level?
• How are the data and tools used at different key stages and in transitions from primary to secondary school?
• How do different members of staff use these data and tools?
• How do staff assess the impact of data use on pupil learning outcomes?
2.2 Methodology
2.2.1 Overview
The information collection for the project comprised two interlinked strands. The first was a series of questionnaire studies designed to gain quantitative and qualitative information from schools. There were four separate questionnaires, aimed at different groups. The first questionnaire was designed for completion by the headteachers of primary schools and special schools. The remaining three questionnaires were targeted at secondary schools and addressed heads of departments in English, mathematics and science. On-line versions of the questionnaires were available for respondents to complete if they preferred. Copies of the primary/ special and the secondary3 questionnaires are shown in Appendix 1.
The second strand of information gathering was a series of focus groups: three for primary headteachers together with special school representatives and three for secondary school heads of department. The purpose of these meetings was to gain deeper insights into the issues surrounding data use and analysis tools, both from users and prospective users. Participants were recruited by asking questionnaire respondents if they would be willing to participate in the Focus Groups and provide further information about the use of data in their schools. A copy of the schedule of questions for the focus groups is shown in Appendix 2.
3 The secondary questionnaire illustrated in the appendix is that addressed to heads of English departments. Those sent to the heads of mathematics and science departments were identical except for the change of subject.

Introduction
10
2.2.2 Questionnaire Survey
The questionnaires were drafted by the research team and piloted with a group of three primary, three special and three secondary schools. Further amendments were made based on the results of this pilot and the advice from the DfES steering group. Following the finalisation of the paper version of the questionnaires, electronic versions for the on-line survey were developed.
A total of 1,820 questionnaires were sent out, with the following distribution:
Primary Schools 500 schools Target return: 300 schools
Special Schools 120 schools Target return: 70 schools
Secondary (English) 400 schools Target return: 150 schools
Secondary (Mathematics) 400 schools Target return: 150 schools
Secondary (Science) 400 schools Target return: 150 schools
A total of 1020 schools were drawn in the sample as the same secondary schools were used for all three subject questionnaires.
The expected response rates were based on previous experience of similar surveys in schools. Local education authorities were contacted to inform them of schools in their area that had been drawn in the sample (see section 2.3) and to give them the opportunity to request that schools be withdrawn where participation was deemed inappropriate. The questionnaires with an accompanying letter were then despatched to schools in the sample, addressed to head teachers. For primary and special schools the instructions advised that the questionnaire should be completed by the person in the school most appropriate to comment on the use of data and data management tools to promote learning. Where responsibilities were shared, respondents were asked to consult with colleagues on relevant questions. In the case of the secondary schools headteachers were asked to arrange for their heads of department in English, mathematics and science to complete the questionnaires. Individual return envelopes were enclosed with each questionnaire for return purposes. Within the letter that accompanied the questionnaire, potential respondents were offered the possibility of on-line completion. This gave the address of the website hosting the survey, as well as instructions on access to the correct questionnaire.
Schools were initially given four weeks prior to the end of the spring term 2005 to complete their questionnaire(s). In order to maximise the response rates, all non-

Introduction
11
responding schools were sent a written reminder during the third week, followed by a telephone call to the school during the fourth week of the questionnaire administration period. At the beginning of the summer term, the outstanding non-responding schools (approximately 700) were sent a further reminder letter with a replacement questionnaire. Finally, a telephone call was made to each school to ascertain if schools were intending to return their questionnaire(s) and to encourage them to do so quickly if they wished their responses to be included in the analysis.
The questionnaires contained both open and closed questions. The closed questions dealt with factual matters and quantifiable attitudes and responses. The open ended questions allowed more discursive explanations or expressions of opinion. These open responses were coded for analysis according to a coding frame developed by the research team in consultation with the DfES and modified on the basis of the first 100 returned questionnaires.
The analysis of the questionnaire data was undertaken by NFER’s Statistics Research and Analysis Group (SRAG). They conducted separate analyses for each of five respondent groups; primary headteachers, special school headteachers and secondary heads of department for English, mathematics and science. Paper and on-line responses were combined in these analyses.
Because of the nature and timing of the project, an initial analysis was carried out based on the questionnaires received by the end of the spring term. This provided preliminary indications of the findings for a presentation to the DfES. However, its main purpose was to inform the preparation for the focus groups, by identifying the issues which needed discussion and giving a broad indication of the proportions of schools adopting different strategies in their use of data.
The final analysis was undertaken at the beginning of May once all the schools, who wished to respond, had had an ample opportunity to do so.
2.2.3 Focus Groups
In addition to the more quantitative approach of the questionnaire survey, a series of focus groups were held to provide qualitative information about the issues under consideration and to provide a deeper and broader insight into those topics. The agendas for these groups arose in part from the responses to the questionnaires, as disclosed by the initial analysis.
Six focus groups in total were conducted. Three of these covered primary and special school issues and three meetings were convened for secondary schools. For each of these

Introduction
12
two groups, the original intention was to hold one meeting in the North of England (York), one in the Midlands (Birmingham) and one in London. A secondary focus group was held in each of these areas. However, due to the geographical spread of those primary and special school representatives who were willing and able to take part, two focus groups were held in London and one in Birmingham.
Within the questionnaire respondents were asked to indicate their willingness to participate in a subsequent focus group. The aim was to achieve eight members in each group. From the initial questionnaires completed during the spring term (paper and on-line) 93 respondents agreed to be invited to participate a focus group. Of these, 83 teachers/ headteachers were invited to participate, 36 agreed to do so and 31 actually attended as agreed. The lower than expected turnout was likely to have been because, due to school holidays and the announcement of the General Election, the invitations could only be sent out the week preceding the first scheduled focus group. The number of participants at each focus group varied between three and seven, with each focus group lasting for approximately three hours.
The focus group meetings were conducted by an experienced facilitator supported by another member of the research team. With the agreement of the participants, the focus groups were recorded and later transcribed in full.
It should be noted that the participants were volunteers and as such had declared, at the very least, a degree of interest in the subject under discussion. As such, their remarks, were not intended to be, and should not be taken as representative of the school population as a whole.
2.3 Sample composition
The school samples to which the 1820 questionnaires were sent were drawn from the NFER database of schools in England. The samples were stratified according to school performance in national curriculum tests, school type and geographical region. For special schools, teacher assessment results were used in place of national curriculum test results.
A total of 455 completed paper questionnaires were returned and 74 questionnaire responses were received on-line. A further nine questionnaires were returned too late to be included in the analysis. A breakdown of the questionnaires received against the original targets is shown in Table 2.3.1.

Introduction
13
Table 2.3.1 Breakdown of the achieved sample
Target Paper On-line Total received
Primary Schools 300 148 39 187
Special Schools 70 44 6 50
Secondary (English) 150 78 6 84
Secondary (Mathematics) 150 91 12 103
Secondary (Science) 150 94 11 105
820 455 74 529
The 292 respondents from secondary schools were from a total of 183 schools; 30 schools submitted responses from all three subject areas.
In most cases, non-responding schools gave no reason for their decision not to participate in the survey. Where a reason was offered by schools, the overwhelming majority reported that this was due to the pressure of work on headteachers and staff leaving no time for such activities.
Although the achieved samples were smaller than had been anticipated, the primary and secondary samples were deemed to be sufficient in size to carry out the exploratory analyses that had been proposed in the analysis specification (e.g. using factor analysis and multiple regressions). At the same time, it was acknowledged that, although patterns and trends might emerge, with smaller sample sizes it would be less likely that significant results would be detected.
The representativeness of the samples at school level is shown in Tables 2.3.2 to 2.3.4.

Introduction
14
Table 2.3.2: Representation of the achieved primary school sample
Sample Population School type Number Per cent Per cent
Infant/First 36 19.3 17.5
Primary/Combined 130 69.5 72.2 Junior 19 10.2 9.6
Middle 1 0.5 0.7 Missing 1 0.5 -
Type of LEA London boroughs 18 9.6 10.4
Metropolitan authorities 49 26.2 20.8 English unitary authorities 37 19.8 15.6
Counties 83 44.4 53.2 Region
North 60 32.1 30.2 Midlands 59 31.6 32.9
South 68 36.4 36.9 Achievement Band (KS2 overall performance 2003)
Lowest 20% 35 18.7 17.6
Next lowest 20% 34 18.2 18.3 Middle 20% 28 15.0 18.2
Next from top 20% 40 21.4 20.2 Top 20% 43 23.0 20.7
Missing 7 3.7 5.0 Total schools 100 100

Introduction
15
Table 2.3.3: Representation of the achieved secondary school sample
Sample Population English Maths Science N=Number N % N % N % Per cent
School type Middle 4 4.8 6 5.8 6 5.7 7.6
Comprehensive to 16 34 40.5 36 35.0 39 37.1 37.2 Comprehensive to 18 34 40.5 50 48.5 46 43.8 45.3
Other secondary schools 6 7.1 4 3.9 6 5.7 5.1 Grammar 6 7.1 7 6.8 8 7.6 4.8
Type of LEA London boroughs 5 6.0 8 7.8 9 8.6 12.1
Metropolitan authorities 14 16.7 19 18.4 19 18.1 21.5 English unitary authorities 11 13.1 17 16.5 17 16.2 15.9
Counties 54 64.3 59 57.3 60 57.1 50.5 Region
North 24 28.6 38 36.9 31 29.5 29.0 Midlands 26 31.0 29 28.2 28 26.7 34.5
South 34 40.5 36 35.0 46 43.8 36.5 Achievement Band (KS3 overall performance 2003)
Lowest 20% 18 21.4 18 17.5 23 21.9 20.1
Next lowest 20% 15 17.9 19 18.4 17 16.2 18.7 Middle 20% 19 22.6 25 24.3 24 22.9 17.7
Next from top 20% 13 15.5 18 17.5 17 16.2 17.1 Top 20% 14 16.7 18 17.5 17 16.2 17.6
Missing 5 6.0 5 4.9 7 6.7 8.9 Total schools 100 100 100 100
The achieved samples were checked against the relevant school populations. None of the differences between the primary sample and the national population or between the secondary sample and the national population were statistically significant. Hence, the achieved samples are representative of schools in England as a whole. There was a statistically significant difference in the special school sample in respect of the teacher assessment (TA) measure, derived from the 2003 National Pupil Database (NPD). As the total number of schools in the special school sample was low, there are very small

Introduction
16
numbers of schools in some of the categories of the TA measure. This means that the chi-squared result is very sensitive to very small changes. For example, if one school who had responded happened to fall into a different TA measure category the result would not have been statistically significant. Or, if the boundaries of the TA measure categories had been defined differently, then this may also have given a non-significant result. As a result it was decided not to weight the sample.
Table 2.3.4: Representation of the achieved special school sample
Sample Population Number Per cent Per cent
Region
North 10 20.0 31.5 Midlands 18 36.0 30.0
South 22 44.0 38.5 TA bands for special schools (2003)
Lowest 25% 21 42.0 30.0
Next lowest 25% 18 36.0 23.4 Next from top 25% 7 14.0 27.1
Top 25% 4 8.0 12.6 Missing - 75 7.0
Total schools 50 100 100

Primary schools
17
3 Primary school findings
The following section reports the findings of the study in relation to the use of data in primary schools, including quantitative data and comments from the questionnaire survey and a summary of the focus group discussions. As the number of respondents involved is relatively small, wherever possible the actual numbers of teachers/headteachers are reported. Where percentages are quoted, the basis on which these percentages have been calculated is given (e.g. percentage of all cases).
A total of 187 questionnaires were received from primary schools, of which 39 (21 per cent) were completed on-line. The questionnaire stipulated that it should be completed by the person most appropriate to comment on the use of data and data management tools to promote learning. Table 3.1 shows the profile of respondents as indicated by their responses to the first question which asked them to indicate their current professional role(s).
Table 3.1 Questionnaire respondents’ roles within the school (percentage of respondents)
Role (n = 187) Per cent of respondents
Head teacher 72.2
Assessment co-ordinator 23.0
Deputy or Assistant headteacher 16.6
Other (e.g. teacher, subject co-ordinator, SENCO4) 7.5
Head of year or key stage 3.7
No response 3.2
More than one answer could be given so percentages do not sum to 100.
4 special educational needs co-ordinator

Primary schools
18
3.1 Key findings
The key findings in respect of primary schools are summarised in relation to the four aims of the research.
3.1.1 How is data used to promote learning in primary schools in England?
Responses from both questionnaire respondents and focus group participants suggested that the impact of data on teaching and learning operates at two levels: directly by means of interventions targeted at individual pupils; and indirectly by means of whole-school approaches. The most commonly reported uses for data in primary schools at school-level (in order of frequency) were:
• to track pupil progress
• to inform teaching and learning and planning
• to identify underachieving pupils for further support
• to set targets
• to compare progress between groups/ subjects/ individuals/ schools.
Data was perceived to promote teaching and learning by facilitating:
• more effective allocation of staff and resources
• performance management
• monitoring of the effectiveness of initiatives and strategies
• evidence-based discussions with various bodies, including OFSTED, local education authorities (LEAs) and governors
• challenging of expectations of staff, pupils, parents, etc
• transitions and transfers – particularly transitions between key stages within the school
• identification of pupils’ achievements and setting of targets.

Primary schools
19
At the classroom level, effective use of data enabled schools to:
• highlight specific weaknesses for individual pupils
• identify weaknesses in topics for the class as a whole
• inform accurate curricular targets for individual pupils
• provide evidence to support decisions as to where to focus resources and teaching.
Specific uses of data to promote learning in the classroom were identified by asking questionnaire respondents to describe the most common types of interventions or strategies employed in their school, where data analysis had highlighted issues to be addressed. These could be categorised as bottom-up or pupil-centred approaches, of which the most frequently reported were:
• booster groups or one-to-one support for individuals or groups
• literacy strategies, e.g. Additional Literacy Support (ALS) or Reading Recovery
• support provided by teaching/classroom assistant
• changes to the teaching programme or curriculum, e.g. more personalised or differentiated teaching and learning
• numeracy strategies, e.g. Springboard.
3.1.2 Good practice in the effective use of data to promote learning
The survey looked at the sources of data and the tools and systems used to analyse that data within schools. (These are reported in more detail in Section 3.2.) However, what was perceived as ‘good practice’ emerged from the use to which the data was put rather than specific systems or tools. A recurrent comment was that data only becomes effective if it stimulates questions, discussion and action, i.e. if it serves to pose questions about the actual learning that is taking place and how it can be developed further. Primary schools reported that good practice in the use of data was supported or facilitated by:
• meaningful dialogue
• data management systems that:
– are easy to use

Primary schools
20
– produce outcomes that are easy to interpret
– allow flexibility of input
– have compatible school management and assessment components
– offer comprehensive training and support
– are accessible to staff
– encourage engagement and ownership.
Meaningful discussions of data amongst staff tended to occur in schools where one person took a proactive role in using data to move learning forward, either by focussing on specific areas or supporting colleagues in the interpretation of outcomes.
School-devised data management systems and Excel spreadsheets were the most popular tools because they tracked individual pupils and allowed schools the flexibility to input internally generated data such as interim assessments and targets; i.e. such tools were customised to the school and its particular needs and circumstances.
3.1.3 Challenges to using data in teaching and learning
The main challenges to the effective use of data for primary schools, according to the questionnaire survey, were:
• lack of time, particularly time to update and analyse the data
• difficulties in applying data to classroom situations
• limitations of data, i.e. that the data collected/recorded was too narrow/academic or did not accommodate individual needs
• ICT-related issues, e.g. insufficient resources or restricted access.
Discussions within the focus groups revealed that there was confusion not only about which data management systems were available and what they offered but also about how to use them in order to produce outcomes that would be meaningful and would be understood by teachers. Perceptions appeared to be coloured by the extent to which LEAs had communicated with schools about the reasons for the systems that had been introduced and had supported schools in using them to promote teaching and learning. Such discussions suggested further challenges facing schools were:

Primary schools
21
• lack of training or support
• lack of ownership
• viewing data as a threat.
3.1.4 Recommendations to support school staff in making effective use of data to promote learning, including the future development of the Pupil Achievement Tracker
In order to make more effective use of data schools need systems that are simple to use, are well supported and therefore quickly build levels of confidence and familiarity. The requirements of primary schools can be summarized as follows:
• more information about tools and systems – their capabilities and availability - and consistency of advice about what they should use
• linkable or compatible systems – to prevent difficulties with the input or transfer of data
• training and support in using their data analysis systems and in the interpretation of the outcomes
• systems that offer or allow:
– useful graphics
– year-on-year pupil tracking
– the input of meaningful internal assessment information
• time to familiarize themselves with systems and outcomes.
A summary of recommendations across primary schools, special schools and secondary schools is presented in Section 6.
3.2 Data sources and systems
An important part of the evidence gathering phase of the study was to establish which sources of data and data tools are used currently in schools, which of these are perceived to make a difference to teaching and learning, and why. Where possible we have tried to report data sources separately from the tools and systems that are used to manipulate and analyse the data, but inevitably there is some overlap involved. The manipulation of data

Primary schools
22
can itself produce further sources of data, resulting in some assessment systems being viewed by schools as sources of data rather than simply tools. Although the term ‘data’ may have been perceived by some schools as referring to electronic data, the focus group findings suggest that ‘data’ was generally viewed as an all encompassing term, including any information or evidence (paper or electronic) pertaining to teaching and learning.
3.2.1 Questionnaire findings
Question 2a asked respondents to indicate the extent to which various sources of performance data make a difference to teaching and learning. For each of the specified sources, the majority of respondents reported that they made a difference to teaching and learning either ‘to some extent’ or ‘to a great extent’. The sources of performance data most commonly considered to affect teaching and learning ‘to a great extent’ were national curriculum teacher assessment levels, formal assessments (for example, termly records) and school data pertaining to the national curriculum tests. A sizeable minority of respondents did not use optional test data or commercial test data within their schools. Respondents were also given the opportunity to list other sources of performance data that made a difference to teaching and learning in their schools. Thirty respondents listed at least one other source of performance data. Amongst these ‘other’ sources, the most frequently cited were Performance Indicators in Primary schools (PIPS) by six respondents and a small number of other named tests such as NFER and Young’s tests. Table 3.2.1 shows the responses to this question.

Primary schools
23
Table 3.2.1 The extent to which sources of performance data make a difference to teaching and learning (percentage of respondents)
(n = 187) to a
great extent
to some extent
to a limited extent
not at all
not used in
this school
no response
Teacher assessment NC5 levels 65.2 27.3 2.1 0.5 - 4.8
Formal assessments 56.1 29.4 7.5 0.5 0.5 5.9
NC tests – school data 52.9 35.3 7.0 0.5 0.5 3.7
QCA optional tests – school data 45.5 35.3 3.2 0.5 10.7 4.8
School entry/prior attainment data 34.8 44.4 14.4 1.1 1.1 4.3
NC tests – LEA data 33.2 44.9 14.4 2.7 0.5 4.3
P Scales6 29.9 34.2 18.7 3.2 5.9 8.0
NC tests – national data 29.4 39.0 23.0 3.2 1.6 3.7
Commercial tests (e.g. CATs) 19.3 34.8 15.0 6.4 18.7 5.9
QCA optional tests – LEA data 16.0 36.4 13.4 8.6 17.6 8.0
QCA optional tests – national data 11.2 36.4 16.6 11.2 16.6 8.0
Respondents were asked to tick one box per row (see Appendix 1) - so each row sums to 100.
Further analysis7 found no significant relationships between school performance and the number of sources of data used by schools, or between school performance and the extent to which schools perceive them to make a difference to teaching and learning.
Question 2b was similar to Question 2a but focussed on sources of additional data such as information on pupil attendance. In response to this question, by far the most important source of additional data was information on pupils with special educational needs. Far
5 National Curriculum (NC) 6 assessment criteria for progress below level one in the national curriculum programmes of study 7 School performance was derived from the 2003 National Pupil Database, using average KS2 data wherever available or KS1 performance measures (including science TA). The measures were standardised and placed on a single scale. The number of sources of data was defined as the total number of data sources given a rating by the respondent and the measure of the extent to which schools perceive data sources to make a difference to learning was derived by giving a score of four to each ‘to a great extent’ rating, a score of three to a rating of ‘to some extent’ and so on. Using multiple regression analysis, there was no significant difference on either of these measures between higher performing schools and lower performing schools.

Primary schools
24
less common, but still widely reported to make a difference at least ‘to some extent’, were data on gifted and talented pupils and attendance data. The sources of additional data considered to have least impact on learning in primary schools were data on exclusions and data on staff turnover. Only five respondents listed ‘other’ sources of additional data. These included data on preferred learning styles and data on pupil mobility. Table 3.2.2 shows the responses to this question.
Table 3.2.2 The extent to which sources of additional data make a difference to teaching and learning (percentage of respondents)
(n = 187) to a
great extent
to some extent
to a limited extent
not at all
not used in
this school
no response
Data on pupils with special educational needs 62.0 25.1 6.4 1.6 - 4.8
Data on gifted and talented pupils 19.8 52.4 16.6 5.3 1.6 4.3
Pupil attendance data 17.6 42.2 24.6 10.2 0.5 4.8
Data on pupils learning English as an additional language 12.3 26.2 24.6 8.0 21.9 7.0
Data on pupils’ ethnic groups 8.6 29.9 30.5 13.4 11.2 6.4
Free school meals data 7.5 27.8 34.8 21.4 3.2 5.3
Staff turnover data 6.4 16.0 25.7 27.8 19.3 4.8
Data on exclusions 3.7 15.0 26.7 29.9 18.2 6.4
Respondents were asked to tick one box per row (see Appendix 1) - so each row sums to 100.
The next section in the questionnaire addressed the types of management tools and systems used in primary schools. As well as asking respondents to quantify the extent to which such tools make a difference to teaching and learning, it also asked them to describe school-devised systems (where used), the main advantages or features of their most useful data management tool, and why they used their particular system(s) in preference to others that are available.
Question 3a gave respondents a multiple option array and asked them to indicate each management tool or systems used in their school and to rate the extent to which each tool they used makes a difference to teaching and learning. In total, 758 responses were made by 176 of the 187 respondents, indicating that most schools are using a number of different systems in parallel (a mean of four per respondent). The most frequently cited

Primary schools
25
tool in use was the OFSTED Performance and Assessment Report (PANDA), used by 92 per cent of respondents. Other frequently used data management tools were Fischer Family Trust analyses (49%), school-devised systems (48%), SIMS (40%) Pupil Achievement Tracker (39%) and Excel spreadsheets (36%). Respondents were also given the opportunity to name other systems used in their school that were not listed in the questionnaire. A total of 25 responses were given of which the most frequently cited system was Assessment Manager 6, named by nine respondents. The complete list of data analysis tools and how they were rated is given in Table 3.2.3.
Taking into account the number of users, the tools that were most frequently rated as making a difference to teaching and learning ‘to a great extent’ were school-devised systems and Excel spreadsheets. For example, of the 90 respondents who used school-devised systems, 66 of them (i.e. 73 per cent of users) indicated that it made a difference ‘to a great extent’ to teaching and learning and a further 19, ‘to some extent’. By contrast, of those 73 respondents using the PAT, only 17 of them (23 per cent of users) rated the difference it made to teaching and learning as ‘to a great extent’, 36 indicated it made a difference ‘to some extent’, and 18 ‘to a limited extent’ (two gave no response).
As the most widely used system, the PANDA was believed to impact on teaching and learning ‘to a great extent’ or ‘to some extent’ by 41 per cent and 43 per cent of users respectively. Other systems rated highly, albeit by a very small number of schools, were Integris (RM)8, Target Tracker9, ASPECTS/ PIPS and LEA systems.
8 school management information system suite from Research Machines (RM) 9 system developed by Essex County Council Advisory and Inspection Service for primary schools

Primary schools
26
Table 3.2.3 Data management tools/systems used in the school and the extent to which their use makes a difference to teaching and learning
(n = 187) Used in this
school? to a
great extent3
to some
extent3
to a limited extent3
not at all3
no response3
%1 n2 n n n n n
OFSTED Performance and Assessment Reports (PANDA)
92.0 172 71 74 18 2 7
Fischer Family Trust analysis 49.2 92 32 39 15 2 4
School-devised system 48.1 90 66 19 - - 5
SIMS.net10 39.6 74 16 39 11 2 6
Pupil Achievement Tracker (PAT) 39.0 73 17 36 18 - 2
Excel spreadsheets 35.8 67 41 21 2 - 3
LEA system 24.1 45 21 18 2 2 2
ASPECTS/ PIPS 18.7 35 15 15 4 - 1
Target Tracker 17.1 32 15 16 1 - -
PIVATS11 12.3 23 8 10 3 - 2
Other (MIS) 10.2 19 9 5 2 1 2
Integris (RM12) 1.1 10 5 2 1 2 -
Assess IT 3.2 6 1 1 2 - 2
System devised by another LEA 3.2 6 4 1 - - 1
TargSATS13 2.7 5 1 3 1 - -
Pearson Phoenix e1 1.6 3 1 - 1 - 1
GOAL SCI 1.6 3 1 1 - - 1
Connecting Steps/ GAP (B Squared)14 1.1 2 2 - - - -
MiDYIS 0.5 1 1 - - - -
No response 4.8 11 - - - - - 1Percentage of respondents - more than one answer could be given so percentages do not sum to 100. 2 Number of respondents - more than one answer could be given so numbers do not sum to 187. 3 The number of those who reported using the data.
10 Schools Information Management System (Capita Education) 11 Performance Indicators for Value Added Target Setting (an assessment instrument based on the P scales) 12 a management information system from Research Machines (RM)
13 target setting and assessment software 14 assessment packages based on the P scales (for pupils with special educational needs)

Primary schools
27
There were some slight regional differences in the use of some tools/systems. For example, CEM tools (Aspects, PIPs and MiDYIS) were more frequently used in the North than in the Midlands or South of England; but such differences were not statistically significant. There were also no statistically significant differences in the key stage performance of schools when grouped according to the tools or systems used.
Some of the reasons why school-devised systems and Excel spreadsheets were generally considered to have a more positive impact on teaching and learning are indicated by the responses to Q3b, an open question asking respondents to describe their school-devised systems. Ninety-nine respondents listed at least one feature of their system. The most common responses were that such systems were centred around individual pupils (34 respondents), to track learning and attainment (32), to input internal data (24) and to track progress at specific periods (23). For example one respondent wrote:
It is an individualised tracking system so we have a termly class profile and monitor the progress of groups/classes/individuals.
Flexibility and manageability were important features of such systems. A respondent reported that their system:
Tracks pupil achievement from year to year in core subjects including SATs15 results/ TA. Available on one spreadsheet to make tracking of progress easier.
In an open question (Q3c), respondents were asked to specify the most useful data management tool or system used in their school. Some respondents named more than one, resulting in this question eliciting 204 responses from 165 respondents. Of these, 52 responses indicated that their most useful tool was their own school-devised system, and a further 16 indicated an Excel spreadsheet. After school-devised systems, the next most frequently cited tools were the Pupil Achievement Tracker, cited by 22 respondents, SIMS (20 respondents) and Target Tracker (18 respondents).
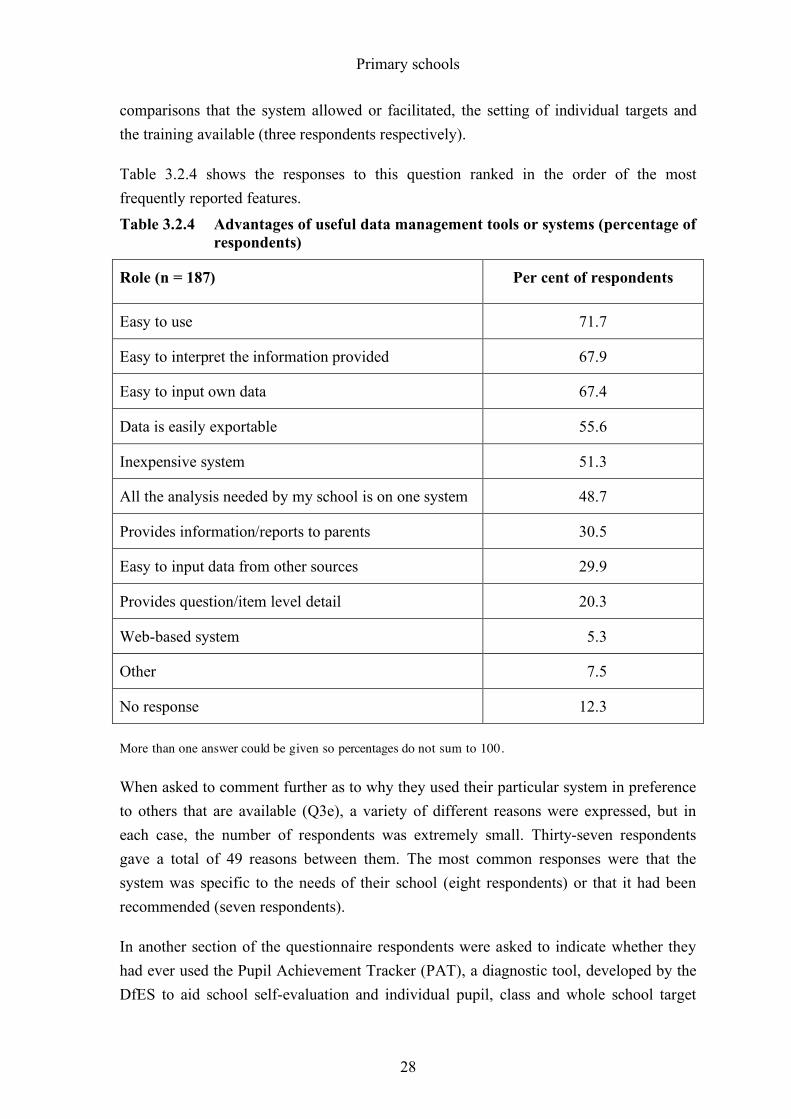
Question 3d then asked respondents to indicate the main advantages of their most useful data management tool or system. A list of possible advantages was given with space for respondents to add additional reasons of their own. Responses showed that ease of use was the most important feature, followed by the ease with which information can be interpreted and the ease with which data can be input. The most common advantages added by respondents were the type of outcomes produced, (four respondents), the
15 unofficial term used by teachers to refer to the national curriculum key stage statutory assessment tests (SATs originally stood for Standard Assessment Tasks, but this term was subsequently dropped)
Primary schools
28
comparisons that the system allowed or facilitated, the setting of individual targets and the training available (three respondents respectively).
Table 3.2.4 shows the responses to this question ranked in the order of the most frequently reported features. Table 3.2.4 Advantages of useful data management tools or systems (percentage of
respondents)
Role (n = 187) Per cent of respondents
Easy to use 71.7
Easy to interpret the information provided 67.9
Easy to input own data 67.4
Data is easily exportable 55.6
Inexpensive system 51.3
All the analysis needed by my school is on one system 48.7
Provides information/reports to parents 30.5
Easy to input data from other sources 29.9
Provides question/item level detail 20.3
Web-based system 5.3
Other 7.5
No response 12.3
More than one answer could be given so percentages do not sum to 100.
When asked to comment further as to why they used their particular system in preference to others that are available (Q3e), a variety of different reasons were expressed, but in each case, the number of respondents was extremely small. Thirty-seven respondents gave a total of 49 reasons between them. The most common responses were that the system was specific to the needs of their school (eight respondents) or that it had been recommended (seven respondents).
In another section of the questionnaire respondents were asked to indicate whether they had ever used the Pupil Achievement Tracker (PAT), a diagnostic tool, developed by the DfES to aid school self-evaluation and individual pupil, class and whole school target

Primary schools
29
setting. Seventy primary school respondents indicated that they had used it either in their current school or in another school. These users were then asked to comment on the most useful aspects of PAT (Q8b) and the improvements they would like to see made (Q8c). The aspects most liked by users were the clarity and graphical representation of data (11 respondents), ease of use and tracking (9 respondents respectively) and the identification of groups and individuals (8 respondents), as illustrated by the following comments.
The ability to easily compare groups of pupils i.e. boys and girls and see the data visually.
Graphical presentation of data makes interpretation very useful to see. Ability to highlight specific pupils.
However, alongside these positive statements eight respondents made negative comments about PAT, particularly that they thought that it was difficult to use.
I can’t cope with Assessment Manager 6 (required by LEA), and PAT (strongly favoured by Link Advisor). I have gone back to Excel.
It was too difficult to use so didn’t pursue.
When asked about improvements to PAT, users commented that the system needs to be simplified or instructions made clearer (14 respondents), they wanted greater compatibility with existing schools’ systems (10 respondents) and more training (7 respondents). Even some of those who had made positive comments about useful aspects of PAT wanted more help.
Use it a few times a year and always end up forgetting what to do! – need easy to pick up and use handbook.
3.2.2 Focus groups
When asked about data, the majority of participants form primary schools cited assessment as the single most important area around which data was collected and used. Across the board, it was agreed that statutory assessment information was used as the basis for schools to set their statutory attainment targets. However, the degree to which data was used within schools, which used it and for what purpose, varied considerably across the groups, as did their perception of its value for teaching and learning.
Different LEAs were reported to have varying requirements in terms of data collection as well as offering differing, sometimes quite contrasting, degrees of support for input and analysis of data and related training. LEAs also appeared to vary in the degree to which

Primary schools
30
they encouraged uniformity of information management systems. This, coupled with differences in circumstances and staffing in individual schools, was clearly illustrated by the very wide variation of reported practices.
In some schools, a review of the assessment data was the starting point of a highly structured and integrated process of analysis that fed into subject and staff planning and ended in the setting of curricular targets for individual pupils. In others, assessment data was regarded simply as a means of holding schools accountable for their performance. Most schools represented in the focus groups fell somewhere between the two extremes.
Mirroring indications from the questionnaire survey, focus group members cited a wide array of assessment data collected within school. These included outcomes from annual statutory and optional tests, termly teacher assessment judgements and internal tests - both commercial tests and tests produced within school (mainly English and mathematics, some science). Participants also cited nursery and baseline data, Foundation Stage Profile, Non Verbal Reasoning, Cognitive Abilities Tests, and others. Some representatives used LEA-produced ‘Target Tracker’ systems. Others were encouraged, or required, by their LEAs to use commercially produced tools such as Fischer Family Trust, while others had independently invested in systems such as ‘TargSATS’ or Durham University’s PIPS. The data collected were used largely to predict levels and compare with end of year results. At key points the selected assessment outcomes were examined, sometimes in conjunction with LEA or national data, to monitor and review progress. School, cohort, class and sometimes individual progress and targets were considered in this way. Schools, and teachers within schools, differed in the regularity and rigour of such analyses but all agreed that at least annually, and usually more often, data analysis was used to inform long and medium term planning. In some cases short term planning was also influenced.
PANDAs were thought to be useful in performance management and all members of the focus groups agreed that value added data were very useful in terms of accountability. Additional data such as attendance data, or information on free school meals were regarded as important, to use alongside performance data, when reviewing targets, especially if considering poor achievement.
Fischer Family Trust (FFT) data was cited as useful (though limited) for making predictions, although the importance of maintaining an accurate database was stressed and it was considered less useful for schools where mobility of pupils was high. It appeared that the use of FFT data was often LEA driven and generally regarded as economical/ value for money.

Primary schools
31
For the mapping and tracking of individuals, all participants agreed that internal, termly records of some kind were essential and some representatives made more frequent records. These were used to chart individual progress and to relate to targets, both LEA percentage targets and, to a lesser extent, to inform individual pupil curricular targets.
Some of the information management systems employed in schools supported the use of data outlined above. However, the vast majority of participants taking part in the focus groups reported that they used additional, more detailed systems often devised within the school. In the main, these took the form of Excel spreadsheets but in a few instances they were paper-based systems. The main advantage of their own systems was felt to be the fact that they were completely customised to the school and its particular needs and circumstances.
Only a few of the representatives from primary schools had had experience of using the Pupil Achievement Tracker. Others had heard of it but were either unaware of what it offered or were wary of investing time in learning to use a new system. In some cases this was due to previous bad experiences, in others it simply reflected complete satisfaction with their existing systems.
Below is a selection of direct quotations from individual members of the primary focus groups. These represent the typical range of comments that arose in relation to the data systems being used and together they give a broad overview of the current situation in primary schools as portrayed by the various groups.
The first three quotes from three different participants highlight some of the advantages and disadvantages of the Pupil Achievement Tracker.
We were introduced to PAT two years ago when it first came out, by the LEA. Unfortunately we got off to bad start as there was a lot to do and very little information with it. So we started again this year in October. We had a seminar at the LEA. Really it wasn’t very helpful, it just confused lots of people. When I sat down to enter data available from government into it there were four different places you had to go to. The basic structure is good and that has driven us to put year 6 and 5 results on and looked at value added. We looked at information we could actually use in classes and target certain children particularly year 5 - we did a question by question analysis - we were then able to focus on some areas highlighted as being weakness areas. We feed the information back to class teachers and they then slot something into their plan. On the other side of it, when looking at value added for individual children that was particularly useful as we were able to see children who were

Primary schools
32
struggling. Where it fails or hasn’t been developed yet is that year to year tracking is not part of PAT. We still need to go back to SIMS to look at that.
I’ve used PAT. I started off to see what it was like. No training was on offer from our LEA that I’ve managed to fathom. It’s been quite useful in the sense that I plotted in all of the scores for our children and it can show me things like value added, key stage 1 to the end of year 4. But, I had a fascinating experience which illustrates my dilemma with data. The year 4 group that left end of last year were actually extremely badly performing for all sorts of reasons. They showed most amazing increase in PAT at the end of year 4. But on my own internal system where I was monitoring their progress, I didn’t feel they’ve made as much progress because I was looking at year 3-4 which I don’t think you can do on PAT, it uses key stage1 results. I didn’t feel in that situation that PAT was really showing anything that was even relevant or helpful to me. I will continue doing it but we can’t use PAT to transfer data - all external transfer of data is done by Assessment Manager 6. You are running two systems constantly, plus I keep an Excel spreadsheet, of my predicted scores versus my real scores, per pupil - it is the only thing that allows me to put in what I want to put in. I can’t fit my Durham scores16 into PAT but they are extremely useful so I use them on my spreadsheet.
We’re starting to use PAT, only problem I have is that we used to use the diagnostic software before which I found quite useful. Now we’ve moved to looking at PAT, you’ve got to download the information from SIMS. There’s no other way of importing the information. Of course, I’ve come to a standstill because no-one in the school seems to know how to get the info from SIMS! In numeracy we use something from the LEA which is an Excel program that assesses against the key objectives...that allows us to put some intervention strategies in place if need be.
Other participants commented on other systems in use and the reasons why PAT was not used in their schools. Each of the following quotes is from a different focus group participant.
I’ve bought a paper based tracking system …..Our LEA uses ‘Assess It’ as opposed to PAT, because I think they bought it just before PAT came out. We use Phoenix Gold in primary and all have all the inherent problems with transferring data.
16 Performance Indicators in Primary Schools (PIPS) from the Curriculum, Evaluation and Management Centre (CEM), University of Durham

Primary schools
33
We are allowed to use the Essex Target Tracker but that has been a bit of a favour, because it is a different county. We don’t use PAT because the LEA has been pushing Assessment Manager 6 now for so long that they want us all to use that and therefore that’s what we have knowledge of - that’s what all schools that I have been around have been using. But, listening to what you have been talking about I am thinking why don’t I know about these things? - what there is out there that these schools are using.
I do know what PAT is – tried to download it onto the computer but didn’t get very far. We’ve got this new thing Central Management Information System (CMIS) which has replaced SIMS. It’s an absolute nightmare. There is an assessment section of it which I imagine does very similar thing to PAT.
I’m not totally au fait with PAT. On the [LEA] website they do a lot of work with the school data. You can type in your school details and you can compare your schools against similar schools, against schools nationally and has all kinds of info – the PANDA, the Fischer Family Trust. It’s all quite useful.
We had OFSTED in September and they came in after two year gap and we’ve been doing an Excel spreadsheet for a year and a few weeks and they were quite pleased with what we were doing. We could justify why we weren’t using PAT and why we were doing what we were doing with our set up in school.
As the quotations highlight, the extent to which schools engaged with data and the ways in which it was used varied according to circumstance and inclination. There were however a number of fundamental issues such as ease of access; the ability to transfer and manipulate data; compatibility with other systems, awareness of what systems are available and what they offer; availability of training and user time that were consistent across all schools. These echoed the comments from the questionnaire respondents when asked about school-devised systems, the advantages of their most useful tools and improvements they would like to see to the Pupil Achievement Tracker.
It should be remembered also, that the focus group members were self selecting and have a declared interest in the use of data in schools. It seems likely that schools with less enthusiastic staff would also show less determination to succeed in using and applying the data available.
3.2.3 Conclusions
Primary schools are collecting and recording a wide range of performance and additional data using a variety of different systems and tools - often running several systems in

Primary schools
34
parallel. No simple relationship has been established between school performance and either the number of sources of data or the type of tools or data systems used by schools. However, the key sources of data perceived as having the greatest impact on teaching and learning are the teacher assessments and internal formal assessments that schools carry out on a regular basis. Hence, the tools that users rated most frequently as making a difference to teaching and learning are those such as Excel spreadsheets and school-devised systems that are centred on the individual pupil and offer flexibility in terms of the input and manipulation of more detailed, internally generated data.
Ease of use and familiarity are central to the needs of schools in relation to data management systems. Although the focus groups revealed a willingness to engage more effectively with data and an acknowledgement that such analyses offered useful insights into pupil achievements and performance, responses suggested that there is considerable frustration and confusion not only about which systems are available and what they offer but also about how to use them in order to produce outcomes that will be meaningful. Perceptions may be coloured by the extent to which LEAs have communicated with schools about the systems that have been introduced and why. Comments both from the questionnaires and the focus groups suggest that some schools have ownership of their data management system and the outcomes produced, whereas others are resistant to engage with data because they experience data management as something that has been imposed upon them.
In order to make more effective use of data schools need systems that are simple to use, are well supported and therefore quickly build levels of confidence and familiarity. The requirements of schools can be summarized as follows:
• information about tools/systems – their capabilities and availability - and consistency of advice about what they should use
• compatibility of systems – to prevent difficulties with inputting or transferring data (e.g. SIMS to PAT)
• training and support in using their data analysis systems and in the interpretation of the outcomes
• year-on-year pupil tracking capability
• flexibility – ability to input internal assessment information.

Primary schools
35
3.3 Impact on teaching and learning: the purposes for which data are being used at school level
A key objective of the study was to examine the processes by which schools attempt to use the information and data that is available to them to improve teaching and learning. Some of this information may be generated internally whereas other sources of data may be provided by OFSTED, DfES, QCA, commercial organisations or the school’s local education authority. This section reports the findings relating to the use of data at school level and how such use impacts on teaching and learning. The focus in Section 3.4 will be on interventions, strategies and the impact of the use of data on individual pupils within the classroom.
3.3.1 Questionnaire findings
In Question 4a respondents were asked to list the three most important purposes for which data analysis is used in their school. Such responses were coded and the frequencies of each purpose were calculated. Many of the purposes reported fell into several key categories as follows:
• tracking or monitoring of performance
• informing planning
• identifying issues or weaknesses to be addressed
• target setting
Some respondents gave very general responses to this question but others gave more detailed information about the purposes for which data is used. For example, within the broad category of identifying weaknesses or issues to be addressed were more specific responses such as: the identification of pupil underachievement, the identification of curriculum areas for whole school development, issues for teacher development, issues for cohorts or specific groups, etc. Over 50 per cent of respondents cited tracking the performance of their pupils as one of the three most important uses of data. Other key uses reported by almost a quarter of schools were identifying pupil underachievement for further support and informing teaching and learning and strategic planning.
Table 3.3.1 lists the different purpose which primary schools listed as being the most important uses for data.

Primary schools
36
Table 3.3.1 Most important purposes for which data is used in primary schools (percentage of respondents)
n = 187 Per cent of respondents
Tracking/ monitoring of pupils/ performance
To track pupil progress/ pupil achievement 51.9
Comparison of progress between groups/ subjects/ individuals/ schools 16.6
Monitoring performance/ progress/ identifying trends in performance 14.0
Monitor and/or raise standards – generic comments 7.0
Teacher/ classroom practice
Inform teaching and learning and (strategic) planning 24.6
To provide records/ feedback/ reports to LEA/ parents/ pupils 13.9
Setting/ grouping pupils 11.2
Inform summative assessments 2.1
Analysis of test results/question analysis 1.6
Identifying issues/ problems
Identify areas of difficulty/ weakness/ underachievement in pupils for further support 23.0
Address/identify issues for curriculum/dept development 11.8
Address/identify issues for the school 10.7
Address/identify issues for groups e.g. SEN, gender, etc 7.0
Address/identify issues in the cohort 4.8
Identify areas of strength/ talents/ gifted and talented for further support 2.7
Address/identify issues for teacher development 2.1
Target setting
Target Setting (non specific) / predicting future achievements/ outcomes 18.7
Set targets for pupils 11.8
Set targets for whole cohort/ groups 7.0
Set targets for school 2.7
Other monitoring
Monitor quality of staff/ teachers/departments/ subjects or initiatives 10.7
Monitor provision for other groups/pupils – not SEN 4.3
Monitor provision for SEN children 2.1
Check/ monitor attendance 1.1
Accountability 2.7
Other/ No response/ not relevant 13.3
More than one answer could be given so percentages do not sum to 100.

Primary schools
37
A specific issue examined in the questionnaire was the use of data at periods of transition (when pupils move from one key stage to another within the same school) and transfer (when pupils move from one school to another). Respondents were asked to rate the usefulness of their data management system at points of transition or transfer. The responses to this question are shown in Table 3.3.2. Generally, primary schools find their data management systems to be of most use at periods of transition within the school, with over 70 per cent of schools rating it as ‘useful’ or ‘very useful’ for transitions at the end of a key stage. The ratings of its usefulness in respect of receiving information from feeder schools and sending data to receiving schools were far more mixed, with over a quarter of schools indicating that it is not useful in preparing and sending information to receiving schools.
There were no significant differences in the overall key stage performance of schools when grouped according to how they rated the usefulness of their data management system in supporting transitions between key stages.
Table 3.3.2 Q5a How useful do you consider your data management system to be at each of the following times? (percentage of respondents)
(n = 187) very useful useful not
sure
not very
useful
not at all
useful
no response
Transitions between key stages within the school 29.9 41.7 8.6 8.6 2.1 9.1
Transitions at other times 16.0 49.2 17.1 4.3 - 13.4
Receiving and interpreting information from feeder schools (at the end of a key stage)
11.2 34.2 16.0 8.6 3.7 26.2
Preparing and sending information to receiving schools (at the end of a key stage)
10.0 26.0 16.0 24.0 2.0 22.0
Respondents were asked to tick one box per row (see Appendix 1) - so each row sums to 100.
In addition, respondents were asked to explain how they use data to support transitions within their schools and to support the transfer of pupils into their schools. One hundred and forty-six respondents gave at least one example of how the use of data supports the transition of pupils from one key stage to the next. Of these, the most frequently reported purposes were sharing records with the next teacher (49 respondents), using prior attainment data to set targets for the next key stage (32 respondents), holding staff

Primary schools
38
discussions or meetings at which data is shared (21 respondents) and using data to inform groupings (17 respondents). One teacher wrote:
Information and interventions are shared. Children are grouped/ re-grouped according to ability.
A slightly smaller number of respondents (128) gave examples of how data is used to support the transfer of pupils. Where pupils transfer into schools, data are used most frequently to set a baseline and start pupils at an appropriate level (30 respondents), group pupils, (28 respondents) and set targets or predict outcomes for the key stage (17 respondents). Fourteen respondents reported that data received on transfer would be fed into the school system. However, a small number of primary school respondents reported that the information received on transfer was often not useful because it was insufficiently detailed (10 respondents) and/or that they would reassess on entry alongside any transfer data (14 respondents).
Helps in planning levels of work.
Look at results and then test. Good for groupings and SEN/ G&T17.
We find data from other schools is not always available.
3.3.2 Focus groups
In terms of the purposes for which data was used, members of the focus groups identified a similar range to that indicated by the questionnaire findings. However, during the focus group discussions, it became clear that the data system selected and the level(s) of data entered were usually determined by the purpose(s) for which the data would be used. That is, data being collected for LEA monitoring, benchmarking, target setting etc required data to be on a centrally compatible system such as SIMS, CMIS, PAT etc. The extent to which this data was regarded as useful in schools was often influenced by the amount of feedback from the LEA and how supportive they were perceived to be in working with schools in using and interpreting the data.
Our LEA put a lot of info on internet for [area] schools that you can access,…but the only face to face input we have is with the advisor when he comes and sits there for half a morning going through the statutory targets.
17 gifted and talented pupils

Primary schools
39
Most members of the focus groups agreed that their schools examined NC level percentage data, usually for management purposes such as target setting and performance management. Data of this sort was sometimes used comparatively with national, or local, results and used as the basis of whole school reviews and planning. Weaknesses in subject areas, or of particular classes or teachers were sometimes identified through this process and, because of such data analysis, remedial action would be taken. Such decisions might be made at LEA level but, more often they were taken within the school. One participant commented:
As an SMT18 we would look, at the beginning of the year, at cash, at kids and decide where to put additional support. We would look at what to put in for each class – like teaching assistants– with a class with more needy pupils we would target the support there.
Another reported that data informed their planning.
I find it quite useful at the end of the year … because it can then inform. If you’re going to then try and do something with the group at the very start of the next academic year, you can identify a group of children for that extra input at the end of one year, for the next year as a focus group to work on. It is of value in years 3, 4, 5 more so than year 6.
In some instances, being able to use the data in this way was regarded positively, particularly if it initiated changes in classroom practice. However, the most common perception of data use at this level still related to accountability.
The schools are very good at having the data there because they have to be accountable.
Several participants mentioned the value of having assessment data available during OFSTED visits or when negotiating targets with the LEA.
I think you’ve got to look at the numbers in the end, because that’s what you are assessed on as a school. Your PANDA shows you your last four years performance, so then you argue about cohorts and children. At least if you have the data you can do that. You have to have all the evidence of where those kids were.
18 Senior management team

Primary schools
40
Other kinds of data were also seen as useful in these respects
Attendance data, yes, because when you get unidentified children underachieving you then look for reasons why. One of the reasons why will be attendance. Then you are looking at socio-economic situations too. You only know because you know the kids and the parents in your school.
The degree of engagement with data at this level varied considerably, even among focus group enthusiasts.
You get this PANDA Report which is really hard to understand anyway. I am sort of getting my head round it now but if you give it to a teacher they don’t want to know about a PANDA Report. Really what do you do with a PANDA Report? We don’t do anything with it really. I don’t know whether you do. I mean, what is it for? I know it is a snapshot of your school and where it is and all of that. Hopefully somebody will tell me what they do with it, because we don’t use any of the information in the PANDA really to feed into what we are doing in school. We use the information that we have got in school already to do that.
Some participants were somewhat critical of the support offered by the LEA.
The amount of input you get from the LEA is directly related to the status of your school. If it’s a struggling school they will be all over you then.
Positive impacts of examining data were identified, particularly when used within schools, for example to identify training needs of staff or to inform the grouping of pupils.
Most participants agreed that data analysis was used regularly in performance management, often for teacher accountability but also to identify teacher strengths and to deploy them most effectively across the school.
One of the things about data collection is that overview of developing the school and your pupil ability. Data has to be collected over many years to be able to do that professionally and suitably. That came to light when I had a year where the maths results had been very good except for the very year of the OFSTED and they dropped 20% and I had to find the story. I racked my brains. I tracked those children and who they had as maths teachers all the way through their seven years. It turned out that they were the only year in my school that hadn’t gone through Mrs [name of teacher]. When I then looked through the data I found she’d actually picked up an average of seven points compared to some people who only managed one. I needed to collect that

Primary schools
41
data over so many years to see that trend, so now I make sure that we don’t swap her round so she misses a year as, actually, she is doing something very good.
Some members of the focus groups, mainly headteachers, clearly regarded data analysis as an integral factor of both management and teaching and learning strategies within the school. Managers and teachers may look to answer different questions from the data. As one head described:
I have two lots of data here. I can see the tracking of individual pupils and their progression but I also have to do strategic planning for the school, whereby I look at the Foundation Stage Profile, really as a beginning to the school, and I have to look at progression. I have put things in place so that, over four or five years I can say this was where I’ve put in focused spelling initiatives and in that time has it made a difference to the children in terms of key learning etc. I need to do that but my teachers are much more involved in tracking of little Fred who hasn’t done this so may need to put in a bit of support there and perhaps that intervention loop isn’t working. I need to know that my big programs including deployment of my staffing has actually had an impact and I can only do that in huge cohort tranches over long periods of time.
Another said:
I think … early intervention is indicated by the data and baseline has given me the reason to go in there and to intervene really early and to sort of shift the school … in terms of being more proactive because at the moment people are mopping things up and trying to sort things out at key stage 2 which I feel, had we had early intervention and tracked the children earlier we could have done things about some of the problems that are, at the moment at key stage 2.
The use of data to inform school level decisions appeared to be happening in all participants’ schools to varying degrees. Data used for accountability purposes and performance management, was regarded both negatively and positively by different members of staff. However, the vast majority of primary focus group participants agreed that where patterns of data were examined and used as a means of raising and, sometimes, answering questions, the outcomes usually resulted in a positive step forward for their school. This view was most particularly held if looked at as a whole school and using levels of data that were specific to their own school circumstances.

Primary schools
42
3.3.3 Conclusions
The impact of data on teaching and learning operates at two levels: directly by means of interventions targeted at individual pupils; and indirectly by means of whole-school approaches and reviews. The latter can be viewed as having a top-down impact and often result from using information that has been gathered over time, and which provides a broader overview of the school. The main purposes for which schools use data at this ‘school level’ are tracking of achievements, progress and value-added; target setting, the identification of strengths and weaknesses of the school, cohorts or groups and comparisons with other schools. The use of this type of data feeds into both short and long-term strategic planning.
Summarising the comments of some members of the focus groups, one conclusion is that effective data management can enable them to see patterns and trends that were not previously possible. Moving beyond the view of data collection as purely one of accountability, effective use of data generates questions and stimulates schools to find the answers. It can also make it easier for schools to share information both internally and externally.
Use of data at school level may facilitate:
• more effective allocation of resources
• performance management
• monitoring the effectiveness of initiatives and strategies
• evidence-based discussions with OFSTED, LEAs, governors, etc
• challenging expectations of staff/pupils/parents/etc
• transitions and transfers.
3.4 Impact on teaching and learning: the purposes for which data are being used at class or pupil level
In the previous section, the broad purposes for which data are perceived to be most useful were reported. Section 3.4 addresses the various links between the use of data and classroom-based or pupil-based strategies and interventions that attempt to bring about improvements in learning opportunities. In other words to identify what primary schools perceive to be ‘best practice’ in the effective use of data to improve learning.

Primary schools
43
3.4.1 Questionnaire findings
In an open question, questionnaire respondents were asked to describe the most common types of interventions or strategies employed by their school, where data analysis had highlighted issues to be addressed. The most common intervention was to offer additional support to pupils, either on a one-to-one basis for individuals or within small booster groups (46 per cent of respondents). Specific mention was also made of support provided by Teaching Assistants (21 per cent of respondents) and identifying children with special educational needs or children who were underachieving (ten per cent of respondents). Other frequent interventions were to use specific literacy or numeracy strategies (30 per cent and 18 per cent of respondents respectively) and to review the teaching programme, for example to provide more differentiated teaching and learning (21 per cent of respondents). Fifteen per cent of respondents reported that a common strategy instigated as a result of data analysis would be a school approach to a specific area of the curriculum or a specific issue such as behaviour. Other common strategies, mentioned by between ten and fifteen per cent of respondents were to provide support or training for staff, to amend teacher groups or setting and to review or inform targets.
Quotes from two questionnaires exemplify the different types of interventions employed by schools as a result of data analysis.
Targetting children for support by teacher or teaching assistant. Using intervention programmes as appropriate. Applying to LEA for extra funds to support SEN children based on performance. Attendance – letters home re rate or punctuality of attendance. Involvement of School Attendance Officer.
Small group work with teaching assistant (TA). A shift of emphasis with our teaching methods, e.g. more practical work/ oral work to meet needs of EAL children. Extra resources, e.g. books to interest boys.
Table 3.4.1 shows the coded responses to this question.

Primary schools
44
Table 3.4.1 Interventions/ strategies employed by primary schools (percentage of respondents)
n = 187 Per cent of respondents
Targeting of groups/ individuals for support Booster groups/one to one support/extra support (for individuals/groups) 45.5 Support/strategies provided by TA/classroom assistant 20.9 Identifying SEN/underachievers (no mention of strategies etc) 10.2
Gifted and Talented provision/high attainers e.g. providing extension material 8.0 Mention of amending/delivering IEP19/statements/SEN code of practice 8.0 revision sessions/catch up lessons/after school/holiday (whole class or unspecified) 3.2 Peer Support/individual mentoring/ student involvement 0.5
Specific Curriculum Strategies/ participation in projects
Named Literacy Strategy e.g. Additional Literacy Support (ALS), Early Literacy Support (ELS)
29.9
Named Numeracy Strategy e.g. ANS, Springboard 18.2 Other named strategies 4.3 Participation in EAL projects/focus 2.7 Whole school/dept participation in wider strategies e.g. primary strategy leadership programme – government programmes/school improvement programme
2.7
Other Curriculum Strategies 2.1
Whole school/ general approaches to classroom practice Review of/changes to teaching programme or curriculum. e.g. more personalised/ differentiated teaching/learning.
20.9
School/dept approach to a specific area e.g. attendance/ behaviour/ curriculum area. 15.0 Inform training needs/provide training/support for staff 13.4 Inform planning and/or targets 10.7 Sharing good practice amongst staff e.g. observations, motivational strategies 5.9 Individual staff decide strategies / not school approach 3.2 Further analysis of data/question analysis 2.7 Review/moderation of assessment system 2.1 Inform lesson planning/curriculum planning 1.1
Interventions /strategies (pupil approaches) Inform teacher groups/focus groups/setting 11.8 Parental involvement/home school partnerships/ 9.1 Withdrawals/exclusions 2.1 Close monitoring of pupils 1.6
Others 0.5 Not directly relevant/uncodeable 1.6 No response 21.9
More than one answer could be given so percentages do not sum to 100.
19 Individual education plan (for all children with special educational needs)

Primary schools
45
3.4.2 Focus groups
While most of the representatives at the focus group meetings reported a confidence with using data for management purposes, approaches to data analysis that fed directly into teaching and learning appeared to be less well established. Nonetheless, it was apparent that, at least some, schools were moving towards a position where the value of using data in a more formative way was regarded as being both useful and desirable.
Some members of the focus group cited examples of how they felt data analysis had impacted on the learning of pupils within their schools. For the most part the data analysis of this kind had been carried out at school or class teacher level although in some instances perceived positive impacts were driven by the LEA. For example:
In [LEA] we are part of an intensified support program which the LEA has instigated. I think that’s really good, we take levels we’ve got (for example I’m year 4) so we take levels we get at end of year 3, put it on to a grid and that identifies those that are underachieving that really should be higher than they are. So they become a target group. Then, we then have lots of layered targets, and because these targets are so focused it allows us to really see what needs doing. I’ve got the facility to put them in and see whether they are above or below the targets.
The layered targets come from the LEA, they decide. They say everybody in the class must be able to do this particular thing. Some people in the class should be able to do this; other children in the class could… I assume the authority devised them, as they are only available on our LEA website.
Some LEAs collected and compiled, and in some cases funded the input of, question level data for statutory and optional tests. Feedback from this sort of analysis was generally regarded as most useful for informing teaching and learning.
We actually get a disc from county and then each mathematics, English and science co-ordinator is given a day’s supply that the school gets a budget for to allow them to analyse that - and that’s a huge help.
More frequently, however, positive impacts for teaching and learning were felt to have arisen out of school level analysis of the data, which had often been collected on the customised databases they themselves had devised. In some cases data analysis had indicated the need for formal intervention strategies.
Where numbers are useful is if you can track individuals. You can say this group are underachieving.

Primary schools
46
In others, class teachers had used the data in specific and formative ways for groups and for individuals.
The extent of class teacher involvement with the actual analysis of the data varied according to school practice, but the success of any resultant strategies was perceived to be strongly dependent on the engagement of teachers and pupils within the classroom.
All those participants who used the question level analysis of QCA optional tests agreed that this level of information had proved useful for informing teaching and learning.
We use the gap analysis…because we can see the questions and where the weaknesses are for different children.
I always used to make the teachers at my old school do the QCA sheets with each question on with a 1 or a 0 whether they got it right or not, because that is probably the best bit of information that I could have as a mathematics coordinator to actually do something with it.
Another commented:
[They are…] useful as we are then able with year 5 to focus on some areas highlighted as being weakness areas. We feed information to the class teachers and they then slot into their planning.
In some instances, after a frustrating start, schools had developed their own approaches:
We use our own Excel program for numeracy. (We did start to use diagnostic software but we couldn’t get it to work properly. The discs had a bug and so only allowed us to enter a certain amount of information.) It has a question level theme where it can pick you an assessment focus or strand and it produces a graph at the end and allows us to see the areas where children aren’t making good progress. Using this allows us to make really accurate targets.
In terms of mapping diagnostic information alongside numerical targets, one participant told the group:
We have a scheme which I bought which has a mathematics test for each half term for each year for each year group…It gives you a level and gives you analysis of objectives covered in the test. Because it’s half termly it also links back to the numeracy strategy in that it’s covering the areas that have been expected to have been covered in the numeracy strategy. You map the results in the same way as the question analysis against the objectives for the children in that half term. It’s very

Primary schools
47
easy. You literally go down and mark it again. It gives you quick analysis of where you are or aren’t. We find it really useful because it relates back to your teaching and the individual children and then you can say whoops, fractions haven’t come through and then you can do something.
One headteacher described how she wanted to use the data:
You could go so over the top with assessment, it’s like everything; you tend to forget there are things that are important rather than assessing constantly. For me it’s trying to make it manageable for teachers. It’s the target setting bit – something we don’t do very well at our school at the moment. It’s setting targets for the children, curricular targets based on the numbers to get them to move forward.
A number of participants indicated that they would like to be able to incorporate data into the setting of curricular targets, but in many schools the practice was not well established.
One member said:
The biggest thing that makes a difference is the pupil target. If they are at level 3c in writing what they need to get to level 4… the numbers don’t matter. The numbers are for us [management] and the LEA and for others to make a comment to us. Numbers don’t impact on teachers on learning. It’s where children are and where they need to get to that impacts on teaching and learning which isn’t generated by numbers. It’s the diagnostic stuff that generates that.
Another said:
My past school, in mathematics we assessed against key objectives and it was that that decided what and how the teacher would teach next and not the number because it’s difficult to relate to level 3. That doesn’t tell you that they’re not very good at number or applying and using it, all kinds of these different strands in mathematics. It’s the day to day teaching, the formative assessment. It’s the marking, the feedback and the discussions. Numbers don’t matter until you do a test that gives the child a level - two separate things.
In terms of the value of the data collected:
[Data is being used]…effectively if it impacts on teaching and learning. There is some usefulness to the assessment, but the main point of assessing is to identify where they need to go next. Otherwise it’s half pointless. Yes, it gives you a report of where you

Primary schools
48
are, but if you don’t use that information and do something with it, then it is pretty pointless really.
Several participants stressed that the value of any data lay in its power to raise questions and stimulate discussion. This was agreed across all groups whether they used fully integrated high tech or paper based systems.
The most effective impact comes from tracking children. All the data we’ve been talking about is stuff that’s on my table mainly and I’m looking at what’s going on across school … Teachers are looking at tracking charts, looking at children’s work and saying where do I go with this child, what have they achieved, why haven’t they achieved this and they look at trends. What are my expectations?… and it’s that level that I want working in the school.
There was a sense, within all the focus groups, that schools were feeling an increasing tendency towards being able to use data to improve a pupil’s performance - viewing it less as a tool for accountability purposes and more as a support for personalised learning.
As one person stressed:
I think that a lot of the data though, is only useful for you to look at trends and look at what’s happening and really it’s what effect it is going to have on your children’s learning and how they can take ownership of their own learning through the data that you’ve got.
One participant explained how having question level data allowed him to encourage his teachers away from inflexible adherence to simply driving through the national curriculum and national strategies and towards using information derived from the data to inform specific teaching for particular groups of pupils.
We had teachers going, I’ve got to get on with this now, I’ve got to do that now – I was saying no no, these are not your priorities, these are your priorities, your children are really very, very skilled here, most of them. You’ve still got some children that need to develop, but look they just haven’t had exposure to this… and that’s wonderful.
The selected quotes above indicate some of the ways in which schools are developing ways of using data to influence pupil learning directly and constructively. However, there was a clear need expressed within all the groups for further guidance in this area.

Primary schools
49
In addition, several participants were quick to highlight the practical issues of time and resources needed to analyse data to this extent. These and other barriers and challenges to using data in this way are discussed in Section 3.6.
3.4.3 Conclusions
The interventions and strategies discussed in this section could be described as bottom-up approaches. Although there is some considerable overlap with ‘school’ approaches discussed in the previous session, here the analysis of data is more tightly focused on the individual pupil. What remains constant in both approaches is the view expressed by headteachers in the focus groups that the value of data lies in its power to raise questions and stimulate discussion.
From the questionnaire responses, the main interventions resulting from an examination of pupil performance data are the provision of additional support for children who are under-performing, the use of specific curriculum strategies (particularly in literacy), and on-going reviews of the teaching program in order to provide more personalised learning opportunities for pupils. These broad strategies are illustrated by specific examples given by focus group participants of how the analysis of data relating to individual pupils is used:
• informs accurate curricular targets for individual pupils
• highlights weaknesses in specific topics for class
• highlights specific weaknesses for individual pupils
• provides evidence to support decisions as to where to focus resources and teaching.
On the negative side, schools perceive a danger that data can easily translate into numerical targets that are, in themselves, meaningless. Numerical data only becomes meaningful if it serves to pose questions about the actual learning that is (or isn’t) taking place and how it can be developed further. There are also some indications from the focus groups that there is considerable variation in the support that schools receive (e.g. time or software) to help with the analysis of more detailed data or to help translate data into individualised curricular targets.

Primary schools
50
3.5 Dissemination and sharing of data
A further consideration within this study, was to examine the perception of respondents as to the extent to which different members of staff engage with the data available. In other words, who uses the data, what is the level of usage, and how are the outcomes of data analysis shared within the school and with other stakeholders such as governors and parents.
3.5.1 Questionnaire findings
Question 6a asked respondents to indicate which members of staff use data analysis to inform teaching and learning, and to provide an indication of their typical usage. Responses indicated that headteachers, assessment co-ordinators and deputy/ assistant head teachers were the most frequent users of data analysis. Almost all respondents indicated that their class teachers used data analysis to inform their teaching but only half of these used it frequently. The results for this question are presented in Table 3.5.1.
Table 3.5.1 Usage of data in primary schools (percentage of respondents)
Role (n = 187) Who
uses the data?1
frequently2 sometimes2 rarely2 no
response2
Head teacher 89.3 85.0 14.4 - 0.6
Class teachers 88.8 51.2 42.8 1.8 4.2
Deputy/ assistant headteacher 74.9 80.0 17.9 0.7 1.4
Assessment co-ordinator 74.3 83.5 12.9 2.9 0.7
Head of year/ key stage 48.1 64.4 33.3 - 2.2
Teaching assistants 47.1 19.3 52.3 25.0 3.4
Head of department/ subject 40.6 50.0 50.0 - -
Administrative support staff 37.4 21.4 40.0 25.7 12.9
Other (e.g. governors, SENCO) 8.0 23.5 70.6 - 5.9
No response 7.0 - - - - 1Percentage of respondents - more than one answer could be given so percentages do not sum to 100. 2 The percentage of those who reported using the data.
In addition to the level of usage in their schools, respondents were also asked to indicate the different ways in which information was disseminated to colleagues and other

Primary schools
51
stakeholders. This gave a further measure of the level of awareness of the information generated by data analysis in their schools (Q6b). The most frequently cited types of dissemination were presentations or giving written information to teaching staff and governors. Eighty-five per cent of schools hold meetings between class teachers to discuss data and 79 per cent use training days to look at data outcomes. Approximately 30 per cent per cent of primary schools give presentations or written information to pupils. The responses to this question are shown in Table 3.5.2.
Table 3.5.2 Dissemination of data in primary schools (percentage of respondents)
(n = 187) Per cent of respondents
Presentations/ written information to teaching staff 89.8
Presentations/ written information to governors 88.2
Meetings between class teachers 85.0
Use of training days (e.g. INSET) 78.6
Presentations/ written information to SMT 74.9
Presentations/ written information to parents 62.0
Presentations/ written information to pupils 28.9
Other (e.g. LEA review with Link advisors) 4.3
No response 4.3
More than one answer could be given so percentages do not sum to 100.
The relationships between school performance and usage of data and between performance and dissemination were examined.20 However, there was no statistically significant difference between higher and lower performing schools (key stage overall performance NPD 2003) in respect of typical usage or dissemination.
3.5.2 Focus groups
The questionnaire findings and the reports of the focus group members clearly indicate that a wealth of data is collected in schools. As the focus group discussions moved
20 A multiple regression analysis was carried out, controlling for the size of school. A rough measure of usage was calculated by assigning a score of three for ‘frequently’, two for ‘sometimes’ or one for ‘rarely’ to each indicated category of user given in response to Q6a. For a dissemination measure, the number of different means of sharing data was totalled.

Primary schools
52
towards the various ways in which information is shared and disseminated differences in both attitudes and practices emerged. As one head put it:
[Data is] only as good as the head who shares it and has an approach that shows up and explains everything to everybody.
The use made of the data collected was often determined by the form in which it is stored and its accessibility. Computerised systems do not always allow all members of staff to have access. In some cases all data resides, exclusively and restrictively, in one place.
You need to go on the secretary’s computer when she’s not there. We can’t all do it. It’s a real limitation. Because of the way that the county bought [name of system], they only allowed you one site licence per building.
In such cases, someone, often the Head or assessment co-ordinator, may produce a printout and pass this to the teachers concerned.
In other schools, although centrally controlled, access was wider.
The majority of staff would use it and also I have a high level teaching assistant who … collects a lot of data for me. Initially it all comes up from me and it’s on my computer and fed down to various members of staff who analyse the predictions for themselves. The theory is that it finally filters down to the class teacher. We make sure that the progress sheets we create are fed back to our teachers so they can see the children and we highlight which children are doing better and those not so well, and then that leads to an informal discussion about why – because children don’t progress at a fixed rate. We know that it may be completely valid a child isn’t making much progress because they’ve made a massive amount previously. Once they’ve had their discussions and are happy – but looking at it in this way opens questions.
Another participant commented:
Ours is a mixture … teachers have access to all the data, all the time. But the person who creates pretty graphs, is office based. Or was until she left. Now we have to work out whose going to take it on and do the analysis. It is a particular job that you need to be that way minded to use data. And I don’t think it is just an administrative job. You need to know what you are looking for.
Again, the degree of dialogue and discussion around the data, as well as the level of analysis carried out varied hugely between schools.

Primary schools
53
A number of schools held staff meetings to discuss data, but these discussions varied from the sharing of percentage target expectations where it was left to individual teachers to decide their own next steps, to the detailed examination of the performance of individual pupils and the setting of curricular targets (carried out as a collaborative process involving senior management, class teachers and the pupils themselves). The majority of schools had evolved something closer to the centre of the continuum.
Focus group members described various views and approaches to dissemination data to teachers and, through them, to pupils.
We just allow the teachers to see, for example the PANDA, we will discuss that in a staff meeting, what implications it might have for us. With any other data we collect the class teacher will deal with their own information and pass it on.
I have individual meetings with the teachers. I have them at the half year stage and probably will at the end, and we will look at those figures from the targets of where they are compared with what they have just got from the QCA and try and decide and put these children into groups of children that need extra help and extra support and how we can do that for next year. I think it helps having the data and having the targets and the individual teacher targets and linked to performance management helps. Otherwise I don’t think conversations would happen that much about it.
One teacher described the importance of staff understanding the data.
…… you have to have a system that gives you the numbers and it’s what you do with them afterwards. Also with any staff, across the staff, you have people with varying specialities and various experiences. They’ve got to be able to see how well their children are performing and make sense of the figures.
Another suggested that paper-based data systems could also be effective.
We used to do a paper tracking exercise…. It was good because we sat around an enormous table and highlighted the [pupils] that hadn’t moved on two points and we all said and actually what’s happened – and that was good as actually this gave us ownership of that. Now it’s all on computer, teachers are removed from it. It’s now a matter of getting it off computer, putting lists together, finding which line you’re looking at and, actually, it becomes a bit of a fag… whereas we used to say once a term get out your piece of paper, let’s do our highlight job.
In some primary schools, a networked database existed with open access for all teachers, although this practice seemed to be more common in secondary and special schools.

Primary schools
54
One participant felt that the sharing of information was easier within a small school, whereas another felt that trends were only meaningful if there was a sufficiently high number of records involved.
In some cases it can be a particular individual who steers the way in which data is used in a school:
I had a really gifted maths coordinator …very analytical approach to what children were doing, she started picking up at an early stage, what information we were getting from formal assessment. We were getting lots of data which was informative to her. She then picked up people’s weekly planning and would comment about what they need to be teaching and that’s how it started. She would write a little comment each week about their planning, would talk about it at staff meetings and it started to ease in that way so it helped assessment forwards in that way.
As indicated in all the quotes above, different members of a school staff may use data for different purposes. School management teams were interested in percentage targets, whole school trends and resource planning. Assessment coordinators and class teachers were more likely to look at detailed analysis of pupil performance to inform curricular planning.
Often these approaches to the data were conducted separately and from different sides. One challenge was to find a way of effectively merging the top down and bottom up approaches for the benefit of the pupils.
I think that makes the distinction again between the two different uses of the data, school level, like what is the school going to do in a couple of years, … and then there is another level below that which is looking at the individual pupils and their needs.
One head was particularly keen to share his experience with the Intensive Support Program currently in use in his school:
ISP is a practical approach. Instead of going to the head, who says –“oh no more” and senior management team are going “what?”, you go straight to the teacher. It gives the teacher something and they look at it and think … I can sort out how I am going to target children’s development. It is all there and it is suddenly in front of them - and the head goes “Oh, I like this”. It’s something people can soak up and it is the first one [Government program] that has been totally practical. If you can go straight to the teacher and give them help – they say I don’t know what to do with these – I don’t know how to improve it, so well we can support you. ISP is Intensive

Primary schools
55
Support Program which is a DfES program. It’s a pack, it is a book, fantastic CD that has everything on it. There’s a video. It’s all there.
Focus group members tended to agreed that whatever the collection of data, it was not necessarily useful in itself. What most benefits schools, teachers and eventually pupils was the dialogue stimulated by a willingness to look for patterns in the data and the positive decisions that are made about teaching and learning as a result.
It was also pointed out by one member that a school had to be ‘ready’ to engage in this type of meaningful dialogue, to be confident enough not to feel threatened and to be able to see a purpose in the level of involvement that is needed.
As one participant expressed it:
…it’s a part of your development and you are ready for doing that and it all connects in with other things coming right. We couldn’t have done it eighteen months ago, but we did it the beginning of this year. People were ready for it so it’s all part of confidence and where we are at the moment.
Another said:
The way we are assessed and the way we keep data on children’s assessment have evolved over the last 5/6 years. I think one of the things is that because it is evolving we continually look at what is useful. For example we have made the decision that PANDA is not useful for teachers to be looking at in particular, whereas their Excel sheet with the names of their children and the progress they’re making is, and the format of how you present the data is important. That’s an evolution of how we have changed it so that now it has become more effective. We present the data in different ways as well, depending on who we are giving the data to. If OFSTED are coming you have got an all singing, all dancing data presentation and interpretation and analysis. When it is something that you are doing with your class teachers then it is down to individual children and how they are developing and that sort of thing.
Although most participants indicated that they would appreciate information and guidance about the ways in which data may be used effectively, they were unanimously agreed that a fully prescriptive strategy for all schools would neither be appropriate nor welcome.

Primary schools
56
3.5.3 Conclusions
The quantitative data reveals that the most frequent users of data in primary schools are headteachers, deputy headteachers and assessment co-ordinators. Almost all class teachers also use data analysis to inform teaching and learning but less than half use it frequently.
One concern is that the increasing use of computers and digital systems may be alienating or distancing class teachers from data that could have a positive impact on teaching and learning. Comments from focus group participants suggest that to some extent the level of usage may be influenced by difficulties in terms of access (only available on one computer) or by familiarity with the system (only one person able to make ‘pretty graphs’). There is an indication that lack of ownership may inhibit positive engagement with data, particularly if the system is felt to be less familiar and more complex than previous paper-based systems.
Combining data from the questionnaire and the focus groups, an interesting finding is that although almost all schools hold meetings to share pupil performance data, the depth of such discussions varies enormously. For example, some meetings focus only on target expectations in terms of overall percentages of pupils who are likely to achieve a particular level, whereas others discuss the setting of specific curricular targets for individual pupils.
A common theme amongst focus group participants was that the discussion of data amongst school staff should act as a stimulus to ask questions as to why particular pupils are progressing (or not progressing) and that such questions should then lead to actions.
3.6 Challenges to the use of data
Another important issue addressed both in the questionnaire and the focus groups was to ascertain what respondents perceive to be the main barriers or challenges facing schools in making effective use of data and data management tools and systems.
3.6.1 Questionnaire findings
An open question gave respondents the opportunity to describe what they perceived to be the challenges affecting effective data use. As before, comments were coded in order to quantify the different types of response. Some respondents gave very specific detailed comments whereas others gave only general indications of the nature of the challenges facing schools. The majority of responses fell into the following categories:

Primary schools
57
• issues of time or resources
• issues relating to the data
• ICT-related issues.
The results for this question are presented in Table 3.6.1.

Primary schools
58
Table 3.6.1 Challenges to the use of data to improve learning (percentage of respondents)
n = 187 Per cent of respondents
Time/resources issues
Time (with no elaboration) 13.4
Time to keep the data updated 8.0
Staffing issues – e.g. having the ‘good’ staff to input data/ training issues/ 7.0
Time to analyse the output 5.9
Resource issues e.g. money to implement changes 4.3
Time to implement changes 1.6
Issues with Data
Difficulty in applying data to classroom situations 12.3
System too academic/ focus on tests – not focusing on other aspects of the individual 11.8
System doesn’t accommodate complex individual needs e.g. disordered learning 11.1
Possibility of misinterpreting data available/not everyone understanding the outcomes 8.6
Issues with the Data– e.g. not trusting results/not being reliable/too late 8.0
Not able to compare data year on year 5.3
Lack of comparability/unable to deduce trends e.g. no schools with similar structures and needs 4.8
Constantly testing in order to keep data current 2.7
School/decisions/changes shouldn’t be driven by data 2.1
Make sure have multiple means of assessing 2.1
Getting data from feeder schools is challenging 0.5
ICT Difficulties Not enough computers, or programme difficulties/access to computers 10.7
Manageability of the system 7.0
Lack of common system within the school 1.1
Not directly relevant/uncodeable 2.1
Other 0.5
No response 26.7
More than one answer could be given so percentages do not sum to 100.

Primary schools
59
The most frequently cited issue was that of time and, where respondents elaborated on this, time to update the data was the greatest concern. Other responses focussed on ICT issues (including insufficient computers or problems of access for staff) and manageability of systems. Other frequently cited challenges were ones connected to the data itself. Of these the most common were comments about the difficulty of applying the data to classroom situations, the narrow focus of the data on test outcomes, the possibilities of a misunderstanding or misinterpretation of the outcomes, and issues of reliability.
3.6.2 Focus groups
As in other areas, the focus group responses largely reflected the results of the questionnaire survey. The main barriers and areas of challenge cited within the primary school focus groups, and these were largely inter-related, were as follows:
• Time - issues relating to workload and time for data input as well as for the interrogation of the data (and the practice time needed to learn how to do it effectively).
• Training and knowledge – as with time, participants felt they needed specific training and practice in using school data systems, including awareness of what is available and what can be done with the data collected.
• Accessibility and dissemination - for members of staff, who should have access to (and understanding of) retrieval and manipulation the data, as well as school policy on how data is used and disseminated.
• Resources – regarded as a barrier in terms of the actual IT resources available in schools, hard and software as well as the setting up and maintenance of the information systems. Financial resources were also cited frequently in relation to equipment, software and training.
• Interpretation - who analyses the data and how the information is disseminated and used is largely dependent on all of the above.
One further area of challenge, although raised by only a few of the participants, was that of encouraging teachers and other practitioners to understand and accept that data can be, and is being, used to directly impact on pupil learning in a positive way.

Primary schools
60
I think for me personally that the challenge is to get everybody thinking you can do things about problems, that we can add a positive attitude with staff and think that if we actually unpick things that we can make a difference.
In one group there was some debate about whether class teachers want or expect to be dealing with data at all; whether there was a culture of ownership of data, and whether this could or should be encouraged.
The staff have either got that analytical background or they haven’t, the good teachers not only want to know what the children are doing but why they are doing it. There are still some teachers who don’t engage and don’t really want to know.
I don’t necessarily agree with that, because for example we have come here today and I have learned from what you are all saying and I will take away something from everybody here. Just because I didn’t have that ability when I walked through the door doesn’t mean I can’t make use of it no…I have had NQTs21, I have shown them how to analyse groups and I think sometimes it is the head that has to have a teaching or coaching role.
Data input was a major concern, particularly with the recently introduced workload agreements. Many schools use secretarial staff or teaching assistants to input data. However, if the information management system is a complex one, there are often only one or two members of staff who are familiar with its workings.
Interpretation of data was also an issue and in many cases schools have invested in commercial systems that give simplified information, usually in graphic format.
I just bought in this year’s [optional test marking] because it’s very expensive and I’m only using it for year 3 and somebody actually will mark them and do all the analysis with all the spider graphs and everything and send it back. I can’t afford to do it for every year group.
We use something simpler called Headache Solutions – a software package that we’ve bought - and depending on who is assessing (another issue completely) who is au fait with software, whoever is the assessment coordinator at the time, uses it or not. Headache Solutions produce the input of the data, QCA data, SAT data (assessment coordinator does this) and that produces graphs which shows children achieving where they should be lots of children whether they are overperforming or
21 newly qualified teacher (NQT)

Primary schools
61
underperforming. The problem with it is it didn’t identify the child, it’s a scattergram of dots and you then have to search out who is the dot. It’s very good. The graphs are very impressive – has all the right sort of stuff. Could do it but it just took time. Had to find out what that mark was, who got that mark.
3.6.3 Conclusions
A number of similar challenges were identified by headteachers in the questionnaire survey and participants in the focus groups. One group of challenges faced by schools can be characterised as resources that schools considered they needed more of: time, staff, training, computers, software, etc. Further challenges underlying these more tangible barriers are those of statistical literacy, ownership and using data in an appropriate way. As some of the coded comments from the questionnaire illustrate, schools have considerable concerns that data systems are too narrowly focused on test results and do not incorporate sufficiently other positive aspects of pupil achievement. Similarly, some schools reported that systems do not always allow for other factors which impact on pupil learning and the often complex needs of individual pupils.
A further concern is how to encourage staff to engage with the data, particularly when there may also be challenges of accessibility and IT fluency to overcome. The question of ownership discussed previously is also relevant here. Although most of the focus group participants viewed data in a generally positive way, it was acknowledged that staff in some schools see data as a threat, used primarily for performance management rather than as a genuine means to improve pupil learning. Even where staff are willing to ask questions of the data, it is clear that problems of interpretation arise, as illustrated by some of the focus group extracts in Section 3.2.2. Schools therefore need considerable help in interpreting data, particularly where different systems or types of analyses produce conflicting outcomes. Many of these challenges might be overcome with sufficient training, support and time to build confidence in using and applying the data.
3.7 Accountability or self evaluation
There is an unproven assumption that the provision of data will lead to improvements in school performance. In addition to examining the ways in which schools attempt to use the data at their disposal to improve learning, a further issue to be addressed was to explore what evidence schools have that attainment has increased as a result of promoting learning through the use of data. In other words do schools believe that the collection and feedback of data to schools is aiding them in the process of self-evaluation and self-improvement?

Primary schools
62
3.7.1 Questionnaire findings
In Question 4c respondents were asked to comment on the contribution that the use of pupil data has made to the school’s evaluation of its performance. The most frequent comment by just less than a third of all questionnaire respondents was that schools now have a clearer picture of different aspects of their school’s performance including any strengths and weakness. Slightly less than 20 per cent of respondents made general claims to the effect that data use had made a significant contribution to self-evaluation and a similar number of respondents reported that the main contribution was in respect of informing planning.
Table 3.7.1 gives a summary of the responses to this question. Table 3.7.1 Contribution of the use of pupil data to performance evaluation
(percentage of respondents) n = 187 Per cent of
respondents Description of effect on school Gives clear picture of school/dept performance and achievement. Helps to identify strengths and weakness/patterns and trends.
31.6
Informing planning and/or school/dept improvement 18.2 Better understanding of data has led to better teaching and learning/accountable teachers/ changing expectations of teachers
9.1
Enabled comparisons e.g. nationally, locally, within school 3.7 Staff have better understanding of data 2.7 Sharing information with others – sharing achievements and weaknesses (e.g. governors, parents)
2.7
General Claims General claims of improvement/contribution to school 17.6 Very limited use e.g. ‘some’ or ‘limited’ 3.2
Difficult to evaluate/developing/starting point 0.5 Data assisting with raising achievement/setting targets Easier to identify pupils’ achievements and to set targets 14.4 Easier to monitor/reflect and maintain/raise/progress standards 12.8 Usefulness of up-to-date / precise data 2.1 Used data as a benchmark 2.1 Performance management/comparison of teacher performance 0.5 To monitor value-added 0.5 Others Data is one element amongst many that are used 2.7 Other 0.5 No response 23.0
More than one answer could be given so percentages do not sum to 100.
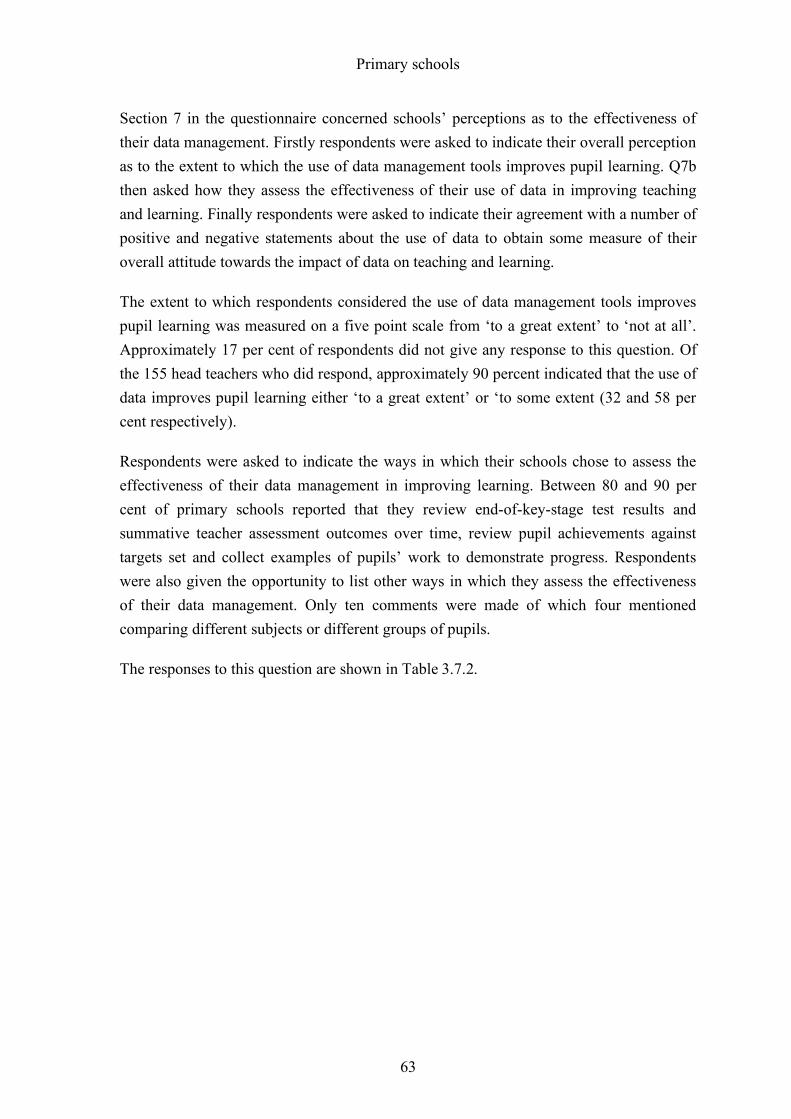
Primary schools
63
Section 7 in the questionnaire concerned schools’ perceptions as to the effectiveness of their data management. Firstly respondents were asked to indicate their overall perception as to the extent to which the use of data management tools improves pupil learning. Q7b then asked how they assess the effectiveness of their use of data in improving teaching and learning. Finally respondents were asked to indicate their agreement with a number of positive and negative statements about the use of data to obtain some measure of their overall attitude towards the impact of data on teaching and learning.
The extent to which respondents considered the use of data management tools improves pupil learning was measured on a five point scale from ‘to a great extent’ to ‘not at all’. Approximately 17 per cent of respondents did not give any response to this question. Of the 155 head teachers who did respond, approximately 90 percent indicated that the use of data improves pupil learning either ‘to a great extent’ or ‘to some extent (32 and 58 per cent respectively).
Respondents were asked to indicate the ways in which their schools chose to assess the effectiveness of their data management in improving learning. Between 80 and 90 per cent of primary schools reported that they review end-of-key-stage test results and summative teacher assessment outcomes over time, review pupil achievements against targets set and collect examples of pupils’ work to demonstrate progress. Respondents were also given the opportunity to list other ways in which they assess the effectiveness of their data management. Only ten comments were made of which four mentioned comparing different subjects or different groups of pupils.
The responses to this question are shown in Table 3.7.2.

Primary schools
64
Table 3.7.2 Assessing the effectiveness of data management in improving pupil learning (percentage of respondents)
(n = 187) Per cent of respondents
Reviewing end-of-key-stage test results over time 89.8
Reviewing each pupil’s achievements against targets set 86.6
Collecting examples of pupils’ work to demonstrate progress 82.4
Reviewing summative teacher assessment outcomes over time 80.7
Recording each pupil’s progress each term 79.1
Comparing pupil achievement with similar schools nationally 75.4
Comparing pupil achievement with similar local schools 73.8
Comparing achievements of cohorts 70.6
Collecting anecdotal evidence of progress from teachers 59.4
Other 5.3
No response 4.8
More than one answer could be given so percentages do not sum to 100.
Attitudes towards the use of data were also explored by means of Question 7c, a series of statements – mainly positive or negative, to which respondents were asked to indicate the extent of their agreement with the sentiments expressed. The results of this question are presented in Table 3.7.3. The statements are not presented in the order in which they appeared in the questionnaire but have been rearranged, ranked in order of the overall strength of agreement with the statements.

Primary schools
65
Table 3.7.3 Agreement with statements about the use of data in primary schools (percentage of respondents)
(n = 187) strongly agree agree
neither agree nor
disagree
disagree strongly disagree
no response
Data analysis has helped to identify pupils who are under-performing. 44.9 43.9 4.3 2.1 - 4.8
Data analysis has helped to identify areas of teaching/ learning that need to be addressed in this school.
35.3 49.7 7.5 2.1 0.5 4.8
Analysing data has had a positive impact on learning outcomes in my school.
32.6 50.8 10.2 2.1 - 4.3
The analysis of data makes it easy to discuss the performance of this school with members of staff.
29.4 55.1 8.0 2.7 - 4.8
Data management tools simplify the process of setting school targets. 27.8 47.6 16.6 2.7 0.5 4.8
Data analysis has helped to identify training needs in my school. 23.5 51.3 16.0 4.3 - 4.8
The use of data is supporting Assessment for Learning. 19.8 54.0 15.5 4.3 0.5 5.9
Data is used by staff at all levels within this school. 11.8 46.5 19.8 16.0 1.1 4.8
More training is needed to help staff interpret and use the information generated.
8.6 57.8 13.9 13.4 1.1 5.3
I do not feel the potential for using data is being fully realised in this school.
5.9 41.2 17.1 26.2 4.8 4.8
Classroom teachers have no time to look at the information generated by our data management system.
4.3 14.4 25.7 41.7 8.0 5.9
Data analysis tells us nothing that we don’t already know. 2.1 7.0 21.9 46.5 16.6 5.9
It is difficult to translate the information generated by data analysis into curriculum planning.
1.6 21.9 25.7 40.1 4.8 5.9
The analysis of data does not improve teaching and learning. 1.1 6.4 12.8 46.0 28.3 5.3
Respondents were asked to tick one box per row (see Appendix 1) - so each row sums to 100.

Primary schools
66
Rearranged in this way it is clear that primary school respondents agreed most strongly that the use of data can have a positive impact on learning outcomes, it helps to identify underachieving pupils and highlights areas of weakness in teaching and learning. Approximately three quarters of respondents agreed that data analysis simplifies the process of setting targets and is supporting Assessment for Learning. Regarding staff issues, headteachers also believed that data can be useful in discussions with staff about school performance and in identifying training needs.
The statements where the extent of the agreement was more widely spread across the scale are potentially more interesting. For example, some schools were finding it more difficult than others to translate the information generated from their analysis of data into curriculum planning. Similarly, there was very mixed agreement as to whether the potential for using data was being realised in the school, whether teachers had the time to look at the data, whether data was being used by staff at all levels in the school, and whether more training was needed to help staff interpret the data. All of these issues were highlighted as barriers or challenges to the use of data in Q4d and such comments are supported by some of the ratings given here. However, the spread of ratings suggests that not all schools perceive them as such. For example four per cent of headteachers strongly agreed with the statement ‘Classroom teachers have no time to look at the information generated by our data management system.’ whereas eight per cent strongly disagreed.
For each statement in Q7c schools were grouped according to the rating they had given. The mean school performance measures (key stage overall performance NPD 2003) for each group were then compared to see if there were any significant differences between the groups. Only two significant differences were found but these did not suggest any patterns or trends in the data. For example, the group of schools who disagreed with the statement More training is needed to help staff interpret and use the information generated had a statistically higher key stage performance mean than the group who were unsure (neither agree nor disagree). However there was no statistically significant difference between the mean score of the group who disagreed with the statement and either of the groups who agreed or agreed strongly with it.

Primary schools
67
3.7.2 Focus groups
Members of the focus groups had come with a declared interest in the use and application of data in schools. It was therefore to be expected that those present would have a positive perspective. This was true for the most part. However, there was still some clear concern expressed about what was seen as blind reliance on data for accountability purposes without taking ‘the story’ into account. It was generally agreed that for both LEA target setting and for OFSTED inspections percentage data could be used inappropriately if complementary, finer level, information was not given weight in the negotiations.
The problem with the PANDA is it gets you looking in the wrong direction and you can’t identify from the PANDA for example [but] I can identify from the data I get from [our own system] perhaps my Turkish boys aren’t achieving very well compared to the general cohort but when I actually look at value added they have done exceptionally well. Its looking at things in isolation. That’s the problem with all the data. You need to gather that all together and see what’s really there rather than little indicators.
PANDAs are part of one of the things you use. You have to think why do we do this – why do we keep data? It’s partly for your benefit for the school but also you have to think of other factors…and really, to measure performance in school you need something more detailed when the OFSTED team to tell you how you perform. You can’t get that from reading the PANDA on its own in isolation – there’s so much more to the school than levels.
Appropriate interpretation of the data was considered paramount, and schools themselves are building up expertise in this area, although often to defend against external pressures.
Some participants reported situations where having additional data available had allowed more meaningful discussions.
Whoever happens to turn up on your doorstep.... will pick all those bits apart and they’re not looking at the right things.…[This was the] ……first time I’ve had that quality of information. I didn’t have it until two years ago. Fischer Family Trust information, it’s sitting there and you can put it in front of the governors.
Other instances were quoted where data had been useful in ‘telling the story’ to parents:
…the tracking of pupils and very firm assessment data is about the only thing I can say in the end, to the parents, …. actually I need the numbers quite a lot. So whilst I’ve worked on assessment for learning as a principle and a policy within the school, I

Primary schools
68
need that [data] all the time, because people come in and expect their child to go into the very best school.....
or informing governors:
It is also very useful for governors …if you are making very hard budget decisions and you are actually looking at ‘Are we going to do Springboard?’…, ‘Well if we don’t what is going to be the knock on effect?’… where they actually have to make hard decisions. So you can actually use it, and your budget follows where you should be doing the work, because you have been able to show a particular cohort that is going to benefit from it.
One participant who had worked as an inspector had this to say:
…but generally over the schools I saw last year, which were lots and lots of schools, the good things about it were, and I know you’ll shout me down, was actually when people started looking at data they also started looking at standards and the standards agenda became slightly more real and we had a shared language. So how well are you doing, suddenly became something we could talk about in number terms ..... I know it is counteractive to what a lot of people are saying, but quite a lot of schools didn’t have that and to have a shared language between them where you know the school was not performing well and yet they had nothing to show me that we could share to discuss that was very, very difficult. The negative side of it was trying to change the ethos in schools, much as you were saying there, where actually staff in the past have been frightened by what data would do – does data mean I’ll lose my job, does data mean I’ll lose my pay, does data mean I am not performing as well as the next man .....
3.7.3 Conclusions
Both in their open comments and their indications of agreement with the statements about data, questionnaire respondents were generally positive about the contribution using data has made to their self-evaluation. A sizeable minority claimed that the use of data has made a significant difference and in particularly schools commented on having a clear picture of the school’s strengths and weaknesses and the benefits in terms of strategic planning.
Focus group participants made reference to having the information available with which to describe and, if necessary, justify their performance to stakeholders such as parents, governors, LEAs, OFSTED inspectors, etc. However, they also reported that it had taken

Primary schools
69
considerable time to reach this point of having the confidence and knowledge to use data in this way.
3.8 Summary of findings and recommendations
The main purposes for which primary schools use data are tracking of achievements, progress and value-added; target setting, the identification of strengths and weaknesses and comparisons with other schools.
Effective use of data facilitates:
• identification of weaknesses in curriculum areas or pupils
• setting accurate curricular targets for individual pupils
• more effective allocation of resources
• performance management
• monitoring the effectiveness of initiatives and strategies
• evidence-based discussions with OFSTED, LEAs, governors, etc
• challenging expectations of staff/pupils/parents/etc
• transitions and transfers.
The experience of primary schools in relation to data management systems varies considerably in terms of the tools and systems in place, the knowledge and familiarity of users in relation to those systems and the willingness to engage with the data.
Primary schools require data management systems that:
• are easy to use
• allow flexibility of input
• have compatible school management and assessment components
• offer comprehensive training and support
• encourage engagement and ownership.
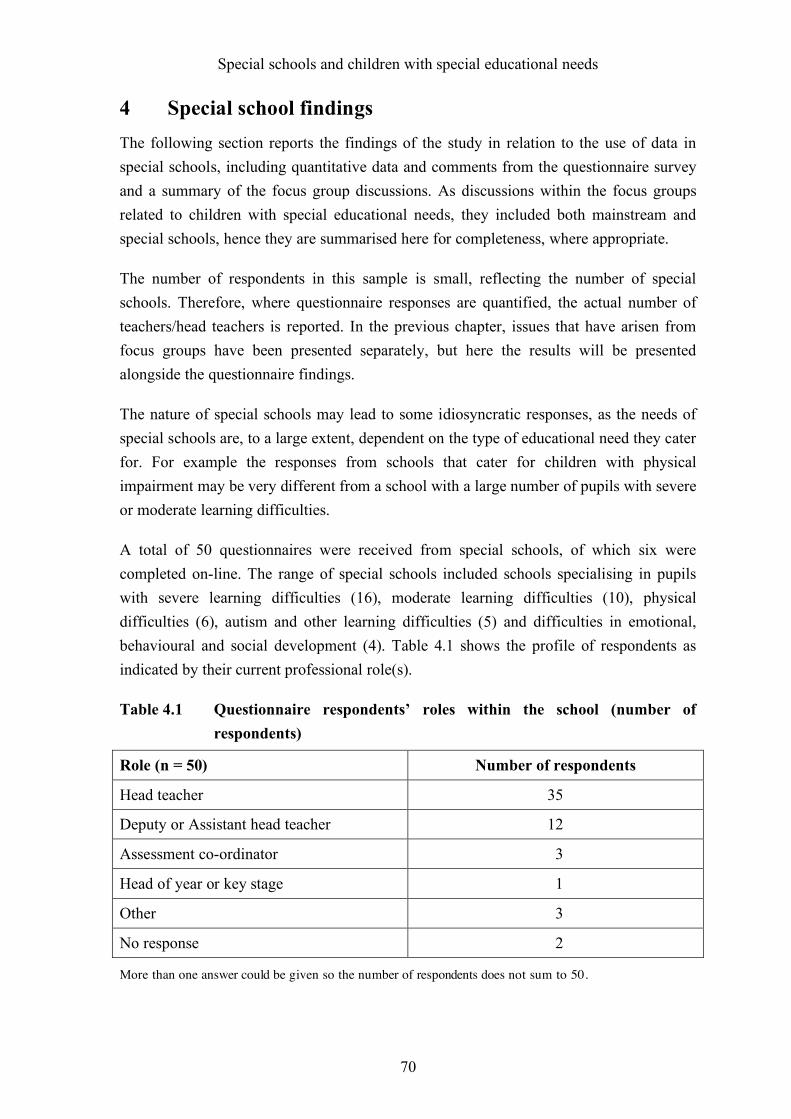
Special schools and children with special educational needs
70
4 Special school findings The following section reports the findings of the study in relation to the use of data in special schools, including quantitative data and comments from the questionnaire survey and a summary of the focus group discussions. As discussions within the focus groups related to children with special educational needs, they included both mainstream and special schools, hence they are summarised here for completeness, where appropriate.
The number of respondents in this sample is small, reflecting the number of special schools. Therefore, where questionnaire responses are quantified, the actual number of teachers/head teachers is reported. In the previous chapter, issues that have arisen from focus groups have been presented separately, but here the results will be presented alongside the questionnaire findings.
The nature of special schools may lead to some idiosyncratic responses, as the needs of special schools are, to a large extent, dependent on the type of educational need they cater for. For example the responses from schools that cater for children with physical impairment may be very different from a school with a large number of pupils with severe or moderate learning difficulties.
A total of 50 questionnaires were received from special schools, of which six were completed on-line. The range of special schools included schools specialising in pupils with severe learning difficulties (16), moderate learning difficulties (10), physical difficulties (6), autism and other learning difficulties (5) and difficulties in emotional, behavioural and social development (4). Table 4.1 shows the profile of respondents as indicated by their current professional role(s).
Table 4.1 Questionnaire respondents’ roles within the school (number of respondents)
Role (n = 50) Number of respondents
Head teacher 35
Deputy or Assistant head teacher 12
Assessment co-ordinator 3
Head of year or key stage 1
Other 3
No response 2
More than one answer could be given so the number of respondents does not sum to 50.
Special schools and children with special educational needs
71
4.1 Key Findings
Key findings from special schools are summarised in relation to the four aims of the research.
4.1.1 How is data used to promote learning in special schools in England?
The most commonly reported uses for data in special schools were similar to those reported by primary schools, although due to the size of some schools there was far more overlap between uses of data at school level and uses of data that had a more direct impact on the individual. The most frequently reported uses of data in special schools were:
• tracking and monitoring pupil progress
• target setting
• monitoring staff quality/subjects/initiatives
• inform strategic planning
• provide records and feedback to parents.
Frequently, special schools reported measuring progress and setting targets through special needs specific data sources, such as the P scales. Others mentioned the importance of tracking pupils over a number of key stages or tracking particular groups, for example groups of pupils with different special needs. Many respondents felt that data was used effectively by their school to evaluate its performance.
The most common interventions or strategies used by special schools as a result of problems highlighted by data analysis were:
• identify areas that need a whole school approach
• review and change individual teaching programmes
• offer one to one support
• inform training needs.
School approaches, for example behaviour management programmes, were perceived to have a direct influence on what can be achieved in the classroom.

Special schools and children with special educational needs
72
4.1.2 Good practice in the effective use of data to promote learning
The questionnaire also looked at the sources of data and the tools and systems that are used by schools to analyse data. Responses to this section reflect earlier results from mainstream primary schools. Overall special schools reported that good practice in the use of data was supported by data management systems that:
• are easy to use
• allow flexibility of input
• are easy to interpret
• promote discussions between staff
• identify training needs amongst staff.
School-devised data management systems and Excel spreadsheets were popular tools in special schools and were considered to make the most difference to teaching and learning. Such systems were generally used by special schools because they allowed them to input holistic or detailed developmental data. It was considered particularly important to record achievements at a much finer level of detail than was possible with many commercial mainstream packages, in order to demonstrate and celebrate progress.
4.1.3 Challenges to the use of data in special schools
The main challenges to the effective use of data in special schools were:
• data systems that do not accommodate the complex needs of individual pupils
• lack of comparable data (year on year data).
Special schools found it difficult to use some mainstream data systems to accommodate the complex needs of individuals in their schools. Recording progress in broad steps such as national curriculum indicators meant that the achievements many pupils could not be recorded and celebrated.
Many special schools also commented upon the use of the P scales (for children working below the national curriculum levels) and the need for moderation. Currently there is no benchmark for assessing very low attaining children with special educational needs leading to a lack of comparability between assessments in special and mainstream schools. Because of a diversity in pupil populations between special schools and, where numbers are small, between cohorts within the same school, there is often a lack of

Special schools and children with special educational needs
73
comparable data. This makes it difficult for special schools to evaluate their performance effectively and to deduce patterns and trends in performance over time.
4.1.4 Recommendations to support school staff in making effective use of data to promote learning, including the future development of the Pupil Achievement Tracker
The requirements of special schools can be summarized as follows:
• systems available that allow more detailed, developmental and holistic data to be input
• systems that show targets and progress in small developmental stages
• available data sources that collect developmental data and not just test data
• moderation of P scales.
A summary of recommendations across primary schools, special schools and secondary schools is presented in Section 6.
4.2 Data sources and systems
An important part of the evidence gathering phase of the study was to establish which sources of data and data tools are used currently in schools, which of these are perceived to make a difference to teaching and learning, and why. Where possible we have tried to report data sources separately from the tools and systems that are used to manipulate and analyse the data, but inevitably there is some overlap involved. The manipulation of data can itself produce further sources of data, resulting in some assessment systems being viewed by schools as sources of data rather than simply tools.
4.2.1 Questionnaire and focus group findings
Question 2a asked respondents to indicate the extent to which various sources of performance data make a difference to teaching and learning. Teachers from special schools considered P scales22, formal assessments and teacher assessment to be the three most important sources of data affecting teaching and learning ‘to a great extent’. Tests, including national curriculum and QCA optionals, were generally considered to affect learning ‘to a limited extent’ or ‘not at all’, and optional tests were not used by a majority of special schools. A total of 21 responses were indicated for ‘other’ sources of
22 In order to quantify their use P scales were listed separately in the questionnaire although they are an integral part of teacher assessment.

Special schools and children with special educational needs
74
performance data, these included: personal targets and objectives (five cases), Performance Indicators for Value Added Target Setting (PIVATS) (three cases), schools’ own test (two cases), Award Scheme Development and Accreditation Network (ASDAN) levels, Small Steps and Moving on Levels (one case each) all of which were used to either a ‘great’ or ‘to some extent’. Table 4.2.1 shows the responses to this question.
Table 4.2.1 The extent to which sources of performance data make a difference to teaching and learning (number of respondents)
(n = 50) to a
great extent
to some extent
to a limited extent
not at all
not used in
this school
no response
P Scales 35 9 - - 2 4
Formal assessments 31 10 2 - 4 3
Teacher assessment NC levels 23 10 10 1 3 3
School entry/prior attainment data 12 18 12 3 3 2
NC tests – school data 7 9 10 8 14 2
Commercial tests (e.g. CATs) 7 4 9 5 22 3
NC tests – LEA data 4 5 12 12 15 2
NC tests – national data 2 5 11 14 15 3
QCA optional tests – school data - 1 5 12 29 3
QCA optional tests – LEA data - 1 4 13 29 3
QCA optional tests – national data - 2 3 13 28 4
Respondents were asked to tick one box per row (see Appendix 1) - so each row sums to 50.
Question 2b was similar to Question 2a but focussed on sources of additional data such as information on pupil attendance. In response to this question, by far the most important source of additional data was on pupils with special educational needs with 38 respondents considering it to make a ‘great’ difference to teaching and learning. Far less common, but still widely reported to make a difference at least ‘to some extent’, was pupil attendance data. Data on gifted and talented pupils was not used by most respondents. However, most sources of additional data in this question were used either to a ‘limited extent’ or above by the majority of respondents, indicating that a wide range of additional data is collected by special schools. Schools were also given the opportunity to

Special schools and children with special educational needs
75
add further sources of additional data used in their schools - examples included Individual Education Plan (IEP) targets, individual pupil behaviour records, data on health and medical issues and the preferred learning styles of pupils. Table 4.2.2 shows the responses to this question.
Table 4.2.2 The extent to which sources of additional data make a difference to teaching and learning (number of respondents)
(n = 50) to a
great extent
to some extent
to a limited extent
not at all
not used in
this school
no response
Data on pupils with special educational needs
38 7 - 1 1 3
Pupil attendance data 11 23 9 4 - 3
Free school meals data 7 14 18 9 - 2
Data on pupils learning English as an additional language
6 14 12 7 8 3
Staff turnover data 6 15 11 11 4 3
Data on pupils’ ethnic groups 5 16 13 8 5 3
Data on exclusions 4 11 9 13 10 3
Data on gifted and talented pupils 1 3 6 11 27 2
Respondents were asked to tick one box per row (see Appendix 1) - so each row sums to 50.
The next section in the questionnaire addressed the types of management tools and systems used in special schools. As well as asking respondents to quantify the extent to which such tools make a difference to teaching and learning, it also asked them to describe school-devised systems (where used), the main advantages or features of their most useful data management tool, and why they used their particular system(s) in preference to others that are available.
Question 3a gave respondents a multiple option array and asked them to indicate each management tool or systems used in their school and to rate the extent to which each tool they used makes a difference to teaching and learning.

Special schools and children with special educational needs
76
Table 4.2.3 Data management tools/systems used in the school and the extent to which their use makes a difference to teaching and learning (number of respondents)
(n = 50) Used in
this school?1
to a great
extent2
to some
extent2
to a limited extent2
not at all2
no response2
OFSTED Performance and Assessment Reports (PANDA) 39 3 15 17 3 1
School-devised system 28 22 5 - - 1
SIMs 24 5 13 5 1 -
Excel spreadsheets 21 12 7 1 - 1
Equals23 20 7 8 1 - 4
Connecting Steps/GAP (B squared) 14 10 2 2 - -
FFT 11 3 4 3 1 -
PIVATS 11 6 2 3 - -
ASPECTS24 /PIPS25 10 4 5 1 - -
LEA system 8 2 3 1 - 2
Other (MIS) (e.g. EPAR26) 6 4 1 1 - -
Integris (RM) 5 1 4 - - -
System designed by other LEA 4 2 1 1 - -
Pupil Achievement Tracker (PAT) 1 - 1 - - -
Pearson 1 1 - - - -
GOAL Sci 1 - 1 - - -
No response 2 - - - - -
1 Number of respondents - more than one answer could be given so numbers do not sum to 50. 2 The number of those who reported using the data.
23 an organisation offering an assessment package for pupils with severe learning difficulties based on the P scales (called PACE), plus a data collection and analysis service 24 Assessment Profile on Entry for Children and Toddlers (ASPECTS) 25 Performance Indicators in Primary Schools (PIPS) 26 Educational Planning and Reporting

Special schools and children with special educational needs
77
The most frequently cited systems in use were Performance and Assessment reports (PANDAs), school-devised systems, SIMs.net and Excel spreadsheets (which can also be considered a school devised system). However, relative to the number of users, school-devised systems were highly rated for their impact on teaching and learning. Similarly, although the commercial programme B Squared was only used by 14 respondents; the majority indicated it made a ‘great’ difference to teaching and learning. Other specialist tools used by special schools were PIVATS and Equals although these were generally less highly rated. In the ‘other’ responses EPAR was a system used by a very small number of schools. Although PANDAs were used by most schools, they were rated as having ‘limited’ impact on teaching and learning. This was commented upon further by special school representatives in the focus groups, who felt that the output produced in PANDA, did not accurately represent the achievements of individual pupils.
Until recently they never took P-levels so you weren’t in a position to say this child came in at P4 and left at P8, isn’t that wonderful? It was just zero and I think that was the frustration.
When asked in an open question (Q3c) to specify the most useful data management tool or system used in their school, 13 of the 37 who responded reported it to be their own school-devised system (plus a further five highlighted Excel spreadsheets as the most useful), whilst seven respondents indicated the commercial B Squared package. Question 3d then asked respondents to indicate the main advantages of their most useful data management tool or system. The most common advantage of using their data management tool or system was its ease of use and the ability to input their own data. There were seven ‘other’ responses to this question, the most common (4 cases) indicating that the kind of information produced by the system was also a main advantage.
Provides relevant and useful information
Table 4.2.4 shows the responses to this question ranked in the order of the most frequently reported features.
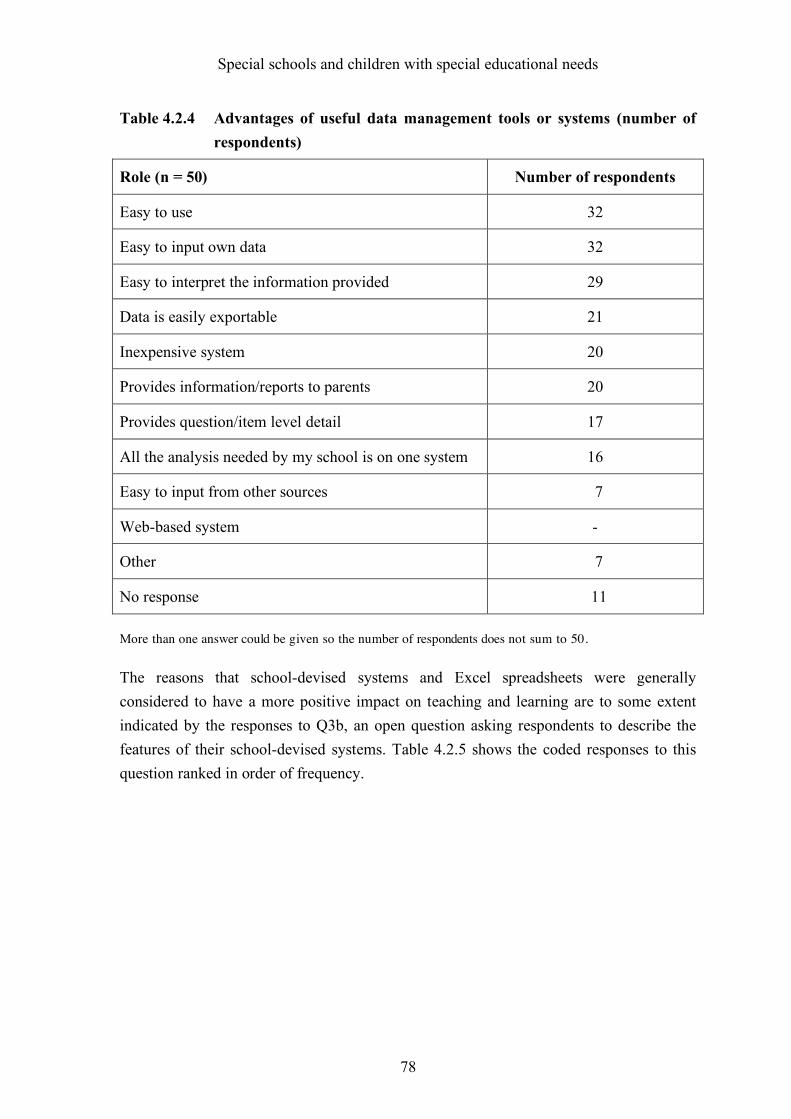
Special schools and children with special educational needs
78
Table 4.2.4 Advantages of useful data management tools or systems (number of respondents)
Role (n = 50) Number of respondents
Easy to use 32
Easy to input own data 32
Easy to interpret the information provided 29
Data is easily exportable 21
Inexpensive system 20
Provides information/reports to parents 20
Provides question/item level detail 17
All the analysis needed by my school is on one system 16
Easy to input from other sources 7
Web-based system -
Other 7
No response 11
More than one answer could be given so the number of respondents does not sum to 50.
The reasons that school-devised systems and Excel spreadsheets were generally considered to have a more positive impact on teaching and learning are to some extent indicated by the responses to Q3b, an open question asking respondents to describe the features of their school-devised systems. Table 4.2.5 shows the coded responses to this question ranked in order of frequency.

Special schools and children with special educational needs
79
Table 4.2.5 Description of school-devised system (number of respondents)
Role (n = 50) Number of respondents
Finer level of detail 10
Tracking system – centred around individual 9
Learning/performance/attainment 7
Reviewing targets 7
Progress 6
Target setting 6
Other 17
No response 20
More than one answer could be given so the number of respondents does not sum to 50.
It was reported that monitoring achievement using mainstream indicators, such as NC levels can be unhelpful as the attainment of children with special educational needs is often measured in small, developmental stages, most commonly through the P-level system. A member of a focus group explained the level of information that is currently collected in his/her school system:
Social maturity, mental age, that sort of info, behaviour, whether they have a disability that affects their functioning such as ADHD27 or concentration skills.
Consequently it was not surprising to see that the most common response to question 3b indicated that schools have specifically developed systems that are suitable to their needs and produce a finer level of distinction in individual achievement. This allows them to track developmental progress as well as national curriculum levels for these children. For example:
Tracks progress in very small steps in most NC subject areas for pupils working towards level 1.
27 attention deficit/ hyperactivity disorder

Special schools and children with special educational needs
80
Recording systems for different subject areas based on P scales to track individual progress in different NC areas.
A member of a focus group also applied this issue to finding assessment tools that are appropriate in relevance and approach for pupils with special needs, especially in schools which span all key stages.
It’s very difficult to find tools that are appropriate. Our kids can’t sit down and do paper and pencil work.
Tracking learning, performance and attainment at the individual level were also considered important by questionnaire respondents:
Tracks pupils progress individually allowing for different rates of achievement to be celebrated.
Tracks achievement of learning outcomes in school schemes of work in each subject. Tracks P-level achievement.
As well as the ability to set and review targets:
Used to check teacher projected targets against actual targets reached by pupils.
When asked to comment further (Q3e) as to why they used a particular system in preference to others that are available, the most common response (seven cases) was that the system was specific to the needs of their school.
This was designed by special needs staff to use in special schools.
This is a system that allows progress to be recorded in an individual way for all pupils especially PMLD28.
In another section of the questionnaire respondents were asked to indicate whether they had ever used the Pupil Achievement Tracker (PAT), a diagnostic tool, developed by the DfES to aid school self-evaluation and individual pupil, class and whole school target setting. Of the 47 respondents to this question, only one had used it either in their current school or in another school. The only special school that had used PAT, indicated that currently the system was of limited use.
28 profound and multiple learning difficulties

Special schools and children with special educational needs
81
4.2.2 Conclusions
Many of the sources of performance data and data management tools that are considered useful to mainstream schools are deemed by respondents to be of no use or of limited use to special schools. The main sources of performance data deemed by respondents to be of use in this sector were assessments using P scales and other teacher assessments (both formal and informal). A small number of schools continue to operate within mainstream parameters, using optional test data as well as end of key stage assessments, although they are not considered to make a difference to teaching and learning. Special schools also need to collate and record a complex mix of additional data for each individual pupil.
There was some frustration, voiced in the focus groups, that mainstream sources such as PANDAs were inappropriate and failed to recognise the achievements of both pupils and teachers in special schools. Special schools have had to create and adapt their own methods and systems to accommodate data that deals with the individual and complicated requirements of children with special educational needs in contrast to the needs of children in mainstream education. Consequently special schools have either developed their own systems or looked for constructed packages such as B-Squared.
Some of the needs of special schools are identical to those of mainstream schools; they need systems that are simple to use and allow the easy input and interpretation of data. However, above all they need systems that allow a much finer level of detailed information to be added and that allow progress to be measured in extremely small steps and that accept and recognise that such progress may not be smooth nor linear.
4.3 Impact on teaching and learning: the purposes for which data are being used at school level
A key objective of the study was to examine the processes by which schools attempt to use the information and data that is available to them to improve teaching and learning. Some of this information may be generated internally whereas other sources of data may be provided by OFSTED, DfES, QCA, commercial organisations or the school’s local education authority. This section reports the findings relating to the use of data at school level and how such use impacts on teaching and learning. The focus in Section 4.4 will be on interventions, strategies and the impact of the use of data on individual pupils within the classroom.
4.3.1 Questionnaire and focus group findings
In Question 4a respondents were asked to list the three most important purposes for which data analysis is used in their school. Such responses were coded and the frequencies of

Special schools and children with special educational needs
82
each purpose were calculated. Many of the purposes reported fell into several key categories as follows:
• tracking or monitoring of achievement and progress
• target setting
• informing strategic planning.
The most common purpose for which data was used was tracking individual pupil progress and achievement. Other common purposes were target setting and monitoring the quality of teaching and learning. Some respondents gave responses at a broad, global level:
Pupil tracking
Target setting.
Other respondents gave more detailed information about the purposes for which data is used. For example, within the category of tracking or monitoring achievement and progress there were responses amongst others, such as: tracking achievement for individual pupils, cohorts, subjects, schools, amongst others.
Tracking cohorts – MLD29 population and social/communication population.
To identify differentiated attainment and progress for different groups in school (gender, level of SEN, ethnicity etc)
If progress exceeds expectations, PIVAT levels would help to suggest next steps…
Table 4.3.1 lists the different purposes for which data analysis is used in special schools.
29 moderate learning difficulties

Special schools and children with special educational needs
83
Table 4.3.1 Purposes for which data analysis is used in special schools (number of respondents)
(n = 50) Number of
respondents
Tracking/ monitoring of pupils/ performance
To track pupil progress/ pupil achievement 36
Comparison of progress between groups/ subjects/ individuals/ schools 7
Monitoring performance/ progress/ identifying trends in performance 5
Monitor and/or raise standards – generic comments 3
Target setting
Target Setting (non specific) / predicting future achievements/ outcomes 11
Set targets for pupils 6
Other monitoring
Monitor quality of staff/ teachers/departments/ subjects or initiatives 10
Check/ monitor attendance 5
Monitor provision for other groups/pupils – not SEN 2
Monitor provision for SEN children 1
Teacher/ classroom practice
To provide records/ feedback/ reports to LEA/ parents/ pupils 8
Inform teaching and learning and (strategic) planning 7
Inform summative assessments 1
Setting/ grouping pupils 1
Identifying issues/ problems
Address/identify issues for groups e.g. SEN, gender, etc 6
Address/identify issues for curriculum/dept development 4
Identify areas of difficulty/ weakness/ underachievement in pupils for further support 3
Address/identify issues in the cohort 3
Address/identify issues for the school 3
Address/identify issues for teacher development 2
Identify areas of strength/ talents/ gifted and talented for further support 1
Assessing readiness for moving between schools/groups/key stages/sets 2
Other 1
No response/ not relevant 4
More than one answer could be given so the number of respondents does not sum to 50.

Special schools and children with special educational needs
84
A specific issue examined in the questionnaire was the use of data at periods of transition (when pupils move from one key stage to another within the same school) and transfer (when pupils move from one school to another). Respondents were asked to rate the usefulness of their data management system at points of transition or transfer. The majority of respondents indicated that their data management system is ‘useful’ or ‘very useful’ during the different transition phases in schools. However, 12 respondents found that receiving and interpreting information from feeder schools was ‘not very useful’ whilst eight were ‘not sure’ about its usefulness. This, perhaps, echoes earlier discussions about the difficulty of measuring the attainment of children with special needs by national curriculum levels.
We are an SEBD30 school. We receive very little information from primary schools due to the problems of the pupils we have.
The responses to this question are shown in Table 4.3.2.
Table 4.3.2 How useful do you consider your data management system to be at each of the following times? (number of respondents)
(n = 50) very useful useful not
sure not very
useful
not at all
useful
no response
Transitions between key stages within the school 11 23 5 3 2 6
Preparing and sending information to receiving schools (at the end of a key stage)
11 17 4 3 1 14
Receiving and interpreting information from feeder schools (at the end of a key stage)
5 13 8 12 1 11
Transitions at other times 6 24 6 3 1 10
Respondents were asked to tick one box per row (see Appendix 1) - so each row sums to 50.
In addition, respondents were asked to explain how they use data to support transitions within their schools and to support the transfer of pupils into their schools. Thirty-eight respondents gave examples of how the use of data supports the transition of pupils from one key stage to the next. Of these, the most frequently reported uses were sharing
30 social, emotional and behavioural difficulties
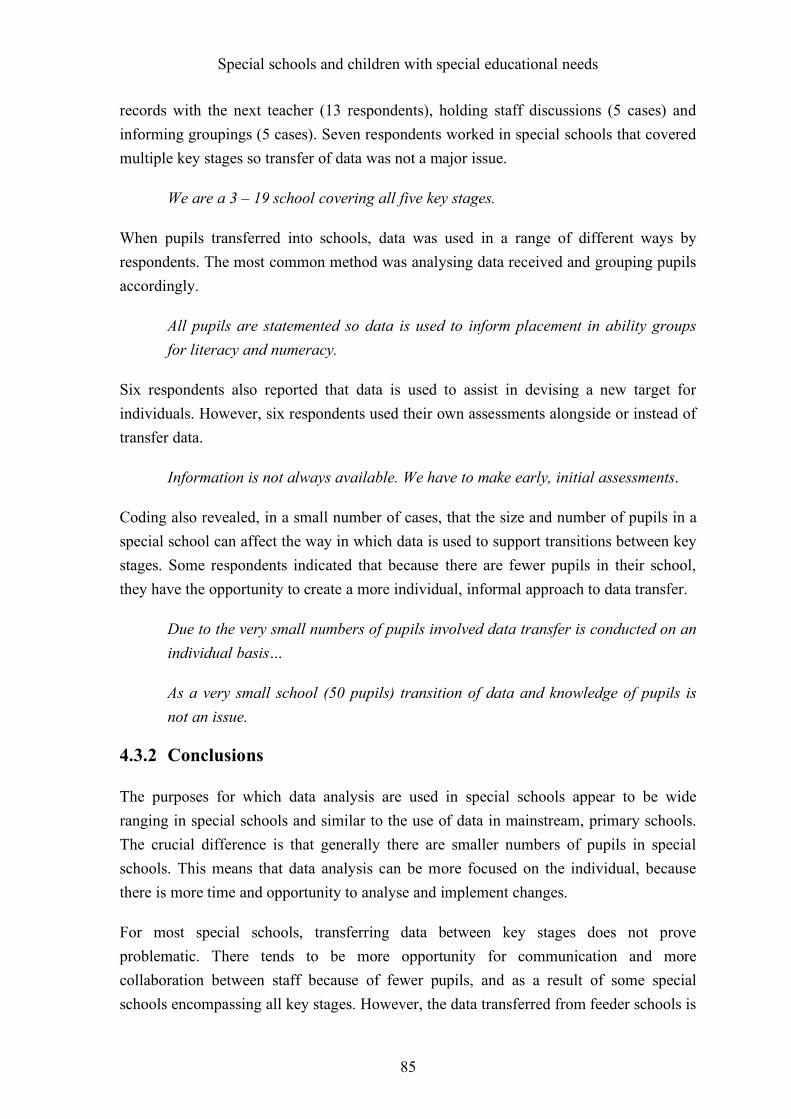
Special schools and children with special educational needs
85
records with the next teacher (13 respondents), holding staff discussions (5 cases) and informing groupings (5 cases). Seven respondents worked in special schools that covered multiple key stages so transfer of data was not a major issue.
We are a 3 – 19 school covering all five key stages.
When pupils transferred into schools, data was used in a range of different ways by respondents. The most common method was analysing data received and grouping pupils accordingly.
All pupils are statemented so data is used to inform placement in ability groups for literacy and numeracy.
Six respondents also reported that data is used to assist in devising a new target for individuals. However, six respondents used their own assessments alongside or instead of transfer data.
Information is not always available. We have to make early, initial assessments.
Coding also revealed, in a small number of cases, that the size and number of pupils in a special school can affect the way in which data is used to support transitions between key stages. Some respondents indicated that because there are fewer pupils in their school, they have the opportunity to create a more individual, informal approach to data transfer.
Due to the very small numbers of pupils involved data transfer is conducted on an individual basis…
As a very small school (50 pupils) transition of data and knowledge of pupils is not an issue.
4.3.2 Conclusions
The purposes for which data analysis are used in special schools appear to be wide ranging in special schools and similar to the use of data in mainstream, primary schools. The crucial difference is that generally there are smaller numbers of pupils in special schools. This means that data analysis can be more focused on the individual, because there is more time and opportunity to analyse and implement changes.
For most special schools, transferring data between key stages does not prove problematic. There tends to be more opportunity for communication and more collaboration between staff because of fewer pupils, and as a result of some special schools encompassing all key stages. However, the data transferred from feeder schools is

Special schools and children with special educational needs
86
generally considered less useful, as it was suggested that some mainstream schools do not seem to have an understanding of how to assess children with special educational needs, specifically using P-levels.
4.4 Impact on teaching and learning: the purposes for which data is being used at class or pupil level
In the previous section, the purposes for which data are perceived to be most useful were reported. Section 4.4 addresses the various links between the use of data and the strategies or interventions that attempt to bring about improvements in pupils’ learning opportunities. In other words, to identify what special schools perceive to be ‘best practice’ in the effective use of data to improve learning.
4.4.1 Questionnaire and focus group findings
In an open question, questionnaire respondents were asked to describe the most common types of interventions or strategies employed by their school, where data analysis had highlighted issues to be addressed. A total of 102 examples were given by 39 respondents. The most common intervention (16 cases) highlighted by the use of data was to identify issues that needed a whole school approach, for example, behavioural difficulties. This was exemplified by a focus group participant, who implemented a behaviour management scheme in his/her school in order to locate potential triggers to behaviour difficulties and then to attempt to solve them:
What we did was track who, what, when and where and what it does is allows you to identify if and why your behaviour management programme isn’t working. For example, we had a child that, everyone says well we don’t know why it happens…one child we found the trigger was always that point at which everything changed, breaks, home, lunchtimes…It is useful data, because then you can track when the behaviour happens, you can really see.
Other commonly mentioned interventions included reviewing and making changes to the teaching programme for an individual or cohort (13 cases), for example:
Different approach e.g. greater use of symbols in literacy.
Review of planning and teaching methods.
Providing extra support for the individual through booster groups, or one to one support was also mentioned by 11 respondents. In contrast to the primary school sample, there was little reported use of literacy, numeracy and other curriculum strategies as a method

Special schools and children with special educational needs
87
of intervention in special schools. However, the quality of school staff and teachers and the provision of appropriate training was an important issue mentioned by nine respondents, for example:
Training for teachers in specific aspects of assessment, particularly related to pupils with PMLD.
Table 4.4.1 shows the coded responses to this question in order of frequency. Table 4.4.1 Interventions/ strategies employed by special schools (number of
respondents)
Role (n = 50) Number of respondents
School approach to a specific area e.g. attendance / behaviour etc 16
Review of/changes made to teaching programme or curriculum 13
Booster groups/one to one support/extra support 11
Inform training needs for staff 9
Amending/delivering of IEPs 7
Planning targets 5
Lesson planning/curriculum planning 5
Close monitoring of pupils 5
Other (less frequent) comments 31
More than one answer could be given so the number of respondents does not sum to 50.
4.4.2 Conclusions
Interventions in special schools focussed more closely on individuals rather than groups or cohorts, as may be the case in mainstream schools. However, whole school approaches were also common, illustrating the close collaboration and communication between staff in special schools when tackling issues that can be particular barriers to learning.
As in mainstream, the power of data is to provoke dialogue and self evaluation that can lead to more informed strategies to support pupils’ learning.

Special schools and children with special educational needs
88
4.5 Dissemination and sharing of data
A further consideration within this study, was to examine the perception of respondents as to the extent to which different members of staff engage with the data available. In other words, who uses the data, what is the level of usage, and how is the data shared within the school and with other stakeholders such as governors and parents.
4.5.1 Questionnaire and focus group findings
Question 6a asked respondents to indicate which members of staff use data analysis to inform teaching and learning, and to provide an indication of their typical usage. Responses indicated that head teachers, deputy/assistant head teachers and classroom teachers were the most frequent users of data analysis to inform teaching and learning. As the question focused on the use of data to inform teaching and learning it is possible that the overall usage of administrative support staff may be underrepresented. The usage indicated here is that perceived to impact on learning.
The results for this question are presented in Table 4.5.1.
Table 4.5.1 Usage of data in special schools (number of respondents)
Role (n = 50) n1 frequently2 sometimes2 rarely2 no response2
Head teacher 45 33 11 - 1
Deputy/ assistant headteacher 45 33 9 1 2
Class teachers 41 26 12 - 3
Teaching assistants 27 11 10 6 -
Head of Dept/subject 26 19 7 - -
Assessment co-ordinator 24 20 4 - -
Head of year/ key stage 23 18 5 - -
Administrative support staff 19 6 8 4 1
Other (e.g. therapists, subject co-ordinators) 8 1 2 1 4
No response 4 - - - - 1 More than one answer could be given so the number of respondents does not sum to 50. 2 The number of those who reported using the data.

Special schools and children with special educational needs
89
In addition to the level of usage in their schools, respondents were also asked to indicate the different ways in which information was disseminated to colleagues and other stakeholders. This gave a further measure of the level of awareness of the information generated by data analysis in their schools (Question 6b). Almost all special school respondents indicated sharing information with the SMT, teaching staff and governors. Thirty-six schools hold meetings with class teachers to discuss data and 35 use training days to look at data outcomes. Thirty-three special schools provide presentations or written information regarding data analysis to parents whilst 11 do the same for pupils. In percentage terms, the number of special schools sharing information with pupils is only slightly lower than in mainstream primary schools. It suggests that there is a equally strong commitment to giving feedback to pupils and actively involving them in their own learning. The responses to this question are shown in Table 4.5.2.
Table 4.5.2 Dissemination of data in primary schools (number of respondents)
(n = 50) Number of respondents
Presentations/ written information to teaching staff 44
Presentations/ written information to governors 44
Presentations/ written information to SMT 42
Meetings between class teachers 36
Use of training days (e.g. INSET) 35
Presentations/ written information to parents 33
Presentations/ written information to pupils 11
Other (e.g. LEA review with Link advisors) 4
No response 3
More than one answer could be given so the number of respondents does not sum to 50.
4.5.2 Conclusions
There appears to be a more frequent usage of data by class teachers in special schools in comparison to mainstream schools. This could be linked to issues discussed earlier, where the amount of time available as a result of smaller numbers of pupils makes special school class teachers more likely to use data directly. It is also probable that the type of individual pupil data recorded in special schools is more detailed and qualitative rather

Special schools and children with special educational needs
90
than purely numerical information, therefore inspiring a high level of engagement and willingness to share information between staff.
4.6 Challenges to the use of data
Another important issue addressed both in the questionnaire and the focus groups was to ascertain what respondents perceive to be the main barriers or challenges facing schools in making effective use of data and data management tools and systems.
4.6.1 Questionnaire and focus group findings
An open question gave respondents the opportunity to describe what they perceived to be the challenges affecting effective data use. As before, comments were coded in order to quantify the different types of response to this question. Some respondents gave very specific detailed comments whereas others gave only general indications of the nature of the challenges facing schools. For special schools the majority of responses concerned issues relating to the data available to them.
Table 4.6.1 Challenges to the use of data in special schools (number of respondents)
(n = 50) Number of respondents
System doesn’t accommodate complex individual needs 18
Lack of comparability/unable to deduce trends 11
System too academic/focus on tests 5
Unable to compare data year on year 5
Other (less frequent) comments 22
No response 10
More than one answer could be given so the number of respondents does not sum to 50.
The most frequently cited challenge or barrier to improving learning through the use of data for special schools was that some systems and data do not accommodate the complex needs of individual pupils. Some schools focused on the lack of sensitive level descriptors in the national curriculum, which can make assessments meaningless for their children.
Students…have very small, incremental steps in progress. NC descriptors are not sensitive enough and most data systems are built around this.

Special schools and children with special educational needs
91
Nationally the steps within NC levels are too large to recognise the progress of our SEN pupils.
The P scales system, mentioned in section 4.2, is the current main method of assessing children with special educational needs. However, representatives from special schools in the focus groups mentioned the need for moderation of the P-level descriptors to ensure consistency of assessment across different schools.
What we found was that P-level assessment in mainstream schools didn’t match P-level assessment within special schools.
[In the national curriculum] there is a body of evidence – I don’t have a body of evidence at all so how can you target set for children with SEN.
Other respondents discussed the more academic focus of data systems, when students in special schools necessitate a more individual or holistic approach because of the diversity and range of needs.
Data has to be individual given hugely variable difficulties and complexities of difficulty.
…not sufficiently finely tuned to enable us to measure progress…assessments are all based on normal development and many of our pupils do not follow that path.
We take a holistic approach and most systems only record the academic.
Another challenge mentioned by some respondents from the questionnaire and participants in the focus groups was the lack of comparability of achievement between special schools and mainstream or even between apparently similar special schools. Special schools are often focused on a specific special need or a range of special needs so there are very few schools nationally that experience the same problems or the same results. Some special schools commented on the lack of comparability both between schools, within schools and between cohorts, making it difficult to deduce trends or patterns that, in mainstream schools, can feed back into teaching. It was also suggested that lack of comparability can also have a negative impact upon value added data and target setting.
Due to it being a special school there is limited like-school data.
…we haven’t got a consensus about what we do…in actual fact how do we, even, within the LEA, compare ourselves… (focus group participant)

Special schools and children with special educational needs
92
Deducing trends was a particular problem for special schools with small numbers of pupils.
Numbers in cohort are very small, so difficult to draw meaningful conclusions as yet.
…because we have such small figures we can skew our results with one child…(focus group participant)
4.6.2 Conclusions
National performance indicators such as curriculum levels are of limited usefulness to special schools, considering the need for more detailed data on children with special educational needs. Consequently national comparisons that measure only curriculum levels often result in pupils in special schools appearing to have made little or no progress and thus fail to recognise the achievements of pupils and teachers. Some special schools would like to see more use of the P scales; if they were properly moderated it would enable them to show progress and also aid comparison between pupils in special schools and children in mainstream environments. However, for children with special educational needs it is still important to recognise the potential for achievement outside the boundaries of the P scales, so any system or analysis of data would still need to be flexible and malleable to individual needs.
4.7 Accountability or self evaluation
There is an unproven assumption that the provision of data will lead to improvements in school performance. In addition to examining the ways in which schools attempt to use the data at their disposal to improve learning, a further issue to be addressed was to explore what evidence schools have that attainment has increased as a result of promoting learning through the use of data. In other words do schools believe that the collection and feedback of data to schools is aiding them in the process of self-evaluation and self-improvement?
4.7.1 Questionnaire and focus group findings
In Question 4c respondents were asked to comment on the contribution that the use of pupil data has made to the school’s evaluation of its performance. The most frequent comment, made by 14 respondents, was that schools now have a clearer picture of different aspects of their school’s performance including their strengths and weaknesses. Although, as mentioned previously, some schools find it difficult to make direct

Special schools and children with special educational needs
93
comparisons with other special schools, this is clearly not the case for all, as illustrated by the following quote.
Reinforced what we already know and identified some issues related to staff knowledge and understanding. Allowed us to compare our performance with similar schools and inform future school improvement work.
Nine respondents made general claims that using data had improved and contributed to the schools’ self-evaluation and the same number reported that the main contribution was in respect of informing planning. These results echo similar findings in the primary school sample.
Pupil data has enabled us to examine trends in year cohorts. We are also able to identify the needs and performance of looked after children, pupils with specific learning difficulties and pupils with ADHD.
What it is useful [for] is raising awareness of teachers of the concept of a level of attainment and a progress…we need teachers to discuss – why did this child appear to make progress this year. That is extremely valuable as long as teachers can trust the school they are in and not be blamed for this child not making progress. (focus group)
Table 4.7.1 gives a summary of the responses to this question.

Special schools and children with special educational needs
94
Table 4.7.1 Contribution of the use of pupil data to performance evaluation (number of respondents)
n = 50 Number of respondents
Description of effect on school Gives clear picture of school/dept performance and achievement. Helps to identify strengths and weakness/patterns and trends.
14
Informing planning and/or school/dept improvement 9 Better understanding of data has led to better teaching and learning/accountable teachers/ changing expectations of teachers
4
Enabled comparisons e.g. nationally, locally, within school 3 Staff have better understanding of data 1 Sharing information with others – sharing achievements and weaknesses (e.g. governors, parents)
1
General Claims General claims of improvement/contribution to school 9 Difficult to evaluate/developing/starting point 4 Data assisting with raising achievement/setting targets Easier to monitor/reflect and maintain/raise/progress standards 8 Easier to identify pupils’ achievements and to set targets 6 No response 9
More than one answer could be given so the number of respondents does not sum to 50.
Q7a asked respondents for their overall perception as to the extent to which the use of data management tools improves pupil learning. Q7b then asked how they assess the effectiveness of their use of data in improving teaching and learning. Finally respondents were asked to indicate their agreement with a number of positive and negative statements about the use of data to obtain some measure of their overall attitude towards the impact of data on teaching and learning.
The extent to which respondents considered the use of data management tools improves pupil learning was measured on a five point scale from ‘to a great extent’ to ‘not at all’. Twenty-four respondents indicated that the use of data improves pupil learning to some extent within their school, and a further 12 that it improves learning ‘to a great extent’.
Respondents were asked to indicate the ways in which their schools chose to assess the effectiveness of their data management in improving learning. The vast majority of respondents (46 cases) reported that they review each pupil’s achievements against targets set and collect relevant examples of pupils’ work to demonstrate progress in learning. A similar number record the termly progress for each pupil and review summative teacher

Special schools and children with special educational needs
95
assessments over time. The least employed methods of assessing effectiveness were comparisons of achievement with similar local schools and similar schools nationally, the issues associated with these statements have been discussed earlier.
Table 4.7.2 gives a summary of responses to this question ranked in order of frequency.
Table 4.7.2 Assessing the effectiveness of data management in improving pupil learning (number of respondents)
(n = 50) Number of respondents
Review each pupil’s achievements in comparison with targets set 46 Collect relevant examples of pupils’ work to demonstrate progress 46 Record each pupil’s progress in learning each term 44 Review summative teacher assessment outcomes over time 42 Collect anecdotal evidence of progress in learning from teachers 31 Review end of key stage test results/examinations over time 23 Compare achievements in year groups with those of previous cohorts 17 Compare achievement with that in similar schools nationally 16 Compare achievement with that in similar local schools 7 Other 6 No response 3
More than one answer could be given so the number of respondents does not sum to 50.
Attitudes towards the use of data were explored by means of Question 7c, a series of statements - positive, negative and neutral, to which respondents were asked to indicate the extent of their agreement with the sentiments expressed. The results of this question are presented in Table 4.7.3.

Special schools and children with special educational needs
96
Table 4.7.3 Q7c – Please indicate the extent of your agreement with the following statements (number of respondents)
(n = 50) strongly agree agree
neither agree nor
disagree
disagree strongly disagree
no response
Analysing data has had a positive impact on learning outcomes in my school
13 22 10 1 1 3
Data analysis has helped to identify areas of teaching/learning that need to be addressed in this school
10 27 7 3 - 3
The analysis of data makes it easy to discuss the performance of this school with members of staff
9 26 10 1 1 3
Data analysis has helped to identify training needs in my school 9 21 13 4 - 3
Data analysis has helped to identify pupils who are under-performing 9 25 9 3 - 4
Data management tools simplify the process of setting school targets 6 30 10 1 - 3
More training is needed to help staff interpret and use the information generated
6 27 6 8 - 3
I do not feel the potential for using data is being fully realised in this school
4 18 10 11 4 3
The use of data is supporting assessment for learning 4 29 11 2 1 3
It is difficult to translate the information generated into curriculum planning
2 5 20 19 1 3
Data are used by staff at all levels within this school 2 23 12 10 - 3
Data analysis tells us nothing that we don’t already know. 2 5 8 20 12 3
Classroom teachers have no time to look at the information generated by our data management system.
1 2 11 30 3 3
The analysis of data does not improve teaching and learning - 2 4 25 16 3
Respondents were asked to tick one box per row (see Appendix 1) - so each row sums to 50.
The majority of special school respondents indicated agreement with almost all of the positive statements about the use of data. The statements with which the highest number

Special schools and children with special educational needs
97
of respondents either ‘agree’ or ‘strongly agree’ were that data has helped to identify areas of teaching that need to be addressed, helped to set school targets, had a positive impact on learning outcomes and made it easier to talk to staff about school performance. However, 22 respondents agreed that the potential for using data has not been realised in their school and 33 agreed that more needs to be done to help staff understand and be able to interpret the information that is produced by data analysis.
4.7.2 Conclusions
Although responses both to the questionnaire and in the focus groups show a strong commitment within special schools to engaging with data and using it to improve learning opportunities, it is clear that special schools are unable to use data in the same way as colleagues in mainstream. There is evidence that trying to match performance against measures that do not accommodate the different needs of special schools is causing considerable pressures in terms of accountability. However, special schools in general do feel that using data can promote learning in a positive and effective way. Although in order for this to happen, they have had to amend, create and develop their own systems to accommodate the wide spectrum of special educational needs.
4.8 Summary of findings and recommendations
Mainstream data management tools and systems are of limited use within special schools and for children with special educational needs because of their focus on national curriculum levels.
Schools with children with special educational needs require systems that:
• allow the input of detailed information
• show progress in much smaller steps than NC sub-levels (e.g. P scales or more specialised descriptors)
• acknowledge the acquisition of skills
• acknowledge aspects of individual progress other than purely academic
• facilitate meaningful comparisons across special and mainstream schools (e.g. moderation of the P scales system).

Secondary schools
98
5 Secondary school findings
Introduction
The following section reports the findings of the study in relation to the use of data in secondary schools. As well as quantitative data, it includes comments from the questionnaire survey and a summary of the focus group discussions. As the number of respondents involved is relatively small, the actual numbers of responding teachers has been reported in places. Where percentages are quoted, these are usually percentages of respondents. However, on occasion, percentages of a sub-sample have been quoted. This has been noted when applicable.
Three secondary questionnaires were sent to each school, to be completed by the heads of the following departments: English, mathematics and science. A total of 292 questionnaires were received from secondary schools, of which 29 were completed on-line. One hundred and five science questionnaires were completed, 103 mathematics, and 84 English. Table 5.1 below shows the profile of respondents as indicated by their responses to the first question which asked them to give their current professional role(s). Table 5.1 Questionnaire respondents’ roles within the school (percentage of
respondents)
Role (n = 292) Per cent of respondents
Head of department (English, science or mathematics) 96.9
Deputy or Assistant headteacher 9.2
Other 3.4
Head of year or key stage 2.7
Head teacher -
No response 1.0
More than one answer could be given so percentages do not sum to 100.

Secondary schools
99
5.1 Key findings
The key findings in respect of secondary schools are summarised in relation to the four aims of the research.
5.1.1 How is data used to promote learning in secondary schools in England?
The uses of data reported by secondary schools represent approaches at both school and individual department level. The most frequently cited uses for data by heads of departments in secondary schools were:
• tracking and discussing pupil progress, and target setting
• setting and grouping
• identifying pupil underachievement
• monitoring departmental performance and improvement
• informing teaching and learning
• providing feedback to LEA, parents, governors, teachers, SMT.
Less frequently mentioned, but of importance to several teachers within the focus groups were purposes such as accountability, identifying staff training needs, motivating students and the use of data in transition.
Specific uses of data to promote learning in their subject were identified by asking heads of departments to describe the most common types of interventions or strategies used by them or their staff, where data analysis had highlighted issues to be addressed. The most frequently reported interventions in secondary schools were:
• providing additional support (one-to-one, booster groups, etc)
• informing and reviewing settings/ teacher groups
• informing planning and revision; tailoring teaching levels or the curriculum
• involving parents, e.g. through home-school partnerships
• mentoring and peer mentoring
• target-setting.

Secondary schools
100
5.1.2 Good practice in the effective use of data to promote learning
The survey looked at the sources of data and the tools and systems used to analyse that data within schools. Perceptions of ‘good practice’ arose from the uses to which data was put rather than from the use of particular systems or tools. A recurrent theme was that data only becomes effective if it stimulates questions, discussion and action which lead to learning being taken forward.
Overall, the position for secondary schools was similar to that in other schools. Teachers reported that good practice in the use of data was supported or facilitated by:
• meaningful dialogue
• data management systems that:
– are easy to use
– produce outcomes that are easy to interpret
– allow flexibility of input
– have compatible school management and assessment components
– offer comprehensive training and support
– are accessible to staff
– encourage engagement and ownership.
Additionally, several secondary teachers reported wanting not only to be able to easily import data, but also to be able to export data easily from one system to another. Others reported that good practice in data use was facilitated by having the flexibility to easily amend data once in the system.
As noted earlier, meaningful discussions of data amongst staff tended to occur in schools where one person took a proactive role in using data to move learning forward, either by focussing on specific areas or supporting colleagues in the interpretation of outcomes. In secondary schools, a particular use was for data to form the focus of discussion between teachers and pupils, in order to motivate students and encourage them to take ownership of their own learning.
In secondary schools, Excel spreadsheets were most often cited as impacting on teaching and learning ‘to a great extent’. School-devised data management systems were also

Secondary schools
101
commonly used and well-rated. The OFSTED Performance and Assessment Reports (PANDA) were the most commonly used packages in secondary schools, but not the most highly rated.
5.1.3 Challenges to using data in teaching and learning
Some of the main challenges to the effective use of data for secondary schools were similar to those for primary schools. However, some challenges were more frequently mentioned by secondary teachers, and the order of priority was different between sectors. The main concerns for secondary schools, in order of frequency were:
• the quality and timeliness of data: many considered the data either unreliable or too late to be of use
• lack of time, particularly time to update and analyse the data
• the narrowness of focus of the data available, particularly in terms of its emphasis on academic achievement at the expense of broader measures of learning and progress
• resourcing issues, especially in terms of having staff available to input data
• the possibility of data being misinterpreted or misunderstood.
A common theme within the secondary focus groups was that concerns exist about the number of pupils for whom each department is responsible and the amount of potential data that exists for each pupil. Quantity of data was seen as a particular challenge for secondary teachers and a potentially limiting factor in its use.
Further challenges raised in focus groups included:
• staff unfamiliarity with the system and the associated need for training or support
• the perception that continuing to use an imperfect system is easier than finding a better one to replace it
• the perception of pressure to meet targets that was seen to mitigate against good use of data
• knowing how to use data to improve learning.

Secondary schools
102
5.1.4 Recommendations to support school staff in making effective use of data to promote learning, including the future development of the Pupil Achievement Tracker
In order to make more effective use of data, the requirements of secondary schools, as perceived by respondents, are similar to those requested by primary respondents. Many secondary teachers reported wanting the following:
• systems that are simple to use and which come with training and support
• data that is meaningful and detailed, yet manageable
• useful graphics
• the ability to transfer data electronically between systems
• timely data
A common theme in the focus groups was time and resourcing (reflecting the fact that time and resources were mentioned frequently as a concern in response to the questionnaire). Most focus group participants wanted dedicated support staff time to be available for inputting of data, with teachers taking an analytical role only. A minority, however, felt that they were best placed to input data, since they know the students best and can gain insights into the data whilst inputting.
Other requests related to the selection of a suitable system. Those teachers who commented on this requested the following:
• a system specific to the department’s or school’s needs
• a choice of system, rather than a recommended or prescribed system
• information and guidance on the systems available.
Some of the focus group participants reported wanting to be able to compare students across curriculum areas, in order to highlight and address any apparent anomalies in attainment. Others wanted a system that provided opportunities for pupil self-assessment. Several mentioned wanting training not only in the use of data, but also in its interpretation. This reflects the recognition that data in itself is insufficient; that it is the interpretation and subsequent use of data that can impact positively on teaching and learning, rather than the data itself.

Secondary schools
103
Only a small number of secondary teachers (43, or 15 per cent) had used the Pupil Achievement Tracker. The features they perceived as most useful were that PAT allowed them to do the following:
• to analyse national or optional test papers
• to produce clear charts of performance
• to highlight individual strengths or weaknesses in pupils, in the curriculum or in teaching
• to track individuals or groups of pupils.
Potential improvements were listed by 29 teachers. The following were among the requests they made:
• improved and simplified instructions
• making PAT available earlier in the year
• better tracking and graphing facilities
• increased relevance to key stage 4
• more training
• increased compatibility with existing school systems.
A summary of recommendations across primary schools, special schools and secondary schools is presented in Section 6.
5.2 Data sources and systems
An important part of the evidence gathering phase of the study was to establish which sources of data and data tools are used currently in schools, which of these are perceived to make a difference to teaching and learning, and why. Where possible we have tried to report data sources separately from the tools and systems that are used to manipulate and analyse the data, but inevitably there is some overlap involved. The manipulation of data can itself produce further sources of data, resulting in some assessment systems being viewed by schools as sources of data rather than simply tools.

Secondary schools
104
5.2.1 Questionnaire findings
Question 2a asked respondents to indicate the extent to which various sources of performance data make a difference to teaching and learning. Opinions about the extent to which sources of data made a difference to the teaching and learning of subjects differed between each data source. Those rated most positively were formal assessment data (95 per cent consider this data makes a difference ‘to a great extent’ or ‘to some extent’), national curriculum school-level test data (91 per cent), school-level data relating to GCSEs and/or GNVQs (88 per cent), prior attainment data (88 per cent), teacher assessment levels (85 per cent) and commercial test data (75 per cent). national curriculum test data (at the national or local authority levels) was deemed useful by just over two thirds, although around a quarter of teachers thought these types of data were useful ‘to a limited extent’ only. Table 5.2.1 summarises these outcomes.
There were some apparent differences between responses from teachers of different subjects. In most cases, positive ratings of the impact of data use on learning were given more frequently by English teachers. Positive ratings from science teachers were typically the next most frequent, with mathematics teachers being least positive. However, in many cases the differences were small and are unlikely to be significant. One exception where notable differences in the distribution of response appeared was in the use of school-level national curriculum test data. In this case, mathematics teachers were the most positive about the impact of this data on teaching and learning (95 per cent considering that this data made a difference ‘to a great extent’ or ‘to some extent’) and English teachers the least positive (87 per cent).
The least used types of data in secondary schools were optional test data (at various levels), and P scales. The percentages not using these forms of data ranged from 42 per cent to 47 per cent overall. The breakdown of usage by subject revealed that science teachers were less likely than English and mathematics teachers to use P scales. Just over half of science teachers (55 per cent) did not use them, compared with 35 and 50 per cent respectively of English and mathematics teachers. Where P scales were used, English teachers were more likely than their counterparts in the science or mathematics departments to report that use of the data impacted on learning ‘to a great extent’ or ‘to some extent’. The data do not reveal why this might be so. However, it is possible that weaknesses in English and mathematics are more likely than weaknesses in science to attract additional cross-subject support for pupils, underpinning as they do learning in many other subjects. This may be why P scales are more widely used in these subjects.

Secondary schools
105
Space was provided for teachers to list other sources of data that they used. Responses were received from 52 teachers, each of whom listed at least one other source of data. Many of these responses listed data management systems, such as CMIS assessments, MidYIS and YELLIS. Others listed data sources such as school-devised tests, teacher observations, assessment for learning and sampling or moderation. These were generally rated as impacting on teaching and learning to a great extent or to some extent.
Table 5.2.1 The extent to which sources of performance data make a difference to teaching and learning (percentage of respondents)
(n = 292) to a
great extent
to some extent
to a limited extent
not at all
not used in
this school
no response
Formal assessments 67.1 27.7 3.4 - 0.3 1.4
NC tests – school data 62.3 28.8 7.2 0.3 0.7 0.7
GCSE (school) 59.2 29.1 2.1 1.4 5.5 2.7
School entry/prior attainment data 51.7 36.0 9.6 1.0 0.3 1.4
Teacher assessment NC levels 48.3 36.3 13.0 1.0 0.3 1.0
Commercial tests (e.g. CATs) 40.8 34.2 11.0 3.8 8.2 2.1
NC tests – national data 26.0 41.4 26.0 4.8 0.3 1.4
NC tests – LEA data 25.7 42.5 23.6 5.8 1.0 1.4
GCSE (national) 25.7 39.7 18.2 5.8 6.2 4.5
GCSE (LEA) 24.0 40.4 17.5 7.9 6.2 4.1
QCA optional tests – school data 19.2 12.0 9.9 13.4 41.8 3.8
P Scales 2.1 6.8 15.4 22.3 47.3 6.2
QCA optional tests – national data 1.7 10.6 14.0 22.9 46.9 3.8
QCA optional tests – LEA data 1.4 11.6 12.0 23.6 46.9 4.5
Respondents were asked to tick one box per row (see Appendix 1) - so each row sums to 100.
Further analysis31 was used to try and identify any relationship between the performance of pupils in respondents’ departments and the extent to which those respondents
31 Multiple regression analysis was used for this purpose. Performance was defined in two different ways: KS3 performance (standardised and placed onto a single scale) in the subject taught by the respondent, i.e. mathematics, science or English (derived from the 2003 National Pupil Database); and a measure of the school’s overall KS2 to KS3 value-added (DfES). The measure of the extent to which schools perceive data sources to make a difference to learning was derived by giving a score of four to each ‘to a great extent’ rating, a score of three to a rating of ‘to some extent’ and so on.

Secondary schools
106
perceived that sources of data make a difference to teaching and learning. A statistically significant difference was found in relation to key stage 3 performance but not in respect of the value added measure. Lower performing schools (KS3) tended to rate sources of performance data as making a greater difference to teaching and learning than did higher performing schools.
A similar analysis was carried out using the same two measures of performance in relation to the total number of data sources given a rating by the respondent (i.e. the number of data sources identified as being used in that department). On this occasion the higher the value added measure of the department, the fewer sources of data were used but there was no significant difference in relation to key stage 3 performance. Although not consistent across both measures, this finding suggests that departments adding less value may be using more sources of data as a means to self-evaluation and self-improvement.
Question 2b was similar to Question 2a but focused on sources of additional data such as information on pupil attendance and free school meals. These types of data were more widely used than those listed in Question 2a but, once again, some were seen to be more useful than others in terms of making a difference to teaching and learning (see Table 5.2.2). The two sources most widely identified as making a difference to at least some extent were data about special educational needs, and gifted and talented pupils. Conversely, data about free school meals and exclusions were seen by a majority to impact not at all, or only to a limited extent, on teaching and learning.
Findings related to data about pupils’ ethnic groups and data about pupils learning English as an additional language were less clear-cut, with replies spread across the response categories. Approximately a quarter of respondents thought that data about ethnicity impacted to at least some extent on teaching and learning, while almost a third thought it had a limited impact. A further third thought it had no impact at all. Responses about English as an additional language were more evenly balanced across all five response categories. These findings may reflect the uneven distribution of cultural diversity in England.
Ten ‘other’ responses were listed by a total of seven respondents. Relevant responses related to health and medical data, as well as to data from social services.

Secondary schools
107
Table 5.2.2 The extent to which sources of additional data make a difference to teaching and learning (percentage of respondents)
(n = 292) to a
great extent
to some extent
to a limited extent
not at all
not used in
this school
no response
Data on pupils with special educational needs 55.1 36.6 6.8 0.7 0.3 0.3
Data on gifted and talented pupils 38.7 45.2 13.4 1.4 1.0 0.3
Data on pupils learning English as an additional language
12.7 37.1 26.0 15.1 17.8 1.4
Pupil attendance data 10.6 34.2 34.6 16.8 2.4 1.4
Staff turnover data 8.9 11.0 20.9 44.9 13.0 1.4
Data on pupils’ ethnic groups 4.1 22.3 31.5 31.8 9.6 0.7
Data on exclusions 2.7 13.4 34.9 42.1 6.2 0.7
Free school meals data 2.4 12.7 34.2 46.6 3.4 0.7
Respondents were asked to tick one box per row (see Appendix 1) - so each row sums to 100.
The next section in the questionnaire addressed the types of management tools and systems used in secondary schools. As well as asking teachers to quantify the extent to which such tools make a difference to teaching and learning, it also asked them to describe school-devised systems (where used), the main advantages or features of their most useful data management tool, and why they used their particular system(s) in preference to others that are available.
Question 3a asked respondents to indicate which of a list of management tools and systems were used in their school. They were also asked to rate the extent to which each tool they used makes a difference to teaching and learning. The most frequently used system was the Performance and Assessment Report (PANDA), used by 92 per cent of respondents, the majority of whom found it made a great difference or some difference to teaching and learning (see Table 5.2.3).
It is worth bearing in mind that, in the secondary school survey, each school could submit up to three questionnaires (one from each of the targeted departments). Thus, while it is true to say, for example, that 92 per cent of teachers who responded were using PANDA, this does not necessarily mean that 92 per cent of schools involved in the survey were using it.

Secondary schools
108
Table 5.2.3 Data management tools/systems used in the school and the extent to which their use makes a difference to teaching and learning
(n = 292) Used in this school?
to a great
extent3
to some
extent3
to a limited extent3
not at
all3
no response3
%1 n2 n n n n n Ofsted Performance and Assessment Reports (PANDA) 92.1 269 58 153 46 3 9
Excel spreadsheets 66.1 193 131 49 1 1 11
Fischer Family Trust 62.7 183 53 75 42 5 8
SIMS net 58.9 172 49 64 38 10 11
School-devised system 40.8 119 77 31 2 - 9
YELLIS 28.8 84 28 41 9 2 4
Pupil Achievement Tracker (PAT) 22.3 65 10 30 16 8 1
MidYIS 18.8 55 20 23 8 3 1
LEA system 12.0 35 13 15 5 2 -
PIVATS 4.8 14 2 3 7 2 -
GOAL SC1 3.4 10 2 4 - 3 1
TargSATS 1.7 5 2 3 - - -
Integris (RM) 1.0 3 - 1 1 1 -
Target Tracker 1.0 3 1 2 - - -
Assess IT 0.7 2 - - - 1 1
Phoenix e1 0.3 1 - - - 1 -
Equals 0.3 1 - - - 1 -
B. Track 0.3 1 - - - 1 -
Other (LEA) 1.7 5 2 3 - - -
Other (MIS) 6.2 18 12 5 1 - -
No response 1.1 14 - - - - - 1Percentage of respondents - more than one answer could be given so percentages do not sum to 100. 2 Number of respondents - more than one answer could be given so numbers do not sum to 292. 3 The number of those who reported using the data.
Other commonly used systems were the Fischer Family Trust analysis (FFT), Excel spreadsheets and SIMS.net, each used by well over half of the sample. Of these, the Excel spreadsheets were believed by most respondents to impact positively on teaching and learning, with 93 per cent of those using them considering that they impacted to a great extent or to some extent. The comparable figures for FFT and SIMS.net were 70 per cent and 66 per cent respectively. Although the PANDA is the most widely used of the

Secondary schools
109
systems listed, it does not receive the same level of acclaim as the Excel spreadsheets: 79 per cent of those who had used PANDA rated it as making a difference to teaching and learning, 14 percentage points lower than the comparable frequency for Excel spreadsheets.
It also emerged that several systems were rated highly, despite being used by a relatively small number of teachers. This was true for the Pupil Achievement Tracker (PAT), LEA-devised systems, MidYIS and YELLIS. For example, while relatively few respondents (22 per cent) had used Pupil Achievement Tracker, it was rated highly by almost two thirds of them: 62 per cent of those who had used PAT said that it made a difference to teaching and learning. Such percentages should be interpreted cautiously, however, as the numbers of respondents using each of these systems was low, ranging from 35 to 84 teachers. There were some slight regional differences in the use of some tools/systems. For example, CEM tools (YELLIS and MidYIS) were more frequently used in the Midlands than in the North or South of England; but such differences were not statistically significant and so may not be replicated in another sample.
Respondents were also given the opportunity to name other systems they used: those devised by an LEA other than their own, and any other management information systems (MIS). Five responses were given about LEA systems. One reiterated that Fischer Family Trust analysis was used, while another elaborated on use of a tool given in the tick list. Other systems named were Assessment Manager 6, Ansat, and key stage 3 exam analysis carried out by an LEA. These were rated as useful in making a difference to teaching and learning to at least some extent.
Eighteen responses were obtained regarding other MIS systems; of these 18, three named Assessment Manager 6, two listed Trackmaster, one gave Brom Com, seven respondents gave details of their own software and five gave other responses. All but one of these systems were rated as making a difference to teaching and learning to at least some extent.
Breaking down responses according to the respondent’s subject area showed few differences. The most noticeable difference was that English teachers used a wider range of data tools than did their mathematics and science peers. However, in all cases where additional tools were used by English teachers, these were named by only one or two respondents. There were few differences in the extent to which teachers rated tools as impacting greatly or to some extent on teaching and learning. Some exceptions exist, however. It appeared that science teachers were more likely than mathematics teachers to rate PANDA highly in this regard. Mathematics teachers, in turn, were more likely to rate it highly than were English teachers. Similarly, science teachers were more likely than

Secondary schools
110
others to rate Fischer Family Trust analysis and SIMS.net highly. There were no discernible differences between English and mathematics teachers in these respects. It should be borne in mind, however, that in all of these cases, numbers in each subcategory are small, so the apparent differences may, in fact, not be statistically significant.
Question 3b asked respondents to describe their school devised systems (if any). There were 299 responses from 151 teachers, just over half of the sample. The most frequently cited form of school-devised systems was a system that allowed the input of internal data. This was mentioned by 15 per cent of respondents. This was closely followed by systems that are capable of tracking individuals (13 per cent), systems that, like Excel, give graphical representations of progress (11 per cent) and systems that track learning and attainment (11 per cent). Heads of English departments mention systems for tracking individuals more frequently than input of data, the latter being mentioned more frequently by heads of maths and science.
Respondents were then asked which of the data management tools used in their schools they considered the most useful for teaching and learning in their subject. Thirteen different types of tool were named in response to this question, some more frequently than others. In line with earlier answers to Question 3a, the most commonly named tools in response to this question were the school’s or department’s own system (29 per cent), Excel spreadsheets (23 per cent), and Fischer Family Trust analysis (12 per cent).
Teachers of English, mathematics and science were agreed on which were the three most useful tools. However, they ranked them in different orders. For English teachers, the school’s own system was more popular than Fischer Family Trust analysis (FFT), with Excel spreadsheets being ranked third. For teachers of mathematics, Excel spreadsheets were most popular, with the school’s own system a very close second and FFT ranked third. Finally, for science teachers, the school’s own system was deemed best, with Excel spreadsheets second and FFT third. However, it is worth bearing in mind that there may be some overlap between what teachers define as their own school system and what they define as an Excel spreadsheet.
Having established which was the most useful data management tool or system for each respondent, the questionnaire next asked respondents to indicate the main advantages of that tool. A list of possible advantages was given, with space for additional responses to be given. Teachers could tick as many options, of the ten available, as applied and add two further reasons. Responses were given by 255 teachers, 26 of whom added their own advantages; 1298 responses were obtained (see Table 5.2.4). These showed that the most popular feature by far was ease of use (71 per cent ticked this option). This was followed by ease of interpreting the information available and ease with which the teacher’s own

Secondary schools
111
data could be input. Also deemed important were that all the data needed by the department was on one system and that data was easily exportable. These options were all selected by more than half of the teachers in the sample.
Table 5.2.4 shows the responses to this question ranked in the order of the most frequently reported features.
Table 5.2.4 Advantages of useful data management tools or systems (percentage of respondents)
Role (n = 292) Per cent of respondents
Easy to use 70.5
Easy to interpret the information provided 64.4
Easy to input own data 58.9
All the analysis needed by my school is on one system 58.2
Data is easily exportable 55.5
Inexpensive system 42.5
Easy to input data from other sources 34.9
Provides information/reports to parents 29.1
Provides question/item level detail 16.4
Web-based system 5.1
Other 8.9
No response 12.7
More than one answer could be given so percentages do not sum to 100.
Science and mathematics teachers were more forthcoming on the main advantages of their systems than were English teachers. More of them gave responses to these items, and the average number of advantages described by each science teacher and mathematics teacher was higher than for English teachers. However, the ‘top five’ advantages were the same in each case.
Space was left for teachers to add other advantages. Comments were made by 26 teachers, most of them science or mathematics teachers. Only two English teachers commented. The two most commonly raised advantages (five respondents each) were that the systems were accessible for staff, with training available, and that they produced

Secondary schools
112
information or outcomes that were useful. In particular, respondents mentioned that their system allowed comparisons across curriculum areas, gave the pupils opportunities to assess themselves, or allowed other kinds of comparison. Other comments were that it enabled the setting of individual targets, was flexible and easy to amend, provided a more detailed analysis of pupil achievement and that it was simple to produce spreadsheets from the package. Each advantage was mentioned by between one and five respondents.
Finally, in this section of the questionnaire, respondents were invited to comment on why they preferred their data management tool over others. The most common comment was that the system was specific to the school or department’s needs (eight per cent gave this reply), closely followed (seven per cent) by the related fact that the system was accessible across the school or department (some teachers made both of these comments). Six per cent of teachers noted that they would like to change their system, but that it was too time consuming/problematic and/or that they were too used to the current system to do so. Some of their comments are given below:
[school-devised system] It collates/holds information/records relevant to pupils studying maths. Created and used to serve our needs.
Would prefer a more centralised system, but need more access/control than would be given.
Excel is on the school network so all the department have access.
We control the input and use our judgement based on pupil knowledge. Other systems contain inaccuracies and rely on computer-programmed judgements, which do not take into account pupil personalities personal problems.
I have to use the school system because I have no time to devise anything else. I want to use PAT but it won’t work on our system [SIMS.net/Assessment Manager]
Other comments were that the system was adaptable to the school’s needs, and was useful for tracking, for describing attainment and for reporting to parents. Several comments related to handling information: respondents noted that their system allowed lots of information to be imported into it and/or produced from it, that information was at an appropriate level of detail, and that it allowed information to be linked. Others, however, seemed to be using their system simply because it was recommended by their LEA, or because they had not found anything better that would suit their needs. Once again, fewer English teachers than mathematics or science teachers answered this question, but the type of comments being made by teachers in each subject was similar.
Secondary schools
113
In another section of the questionnaire (Question 8a) respondents were asked to indicate whether they had ever used the Pupil Achievement Tracker (PAT), a diagnostic tool developed by the DfES to aid school self-evaluation and individual pupil, class and whole school target setting. Of the 292 respondents, 43 (15 per cent) had used it, most in their current school and a handful in another school. Usage appeared to be higher among science teachers (21 teachers, 20 per cent) than among English or mathematics teachers (11 teachers in each case, 13 and 11 per cent respectively). The relationship between PAT usage and department performance was examined but no significant differences were found, either in relation to KS3 performance or KS2 to KS3 value-added.
These 43 users were then asked to comment on the most useful aspects of PAT (Question 8b) and the improvements they would like to see made (Question 8c). Comments on the most useful aspects were given by 36 of the teachers who were familiar with PAT. Most made only one comment. Useful aspects named by four or more respondents were the ability to analyse national test or optional test papers, to produce clear charts of performance, to highlight individual strengths or weaknesses in pupils or the curriculum or teaching, and to track individuals or groups of pupils.
Comments on potential improvements were given by 21 of the teachers who were familiar with PAT and they made 29 comments between them. The most common suggestions were to simplify the instructions or make them clearer (seven responses) and to make the system available to all staff and/or more accessible (five responses). Sample responses are shown below:
Simplify its use. Excel is much easier to use.
Graphs like the ones on the QCA diagnostic software. Graphs/reports produced on PAT go onto two pages. QCA software was on one and printed much clearer.
More training. Better access in school. Suggestions of areas to concentrate on at key stage 4.
These replies are consistent with the emphasis placed by respondents on ease of use of their systems when asked, in Question 3d, about the main advantages of their most useful data management tool.
Other suggestions included making PAT available earlier in the year in order to maximise its use, better tracking of individuals, improving the graphing facility, making it more relevant to key stage 4, providing more training and making it more compatible with existing school systems. Each of these suggestions was made by between one and three respondents.
Secondary schools
114
5.2.2 Focus groups
The secondary school focus groups largely reflected the findings of the questionnaire data. Participants indicated that a vast range of data sources and systems were used. One secondary participant described the data he worked with:
For us especially in maths, being statistically minded, we collect data on key stage 2 results of pupils coming into the school, although the major data that we use tends to be our own formal assessments that we do through the years. At key stage 3 we will do effectively a SATS test in November, January and March and then there is the summer exam in May. What we will do with that data is track - on Excel we keep a log of their test results through their school career, we will compare them with CATS predictors, and use it to compare with key stage 2. What we are particularly looking to do is use that information from year 8 onwards to help us set, as we don’t set in year 7 but we do thereafter, so we use that data to help get the sets as appropriately as possible. Also we use it to motivate our students to look for improvement. It’s part of their own internal target setting to actually set basically what we believe are hopefully agreed but sensible targets in terms of levels.
Others explained:
Basically what we get given is, all the girls will have target levels – and every term we do current grades and current levels for them and so every department. I am sort of collating the information that I am given from individual members of staff so we can actually see – what are their targets now; what they are meant to be achieving at the end of year 9 and 11.
All the testing is all done on all levels. The scheme that we use at the moment is the National Unit Framework Scheme, and basically they have questions which are at a certain level and then we use those levels in order to determine what they are achieving.
Similar levels of data were described by other teachers in the focus groups and were, mostly, regarded as having a positive impact on teaching and learning.
To a large extent the data sources incorporating termly internal or commercial tests, or teacher assessments, were used to track pupil progress towards their GCSE grades. Other positive uses for data were cited, but as one teacher expressed:

Secondary schools
115
The raw scores are useful for setting initially as they come in, …and [so is] the ability to dissect assessments to help learning and teaching. I can’t really disagree with any of those things, but it’s the tracking with me that is the most useful.
Another participant explained how data in his school was used for target setting:
Pupils have targets on exercise books so every subject is expected to give them a national curriculum level so each child knows what level they are working at and what they need to do to get them where they should be. Year 7 have year 7 targets, year 8 have their own year 8, year 9 have year 9 targets and KS4 have got their GCSE grade based on their SATS course. When we do border scheme, catalyst scheme, there are tests within that, levelled accordingly, so they get a level at the end of the topic test so they record that level. In upper school, from year 10 we use YELLIS and have done for a number of years although finance are telling us we have to stop soon. We find this incredibly useful. We use that internally to set departmental targets as well as individual youngsters having their targets from it and for most subjects it’s a good indicator particularly if you can put KS2 results on top. We tend not to use the teacher assessment levels for KS2 as a reliable measure, but the English, maths and science combined point scores we use quite a bit.
Only three participants in total had experience of the Pupil Achievement Tracker. When asked to relate their experiences, one English co-ordinator in a middle school said:
Yes we are very much going down that line, and know what impact it can make on personalised learning especially in English. The graphs that it can produce for a child’s profile for a reading paper I think are incredible. You can see where the child’s strengths and weaknesses are so instead of trying to guess I think they have problems with this type of question but I am not absolutely sure, there it is in black and white and you can then hone in and be more specific in the kinds of things you give that child to help them move forward. So therefore the Pupil [Achievement] Tracker has the potential to really impact teaching.
When asked how she came to know about the PAT she said:
We meet together a lot in our partnerships and the evidence has suggested that it is very useful and people have seen how useful it is. But I believe initially the LEA took the initiative and got it started.
In terms of introducing it to the school, she explained:

Secondary schools
116
The assessment co-ordinator is the first line of defence in getting to know how to use the system. They organise the input of the data for school and then that is fed down to the teachers and departments, and in our school we are going to set up a central computer where all staff can access information on any child.
Another participant said:
I don’t know how it got into our school, but the assistant head teacher who had responsibility for this used some of the Middle Leadership Conference time in the evening, and introduced it to all head of faculties and science co-ordinators, … that was 2 years ago and then last year all our laptops were up-dated and I have not looked at it since then. We had this one hour session and that’s it.
When asked what his impressions were, he said:
It looked overwhelming, I have 200 in each year group at key stage 4, I have 16 science sets and there is so much data on each individual pupil, it’s too much.
Another participant felt that familiarity made a difference, but expressed concern about data input:
I think it was overwhelming to begin with but with experience of using it there will be certain areas you will never touch and other areas you feel are useful you will use time after time, but it’s getting the data in there in the first place.
Focus group members showed some confusion about what data could be imported into the PAT:
Next year I think we will have more data comes to us. This year I analysed my own KS2 SATS results by using an Excel spreadsheet with my own formulae to produce the graphs but I think next year it’ll be done for me.
We can download a file from somewhere and then the head tells me what to do.
But those who were familiar with using it largely gave positive reports about some of its features and how they were able to use it.
What I found most useful was a little scatter graph showing the little dots of the children. I think it’s the average KS 1 performance against what they achieved in science KS 2. You have a line up the middle of what will be expected from children and then you have 2 lines… [similar to PANDA but] … This one you can hover over the dot and it tells you the name of the kid. That’s handy. I’ve printed the

Secondary schools
117
graph out and put names on it and you can see how far under certain children are and they become our target pupils for year 7.
On the scatter graph, that’s all you need, on that graph the lines are plotted as a spider’s web, you can see at a glance where there are problem areas and be more confident in these areas.
You can then feed this into teaching plans…You can also give it to the parents as a report as actually in a test this is where your child is and this is where you need to help your child to more work.
Other people were content with their own systems:
With the Assessment Tracker, you can use for key stage 3 by areas of progress. Yes but we have other sources of information to do that anyway … on Excel.
A lot of people think, if you have already done it, why would you want to go onto a new system?
Continuity of tracking, familiarity, ease of access and usage were the main reasons cited by teachers who had developed their own systems. The following comment exemplifies this view:
I have been using my own personal database – which I designed about eight years ago. I have charted the children’s progress across the five years of maths and I do have access to the progress of the subject.
Most members agreed that the amount of data collected in secondary schools was vast and some participants expressed concern that they might suffer from information overload. For example:
I actually think the most important thing for me is not to have too much. It is not to be overwhelming so that people don’t throw it out thinking it’s worthless because it is too much.
Others suggested that a sensible balance had to be struck. For example:
Yes, all your data is there and you can start manipulating – great. At the moment I have a year of 200 and I don’t want to go through 200 English papers and break down all the individual scores. Because what we are doing then is going into data instead of getting on with teaching. My time is better spent in the class room.

Secondary schools
118
One of the trends that became apparent through the course of the secondary focus groups was the ‘readiness’ of participants to consider, and share experience of, how data could best feed in to the learning of individual pupils. One participant described it thus:
That is when the data comes in most useful, when you can turn it around to what is going on in the classroom and what we need to do to make progress, whereas the stuff that goes up the line to senior management tends to be more for accountability.
All participants agreed that what mattered was being able to use data to improve teaching and learning. Whilst setting and discussing targets was seen to contribute to this, several participants indicated that it was the ways in which the data was shared that made the biggest difference. For example:
I think so. There are two levels, sharing it with the pupils and getting it clear with the staff who they need to focus on. I think sharing with the pupils is the way forward.
5.2.3 Conclusions
Like primary schools, the data source rated most frequently by secondary heads of departments as making a difference to teaching and learning was internal formal assessments. Sources of data such as NC test data and GCSE examination data were also considered by the vast majority as having a positive impact on learning. Optional tests were used much less in secondary schools than in primary schools but commercial tests were used far more frequently.
Regarding the tools and systems used in secondary schools, the Pupil Achievement Tracker was used slightly less in percentage terms than in the primary sample but there was more frequent use of SIMS. MidYIS and YELLIS systems were fairly popular and there was also a large number of schools using Excel spreadsheets and other school-devised systems.
The requirements of secondary schools in relation to data management were much the same as those of primary schools; ease of use and ease of data interpretation being the most common features of any useful system. Given that the most highly rated source of performance data was formal school assessments, many respondents and focus group participants reported a need for systems that allowed the input of internal data at frequent intervals.
Secondary schools
119
Within the focus groups there was considerable variety in the extent to which schools were using data management tools to any great extent. Where systems, such as YELLIS or PAT had been in use for some time, teachers were largely impressed with the useful outcomes and considered them to be having a positive impact on teaching and learning. Conversely, some teachers were either confused by the systems in place or overwhelmed by the volume of data they had to deal with. Several teachers commented to the effect that they were dealing with large numbers of pupils and hence vast amounts of data. There was some evidence that, where new systems are introduced, teachers may be resistant to change unless given considerable support and encouragement (time, training, etc).
5.3 Impact on teaching and learning: the purposes for which data are being used at school or department level
A key objective of the study was to examine the processes by which schools attempt to use the information and data that is available to them to improve teaching and learning. Some of this information may be generated internally whereas other sources of data may be provided by OFSTED, DfES, QCA, commercial organisations or the school’s local education authority. This section reports the findings relating to the use of data at school level and how such use impacts on teaching and learning. The focus in Section 5.4 will be on interventions, strategies and the impact of the use of data on individual pupils within the classroom.
5.3.1 Questionnaire findings
In Question 4a respondents were asked to list the three most important purposes for which data analysis was used in their department. All but seven teachers gave at least one response to this question and the majority of them described three purposes. Two purposes stood out. Just under half of secondary teachers (43 per cent) felt that one of the three most important purposes of data analysis in their department was to track pupil progress and achievement. Almost as many (39 per cent) felt that it was important for setting and grouping pupils. The next most commonly reported purposes related mainly to tracking and target setting, or to teacher and/or stakeholder benefits. These concerned the identification of pupils in need of support, target-setting and monitoring of progress, providing feedback to others including the LEA, parents and/or pupils and informing teaching and learning and any associated planning.
Some differences were found between teachers of different subjects. Once again, English teachers made fewer comments than did teachers of mathematics or science (a mean of 2.77 responses each against 2.93 and 2.99 for the mathematics and science teachers respectively). Despite this, the broad patterns of purpose were the same across all three

Secondary schools
120
subjects. Heads of mathematics and science departments made more use of data in setting or grouping their pupils and in reporting to parents than did their counterparts in English departments although such differences are unlikely to be statistically significant.
Table 5.3.1 lists the different purposes for which data analysis is used in secondary schools.

Secondary schools
121
Table 5.3.1 Purposes for which data analysis is used (percentage of respondents)
n = 292 Per cent of respondents
Tracking/ monitoring of pupils/ performance
To track pupil progress/ pupil achievement 42.8 Monitoring performance/ progress 16.8 Comparison of progress between groups/ subjects/ individuals/ schools 7.5 Identifying trends in performance 3.4 Monitor and/or raise standards – generic comments 2.7
Teacher/ classroom practice
Setting/ grouping pupils 39.4 Inform teaching and learning and (strategic) planning 16.8 To provide records/ feedback/ reports to LEA/ parents/ pupils 15.8 Analysis of test results/question analysis 5.1 Inform summative assessments 2.4 Deciding entry level for examinations 2.4 Improve test results 1.4
Target setting
Target Setting (non specific) / predicting future achievements/ outcomes 25.3 Set targets for pupils 19.5 Set targets for whole cohort/ groups 5.1 set targets for school 0.7
Identifying issues/ problems
Identify areas of difficulty/ weakness/ underachievement in pupils for further support 19.9 Address/identify issues for curriculum/dept development 11.3 Address/identify issues for groups e.g. SEN, gender, etc 4.5 Identify areas of strength/ talents/ gifted and talented for further support 3.4 Address/identify issues for teacher development 2.4 Address/identify issues in the cohort 1.4 Address/identify issues for the school 1.0
Other monitoring
Monitor quality of staff/ teachers/departments/ subjects or initiatives 11.6 Monitor provision for other groups/pupils – not SEN 6.2 Monitor provision for SEN children 1.0 Assessing readiness to move between groups/sets/schools 0.7
Accountability 2.4 Other 5.8 No response/ not relevant 4.1
More than one answer could be given so percentages do not sum to 100.

Secondary schools
122
A specific issue examined in the questionnaire was the use of data at periods of transition (when pupils move from one key stage to another within the same school) and transfer (when pupils move from one school to another). Respondents were asked to rate the usefulness of their data management system at points of transition or transfer. The responses to this question are shown in Table 5.3.2. This shows that teachers, on the whole, rate their data management system highly in terms of its usefulness at times of transition. It is noticeable, however, that a relatively large percentage (18 per cent) consider that it is ‘not at all useful’ or ‘not very useful’ in terms of transferring data from feeder schools, and that around a quarter of teachers are not sure if it is useful in terms of preparing and sending information to receiving schools, or in terms of transition at other times. There could, of course, be two possible reasons for this uncertainty: it might reflect the fact that teachers do not deal with the transition of data and so genuinely do not know how useful the system is at this time, or it could be that they have handled data at this stage and are doubtful about the usefulness of the system in this regard.
There are few differences between teachers of different subjects in terms of how useful they perceive their system to be for transition. However, one difference is intriguing: a higher percentage of teachers of mathematics are positive about the usefulness of their system for receiving information from feeder schools. Whilst 24 per cent of English teachers and 19 per cent of science teachers rate this aspect as ‘not very useful’ or ‘not at all useful’, only 12 per cent of mathematics teachers do so. This may reflect differences in the nature of data transferred for each of the three subjects.
Table 5.3.2 Q5a How useful do you consider your data management system to be at each of the following times? (percentage of respondents)
(n = 292) very useful useful not
sure
not very
useful
not at all
useful
no response
Transitions between key stages within the school 48.3 37.3 5.1 5.1 1.7 2.4
Receiving and interpreting information from feeder schools (at the end of a key stage)
27.4 44.2 8.2 15.1 2.7 2.4
Transitions at other times 17.1 37.0 24.7 4.1 2.7 14.4
Preparing and sending information to receiving schools (at the end of a key stage)
16.8 25.0 26.7 6.8 6.5 18.2
Respondents were asked to tick one box per row (see Appendix 1) - so each row sums to 100.

Secondary schools
123
To explore any relationship with performance, departments were grouped according to how they rated the usefulness of their data management system in supporting transitions between key stages. It was found that those heads of departments who rated data management as ‘not at all useful’ tended to have significantly higher KS3 performance than the remaining four groups but that there were no differences between the remaining groups.
In addition, respondents were asked to explain how they use data to support transitions within their schools (Question 5b) and to support the transfer of pupils into their schools (Question 5c). Examples were given by 253 respondents of how the use of data supports the transition of pupils from one key stage to the next within the school. One purpose stands out as being by far the most common: over half of respondents said that they use the data to inform pupil groupings. The next most common answer was given by a much lower 17 per cent of respondents, who said that they use information about prior attainment to inform planning and target setting. Ten per cent said that data is shared with the next class teacher.
Once again, a lower percentage of English teachers answered this question. In all cases, the same two types of response were most common across all subjects. However, 12 per cent of science teachers also noted that data was used for advice on course options, a purpose that was less prevalent in either English or mathematics.
In terms of supporting transfers when pupils enter the school, 243 respondents gave details. Again, one response stood out: 46 per cent of teachers reported that the data was used to group pupils, a recurring theme in use of data at secondary school level. The next most common response, given by 13 per cent, was a comment about the data transfer itself, rather than its use: teachers noted that information from feeder schools is either late or fails to arrive. Clearly, these teachers feel that questions about the use of data to support transfer are academic when data transfer is insufficiently timely. Other common responses to this question were to set targets/predictions, start pupils at an appropriate level and identify special educational needs (approximately eight per cent of respondents in each case).
As before, a lower percentage of English teachers answered Question 5c. Differences were seen between teachers of the three subjects. Whilst the largest percentage of responses in all three groups concerned pupil groupings, it was notable that fewer science teachers made reference to delayed or missing data. This does not necessarily mean, of course, that they suffer less from this problem; simply that they did not mention it with the same frequency as their peers. Two other types of answer were more frequent from one group than the others. English teachers were more likely to comment upon using data

Secondary schools
124
to identify special educational needs (16 per cent against seven percent for mathematics and four per cent for science), whilst science teachers were more likely to report using data to devise a new individual target or predict outcomes (15 per cent, against seven per cent for English and three per cent for mathematics).
5.3.2 Focus groups
As discussed previously, the most frequently cited use of assessment data related to the tracking of pupil progress. This was largely carried out at departmental level, although some instances of whole school co-ordination were described.
Target setting was also determined by data, although the extent to which links were established between numerical targets and curricular targets varied greatly.
Key stage 2 results were often used for setting or grouping, but the timing of delivery from the LEA was a major issue, as described by this respondent:
I think the time frame is very important, the time when you receive the data. We need to have it on time for it to be of any use to us.
In discussions relating to the transfer of data from primary to secondary, the following was a commonly described scenario:
Transfer of data has been very difficult this year … because of the [local] reorganisation, but prior to this year it was always difficult because we have so many different feeder schools and we ended up having information from some, some of it came part way through year 9, but clearly that is too late in terms of that year group being set. So … this year … there was a date agreed by the town when data should be transferred,…[and] it wasn’t stuck to. When the data did come in we had a vast number of pupils that we haven’t got Cognitive Ability Test (CAT) scores for and we didn’t get any key stage 2 data for year 7. Well we set them, not really in the way it would be if you had the information …. and they are just put in a group and then you have to look from there.
There was also some debate about the amount of data that was made available from feeder schools and what was deemed to be of value, as illustrated by this quote:
Some of the schools send the information through, some of them don’t. To be honest we have never had time to look at it, but you carry on …… but you are picking up from the children where they are. I think that this annoys the primary teachers because they have put a lot of effort into it. I did see they are trying to get in on primary schools now this kind of report thing where they have got what level

Secondary schools
125
the child is at throughout the key stage 1 and 2 so you can actually see that child’s progress just on that one sheet of paper. I think that coming through could be quite useful, but whether I would want all that information put on the database, just giving them to the teachers might be sufficient.
Another participant said:
We do take the data from the primary schools, but we don’t set on stats from key stage 2 because we have so many different primaries from so many different authorities… We also, because we are not an oversubscribed school, we also get a lot of second choice pupils or pupils that have been on appeal, that come in last minute. So, it takes absolutely ages to get a key stage 2 SATS results. I think they mark them in school and send them off to [LEA32], so we have the results 6 months to a year later. Then we set, based on that, different subjects set in different ways. Maths is set purely on ability, … Within the school, as a whole school thing, every term we have to give a sub-divided into A, B or C level, which is teacher assessment, usually based on an assessment, but it doesn’t have to be. Originally last year our target grades came from the CATS, but this year … due to new management they have now come from the SATS. The reason we have been told that they are coming from the SATS is because that is what we are judged on, it is supposed to give better correlation, and that is what the government is using to assess progress. Our key stage 4 targets are based on the key stage 3 SATs, and the key stage 3 targets are based on key stage 2 SATs once we get them in.
The compatibility of information management systems was again raised as an issue relating to transfer of data. Compatibility between departmental and whole school systems was also raised as a possible problem in some cases, as in this quote:
To be purely practical, the staff record test results on their own on Excel sheets for each of their classes at the start of the year and they copy it onto the school network for the maths area and then I will give that to our partner officer for the results and things and even that becomes a problem when someone sorted slightly differently and an extra kid comes in who you have not got on your list. Because we use SIMS as the school manager, but we don’t use this in assessment so this is one of the biggest frustrations between department and the whole school is the difference, and it seem simple to get the stuff from SIMS onto your Excel spread
32 KS2 tests are externally marked – indicating a lack of awareness of primary practice.

Secondary schools
126
sheet but because something has been entered differently… As for useful data, most of ours is analysed within the department.
One teacher described how she considered that data analysis had impacted on teaching and learning in her school:
Yes, on the strength of that information [from the reading data] we were seriously concerned so we put in a reading challenge with a whole school initiative to target reading. We did that in the autumn term and we did some questionnaires pre and post, we did no formal assessments but we did monitor it and we did review it and we can prove that that initiative for reading did improve the results. We also did this for maths and that too has an impact so the whole school is pleased.
Another teacher believed that whole school tracking had made an impact, as follows:
We get information, certainly at key stage 4, about how pupils are doing over the whole subject. So for me as a maths teacher, if somebody is getting Bs in every other subject and is down as an E on the teacher predictions for maths then we start to think if it is to do with the teacher, or if they are in the wrong set. We actually start thinking why in our subject are they not performing. It might be generally that they are not mathematically inclined, but on the whole if someone is underachieving it might be that they are not working in maths and there might be a reason why they aren’t working in maths, or there might be something that has unsettled them there.
However, data was not always regarded as helpful to class teachers, as one described;
At key stage 3 we use level data. Each of the tests they do the level of the tests to produce the level at key stage 3. This information is fed into the Assessment Manager for the whole school. The problem is that it appears to be a one way process. The data goes into a black hole and it never comes back out.
Some participants described the role of a data manager in their school. A number of teachers felt that having someone to manage the input, analysis and selected output for individual teachers was invaluable as they could ask for what they wanted without having to go through the lengthy process of learning to use the system. This was not, however a unanimous view. One teacher expressed her thoughts strongly:
Having that middle person is putting in yet another tier which we should be doing away with … What we need to do is empowering every teacher to be able to use

Secondary schools
127
the data themselves, rather than for us to always ask a head of department to hand the information down and not knowing how they will receive that. I think it is much better that every teacher learns some aspect of data on a day to day basis; it’s moving from that point where we have all the information… I asked my assessment co-ordinator what was it that she felt that would be useful, and I know from looking at her data (which I did not know existed) that this is really useful and I think “why am I not using this?” … She says it takes time to analyse and share the results in some way, so that we can tailor the learning so that the pupils we teach will benefit. We need to understand and know how to use it.
As raised throughout all the focus group meetings, the most important issue was seen as finding ways of using the data to improve learning. This was summed up by one participant:
In our school we have been quite good for a long time, using the data that we have, to identify kids, particularly underachievers, so we can look very early on at kids who are underachieving against the key stage 2s. What we are not putting the time and effort into is - OK we have identified them - now what are we going to do with them? That’s the issue - that’s the frustration.
5.3.3 Conclusions
The main purpose for which secondary schools are using data are: tracking the progress of individual pupils, identification of pupils who are underachieving, target setting and the grouping or setting of pupils. The latter purpose is far more frequently cited than in primary schools, and performance data is particularly valued by heads of departments when pupils transfer into the school and at points of transition within their schools.
Effective use of data was considered to be dependent upon:
• prompt delivery of data from feeder schools, LEAs, QCA, etc
• compatible school management and assessment systems for ease of transfer and storage of data
• systems where data can be easily exported for staff use (i.e. systems that are accessible to all staff or an effective data manager)

Secondary schools
128
5.4 Impact on teaching and learning: the purposes for which data are being used at class or pupil level
Data analysis cannot, of course, impact effectively on teaching and learning unless it is used in some purposeful way to achieve that end. Therefore, the questionnaire asked teachers to describe the most common types of intervention and/or strategies used in their department where data analysis had highlighted issues to be addressed (Question 4b). Most secondary teachers gave a response to this question: 264 of the total sample of 292.
5.4.1 Questionnaire findings
The most common response to data analysis was to provide extra support for pupils, such as in the form of booster groups or one-to-one support. This was mentioned by 51 per cent of the sample (see Table 5.4.1). The next most frequently mentioned was the fact, once again, that data is used to inform teaching groups or sets (30 per cent). Around a quarter (26 per cent) reported that they respond to data by changing their teaching programme or making changes to the curriculum, while a similar number (23 per cent) mentioned involving parents or setting up a home-school programme. Revision or catch-up programmes were also frequently mentioned (20 per cent), as were the identification of special educational needs or underachievement (13 per cent), the establishment of peer mentoring or other mentoring support schemes, and target setting (both 11 per cent). The majority of questionnaire responses concerned pupil-based interventions but there were also examples of strategies focused on teaching, such as teacher observations and peer teaching sessions.
Analysis by subject shows that the main strategies used are common to all three subjects. Once again, however, some differences emerge. Mention of using data to inform planning was less frequent from science teachers than from others (six per cent against 13 and 14 per cent among English and mathematics teachers). Mathematics teachers, however, were more likely than others to mention using teaching assistants to provide support, to mention home-school partnership and to state that there was no school approach to interventions; that they were left to the discretion of individual staff to devise. English teachers, conversely, were more likely to describe a school-based approach or departmental strategy.

Secondary schools
129
Table 5.4.1 Most common interventions/strategies employed in secondary schools (percentage of respondents)
n = 292 Per cent of respondents
Targeting of groups/ individuals for support
Booster groups/one to one support/extra support (for individuals/groups) 50.7 holiday school/revision/catch up lessons/after school (whole class or unspecified) 20.2 Identifying SEN/underachievers (no mention of strategies etc) 12.7
Peer Support/individual mentoring/ student involvement 11.3 Support/strategies provided by TA/classroom assistant 9.9 Gifted and Talented provision/high attainers e.g. providing extension material 7.5 Mention of amending/delivering IEP/statements/SEN code of practice 1.0
Interventions /strategies (pupil approaches) Inform teacher groups/focus groups/setting 29.8 Parental involvement/home school partnerships 23.3 Close monitoring of pupils 9.9 Withdrawals/exclusions 5.1 Sanctions/ rewards 2.7
Whole school/ general approaches to classroom practice Review of/changes to teaching programme or curriculum. E.g. more personalised/ differentiated teaching/learning.
25.7
Inform planning and/or targets 10.6 School/dept approach to a specific area e.g. attendance/ behaviour/ curriculum area. 8.9 Individual staff decide strategies / not school approach 7.2 Inform training needs/provide training/support for staff 6.2 Further analysis of data/question analysis 4.5 Inform level of entry for tests/examinations 4.5 Inform lesson planning/curriculum planning 4.1 Sharing good practice amongst staff e.g. observations, motivational strategies 3.1 Analysis of leavers’ /transfer data 0.7 Review/moderation of assessment system 0.7
Specific Curriculum Strategies/ participation in projects Named Literacy Strategy e.g. ALS, ELS 4.1 Other Curriculum Strategies 2.7 Other named strategies 2.7 Whole school/dept participation in wider strategies e.g. government programmes/ school improvement programme
1.4
Named Numeracy Strategy e.g. ANS, springboard 1.0 Participation in EAL projects/focus 0.3 Others 5.5 Not directly relevant/uncodeable 1.0 No response 9.6
More than one answer could be given so percentages do not sum to 100.

Secondary schools
130
5.4.2 Focus groups
Focus group participants were asked to give examples of instances where data analysis had impacted on pupil learning. The following are some of the examples given:
We looked at the key stage 3 [science] results last year, there was a large number of pupils who came in at level 4 (key stage 2) and left key stage 3 with a level 4. Apparently making no progress, but when we compared that with the CAT data, a large number of those pupils also had low verbal skills so this year we can turn those things around, so from the start of year 9 identify pupils who come in at 4 and at the start of year 9 who have low verbal skills so try to get in a year ahead of the game.
We asked, how do you address something like that?
Well since Christmas we have re-arranged for one lesson a week one science teaching group to have one group of pupils with low verbal skills so that the science teachers can try and address that. From whole school data the classroom teacher gets a graph for each of the teaching groups which plots where pupils fall into four quadrants on the graph, so that staff can plan lessons appropriate to the group of pupils.
Another teacher described the potentially positive impact of examining data in relation to an individual:
An individual who I am teaching and have quite a good relationship with… came to the school with level 5 in key stage 2 and has consistently underperformed. Parents very much blame the school, the school blames him etc. I talked to him and I got the data out and when we started talking about the data and I said that you should be B or whatever. It was interesting as we looked back at key stage 2 and he said, I was never a level 5, I got lucky on the day of the exams. He says I don’t think that data reflects who I am or who I was and consequently because he got lucky, he felt that the expectations throughout the school have been wrong. … and having that conversation and talking about what he could do, has motivated him far more and I have seen him come on far more in English now than he had for three years when I had to deal with because staff were not happy with him.
One teacher described the perceived impact of using the PAT to identify underachievers:
They become a target pupil and this means this last year we missed out on any funding for science intervention but next year we’ve put a bit in for science

Secondary schools
131
intervention which means we want more support for those children. We are producing a series of assessments for learning tasks. It all ties in together with the teaching.
He had used the scatter graph as proof of why the intervention was needed and:
… to give feedback to the teachers that taught them last year – that there appears to be an under or overachievement. Sometimes the teacher then produces an explanation and sometimes don’t. They might review their teaching or planning.
A different kind of perceived impact was described by someone else:
We monitor the students’ progress at key stage 4 and tie it with our mentoring scheme. We have a peer mentoring scheme and a staff mentoring scheme… It’s quite good for those students who are expected to get the five grade Cs in their GCSE’s, who we notice are beginning to drop off and then they can be picked up by their mentor and then given a very focussed discussion of targets about their work. It’s also been used with those who are the 8+ [level] so the top end students and they’ve appreciated the fact that someone’s noticed they are doing well and want to do even better. They like the mentoring scheme. The data is used for our educational purposes and fed into mentoring scheme. The children know… it’s all discussed with pupils as well. They have a data sheet with all their subjects and their achievements. They can see where they were and where they are now and discuss it all with their mentor.
On occasion LEA support was described:
Based around exam success or coursework – We’ve had some LEA support with coursework particularly in geography where we’ve identified youngsters where through past experience we think might struggle. We’ve tracked their progress quite carefully and used it for that. That’s been more observational data rather than hard number data. Certainly with test scores, we used to check every half term in geography against predicted score and if they were beginning to drop we would invite parents to talk to us, we’d offer revision classes etc.
Assessment for Learning and the formative use of data was an area that was raised, at different times, across most groups. As one participant put it:
One thing I don’t think we have talked about is assessment for learning actually putting the emphasis on to the students to look at their own progress and I think a lot of work in the future about improving performance, is going to be about

Secondary schools
132
getting students to look at their own learning and where their own strengths and weaknesses are.
As in the primary focus groups, all the secondary teachers agreed that data was being used most effectively if it was used to raise questions that highlighted ways in which a pupil’s learning could be taken forward.
5.4.3 Conclusions
Although there is considerable overlap with the intervention and strategies used within
primary schools, there are also some differences, particularly the extent to which
secondary schools seek to involve parents and pupils. From the questionnaire survey the
main broad groups of interventions arising from analysing performance data were:
supporting underachieving pupils by means of booster groups, revision classes, etc;
amending sets or groups; changes to the curriculum or teaching programme; and
discussions with parents and pupils.
Specific examples from the focus groups illustrate the different ways in which data can be
the catalyst for specific actions:
• tailoring the teaching of a particular subject to the needs of a targeted group of
pupils (e.g. pupils with poor verbal skills)
• individual mentoring for pupils
• applying to the LEA for extra funding for specific projects (assessment for
learning tasks in science)
• informing teaching plans by giving feedback to subject teachers
• revision classes
• discussions with parents.
In particular, secondary schools highlighted the need to encourage pupils to take
ownership of their learning and that data can be the starting point of discussions with
pupils about achievements and progress.

Secondary schools
133
5.5 Dissemination and sharing of data
A further consideration in this study was to examine the perception of respondents as to the extent to which different members of staff engage with the data available. Questions 6a and 6b, therefore, asked who uses the data, at what level of usage, and how the data is shared within the school and with other stakeholders such as governors and parents.
5.5.1 Questionnaire findings
Data use was common among heads of department and class teachers, with over 90 per cent of each engaging in it (see Table 5.5.1). This was true for all three subjects. It was less common among teaching assistants and administrative support staff, although just under half of the respondents reported that teaching assistants use data in their departments (43 per cent). Less than a quarter of administrative support staff were reported to use the data. The most common ‘other’ users of data were senior managers, named by seven respondents.
Of those reported as using the data, the most frequent usage was seen amongst heads of department (85 per cent reported using data ‘frequently’). Class teachers were reported as using data frequently or sometimes, while assistants and support staff were more likely to be listed as using it ‘sometimes’. Again, these trends hold for all three subjects.
Table 5.5.1 Usage of data in secondary schools (percentage of respondents)
Role (n=292) Who uses the data?1
Frequently2 Sometimes2 Rarely2 No
response2
Head of department 94.2 85.1 12.4 0.7 1.8
Class teachers 93.8 61.3 36.5 1.1 1.1
Teaching assistants 43.2 19.0 63.5 17.5 -
Administrative support staff 22.6 16.7 43.9 34.8 4.5
Other (e.g. senior managers, governors, tutors, SENCO) 8.6 - - - -
No response 5.1 - - - -
1 Percentage of respondents - more than one answer could be given so percentages do not sum to 100. 2 The number of those who reported using the data.

Secondary schools
134
Further analysis33 was conducted to explore the relationship between school performance and usage of data. Departments with lower KS3 performance tended to be using data more frequently than high performing departments. This suggests that such schools may be interrogating the data in order to try to raise standards.
In addition to the level of usage in their schools, respondents were also asked to indicate the different ways in which information was disseminated to colleagues and other stakeholders. This gave a further measure of the level of awareness of the information generated by data analysis in their schools (Question 6b). Respondents could tick as many methods as applied as well as add up to two more of their own. Most secondary teachers (284) responded, ticking a mean of five options each. The most frequently selected methods of communicating information (see Table 5.5.2) generated by the analysis of data were by presentations or written information to teaching staff and to the senior management team (87 and 85 per cent respectively), followed by meetings between class teachers. Sixty-five percent reported sharing the information with pupils and 52 per cent with governors via presentations or written information. Of the other ways staff in secondary schools engage with data, the most frequently reported were meetings between heads of departments.
33 The relationship between school performance and usage of data was explored by means of multiple regression analysis, controlling for the size of school. A rough measure of usage was calculated by assigning a score of three for ‘frequently’, two for ‘sometimes’ or one for ‘rarely’ to each indicated category of user given in response to Q6a.

Secondary schools
135
Table 5.5.2 Dissemination of data in secondary schools (percentage of respondents)
(n = 292) Per cent of respondents
Presentations/ written information to teaching staff 86.6
Presentations/ written information to SMT 84.6
Meetings between class teachers 77.7
Use of training days (e.g. INSET) 66.1
Presentations/ written information to pupils 65.1
Presentations/ written information to parents 62.3
Presentations/ written information to governors 51.7
Other (meetings between heads of departments) 6.2
No response 2.7
More than one answer could be given so percentages do not sum to 100.
Again the relationship between performance and dissemination was explored.34 There was no statistically significant difference between higher and lower performing departments (KS3 overall performance NPD 2003) in respect of dissemination, but heads of English departments were found to be disseminating significantly more than heads of mathematics departments.
5.5.2 Focus groups
Discussions within the focus groups suggested that dissemination practice varies widely across secondary schools and across departments within a school. Reporting to parents and to governors was discussed in some detail. However, within this section the focus will be on dissemination of data analysis within the school, that is, the ways in which information is shared between teachers and with pupils.
In some schools all subject teachers were comfortably familiar with the school information management system and quite au fait with the data input and analysis of their own classes whereas others had a specific data manager who provided teachers with (more or less) regular printouts. In yet other schools, only the subject or assessment co-
34 This was explored by means of multiple regression analysis. The total number of methods reported was used as a measure of dissemination.

Secondary schools
136
ordinators had access to the database and the degree to which they acted as ‘interpreter’ of the data was also variable.
Some Heads of Department reported handing their teachers complete printouts to do with as they wished; others used them as a basis for staff or departmental meetings. For example:
In departmental sessions, I go through it and tell them what this means, go through it generally and give staff individual sheets and then two or three will sit in teams and discuss the data. It works better that way instead of the whole lot at once.
In some schools, it was reported that the Assessment Co-ordinator would produce selected data outputs for examination during whole staff inset sessions or ‘assessment days’. This quote is illustrative:
We would analyse key stage 2/3 stats and we would look at the performance of the children and then we would use that to set targets for each particular teaching group to address those weaknesses. For example, kids at key stage 2 who did not achieve level 4, would be taking progress tests in year 7. We would target the teachers specifically to support those pupils so that they achieve and push them on.
One Head of Department expressed his concern that any data passed to class teachers had to be both meaningful and manageable, particularly when a vast amount of information has been collected.
I have tried this year to make a conscious effort to give the department as little data and as much information as possible. For example, this year we looked, through the MIDYS data, at the difference between vocabulary and non-verbal ability and compared that rather than the mass MIDYIS score…we compared that to the SATS and basically just highlighted where there was an anomaly and looked liked the kids were underachieving but they had a high non-verbal score. So … I could state to staff that: “these kids in your year …are struggling to achieve or have got a big difference between the non-verbal and the vocabulary… can you be aware of that? Try to give them more non-verbal opportunities to show you, listen to what they are saying to the kids who do not like writing things down. Trying to take account of learning styles.” Staff often say “Yes I know that, I have good instinct”, but [the data] highlights other things to the staff.

Secondary schools
137
He preferred to select ‘highlights’ to share with his staff because:
The whole school data would give you the spreadsheet for the year group and expect you to do something; and it depends on your interest and capability with IT if you could do that. On the other hand, me giving them a sheet of A4 highlighting ‘in that group these kids are there for whatever reason’ is much more helpful.
He went on to share his belief that an integrated approach to teaching and learning could be informed by data:
I think making the data accessible is part of it, but I think it’s more about looking at targets that the students have got in terms of written targets as opposed to grade targets and saying how far do you feel you are moving towards reaching your target, what do you need to do to change that. That could be small group targets as opposed to individual targets and therefore those targets should be set at the end of each formal assessment and reviewed on a regular basis. It is also important that they have an understanding of what a level 6 performance is.
Asked how pupils were made aware of that, he added:
We put profiles on the wall of what a level 6 looks like and then the work is set. You can say how far they have actually moved.
Another strategy described was the formative use of summative test papers:
For preparation for SATS, you do a question with the class then put them on a data projector screen and ask them have you got this in your answer. If not why? I don’t think that’s data use in the terms we have been talking to up until now, its more about teaching and learning in the classroom …separate from the computer and targets and perhaps what needs to be developed is that cross over where the numbers and data inform more.
One teacher described her way of sharing data with pupils:
With the science course work at GCSE, we do three points for two years where they actually do a piece of course work and get their four skill marks back after one so they can see if they have any weaknesses in one area so they know the areas to focus on. It’s a very simple example but it’s numbers and transferable.
…they do modular exams in March/June and then you can track progress during year 10 to see what sort of grade they are working towards for the final GCSE

Secondary schools
138
and when they start year 11 the target modules they need to re-sit and in what particular area.
We put the modular [test results] on to a spread sheet and teachers work their way around the class talking with individual pupils about the results.
Different teachers reported different approaches to how they imparted information to pupils and different ways in which it was used. One teacher felt that sharing data could be used as a way of motivating her pupils:
We use it quite a lot to target the pupils, for example the GCSEs on the stats that have just come back from a key stage exam. You add it to the totals of what the children have already got and then I’m telling children how far they are off the next grade. I’ve given that to the individual teachers, so they are saying “Look here you only need another 3 marks to be on target for your C” and it does seem to be helping the pupils. So having the information does help the teachers to be able to focus the pupils on what they are trying to achieve.
5.5.3 Conclusions
Although the most frequent users of data in secondary schools are the heads of the departments, over 60 per cent of subject teachers are also using data analysis outcomes frequently. In some schools all teachers have access to the data whereas in others the data is analysed and disseminated by a dedicated data manager. There was no consensus in the focus groups as to which was the more effective route; the main concern was that teachers should have access to data that was meaningful and manageable.
As in the primary schools, dissemination and discussions amongst staff in secondary schools were used as a stimulus to asking questions about why pupils were or were not making progress and what could be done about it. A common theme in the focus groups, as reported in the previous section, was sharing information with pupils as a way to motivate them and involve them in achieving their learning goals. Different approaches to discussion with pupils were reported including discussions of grade or level targets, discussions of curricular targets and modelling of levelled work.

Secondary schools
139
5.6 Challenges to the use of data
5.6.1 Questionnaire findings
An open question gave respondents the opportunity to describe what they perceived to be the challenges affecting effective data use. As before, comments were coded in order to quantify the different types of response to this question. Some respondents gave very specific detailed comments whereas others gave only general indications of the nature of the challenges facing schools. The majority of responses fell into the following categories:
• issues relating to the data
• issues of time
• resourcing issues.
The most frequently cited issue related to the quality or timeliness of the data itself. Specifically, teachers were concerned that data was unreliable or late, that it was too academic, not focusing on wider aspects of the individual’s progress, or that data could too easily be misunderstood.
The next most common concern was about time. Fifteen per cent of respondents mentioned time without elaborating. Others specified that they lacked sufficient time to analyse the output, implement changes or keep the data updated. A related point was that approximately 15 per cent reported either staffing issues related to inputting of data, or other resourcing issues.
The results for this question are presented in Table 5.6.1.

Secondary schools
140
Table 5.6.1 Challenges to the use of data to improve learning (percentage of respondents)
n = 292 Per cent of respondents
Issues with Data Issues with the Data– e.g. not trusting results/not being reliable/too late 16.1 System too academic/ focus on tests – not focusing on other aspects of the individual 13.0 Possibility of misinterpreting data available/not everyone understanding the outcomes 11.3 Difficulty in applying data to classroom situations 5.5 School/decisions/changes shouldn’t be driven by data 4.1 System doesn’t accommodate complex individual needs e.g. disordered learning 2.7 Too much focus on negative 2.7 Getting data from feeder schools is challenging 2.4 Not able to compare data year on year 1.4 Make sure have multiple means of assessing 1.4 Constantly testing in order to keep data current 1.0 Lack of comparability/unable to deduce trends e.g. no schools with similar structures and needs 0.7
Benchmarking issues – need to be more precise 0.3
Time/resources issues
Time (with no elaboration) 14.7 Staffing issues – e.g. having the ‘good’ staff to input data/ training issues/ 12.0 Time to analyse the output 8.6 Time to keep the data updated 7.2 Time to implement changes 5.8 Resource issues e.g. money to implement changes 2.7
ICT Difficulties Not enough computers, or programme difficulties/access to computers 7.9 Manageability of the system 5.1 Lack of common system within the school 2.7
Other 5.8 Not directly relevant/uncodeable 2.1 No response 14.7
More than one answer could be given so percentages do not sum to 100.
Differences between subject leaders were centred on the extent to which they considered time or issues with data to be the main concern. It was noticeable that English teachers seemed more concerned about data quality than time (78 per cent of comments concerned the former, while only 20 per cent mentioned the latter), while for science and mathematics teachers, the gap between the two areas was smaller (40 and 46 per cent respectively for time issues, while 58 per cent and 50 per cent respectively were concerned about data quality). Again, this might reflect differences in the nature and
Secondary schools
141
generalisability of the data in each subject, as well as specific problems experienced by English teachers in relation to the 2004 KS 3 data.
5.6.2 Focus groups
The main barriers and areas of challenge cited within the secondary schools were, in the main, similar to those identified by the primary school focus groups. Time, training, accessibility, resources and difficulties of interpretation were all discussed in depth. In some cases, challenges were exacerbated by the size of the school and the number of different databases in use. Resources, in terms of IT equipment and finances, on the other hand, seemed slightly less of an issue in the secondary groups.
However, access remained a problem for some, according to their reports. The following example typifies this view:
If I want to go on and look at stuff on the Assessment Manager 6 I have to either use someone else’s office or use the one in the staff room, which is all well and good but it is not quiet and it’s usually full of people and you often get collared for something else. [We need] places that you can go to play with it.
Time and training were the major barriers reported and data input was seen as a huge issue, simply because of the numbers involved. For example:
[I think]…every department should have access to office staff for secretarial support for a particular morning, so say maths is Monday morning and English is Monday afternoon, that type of thing.
Due to their different roles and responsibilities, there seemed to be more drive among secondary school participants to use data analysis to feed back into teaching, as opposed to primary schools, who reported still being more focussed on accountability. As one secondary respondent noted:
So somebody needs to recognise that actually making the time to explore the data and work with it is of value.

Secondary schools
142
One Head of Department said:
Personally I could do with more time. Like you said, you can sit down at departmental meetings and go through things. Well the only departmental meeting time I have, if I try to stick to the time limits we’ve got, by the time we’ve got through the organisational issues for that half term or term, there isn’t any time for that.
While all participants agreed in principle that data could be used constructively to inform teaching and learning, thoughts such as the following were frequently expressed:
It is because schools ultimately set their time limits, they set out their meetings, they talk about directed time, they make judgement calls. But if we are talking about making everyone confident with the data that sort of discussion regularly as part of faculty meetings, then pass down to the department, I wouldn’t have the time to do it.
In addition to time for dissemination, finding teacher time to become familiar with their system was also raised as a challenge:
I think that is one of the problems, learning anything new especially to do with computers, but you think right I’ll do this for 50 minutes and you are sat in an office and the kids come out from the lessons and are messing about so you go out and deal with them, you come back and manage to do 20 minutes and the bell goes before you have to go back to your classroom. You can’t concentrate and aren’t making best use of your time because there is no sustained period where you can concentrate on it for 2-3 hours.
Time available as well, as one 50 minute period is not enough to get in to it.
It takes regular use as well, because otherwise as long as you spend time on something it all goes well, but if you don’t use it for another 6 months... It has to be simple and the same thing, not 20 different packages. Once it is there, like Assessment Manager 5, I was just getting used to it then it changed to Assessment Manager 6.
Teachers agreed that question level analysis of tests was useful, but the majority felt that they would only use it if the question level data could be transferred electronically and teacher engagement could be at an analytical level. Hence, one said:
Absolutely. Because actually, in terms of English where we have to make judgements about whatever we’re going to get for key stage 3 marks, you have to

Secondary schools
143
go through physically go through and look at how it is marked and broken down, but if you had that all on-line to start with, you could make those judgements very quickly, because then you could go back and just pull the papers off the kids where the problems were. But you are also being made to do all that work, almost unnecessarily.
As identified in an earlier section, the late arrival of key stage 2 data was perceived as inhibiting its usefulness to inform grouping or setting. For example:
Our LEA has said that the form disc is very, very good but it doesn’t come out until January/February. It’s late, it’s a term in, you’ve already forgotten performance from last year’s SATs and GCSEs because you are half way through the next lot. I think the data like that needs to be out as soon as possible.
This was also seen as tied up with the method of transfer of information and (again) the question of who should input the data. One respondent said:
So data being delivered late, and time issues, time of year mean that you may have the data there but not necessarily making use of it. What happens is, you end up punching it yourself because you want it but you are also aware that if you wait 2 months it will all be done for you and it all seems like a waste of time.
Lack of information and guidance on the data systems available and ways in which they could be used effectively was regarded as a serious impediment by many. The following comments were typical:
I don’t really feel I know what there is available, so if I don’t have access there are things I think I’d like to be able to do, but whether there is something in place or some type of package that would do it for me I don’t know.
[We could do with]… an evaluation of all that information that comes into the school. What is most important, is it meeting targets for the LEA, is it about your improvement, what are we trying to achieve, what are we being judged against.
Several participants also raised the fact that they valued being able to choose the way in which data was handled in their schools and all agreed that a prescriptive decree from ‘on high’ would not be welcomed. One said:
I think different schools would use different things to their benefit. It depends on the situation you are in, what level of school you are, what your demography is and so forth.

Secondary schools
144
The idea of focussed opportunities to meet other teachers or heads of department was thought to be very useful in terms of disseminating information and sharing ideas. Hence, the following statement:
Is there no opportunity to talk to people in the same positions as you, as Heads of Departments and see how they use their data and what you can do ….and share experiences?
5.6.3 Conclusions
The main challenges to the use of data according to the secondary questionnaire respondents were either issues with the data or a lack of time and resources. Reflecting one of the same concerns expressed by headteachers in primary schools, secondary heads of departments also consider that the focus of much of the data on academic results is too narrow. Their other main concerns were lack of trust in the reliability of the data and difficulties in interpreting the outcomes from data analysis.
Issues of time and resources were frequently mentioned within the focus groups. For some, access to the system itself was a problem, but more frequently the complaint was not having sufficient time to become familiar with the system or to look at the data. Some felt that lack of time inhibited their ability to draw meaningful conclusions that could then be translated into curriculum planning and classroom practice. Related issues were having the data at the earliest opportunity and, where necessary, support to input the data so that they could make best use of the data.
Finally, some focus group participants commented that there should be opportunities to meet other head of departments from other schools so that effective practice in relation to data could be shared.
5.7 Accountability or self evaluation
As noted earlier, there is an unproven assumption that the provision of data will necessarily lead to improvements in school performance. In addition to examining the ways in which schools attempt to use the data at their disposal to improve learning, a further issue to be addressed was to explore what evidence schools have that attainment has increased as a result of promoting learning through the use of data. In other words do schools believe that the collection and feedback of data to schools is aiding them in the process of self-evaluation and self-improvement and how do they ascertain this?
Secondary schools
145
5.7.1 Questionnaire findings
In Question 4c, respondents were asked to comment on the contribution that the use of pupil data has made to the school’s evaluation of its performance. The most frequent comment, made by 70 respondents (24 per cent), was that it gives a clear picture of the department’s performance and achievement, including any strengths and weakness. Similar numbers (20 and 19 per cent respectively) made general, unspecified claims of improvement to the department (comments such as ‘a massive contribution’) or observed that pupil data made it easier to monitor progress and reflect on standards. Others (10 per cent) commented that having access to data made it easier to identify pupils’ achievements and set targets.
Table 5.7.1 gives a summary of the responses to this question.
There were few differences between subject teachers in response to this question. One notable exception was in responses related to ease of monitoring and reflecting on progress. Mathematics teachers were more likely than science or English teachers to cite this as a contribution: 34 mathematics teachers (22 per cent) mentioned this, compared with eight English teachers (seven per cent) and 14 science teachers (ten per cent).
Section 7 in the questionnaire concerned schools’ perceptions of the effectiveness of their data management. Firstly respondents were asked to indicate their overall perception of the extent to which the use of data management tools improves pupil learning (Q7a). Question 7b then asked how they assess the effectiveness of their use of data in improving teaching and learning. Finally respondents were asked to indicate their agreement with a number of positive and negative statements about the use of data, in order to obtain some measure of their overall attitude towards the impact of data on teaching and learning.
The extent to which respondents considered the use of data management tools improves pupil learning was measured on a five point scale from ‘to a great extent’ to ‘not at all’. Almost all of the secondary teachers answered this question and most were positive about the extent to which their use of data management tools improves pupil learning: 80 per cent said that it did so ‘to a great extent’ or ‘to some extent’ (22 per cent and 59 per cent respectively). There were no noticeable differences between teachers of different subjects and no pattern was identified in the relationship between performance and the responses to this question.
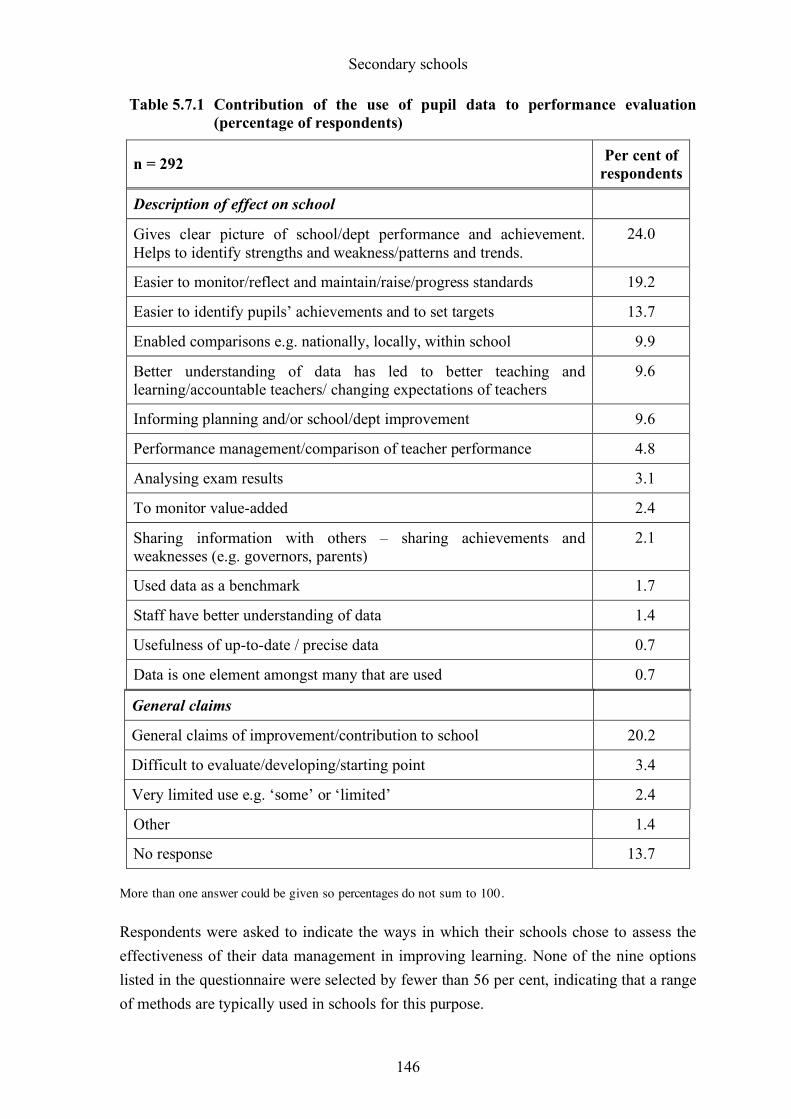
Secondary schools
146
Table 5.7.1 Contribution of the use of pupil data to performance evaluation (percentage of respondents)
n = 292 Per cent of respondents
Description of effect on school
Gives clear picture of school/dept performance and achievement. Helps to identify strengths and weakness/patterns and trends.
24.0
Easier to monitor/reflect and maintain/raise/progress standards 19.2
Easier to identify pupils’ achievements and to set targets 13.7
Enabled comparisons e.g. nationally, locally, within school 9.9
Better understanding of data has led to better teaching and learning/accountable teachers/ changing expectations of teachers
9.6
Informing planning and/or school/dept improvement 9.6
Performance management/comparison of teacher performance 4.8
Analysing exam results 3.1
To monitor value-added 2.4
Sharing information with others – sharing achievements and weaknesses (e.g. governors, parents)
2.1
Used data as a benchmark 1.7
Staff have better understanding of data 1.4
Usefulness of up-to-date / precise data 0.7
Data is one element amongst many that are used 0.7
General claims
General claims of improvement/contribution to school 20.2
Difficult to evaluate/developing/starting point 3.4
Very limited use e.g. ‘some’ or ‘limited’ 2.4
Other 1.4
No response 13.7
More than one answer could be given so percentages do not sum to 100.
Respondents were asked to indicate the ways in which their schools chose to assess the effectiveness of their data management in improving learning. None of the nine options listed in the questionnaire were selected by fewer than 56 per cent, indicating that a range of methods are typically used in schools for this purpose.

Secondary schools
147
The most common response was that teachers review end-of-key-stage test and/or examination results over time: 95 per cent of respondents selected this response. The second most common answer related to reviewing each pupil’s achievements against targets set (85 per cent). The popularity of these methods was similar across all three subjects; English, mathematics and science.
Just over three quarters of respondents reported that they review summative teacher assessment outcomes over time. Slightly fewer report that they compare achievements of particular year groups with those of previous cohorts in the school and a similar number record each pupil’s progress in learning each term. Again, these trends were similar across all three subjects. Table 5.7.2 below shows the frequencies of response for this question.
Table 5.7.2 Assessing the effectiveness of data management in improving pupil learning (percentage of respondents)
(n = 292) Per cent of respondents
Reviewing end-of-key-stage test results over time 94.9
Reviewing each pupil’s achievements against targets set 84.9
Reviewing summative teacher assessment outcomes over time
78.8
Comparing achievements of cohorts 75.3
Recording each pupil’s progress each term 75.0
Comparing pupil achievement with similar schools nationally
65.8
Comparing pupil achievement with similar local schools 61.0
Collecting anecdotal evidence of progress from teachers 59.6
Collecting examples of pupils’ work to demonstrate progress
56.2
Other 5.1
No response 2.4
More than one answer could be given so percentages do not sum to 100.
Respondents were also given space to specify any other methods they used to assess the effectiveness of their data management tools in improving learning. Only 15 responses to this item were received, of which just under half were directly relevant. Other methods
Secondary schools
148
listed were comparisons of different subjects or different groups of pupils, participation in a named strategy or programme or end of year and end of unit tests.
Attitudes towards the use of data were explored by means of Question 7c, a series of statements to which respondents were asked to indicate the extent of their agreement. The results of this question are presented in Table 5.7.3. The statements are not presented in the order in which they were given in the questionnaire. Rather, they have been ranked in order of the overall strength of agreement (as measured by the sum of the percentages of those ticking ‘agree’ or ‘strongly agree’). Given the pattern of responses, this has resulted in ‘positive’ statements (those describing positive effects of data use on teaching and learning) being grouped together towards the top of the table, and the opposing ‘negative’ statements (those stating that data use does not impact positively) being grouped at the bottom. This emphasises the fact that teachers were generally inclined to be favourable towards the idea of using data to support teaching and learning
Statements divided into three main groups: those with which the majority of teachers agreed, those with which the majority disagreed and those where responses were spread across the response options. There were eight statements where the majority of teachers agreed or strongly agreed (the percentages agreeing ranged in each case from 95 to 60 per cent). These statements were, in descending order of percentage, as follows:
• Data analysis has helped to identify pupils who are under-performing.
• The analysis of data makes it easy to discuss pupil performance with members of my department.
• Data analysis has helped to identify areas of teaching/learning in [my subject] that need to be addressed.
• Analysing data has had a positive impact on learning outcomes in my department.
• More training is needed to help staff interpret and use the information generated.
• The use of data for supporting Assessment for Learning.
• Data are used by staff at all levels within this school.
• Data analysis has helped to identify training needs in my department.
There were only two statements where the majority of teachers disagreed or strongly disagreed, and these reinforce the positive message about use of data in secondary schools. They were, in order of percentage (83 and 77 per cent), as follows:

Secondary schools
149
• The analysis of data does not improve teaching and learning
• Data analysis tells us nothing that we don’t already know.
The remaining three statements showed no clear majority, although it was noticeable that about one quarter of respondents in each case selected the ‘neither agree nor disagree’ category. This was also true of two of the statements with which a majority agreed: those regarding the identification of training needs and supporting Assessment for Learning.

Secondary schools
150
Table 5.7.3 Agreement with statements about the use of data in secondary schools (percentage of respondents)
(n = 292) strongly agree agree
neither agree nor disagree
disagree strongly disagree
no response
Data analysis has helped to identify pupils who are under-performing.
51.7 43.8 1.4 1.0 0.3 1.7
The analysis of data makes it easy to discuss the performance of this school with members of staff.
30.8 58.6 6.5 2.1 - 2.1
Analysing data has had a positive impact on learning outcomes in my school.
29.1 49.3 16.1 3.1 0.3 2.1
Data analysis has helped to identify areas of teaching/ learning that need to be addressed in this school.
22.6 55.8 14.0 4.5 0.7 2.4
More training is needed to help staff interpret and use the information generated.
19.5 55.5 15.8 5.8 1.7 1.7
Data analysis has helped to identify training needs in my school.
15.1 45.2 26.0 12.0 - 1.7
Data is used by staff at all levels within this school. 13.7 47.6 19.5 14.0 2.1 3.1
The use of data is supporting Assessment for Learning. 13.4 53.1 24.7 5.1 1.7 2.1
I do not feel the potential for using data is being fully realised in this school.
11.0 35.3 22.6 23.3 5.8 2.1
Classroom teachers have no time to look at the information generated by our data management system.
7.9 18.2 26.4 40.4 5.1 2.1
It is difficult to translate the information generated by data analysis into curriculum planning.
4.8 25.7 24.7 39.0 4.1 1.7
Data analysis tells us nothing that we don’t already know. 2.7 4.1 14.4 51.7 25.3 1.7
The analysis of data does not improve teaching and learning. 1.7 4.5 8.9 52.1 30.5 2.4
Respondents were asked to tick one box per row (see Appendix 1) - so each row sums to 100.

Secondary schools
151
There were some differences between subjects, although not across all statements. One noticeable trend was that, in several cases, science teachers showed a higher level of agreement than did mathematics teachers, who in turn showed a higher level of agreement than did English teachers. For example, 69 per cent of English teachers agreed with the statement that data has had a positive impact on learning compared to 79 per cent of mathematics teachers and 86 per cent of science teachers. When ratings were ‘scored’ from one to five (where one means ‘strongly agree and five means ‘strongly disagree’), there was a significant difference between the mean score of English teachers and those of both mathematics and Science teachers on three statements where most teachers agreed: those relating to underperformance, discussions of pupil performance and the impact on learning outcomes. In each case, heads of English departments agreed less strongly with these statements about the positive impact of data. There was also a significant difference between English and science teachers, with the latter disagreeing more strongly than English teachers that data analysis does not improve teaching and learning.
Other differences related to English teachers. They were more likely to agree that more training is needed to help staff interpret and use the information generated. A related point is that they were less likely than others to say that data are used by staff at all levels within their school. They were also more likely to report that they have no time to look at the data generated by their data management system and that data tells them nothing that they don’t already know. For these last two statements, the mean ratings of English teachers were significantly different from those of science and mathematics teachers.
For each of the statements in Question 7c, respondents were split into five groups according to the rating they had given. The mean KS3 performance measures and the mean KS2 to KS3 value-added measures of these groups were then compared. The statistically significant relationships are outlined below.
The schools of respondents who neither agreed nor disagreed with the statement - More training is needed to help staff interpret and use the information generated – had a significantly higher KS2-3 value-added mean than those who agreed or strongly agreed. (The respondents who disagreed with this statement also had higher value-added scores, but, as there were very few in each of these groups, no significant differences were found.) Respondents who neither agreed nor disagreed with this statement also had a higher KS3 performance mean compared to the groups who agreed with it. In other words departments with lower KS3 performance and schools adding the least value consider that they need more training in how to use data compared to higher performing departments.
Secondary schools
152
Heads of departments who disagreed, or neither agreed nor disagreed, with the statement - I do not feel the potential for using data is being fully realised in this school - had a higher KS3 performance measure than departments that agreed with the statement. A similar trend was identified with the KS2-3 value-added measure although the difference was not statistically significant. This suggests that departments with higher performance considered that data was being used effectively in their subjects or departments. Similarly, respondents who believe that - Data analysis tells us nothing that we don’t already know - had higher performance at key stage 3 than did those who disagreed or strongly disagreed with the statement.
Strong disagreement with the statement - The analysis of data does not improve teaching and learning – was associated with lower performance on KS3 tests : as agreement with the statement increased, so did performance. Hence, teachers agreeing most strongly that data use does improve teaching and learning worked in departments with the lowest levels of performance. However, although the trend was noticeable, only the difference between the teachers who responded ‘strongly disagree’ and those who responded ‘disagree’ was statistically significant. The trend could arise for various reasons. For example, it is possible that departments with lower KS3 performance have had to engage more closely than others with sources of data, and introduce strategies on the basis of such involvement. Such experience might then have informed their rating of this statement. There may be further plausible explanations.
Similarly, those who strongly agreed that - The analysis of data makes it easy to discuss the performance of this school with members of staff – had lower KS3 performance than the other ratings groups (the difference between this group and the ‘disagree’ group was statistically significant). Again such departments may have been encouraged to use and discuss data in order to improve their performance.
Finally, those heads of departments who agreed that - Classroom teachers have no time to look at the information generated by our data management system – had a higher KS3 performance than those who were not sure (and also higher performance than the groups who disagreed although these were not statistically significant).
To examine the relationship between all of these statements combined and school performance, agreements with ‘positive’ statements about the use of data were scored from five to one and agreements with ‘negative’ statements were scored from one to five to produce a total score for Q7c. In other words, the more positive the overall view of data the higher the score. This confirmed that lower scores, i.e. more negative views of data use, were associated with higher KS3 performance.

Secondary schools
153
5.7.2 Focus groups
Although there was a clear wish expressed by the majority of participants to use data analysis to improve teaching and learning, there was also a clear sense that the pressure of meeting government targets was often perceived to be at odds with their most noble intentions. One participant said:
It’s always as if we have to keep explaining ourselves, so the pressure that is put on those three subjects, because it is pressure in year 9 and then it is similar pressure at GCSE…
This was felt particularly acutely by teachers in the core subjects, as illustrated by these quotes:
… apart from the fact that we have all the kids, there are very few departments that have all the kids in key stage 4, so it is an added pressure for the fact that you know you have got to meet the targets and to have it on your back all the time. You are always waiting for the results to come in.
The thing I don’t like is that, certainly from what I’ve noticed, is the fact that there is a lot more information on maths, English and science than there is on any other subject, and the other subjects can sort of escape. There’s a sort of ‘Big Brother is watching you’ type of senior management.
Several participants expressed some wariness about how they considered that centralised reporting could be used against them, perhaps as part of their performance management, when they, themselves, felt that the judgements made were not best informed. For example:
For instance, last year in our year 9 who did the SATS exams; the maths were the same as the year before and obviously they were hoping that they would go up, but the science and English were like 20% down on what they had been, so there was a massive uproar. So they all got sent off to be remarked and they came back the same, no change! …. Then we get targets which are based on the SATS, and those targets had been doctored. To me, if we are going to use targets on the SATS, then the SATS don’t lie and that is how it is going to be. But what will happen there is those departments will either look like they have made exceptional progress for key stage 3 and key stage 4 and maths will look like it has done nothing.

Secondary schools
154
As with the primary groups, there were some participants who regarded having data available when discussing accountability issues as a positive thing. One described this as follows:
It’s crucial to us due to the problems we are having in our school – PANDA and obviously we are looking at the value added as well - all of this data supports the learning we are trying to do within our school but because of all the difficulties, people come in and say it’s a very bad school and what terrible results. It goes back to the justification of what we’re doing as opposed to anything that helps you get on with teaching kids. It’s like we have a defence.
Whereas some members of the group wanted to use it to bring their staff to task:
The beauty of the Assessment Tracker, as well, is that you can actually assign teaching group codes and identify staff as well.
Also [it] shows you how a member of staff might be performing. You can see within the groups the kids who never seem to do their homework, or he says they never do their homework or he says they do - you can start cross referencing.
5.7.3 Conclusions
Secondary school questionnaire respondents were generally positive about the
contribution using data has made to their self-evaluation and self-improvement.
Approximately a quarter claimed that the use of data has made a significant difference,
and, like their primary school counterparts, respondents from secondary schools observed
that it gave them a clear picture of their departments’ strengths and weaknesses and
informed planning. They also agreed that effective data management improves pupil
learning.
In terms of their overall perceptions of data use (as indicated by response to the
statements in Question 7c), generally, heads of English departments were less positive
than heads of mathematics or science departments.
Heads of departments with lower KS3 performance and lower KS2 to KS3 value-added
were more likely to agree that data use improves pupil learning and makes it easier to
discuss performance with their staff than high performing departments. They also report
wanting more training and thinking that the full potential of data use has not yet been
realised. Conversely, high-performing departments tended to place less value on the use
Secondary schools
155
of data than their lower performing counterparts. They did not appear to feel that it was
adding much to their knowledge and did not consider that they needed more training in
how to use it. Although they believed that the potential for using data has been realised in
their schools, they also claimed that class teachers do not have the time to look at the
information generated.
Whilst recognising the contribution data can make to teaching and learning, discussions in
the focus groups revealed than the heads of core subject departments have sometimes felt
that their performance is being judged on meeting targets rather than making real progress
(particularly if the data on which targets are based are not perceived as reliable). Although
some participants feel under pressure and that data is being used against them, others
view data use more positively and like some primary schools are using data defensively to
account for their performance.
5.8 Summary of findings and recommendations
Secondary schools indicated a preference for department specific tools and systems, such as Excel spreadsheets, due to their ease of access and flexibility of data manipulation.
Effective use of data in secondary schools is seen as depending upon:
• prompt delivery of reliable data
• compatible school management and assessment systems
• accessibility of data for all teaching staff
• manageability (including support for the input of data)
• sufficient time to interpret the data.
The main purposes of data analysis were reported as being: to identify underachievement;
to set targets; and to inform the grouping of pupils.
Effective practice in the use of data was seen to inform and facilitate:
• tailoring teaching to the needs of targeted groups
• identifying individuals and groups for additional support (e.g. booster groups, TA
support, etc)

Secondary schools
156
• reviews of teaching plans
• individual mentoring of pupils
• discussions with parents
• peer teaching and teacher observations
• applying for funding for specific projects
• encouraging pupils to take ownership of their learning goals.
Although there was general agreement over the perception that the use of data has made
an important contribution to self-evaluation and improvement, overall perceptions would
seem to have been influenced by the position of the school in the performance league
tables.

Summary of findings and recommendations
157
6 Summary of findings and recommendations
Teachers’ views expressed via the questionnaire and focus groups suggest that data only
becomes effective if it stimulates questions, discussion and action. The findings suggest
that use of data at school level can facilitate:
• more effective allocation of resources
• performance management
• monitoring and reviewing the effectiveness of initiatives and strategies
• evidence-based discussions with OFSTED, LEAs, governors, etc
• challenging expectations of staff/pupils/parents/etc
• transitions and transfers.
At pupil level, data:
• informs accurate curricular targets for individual pupils
• highlights weaknesses in specific topics for classes or groups
• highlights specific weaknesses for individual pupils
• provides evidence to support decisions as to where to focus resources and teaching
• informs setting and grouping of pupils.
The findings suggest that, in order to make more effective use of data, schools need systems that are simple to use, are well supported and therefore quickly build levels of confidence and familiarity. The requirements of schools can be summarized as follows:
• more information about what systems/tools are available and their capabilities
• consistency of advice about what they should use
• more involvement and explanation of why systems are being introduced (benefits
for different stakeholders) i.e. effective management of change

Summary of findings and recommendations
158
• easy to use systems that offer or allow:
– useful graphics
– year-on-year pupil tracking
– the input of internal assessment information
– finer levels of detail and tracking of progress in smaller steps (for pupils with special educational needs)
• training and support in the use and functioning of systems
• training and support in the interpretation of data outcomes and in how to use the
data to inform teaching and learning
• time to familiarize themselves with systems and their outcomes
• linkable or compatible systems, e.g. compatible school management and
assessment systems for ease of input, transfer and storage of data
• systems where data can be easily exported for staff use (i.e. systems that are
accessible to all staff or an effective data manager)
• prompt delivery of data from data providers (LEAs, DfES, OFSTED, etc)
• cluster groups/networks of schools to share effective practice.
In addition special schools need systems that allow meaningful comparisons to be made
and progress to be recognised (e.g. moderation of the P scales).
General recommendations
Support for schools and their staff to enable them to make more effective use of data could be offered at a number of different levels, including support from the DfES, LEAs and within the schools themselves.
• Raise awareness of data systems and their potential.
• Promote training and support in the use of data. There needs to be software training but also how to use the outcomes and how to share data with colleagues.

Summary of findings and recommendations
159
• Review demands on schools (Workforce Reform) to ensure staff have sufficient time to analyse data at a meaningful level.
• Encourage the sharing of good practice, e.g. through networks/ clusters of schools/ workshops.
• Encourage the appointment of dedicated co-ordinators to drive the process of interpretation and action (not just the input of data).
• Provide a means of comparing the performance of very low attaining pupils with special educational needs (e.g. moderation of the P scales).
Recommendations for the Pupil Achievement Tracker (PAT)
PAT users generally made positive comments about the visual presentation of data and the ability to compare groups of users. However, many questionnaire respondents and focus group participants found PAT very difficult to use and were confused as to how to input data. Back-up information provided with the package and the training offered by LEAs were both considered to be poor. There were also complaints of incompatibility with other school systems.
• Improve the compatibility of PAT with other schools’ systems.
• Make PAT easier to use, particularly the input of data.
• Clarify instructions and provide an ‘At a Glance’ Guide.
• Offer more information, training and support.

Summary of findings and recommendations
160

Appendix 1
Copies of Questionnaires:
1. Primary/Special
2. Secondary
A copy of the questionnaire for heads of English departments is shown. Questionnaires for heads of science and mathematics departments were identical, with the exception of the subject addressed.


Appendix 2
Schedule for Focus Group Meetings


The NFER is conducting a survey on behalf of the Department forEducation and Skills (DfES) on the use of data in primary, middle,secondary and special schools. The aim of the research is todiscover how data is used to promote effective teaching andlearning opportunities that lead to greater progression for identifiedindividuals and groups of pupils. One outcome will be to makerecommendations as to how to support schools in making effectiveuse of data, including the future development of the PupilAchievement Tracker (PAT).
Completion of this questionnaire is entirely voluntary. However, toensure that this survey represents as far as possible the schoolpopulation as a whole, it would be most helpful if you could assistus by completing this questionnaire. All information will be treatedas confidential and no individual or school will be identified in anyreport.
Schools’ Use of Data
SUD 3113-3115 QP

2
1 Which of the following best describes your current professional role(s)?
Please tick all that apply.
Headteacher 1
Deputy headteacher or assistant headteacher 2
Head of year or key stage 3
Assessment co-ordinator 4
Other; please specify:
Background Details
The questionnaire should be completed by the person in the school most appropriate to comment on the useof data and data management tools to promote learning. Where responsibilities are shared it would be helpfulif the person completing the questionnaire could consult with colleagues on relevant questions.
Please return your completed questionnaire to the NFER, using the prepaid envelope supplied, by Thursday24th March 2005.
If you prefer to complete this questionnaire online, please go to www.nfer.ac.uk/sud and enter your login ID,which is on the top right hand corner of this questionnaire. Your password is SUD.
If you have any queries please contact:
David Hereward
Research Data ServicesNational Foundation for Educational ResearchThe MereUpton ParkSloughBerkshireSL1 2DQ
Tel: 01753 637352E-mail: [email protected]
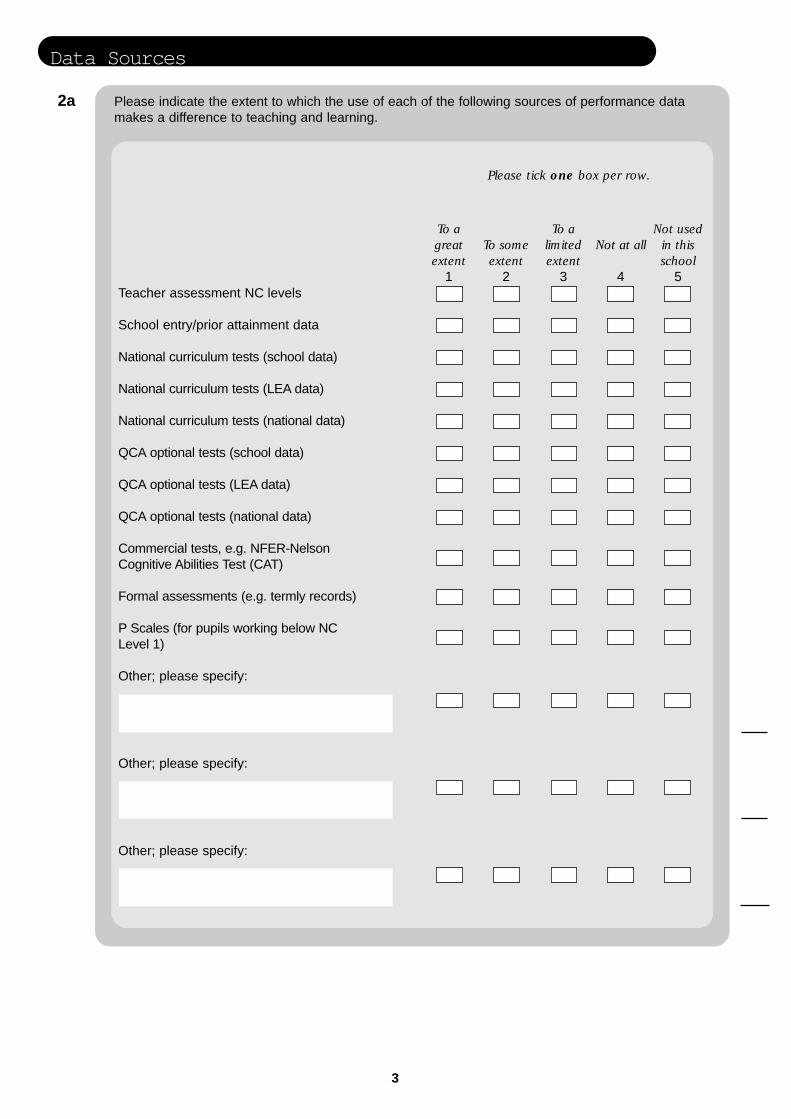
3
Data Sources
2a Please indicate the extent to which the use of each of the following sources of performance data makes a difference to teaching and learning.
Teacher assessment NC levels
School entry/prior attainment data
National curriculum tests (school data)
National curriculum tests (LEA data)
National curriculum tests (national data)
QCA optional tests (school data)
QCA optional tests (LEA data)
QCA optional tests (national data)
Commercial tests, e.g. NFER-NelsonCognitive Abilities Test (CAT)
Formal assessments (e.g. termly records)
P Scales (for pupils working below NCLevel 1)
Other; please specify:
Other; please specify:
Other; please specify:
Please tick one box per row.
To agreatextent
1
To someextent
2
To alimitedextent
3
Not at all
4
Not usedin thisschool
5

4
2b Please indicate the extent to which the use of each of the following sources of additional data makes adifference to teaching and learning.
Pupil attendance data
Free school meals data
Data on pupils with specialeducational needs
Data on gifted and talented pupils
Data on pupils’ ethnic groups
Data on pupils learning English as anadditional language
Data on exclusions
Staff turnover data
Other; please specify:
Other; please specify:
Other; please specify:
To agreatextent
1
To someextent
2
To alimitedextent
3
Not at all
4
Not usedin thisschool
5
cont…
Please tick one box per row.

5
Data Management Tools/Analysis Systems
3a Please indicate:
Pupil Achievement Tracker (PAT) 1Ofsted Performance and AssessmentReports (PANDA) 2
Fischer Family Trust analysis 3
Pearson Phoenix e1 4
Assess IT (Pearson Phoenix) 5
GOAL SCI Programme 6
Integris (RM) 7
SIMS.net (Capita Education) 8
TargSATS 9
Target Tracker 10
Connecting Steps/G.A.P. (B Squared) 11
PIVATS 12
Equals 13
Individualised Information System(B Track) 14
The Middle Years Information System(MiDYIS) 15
ASPECTS or PIPS (CEM University ofDurham) 16
System devised by your LEA 17
System devised by another LEA;please specify:
School-devised system 18
Excel spreadsheets 19
Other management information system,(MIS); please specify:
tick allthat apply
To agreatextent
1
To someextent
2
To alimitedextent
3
Not at all
4
The extent to which the use of thesetools makes a difference to
teaching and learning.tick one box per row
Data managementtools/systems
used in this school

6
3b If you use a school-devised system, please describe what this does.
3c Which is the most useful data management tool or system used in your school?
3d Please indicate the main advantages of this data management tool or system?
Please tick all that apply.
Data is easily exportable 1
Web-based system 2
Inexpensive system 3
Easy to use 4
Easy to input own data 5
Easy to input data from other sources 6
All the analysis needed by my school is on one system 7
Easy to read/interpret the information provided 8
Provides question/item level detail 9
Provides information/reports for parents 10
Other; please specify:
Other; please specify:
Other; please specify:
3e Please comment further, if you wish, about the reasons why you use your data management tool(s) in preference to other systems.
cont…

7
Use of Data
4a Please indicate the three most important purposes for which data analysis is used in your school.
4b Please describe the most common types of interventions/strategies employed by your school, where data analysis has highlighted issues to be addressed.

8
cont…
Transitions
4c What contribution has the use of pupil data made to your school’s evaluation of its performance?
4d What are the barriers or challenges to the use of pupil data to improve learning?
5a How useful do you consider your data management system to be at each of the following times?
Transitions between key stages within the school
Receiving and interpreting information from feederschools (at the end of a key stage)
Preparing and sending information to receiving schools (at the end of a key stage)
Transitions at other times
5b Please explain how data are used to support transitions between key stages within your school.
5c Please explain how data are used to support transfers when pupils enter your school.
Not at alluseful
1
Not veryuseful
2
Notsure
3Useful
4
Veryuseful
5
Please tick one box per row.

9
Dissemination of Data
6a Please indicate which of the following members of staff use data analysis to inform teaching andlearning, and provide an indication of their typical usage.
(Where individuals have more than one role, please indicate usage relating to each role separately.)
Headteacher 1
Deputy headteacher/Assistant headteacher 2
Head of year/key stage 3
Head of department/subject 4
Assessment co-ordinators 5
Class teachers 6
Teaching assistants 7
Administrative support staff 8
Other; please specify:
Other; please specify:
6b In your school, which of the following methods are used to ensure that colleagues and other stakeholders are aware of the information generated by your analysis of data?
Please tick all that apply.
Presentations/written information to SMT 1
Presentations/written information to teaching staff 2
Presentations/written information to governors 3
Presentations/written information to parents 4
Presentations/written information to pupils 5
Meetings between class teachers 6
Use of training days (e.g. INSET) 7
Other; please specify: Other; please specify:
Who uses the data?
tick all that apply
Typical Usage (tick one)
Rarely1
Sometimes2
Frequently3

10
7a Data management tools can be used to guide improvements in pupils’ learning. To what extent do you consider that your school’s use of data management tool(s) improves pupil learning?
Please circle one number.
7b In your school, how do you assess the effectiveness of your data management tool(s) in improving pupil learning?
Please tick all that apply.
We collect anecdotal evidence of progress in learning from teachers in the school. 1
We collect relevant examples of pupils’ work to demonstrate progress in learning. 2
We review summative teacher assessment outcomes over time. 3
We review end-of-key-stage test/examination results over time. 4
We record each pupil’s progress in learning each term. 5
We review each pupil’s achievements in comparison with targets set. 6
We compare achievements in particular year groups with those of previous cohorts in the school. 7
We compare pupil achievement with that in similar local schools. 8
We compare pupil achievement with that in similar schools nationally. 9
Other; please specify:
To a greatextent
To someextent Not sure To a limited
extent Not at all
1 2 3 4 5
Judging the Effectiveness of Data Management

11
cont…
7c Please indicate the extent of your agreement with the following statements:
Analysing data has had a positive impact on learningoutcomes in my school.
Data management tools simplify the process ofsetting school targets.
It is difficult to translate the information generatedby data analysis into curriculum planning.
I do not feel the potential for using data is being fullyrealised in this school.
The analysis of data does not improve teaching andlearning.
The analysis of data makes it easy to discuss theperformance of this school with members of staff.
Data analysis has helped to identify training needsin my school.
Data analysis has helped to identify pupils who areunder-performing.
Data analysis has helped to identify areas of teaching/learning that need to be addressed in this school.
Classroom teachers have no time to look at theinformation generated by our data management system.
The use of data is supporting Assessment for Learning.
Data are used by staff at all levels within this school.
More training is needed to help staff interpret and usethe information generated.
Data analysis tells us nothing that we don’t alreadyknow.
Please tick one box per row.
Stronglyagree
1Agree
2
Neitheragree nordisagree
3Disagree
4
Stronglydisagree
5

12
Advantages and Disadvantages of Data Management Systems
The Pupil Achievement Tracker (PAT) is a diagnostic data management tool developed by the Department for Education and Skills (DfES).
8a Have you used the Pupil Achievement Tracker (PAT)?
Yes, in this school Go to 8b Yes, in another school Go to 8b No Go to 8d
8b If yes, what do you think are the most useful aspects of PAT?
8c What improvements to PAT would you like to see made?
8d Would you be willing to participate in a focus group to discuss the use of data and data management tools in your school in more depth?
The focus groups will take place in London, Birmingham and Manchester during the period 18-29 April 2005 (Supply cover and expenses would be provided).
Yes No
If yes, please print your full name clearly so that we may contact you again if necessary.
Name:
Thank you for taking the time to complete this questionnaire.

The NFER is conducting a survey on behalf of the Department forEducation and Skills (DfES) on the use of data in primary, middle,secondary and special schools. The aim of the research is todiscover how data is used to promote effective teaching andlearning opportunities that lead to greater progression for identifiedindividuals and groups of pupils. One outcome will be to makerecommendations as to how to support schools in making effectiveuse of data, including the future development of the PupilAchievement Tracker (PAT).
Completion of this questionnaire is entirely voluntary. However, toensure that this survey represents as far as possible the schoolpopulation as a whole, it would be most helpful if you could assistus by completing this questionnaire. All information will be treatedas confidential and no individual or school will be identified in anyreport.
This questionnaire should be completed by the Head of the English department in your school.
Schools’ Use of Data
SUD 3113-3115 QE

2
1 Which of the following best describes your current professional role(s)?
Please tick all that apply.
Head of English department 1
Headteacher 2
Deputy headteacher or assistant headteacher 3
Head of year or key stage 4
Other; please specify:
Background Details
Please return your completed questionnaire to the NFER, using the prepaid envelope supplied, by Thursday24th March 2005.
If you prefer to complete this questionnaire online, please go to www.nfer.ac.uk/sud and enter your login ID,which is on the top right hand corner of this questionnaire. Your password is SUDE.
If you have any queries please contact:
David Hereward
Research Data ServicesNational Foundation for Educational ResearchThe MereUpton ParkSloughBerkshireSL1 2DQ
Tel: 01753 637352E-mail: [email protected]

3
Data Sources
2a Please indicate the extent to which the use of each of the following sources of performance data makes a difference to the teaching and learning of English.
Teacher assessment NC levels
School entry/prior attainment data
National curriculum tests (school data)
National curriculum tests (LEA data)
National curriculum tests (national data)
QCA optional tests (school data)
QCA optional tests (LEA data)
QCA optional tests (national data)
Commercial tests, e.g. NFER-NelsonCognitive Abilities Test (CAT)
Formal assessments (e.g. termly records)
P Scales (for pupils working below NCLevel 1)
GCSE/GNVQ/etc (school data)
GCSE/GNVQ/etc (LEA data)
GCSE/GNVQ/etc (national data)
Other; please specify:
Other; please specify:
Please tick one box per row.
To agreatextent
1
To someextent
2
To alimitedextent
3
Not at all
4
Not usedin thisschool
5

4
2b Please indicate the extent to which the use of each of the following sources of additional data makes adifference to the teaching and learning of English.
Pupil attendance data
Free school meals data
Data on pupils with specialeducational needs
Data on gifted and talented pupils
Data on pupils’ ethnic groups
Data on pupils learning English as anadditional language
Data on exclusions
Staff turnover data
Other; please specify:
Other; please specify:
Other; please specify:
To agreatextent
1
To someextent
2
To alimitedextent
3
Not at all
4
Not usedin thisschool
5
cont…
Please tick one box per row.

5
Data Management Tools/Analysis Systems
3a Please indicate:
Pupil Achievement Tracker (PAT) 1Ofsted Performance and AssessmentReports (PANDA) 2
Fischer Family Trust analysis 3
Pearson Phoenix e1 4
Assess IT (Pearson Phoenix) 5
GOAL SCI Programme 6
Integris (RM) 7
SIMS.net (Capita Education) 8
TargSATS 9
Target Tracker 10
Connecting Steps/G.A.P. (B Squared) 11
PIVATS 12
Equals 13
Individualised Information System(B Track) 14
The Middle Years Information System(MiDYIS) 15
YELLIS (CEM University ofDurham) 16
System devised by your LEA 17
System devised by another LEA;please specify:
School-devised system 18
Excel spreadsheets 19
Other management information system,(MIS); please specify:
tick allthat apply
To agreatextent
1
To someextent
2
To alimitedextent
3
Not at all
4
The extent to which the use of thesetools makes a difference to the
teaching and learning of English.tick one box per row
Data managementtools/systems
used in this school

6
3b If you use a school-devised system, please describe what this does.
3c Of the data management tools or systems used in your school, which is the most useful for the teaching and learning of English?
3d Please indicate the main advantages of this data management tool or system?
Please tick all that apply.
Data is easily exportable 1
Web-based system 2
Inexpensive system 3
Easy to use 4
Easy to input own data 5
Easy to input data from other sources 6
All the analysis needed by my department is on one system 7
Easy to read/interpret the information provided 8
Provides question/item level detail 9
Provides information/reports for parents 10
Other; please specify:
Other; please specify:
3e Please comment further, if you wish, about the reasons why you use your data management tool(s) in preference to other systems.
cont…

7
Use of Data
4a Please indicate the three most important purposes for which data analysis is used in your department.
4b Please describe the most common types of interventions/strategies employed by you and other colleagues in your department, where data analysis has highlighted issues to be addressed.

8
cont…
Transitions
Not at alluseful
1
Not veryuseful
2
Notsure
3Useful
4
Veryuseful
5
Please tick one box per row.
4c What contribution has the use of pupil data made to your department’s evaluation of its performance?
4d What are the barriers or challenges to the use of pupil data to improve the teaching and learning of English?
5a With regard to the teaching and learning of English, how useful do you consider your data management system to be at each of the following times?
Transitions between key stages within the school
Receiving and interpreting information from feederschools (at the end of a key stage)
Preparing and sending information to receiving schools (at the end of a key stage)
Transitions at other times
5b Please explain how data are used to support transitions between key stages within your school.
5c Please explain how data are used to support transfers when pupils enter your school.

9
Dissemination of Data
6a Please indicate which of the following members of staff use data analysis to inform teaching andlearning, and provide an indication of their typical usage.
(Where individuals have more than one role, please indicate usage relating to each role separately.)
Head of department/subject 1
Class teachers 2
Teaching assistants 3
Administrative support staff 4
Other; please specify:
Other; please specify:
6b In your school, which of the following methods are used to ensure that colleagues and other stakeholders are aware of the information generated by your analysis of data?
Please tick all that apply.
Presentations/written information to SMT 1
Presentations/written information to teaching staff 2
Presentations/written information to governors 3
Presentations/written information to parents 4
Presentations/written information to pupils 5
Meetings between class teachers 6
Use of training days (e.g. INSET) 7
Other; please specify: Other; please specify:
Who uses the data in your department?
tick all that apply
Typical Usage (tick one)
Rarely1
Sometimes2
Frequently3

10
7a Data management tools can be used to guide improvements in pupils’ learning. To what extent do you consider that your department’s use of data management tool(s) improves pupil learning?
Please circle one number.
7b In your department, how do you assess the effectiveness of your data management tool(s) in improving pupil learning?
Please tick all that apply.
We collect anecdotal evidence of progress in learning from teachers in the department. 1
We collect relevant examples of pupils’ work to demonstrate progress in learning. 2
We review summative teacher assessment outcomes over time. 3
We review end-of-key-stage test/examination results over time. 4
We record each pupil’s progress in learning each term. 5
We review each pupil’s achievements in comparison with targets set. 6
We compare achievements in particular year groups with those of previous cohorts in the school. 7
We compare pupil achievement with that in similar local schools. 8
We compare pupil achievement with that in similar schools nationally. 9
Other; please specify:
To a greatextent
To someextent Not sure To a limited
extent Not at all
1 2 3 4 5
Judging the Effectiveness of Data Management

11
cont…
7c Please indicate the extent of your agreement with the following statements:
Analysing data has had a positive impact on learningoutcomes in my department.
It is difficult to translate the information generatedby data analysis into curriculum planning.
I do not feel the potential for using data is being fullyrealised in this school.
The analysis of data does not improve teaching andlearning.
The analysis of data makes it easy to discuss pupilperformance with members of my department.
Data analysis has helped to identify training needsin my department.
Data analysis has helped to identify pupils who areunder-performing.
Data analysis has helped to identify areas of teaching/learning in English that need to be addressed.
Subject teachers have no time to look at theinformation generated by our data management system.
The use of data is supporting Assessment for Learning.
Data are used by staff at all levels within this school.
More training is needed to help staff interpret and usethe information generated.
Data analysis tells us nothing that we don’t alreadyknow.
Please tick one box per row.
Stronglyagree
1Agree
2
Neitheragree nordisagree
3Disagree
4
Stronglydisagree
5

12
Advantages and Disadvantages of Data Management Systems
The Pupil Achievement Tracker (PAT) is a diagnostic data management tool developed by the Department for Education and Skills (DfES).
8a Have you used the Pupil Achievement Tracker (PAT)?
Yes, in this school Go to 8b Yes, in another school Go to 8b No Go to 8d
8b If yes, what do you think are the most useful aspects of PAT?
8c What improvements to PAT would you like to see made?
8d Would you be willing to participate in a focus group to discuss the use of data and data management tools in your school in more depth?
The focus groups will take place in London, Birmingham and Manchester during the period 18-29 April 2005 (Supply cover and expenses would be provided).
Yes No
If yes, please print your full name clearly so that we may contact you again if necessary.
Name:
Thank you for taking the time to complete this questionnaire.

Appendix 2 page 1
Appendix 2
Focus Group Meetings
The Background
Aims 1. To discover how data is used to promote the type of teaching and learning
opportunities that lead to improved progression of pupils 2. Challenges to the use of data 3. To find out how best to support schools in making effective use of data, including
improvements to the PAT
Survey of schools underway. Some trends beginning to be identified. We would like to explore these further and identify any differences between primary and secondary schools and across different subject areas. We also want to explore the needs of special schools.
The main focus of our discussions will be the ways in which schools can use data effectively and make a positive contribution to improvements in teaching and learning. (It is possible that such improvements will result from management decisions taken in response to the analysis of data collected or provided and we would wish to explore these as well).
We want to explore the different purposes for data collection, what use it is being put to and what bits of software are perceived to help pupil achievement.
The main areas for discussion are outlined on the agenda as follows:
What do we mean by data?
Explore the group’s definition/understanding of the term and the different types of data they use.
Data systems in your school, how they are used and by whom?
What information is stored on your database? (Is it National data or internal school data?) What information management systems do you use? Which features of your system support understanding and use of performance data – i.e. what makes a difference to your school?

Appendix 2 – page 2
If you use PAT – How are you using it? Which aspects are most useful, and for whom? What prompted you to use it? How much was the decision driven by the LEA? What training was available? ( for whom?) What aspects of the training were most valuable?
If you do not use PAT - What are the reasons you have chosen not to? Do you know what data can be made available and how it might be used? What other systems do you use? Why are these preferred? What features do these have that PAT does not? What improvements would you like to see?(timing issues?)
Do you know how your use of data compares with neighbouring schools? Who inputs the data?
[If not brought up in discussion – further probes - Would you use the PAT if it was merged with the PANDA, available online and pre-populated with your school's data? How could PAT be improved to be of more use to schools with SEN pupils/ to include the achievement of pupils with SEN? How do they analyse/ compare the progress of pupils with SEN now and what information/ comparisons would be useful to them. ]
Who uses it - and what are the different tiers of use? What is it used for? Are there different ways in which the data can be used? How is meaningful dialogue about the data generated? What level of data is/would be most useful to heads/heads of departments/ subject specialists/ assessment co-ordinators/ heads of year/ class teachers? How far would they like the data to be broken down (NC levels, sub-NC levels, topics, question level, etc?
To what extent does the collection/use of data impact throughout your school?
What difference has it made to your school? What difference does it make having the data available?
Does (or could) data enable you to make improvements to teaching and learning in your school?
Explore reasons why/ why not – which data makes most difference to learning?
In what ways can it be used effectively? Does data improve teaching in your school? (How/why not?)
What do you do with the data? How is it analysed? How does the analysis affect what happens in the classroom?

Appendix 2 page 3
[Ask for examples where data has been used effectively to identify and then tackle underachievement. How does it work in your school? Probe effective use in setting curricular targets. Explore consistency amongst teachers/ subjects.]
Is your use of data effective?
How do you evaluate whether the time/effort involved is of value? Is there any evidence? How do you evaluate the effect your use of data has on pupils (in terms of performance, motivation, etc).
[Ask participants to share examples of effective practice from their schools.]
How is information disseminated to staff? How is data shared with governors, parents and pupils?
Could your system be put to better use? How? How can you use performance data effectively alongside information on pupil attendance, behaviour, motivation, social factors, etc
What are the challenges facing schools in making effective use of data?
What data is useful during periods of transition and or transfer? [Clarify transition as between one year and the next – as well as KS transition] How is performance data used effectively? How do you use what you record? Do receiving teachers want anything other than level data?(NC scores)
Have you encountered any difficulties transferring data? (coming in or going out)
What do schools need to make the most effective use of the data available?
What internal/ external support have you had/is needed to help you to make most effective use of data?
Explore issues of training, LEA requirements, software suppliers
Who has access? Is everyone able to take advantage of the information that is available? Do people know what is available?.
How you feel data should be used in an ideal world?

Appendix 2 – page 4
Some schools prefer to use systems they have devised themselves How do you see different systems working alongside each other?
What are the challenges/obstacles to using data in this way?
Explore the barriers

Appendix 3
Glossary


Appendix 3 – page 1
Appendix 3
Glossary
ADHD Attention deficit/ hyperactivity disorder
ALIS A Level Information System (from CEM)
ALS Additional Literacy Support
AM6 Assessment Manager 6 (latest version of the assessment suite from
SIMS.net)
ASDAN Award Scheme Development and Accreditation Network (used as part
of an alternative curriculum for students 14-19 (personal, social and
active citizenship skills, work-related skills, key skills)
ASPECTS Assessment Profile on Entry for Children and Toddlers (from CEM)
Assess IT Assessment management system from Pearson Phoenix (also produces
Phoenix Gold and Pearson Phoenix e1 (integrated management
information systems)
B Squared An organisation producing paper-based and software assessment
packages based on the P scales (for very low attaining pupils with
special educational needs)
CAT Cognitive Ability Test (publisher nferNelson)
CEM Curriculum, Evaluation and Management Centre, University of Durham
CMIS Central Management Information System
DfES Department for Education and Skills

Appendix 3 – page 2
ELS Early Literacy Support
EPAR A software package originally designed around the requirements of a
special school for pupils with severe learning difficulties
Equals An organisation offering an assessment package for pupils with severe
learning difficulties based on the P scales (called PACE), plus a data
collection and analysis service
FFT Fischer Family Trust - provides analyses and data which help LEAs and
schools to make more effective use of pupil performance data
FSP Foundation Stage Profile – a statutory assessment at the end of the
foundation stage (pupils aged 3-5)
G&T Gifted and talented pupils
IEP Individual education plan (for all children with special educational
needs)
Integris School management information system suite from Research Machines
(RM)
KS Key stage (the four stages of national curriculum: KS1 for pupils aged 5-
7; KS2 for 7-11; KS3 for 11-14; KS4 for 14-16)
LEA Local education authority
MidYIS Middle Years Information System ( from CEM)
MLD Moderate learning difficulties
NC National curriculum (for state-maintained schools in England)
NFER National Foundation for Educational Research

Appendix 3 – page 3
NPD National Pupil Database
NQT Newly qualified teacher
OFSTED Office for Standards in Education
P scales Assessment criteria for progress below level one in the national
curriculum programmes of study
PANDA Performance and Assessment Report (OFSTED)
PASS Performance Analysis Service for Schools (from NFER)
PAT Pupil Achievement Tracker (DfES)
PIPS Performance Indicators in Primary Schools (from CEM)
PIVATS Performance Indicators for Value Added Target Setting (an assessment
instrument based on the P scales, produced by Lancashire County
Council)
PMLD Profound and multiple learning difficulties
QCA Qualifications and Curriculum Authority
SATs Unofficial term used by teachers to refer to the national curriculum key
stage statutory assessment tests (SATs originally stood for Standard
Assessment Tasks, but this term was subsequently dropped)
SEBD Social, emotional and behavioural difficulties
SENCO Special educational needs co-ordinator
SIMS.net Schools Information Management System (from Capita Education)
SMT Senior management team

Appendix 3 – page 4
TA Teacher assessment (in assessment context)
TA Teaching assistant (when used in context of classroom support)
Target Tracker System developed by Essex County Council Advisory and Inspection
Service for primary schools
TargSATS Target setting and assessment software
YELLIS Year 11 Information System (from CEM)

Appendix 4
Project Team


Appendix 4 – page 1
Appendix 4
Project team
Project Director Chris Whetton
Researchers Catherine Kirkup
Linda Sturman
Kate Lewis
Juliet Sizmur
Statisticians Jo Morrison
Emma Whittinger
Administration and secretarial support Margaret Parfitt
Research Data Services David Hereward
Janice Walker
Database Production Group Edward Wallis
Design Team Melanie Laws
Nicky Karn


Copies of this publication can be obtained from:
DfES PublicationsP.O. Box 5050Sherwood ParkAnnesleyNottinghamNG15 0DJ
Tel: 0845 60 222 60Fax: 0845 60 333 60Minicom: 0845 60 555 60Oneline: www.dfespublications.gov.uk
© NFER Trading Ltd 2005
Produced by the Department for Education and Skills
ISBN 1 84478 551 3Ref No: RR671www.dfes.go.uk/research