School Year 2012–13 School Scorecard User Guideprofiles.dcps.dc.gov/pdf/DCPS Scorecard User...
24
School Year 2012–13 School Scorecard User Guide
Transcript of School Year 2012–13 School Scorecard User Guideprofiles.dcps.dc.gov/pdf/DCPS Scorecard User...

School Year 2012–13
School Scorecard User Guide


2012–13 S c h o o l S c o r e c a r d u S e r g u i d e
Scorecard Overview 1Purpose and Uses 2
Purpose 2Who should use the scorecard and how? 2
School Profile 3
Scorecard Metrics 4
Additional Information and Next Steps 5
Scorecard Metric Detail 6Important Metric Information 7
Background on the DC Comprehensive Assessment System 7Definitions of scorecard templates 7District averages 7Minimum group size 7
Metric Descriptions 8Student Performance 8Student Progress 10Safe and Effective Schools 12Family and Community Engagement 15
Appendix I: Stakeholder Satisfaction Survey Metrics 16


1
Scorecard Overview
This section describes the purpose, uses, and overall layout of the scorecard.

2012–13 S c h o o l S c o r e c a r d u S e r g u i d e
2
PurPoSe AND uSeSPurposeThe purpose of the scorecard is to give parents, students, and community members in the District of columbia a clear, objective picture of school performance. By incorporating multiple measures of school quality into one tool, the scorecard presents a unique opportunity to compare schools’ strengths and weaknesses across the District.
Scorecards are available both in print and online at profiles.dcps.dc.gov. This User Guide is designed to help school staff and community members understand the various components of the scorecard as well as provide additional technical detail on each of the metrics displayed.
Parents seeking more information on their student’s performance should contact their school principal. Suggestions for future releases of the scorecard can be addressed to the DcPS office of Data and accountability at [email protected].
Who should use the scorecard and how?
StuDeNtS AND theIr fAMIlIeS
compare schools’ performance in advance of the out-of-Boundary lottery each year
review each application high school’s profile to choose the right school for your secondary experience
highlight successes when fundraising for various school events
Talk about the scorecard with your student’s teacher during parent-teacher conferences
Discuss the scorecard with other parents at community meetings
School ADMINIStrAtorS AND StAff
Distribute print copies of the scorecard during Back to School Night and other parent events
Discuss areas for improvement with school staff at faculty meetings
Present the scorecard with your comprehensive School Plan to your local School advisory Team
highlight successes on your school website

2012–13 S c h o o l S c o r e c a r d u S e r g u i d e
3
Dear Parent or Guardian,
You are the first teacher and most important partner in your child’s education. As a result, you need high-quality information on the performance of DCPS schools and the District overall. This scorecard provides important facts related to student performance, school facilities, and the academic and extracurricular opportunities available at this school. Taken together, I believe these data can help you make the best, most informed decisions possible related to your child’s education.
While the data on this scorecard objectively illustrate the progress of this school, the best way to gauge a school’s quality is to get involved. Be sure to review the back page of this document for ideas on engaging with your school community, such as volunteering or attending parent-teacher conferences. You can also compare schools’ programs and performance online at www.dcps.dc.gov/profiles.
It’s my hope that you use this information to hold principals, school staff and my office accountable for continuing to improve the quality of education available to your family.
Sincerely,
Kaya Henderson Chancellor
2012–13 S c h o o l S c o r e c a r d
elementary and Secondary education act claSSification
Student demograPhicS (2011–12)
academic enrichment WellneSS and fitneSS artS and culture
3 4 5 6 7 8
M
1 2 81 2
ProgramS (2012–13)
Enrollment:
McKinley Technology HighSchool
WARD
5GRADES
9th-12th
151 T St. NE Washington, DC 20002Phone: (202) 281-3950 | Fax: (202) 576-6279Principal: David Pinder | [email protected] Site: www.dcps.dc.gov/DCPS/mckinleySchool Hours: 8:45 a.m. – 3:15 p.m.
McKinley Technology High School is one of five specializedsecondary schools in the district. It is the Science, Technology,
Engineering and Mathematics (STEM) high school for the district offering a comprehensive schoolexperience and specialized instruction opportunities in biotechnology, engineering, informationtechnology and mass media technology. McKinleys STEM curriculum, state of the art technology,Advanced Placement offerings and emphasis on critical thinking and problem solving make it particularlydesirable for students interested in the math and science fields. Our motto is "No excuses. Justsolutions!"
•AP Statistics•SAT Prep•AP Calculus•AP US History•AP Biology•AP Chemistry•AP Physics•AP Language•AP Literature•AP Spanish
•Football•Best Friends Foundation
(Reproductive Health)•Boys and Girls Cross Country•Boys and Girls Soccer•Cheerleading•Boys and Girls Basketball•Boys and Girls Swim Team•Boys and Girls Indoor and
Outdoor Track•Baseball/Softball•Golf
•Dance/Flag team•Future Business Leaders of
America (FBLA)•Drama Club•Chess Club•Drumline•Debate Team•CSI Biotech•Urban Game Design - BtheGame•Yearbook•Band/Choir
Reward — Reward schools have the highest levels of student performance and growth as demonstrated by anoverall index score at or above 80 or growth in overall index score that falls in the top 5% of all schools in DC.
670English language learners: 1%
Free and reduced-price lunch: 52%
Special education: 2%
In boundary: 0%
Average core class size: 21
Black: 93%Hispanic/Latino: 4%White: 0%Asian: 0%Pacific/Hawaiian: 0%Native/Alaskan: 1%Multiple races: 1%
School ProfIle
The front page of the scorecard is designed to provide a high-level profile of the school, including a photograph of the school building and information about its programs and community partnerships. The majority of this information is reported directly by school principals and academic leadership teams.
These represent programs at a school focused on developing students’ artistic talents.
These represent programs at school that support the physical and/or mental well-being of students.
These represent programs at a school that support students’ academic progress.

2012–13 S c h o o l S c o r e c a r d u S e r g u i d e
4
ScorecArD MetrIcS
The metrics within the scorecard are aligned to the effective Schools Framework and address five areas of school effectiveness: Student Performance, Student Progress, Safe and effective Schools, Family and community engagement, and Unique School Indicators. (Note that scorecards for Mamie D. lee, Sharpe health School, choIce academy, Youth Services center, and Incarcerated Youth Program do not currently include these metrics.)
With a few exceptions, data are displayed for school years 2010–11 and 2011–12 so school performance can be tracked over time.
each metric contains a brief description of its definition and data source. More detail on each metric is provided in this User Guide.
District averages (for 2011–12) are displayed when available beneath the 2011–12 bar graph.
2012–13 S c h o o l S c o r e c a r d
Student Performance
0 100 What doeS thiS mean?
Student math performance 2011
The percentage of students achieving at each proficiency level on the District of Columbia’s Comprehensive Assessment System (DC CAS or DC CAS Alt).
2012
District Average
Student reading performance 2011
2012
District Average
Graduation rate 20112012
District Average
The percentage of students who enrolled in 9th grade for the first time four years ago and graduated with a standard diploma.
5-year graduation rate 20112012
District Average
The percentage of students who enrolled in 9th grade for the first time five years ago and graduated with a standard diploma.
College enrollment 20102011
District Average
The percentage of students graduating in June or August that are registered at a college or university the fall following their high school graduation. Data availability lags by one year, meaning results for 2011 are based on students graduating high school in summer 2010.
Advanced Placement performance
20112012
District Average
The percentage of students participating in an Advanced Placement examination and scoring 3, 4 or 5. These scores generally enable students to receive college credit.
Compared to student performance, which signals the share of students achieving at various levels, student progress is a measure of how much students grow from year to year. While some schools may have relatively few students meeting or exceeding state standards, it is important to gauge the extent to which those schools help students catch up.
0 100 What doeS thiS mean?
First-time 9th grade completion
2011 The percentage of first-time 9th grade students who earned enough credits to be promoted to 10th grade and are on track for graduation.2012
District Average
Student growth in math 2011This score describes the percentage of students the median (middle) student outperforms who started with a similar level of prior achievement on the District of Columbia’s Comprehensive Assessment System (DC CAS or DC CAS Alt). For example, a score of 70 means that this school’s median student outperformed more than 70 percent of students in the District with the same level of prior achievement.
2012District Average
Student growth in reading
20112012
District Average
Student ProgreSS
Results of annual, standardized assessments don’t describe the full school experience, but they do provide the most accurate and reliable signal of student performance. Every DCPS school should demonstrate progress in the core areas of math and reading, as well as cultivate students and faculty focused on improving performance through outstanding teaching and learning.
■ Below Basic ■ Basic ■ Proficient ■ Advanced
■ Below Basic ■ Basic ■ Proficient ■ Advanced
12% 77% 10%
McKinley Technology High School
75% Coming soon
85% 83%
58 76
60 55
95% N/A
94%
91%
8% 72% 20%
12% 68% 20%
8% 67% 24%
56%
Coming soon
Coming soon
20% 34% 33% 13%
19% 37% 34% 10%
29%
13%
9%
62%
46
47
2012–13 S c h o o l S c o r e c a r d
DCPS believes that all schools must provide caring and supportive environments. School environments that are safe and welcoming better enable students and staff to learn and teach.
Safe and effective SchoolS
0 100 What doeS thiS mean?
Student in-seat attendance
2011
2012 District Average
The average percentage of students attending school daily.
School safety 20092011
District Average
A score that represents student, parent and staff perceptions of safety and order at this school. The scale is from 0 to 100, and the score is based on the results of a stakeholder survey given every two years.
Expulsions and suspensions
2011
2012District Average
The percentage of students who were expelled or suspended long term (11 or more days).
Serious student misbehavior
2011
2012District Average
The number of expulsions and long-term suspensions for the most serious student misbehavior at this school per 100 students.
Student re-enrollment 2011
2012District Average
The percentage of students who returned to school the following year. This does not include students in the school’s highest grade level.
Student engagement 2009
2011District Average
A score that signals students’ level of effort and interest in their classes, as well as students’ confidence in their own educational success. The scale is from 0 to 100, and the score is based on the results of a student survey given every two years.
Retention of effective and highly effective teachers
2011
2012District Average
The percentage of teachers rated Effective or Highly Effective by DC Public Schools’ IMPACT evaluation system who are returning to this school from the previous year.
0 100 What doeS thiS mean?
Community satisfaction 2009
2011District Average
A score that represents overall student, parent and staff satisfaction with this school. The scale is from 0 to 100, and the score is based on the results of a stakeholder survey given every two years.
Parent engagement 2009
2011District Average
A score that represents how well and how often parents felt this school engaged and communicated with them. The scale is from 0 to 100, and the score is based on the results of a parent survey given every two years.
Survey response rate 2009
2011District Average
Percentage of parent surveys returned.
Families and community members play key roles in helping students and schools thrive. When parents, guardians and family members feel respected and informed about their student’s life at school, they are more likely to be involved in helping their child learn.
family and community engagement
0 100 What doeS thiS mean?
2011
2012
2011
2012
The school scorecard is meant to provide information that is easy to compare across schools. However, each school is unique in its approach to teaching and learning. This section provides schools the opportunity to highlight their own measures of success.
unique School indicatorS
McKinley Technology High School
93%
96%
65 68
0% 0%
0
0
87%
86%
59
72
N/A 70
69%
66%
75%
Advanced Placementenrollment
The percentage of students in grades 11 and 12 enrolled in one or more AdvancedPlacement (AP) courses.
Students with 95%attendance
The percentage of students who have attended 95% or more school days.
19%
79
76%
79
85%
4%
90%
65
1%
1
82%
80
75%
68
73
17%
2012–13 S c h o o l S c o r e c a r d
Student Performance
0 100 What doeS thiS mean?
Student math performance 2011
The percentage of students achieving at each proficiency level on the District of Columbia’s Comprehensive Assessment System (DC CAS or DC CAS Alt).
2012
District Average
Student reading performance 2011
2012
District Average
Graduation rate 20112012
District Average
The percentage of students who enrolled in 9th grade for the first time four years ago and graduated with a standard diploma.
5-year graduation rate 20112012
District Average
The percentage of students who enrolled in 9th grade for the first time five years ago and graduated with a standard diploma.
College enrollment 20102011
District Average
The percentage of students graduating in June or August that are registered at a college or university the fall following their high school graduation. Data availability lags by one year, meaning results for 2011 are based on students graduating high school in summer 2010.
Advanced Placement performance
20112012
District Average
The percentage of students participating in an Advanced Placement examination and scoring 3, 4 or 5. These scores generally enable students to receive college credit.
Compared to student performance, which signals the share of students achieving at various levels, student progress is a measure of how much students grow from year to year. While some schools may have relatively few students meeting or exceeding state standards, it is important to gauge the extent to which those schools help students catch up.
0 100 What doeS thiS mean?
First-time 9th grade completion
2011 The percentage of first-time 9th grade students who earned enough credits to be promoted to 10th grade and are on track for graduation.2012
District Average
Student growth in math 2011This score describes the percentage of students the median (middle) student outperforms who started with a similar level of prior achievement on the District of Columbia’s Comprehensive Assessment System (DC CAS or DC CAS Alt). For example, a score of 70 means that this school’s median student outperformed more than 70 percent of students in the District with the same level of prior achievement.
2012District Average
Student growth in reading
20112012
District Average
Student ProgreSS
Results of annual, standardized assessments don’t describe the full school experience, but they do provide the most accurate and reliable signal of student performance. Every DCPS school should demonstrate progress in the core areas of math and reading, as well as cultivate students and faculty focused on improving performance through outstanding teaching and learning.
■ Below Basic ■ Basic ■ Proficient ■ Advanced
■ Below Basic ■ Basic ■ Proficient ■ Advanced
12% 77% 10%
McKinley Technology High School
75% Coming soon
85% 83%
58 76
60 55
95% N/A
94%
91%
8% 72% 20%
12% 68% 20%
8% 67% 24%
56%
Coming soon
Coming soon
20% 34% 33% 13%
19% 37% 34% 10%
29%
13%
9%
62%
46
47
Performance on most metrics is displayed by two horizontal bar graphs, one for each of the two most recent school years.

2012–13 S c h o o l S c o r e c a r d u S e r g u i d e
5
ADDItIoNAl INforMAtIoN AND Next StePS
The last page of the scorecard includes additional descriptive information about the school, such as facility information and Metro route information. additionally, it outlines a number of next steps for families and community members to increase their involvement with the school and learn more about Dc Public Schools.
2012–13 S c h o o l S c o r e c a r d
What you can doParents and community members play an important role in ensuring that every child, in every classroom across the district, receives the high-quality education he or she deserves.
volunteer at school. Volunteers are key to helping students succeed. Many schools need volunteers who can work directly with students on reading and math, but volunteers also can provide support in classrooms, the office and the library, as well as help plan and staff events, write grants, and much more. For more information, check with the principal or visit www.dcps.dc.gov/dcPS/volunteer.
Join the school’s parent organization. Parent organizations are an important part of every school community. They provide ways to support students through community events, fundraising and other activities. Joining a parent organization helps parents meet other parents who are engaged in their child’s education. For more information, contact the school.
attend parent-teacher conferences. Stay in touch with your child’s teachers and ask that they be in touch with you. Ask your child’s teachers about
what kind of classroom behavior they expect and how they reward positive behavior. Ask what your child should be learning, how well he or she is doing, and what you can do to help. Parent-teacher conferences will be held at school on Jan. 25, 2013, and June 3, 2013.
Work with or run for the school advisory board. This group advises the principal on the comprehensive school plan — including specific programs and activities that strengthen student performance, create safe and effective schools, and involve parents and families. For more information, check with the principal.
talk to your child about school. Your opinion matters to your child. Ask your child about one thing he or she learned at school, and keep asking every day! For more information, visit www.dcps.dc.gov/dcPS/studentsuccess.
1 2 3 4 5 6 7
1 2
�
3 4 5 67 8 9 10 11 12
KA
1 2 3 4 5 6 7
1 2
�
3 4 5 67 8 9 10 11 12
KA
getting to School
Where can i find information on other SchoolS?
If you are interested in seeing the information contained here for every DCPS school, please visit www.dcps.dc.gov/profiles. You will be able to search for DCPS schools based on the information that you care about, and you will also be able to compare schools side by side.
hoW can i Stay uP to date on What’S haPPening?
Be sure to let your school know if your contact information changes. Visit www.dcps.dc.gov regularly, and sign up to receive regular e-mail updates from DCPS at www.dcps.dc.gov/dcPS/enews.
facilities:
Art room
Auditorium
Computer lab
Gym
Media center
Music room
Outdoor recreation space
Science lab
other:
Parent organization
School uniform
Title I
McKinley Technology High School
80 (North Capitol Street Line), G8 (Rhode Island Avenue Line),M31 (McKinley High School Line), P6 (Anacostia-Eckington Line)
Community Partnerships: Career Pathways:
Biotechnology
Engineering (PLTW)
Interactive Media
Mass Media & Communications
Networking
Programming/General
National Institute of Health
Armed Forces Communicationand Electronics
Carnegie Academy for ScienceEducation
Cisco
Georgetown University
Howard University
National Geographic,Geographic Project
National Society of BlackEngineers
First Robotics
Anacostia Watershed Society

6
Scorecard Metric Detail
This section contains the definitions and detailed explanations for each metric included on the scorecard by metric type.

2012–13 S c h o o l S c o r e c a r d u S e r g u i d e
7
IMPortANt MetrIc INforMAtIoN
Background on the Dc comprehensive Assessment SystemMany metrics, particularly those in the Student Performance section of the scorecard, are based on the results of annual test scores. Dc Public Schools administers the Dc comprehensive assessment System (Dc caS) to measure the academic proficiency of students. Proficiency is relative to students’ mastery of the Dc content Standards, with which reading, math, and science curricula are aligned.
There are four performance levels for the content areas measured by the Dc caS: Below Basic, Basic, Proficient, and advanced. Performance at the Below Basic or Basic level indicates the student has not mastered grade-level content. Performance at the Proficient or advanced level indicates an overall understanding of the concepts, knowledge, and skills required for the grade level. Generally, students scoring at these levels are able to apply such understanding to solve problems using learned strategies.
For a student to meet Dc’s state standards, he/she must score at either the Proficient or advanced level. The first two Student Performance metrics concerning math and reading standards are derived from student performance on the Dc caS. Dc caS data for previous years can be found at the office of the State Superintendent of education’s (oSSe) website: www.nclb.osse.dc.gov.
Definitions of scorecard templatesNote that different school types have unique scorecard layouts. In each of the metric descriptions in the following section, these abbreviations are used to show which templates include that metric:
K–8: elementary schools and education campuses serving up to grade 8
hS: high schools
K–12: Schools with grade 12 and a grade below 9
A: alternative high schools
SP: Special education schools
St: STaY evening schools
P: Placement programs
District averagesWhen possible, District averages are displayed to put each school’s performance in the context of the larger system.
Minimum group sizeeach metric has a minimum number of observations (or “n-size”) required to report a result. This minimum safeguards against statistical fluctuations that naturally occur in small samples and helps protect privacy. Minimum group sizes on the scorecard are 25 for Dc caS performance metrics and 10 for the teacher retention metric.
John Smith High School John Smith High School
2012–13 S C H O O L S C O R E C A R D 2012–13 S C H O O L S C O R E C A R D
STUDENT PERFORMANCE
0 100 WHAT DOES THIS MEAN?
Student math performance 2011
The percentage of students achieving at each proficiency level on the District of Columbia’s Comprehensive Assessment System (DC CAS or DC CAS Alt).
2012
District Average
Student reading performance 2011
2012
District Average
Graduation rate 20112012
District Average
The percentage of students who enrolled in 9th grade for the first time four years ago and graduated with a standard diploma.
5-year graduation rate 20112012
District Average
The percentage of students who enrolled in 9th grade for the first time five years ago and graduated with a standard diploma.
College enrollment 20102011
District Average
The percentage of students graduating in June or August that are registered at a college or university the fall following their high school graduation. Data availability lags by one year, meaning results for 2011 are based on students graduating high school in summer 2010.
Advanced Placement performance
20112012
District Average
The percentage of students participating in an Advanced Placement examination and scoring 3, 4 or 5. These scores generally enable students to receive college credit.
Compared to student performance, which signals the share of students achieving at various levels, student progress is a measure of how much students grow from year to year. While some schools may have relatively few students meeting or exceeding state standards, it is important to gauge the extent to which those schools help students catch up.
0 100 WHAT DOES THIS MEAN?
First-time 9th grade completion
2011 The percentage of first-time 9th grade students who earned enough credits to be promoted to 10th grade and are on track for graduation.2012
District Average
Student growth in math 2011This score describes the percentage of students the median (middle) student outperforms who started with a similar level of prior achievement on the District of Columbia’s Comprehensive Assessment System (DC CAS or DC CAS Alt). For example, a score of 70 means that this school’s median student outperformed more than 70 percent of students in the District with the same level of prior achievement.
2012District Average
Student growth in reading
20112012
District Average
61%
61%
71
43
60
51
STUDENT PROGRESS
37%
33%
43%
63%
66%
43%
53%
50%
43%
83%
69%
43%
43%
43
43
Results of annual, standardized assessments don’t describe the full school experience, but they do provide the most accurate and reliable signal of student performance. Every DCPS school should demonstrate progress in the core areas of math and reading, as well as cultivate students and faculty focused on improving performance through outstanding teaching and learning.
0 100 WHAT DOES THIS MEAN?
Community satisfaction 2009
2011
A score that represents overall student, parent and staff satisfaction with this school. The scale is from 0 to 100, and the score is based on the results of a stakeholder survey given every two years.
Parent engagement 2009
2011
A score that represents how well and how often parents felt this school engaged and communicated with them. The scale is from 0 to 100, and the score is based on the results of a parent survey given every two years.
Survey response rate 2009
2011Percentage of parent surveys returned.
Families and community members play key roles in helping students and schools thrive. When parents, guardians and family members feel respected and informed about their student’s life at school, they are more likely to be involved in helping their child learn.
FAMILY AND COMMUNITY ENGAGEMENT
5456
67
63
0 100 WHAT DOES THIS MEAN?
PSAT/GPA 2011
2012
A score based on both the grade point average (GPA) and the PSAT scores of high school students who have taken the PSAT college admissions test. This is a college readiness indicator that shows how prepared students are for a four-year college.
School-defined Metric 2 2011
2012N/A
5358
82%
68%
The school scorecard is meant to provide information that is easy to compare across schools. However, each school is unique in its approach to teaching and learning. This section provides schools the opportunity to highlight their own measures of success.
UNIQUE SCHOOL INDICATORS
67
63
■ Below Basic ■ Basic ■ Proficient ■ Advanced
35% 25%15%25%
58% 5%22%15%
58% 5%22%15%
■ Below Basic ■ Basic ■ Proficient ■ Advanced
35% 25%15%25%
58% 5%22%15%
58% 5%22%15%
DCPS believes that all schools must provide caring and supportive environments. School environments that are safe and welcoming better enable students and staff to learn and teach.
SAFE AND EFFECTIVE SCHOOLS
0 100 WHAT DOES THIS MEAN?
Student in-seat attendance
2011The average percentage of students attending school daily.2012
District Average
School safety 2009 A score that represents student, parent and staff perceptions of safety and order at this school. The scale is from 0 to 100, and the score is based on the results of a stakeholder survey given every two years.
2011District Average
Expulsions and suspensions
2011 The percentage of students who were expelled or suspended long term (11 or more days).2012
District Average
Serious student misbehavior
2011 The number of expulsions and long-term suspensions for the most serious student misbehavior at this school per 100 students.2012
District Average
Student re-enrollment 2011 The percentage of students who returned to school the following year. This does not include students in the school’s highest grade level.2012
District Average
Student engagement 20092011
District Average
A score that signals students’ level of effort and interest in their classes, as well as students’ confidence in their own educational success. The scale is from 0 to 100, and the score is based on the results of a student survey given every two years.
Retention of effective and highly effective teachers
2011
2012District Average
The percentage of teachers rated Effective or Highly Effective by DC Public Schools’ IMPACT evaluation system who are returning to this school from the previous year.
54%
56%
49%
54%
77%
80%
67
60
54
56
43%
43
43%
43
43%
83
69
43
83%
69%
43%

2012–13 S c h o o l S c o r e c a r d u S e r g u i d e
8
MetrIc DeScrIPtIoNS
Student Performance
results of annual, standardized assessments don’t describe the full school experience, but they do provide the most accurate and reliable signal of student performance. every DcPS school should demonstrate progress in the core areas of math and reading, as well as cultivate students and faculty focused on improving performance through outstanding teaching and learning.
Student math performance
Summary: The percentage of students achieving at each proficiency level on the District of columbia’s comprehensive assessment System (Dc caS or Dc caS alt).
templates: K–8, hS, K–12, a
Detailed Description and technical Information:This metric is calculated using definitions set forth in the oSSe assessment and accountability Manual, available online at http://osse.dc.gov/service/assessment-and-accountability. Students are excluded from these calculations if they are new to the United States or do not meet the Full academic Year requirements.
Student reading performance
Summary: The percentage of students achieving at each proficiency level on the District of columbia’s comprehensive assessment System (Dc caS or Dc caS alt).
templates: K–8, hS, K–12, a
Detailed Description and technical Information:This metric is calculated using definitions set forth in the oSSe assessment and accountability Manual, available online at http://osse.dc.gov/service/assessment-and-accountability. Students are excluded from these calculations if they are new to the United States or do not meet the Full academic Year requirements.
Graduation rate Summary: The graduation rate at this school is based on the total number of graduates who started high school four years ago.
templates: hS, K–12, a, ST
Detailed Description and technical Information:Beginning in fall 2012, DcPS will report graduation rates based on the Four-Year and extended-Year adjusted cohort Graduation methodology. This method focuses on four-year, on-time graduation for cohorts of first-time 9th graders. This metric divides the total number of four-year graduates by the sum of first-time 9th graders four years prior and students transferring in between grades 9 and 12, minus students transferring out between grades 9 and 12.

2012–13 S c h o o l S c o r e c a r d u S e r g u i d e
9
5-year graduation rate
Summary: The graduation rate at this school is the graduation rate including students who graduated in five years.
templates: hS, K–12, a, ST
Detailed Description and technical Information:Beginning in fall 2012, the District of columbia will report graduation rates based on the Four-Year and extended-Year adjusted cohort Graduation methodology. The extended-Year adjusted cohort Graduation methodology is calculated the same way as the Four-Year adjusted cohort Graduation but includes students who graduated within five years and does not account for any school transfers in the fifth year.
college enrollment
Summary: The percentage of students graduating in June or august who are registered at a college or university the fall following their high school graduation.
templates: hS, K–12, a, ST
Detailed Description and technical Information:This metric combines data from the certified Graduates roster with matched records from the National Student clearinghouse (NSc), a national repository of college enrollment records. Students are counted as enrolled in college if they have any enrollment at a college or university that reports to the NSc in the year that they graduate from high school. Note that not all colleges and universities participate in the NSc and rates for the District of columbia could be underestimated by 1 to 2 percentage points.
Advanced Placement performance
Summary: The percentage of students participating in an advanced Placement examination and scoring 3, 4, or 5. These scores generally enable students to receive college credit.
templates: hS, K–12
Detailed Description and technical Information:This metric uses annual data made available by the college Board. results are based on all of the advanced Placement examinations in which students participate and for whom a valid score is returned.
Individualized Graduation Plan completion
Summary: The percentage of students who are on track to graduate based on their course
plans.templates: A
Detailed Description and technical Information:This metric includes all students in grades 9 through 12. The numerator is the number of students who have completed the appropriate course plan for their grade level. The denominator is the number of students in grades 9 through 12.

2012–13 S c h o o l S c o r e c a r d u S e r g u i d e
10
Student Progress
compared to student performance, which signals the share of students achieving at various levels, student progress is a measure of how much students grow from year to year. While some schools may have relatively few students meeting or exceeding state standards, it is important to gauge the extent to which those schools help students catch up.
Metrics in the Student Progress section are based on the concept of growth. Unlike metrics in the Student Performance section, which focus on a school’s status (its performance at a single point in time), Student Progress focuses on how much individual students in a school improve their performance over time. These growth metrics take advantage of data on all students in the District of columbia to enable fair comparisons across Dc public and public charter schools.
The growth metrics in this section were computed as part of a statewide project led by the oSSe. Full technical information on the growth metrics is available on the oSSe website: http://osse.dc.gov/service/data-and-accountability.
Student growth in math and reading
Summary: This score describes the percentage of students the median (middle) student outperforms who started with a similar level of prior achievement. For example, a score of 70 means that this school’s median student outperformed more than 70 percent of students in the District with the same level of prior achievement.
templates: K–8, hS, K–12
Detailed Description and technical Information:This metric is derived from a student growth percentile (SGP) model using data on all students testing in grades 3–8 and 10 in the District of columbia. as a result, median growth percentiles (MGPs) at the school level are comparable across Dc public and public charter schools. The detailed methodology, as well as the complete set of business rules used in the calculation, is available on the oSSe website: http://osse.dc.gov/service/race-top. Students missing one of the two years of prior data are treated with a fixed effect and included in the model. each student is assigned an SGP based on the location of his or her actual score relative to the nearest predicted percentile.

2012–13 S c h o o l S c o r e c a r d u S e r g u i d e
11
first-time 9th grade completion
Summary: The percentage of first-time 9th grade students who earned enough credits to be promoted to 10th grade. These students are on track for graduation.
templates: hS, K–12
Detailed Description and technical Information:Students’ first 9th grade year is determined based on transcript information entered into Dc STarS, the system of record for DcPS student enrollment, attendance, and course-taking data. Grade 10 status is based on students’ completion of at least six credits, including algebra I and english, by the end of the school year or in summer school. Students are associated to schools based on their school of enrollment on october 5 of each year.
Credit accumulation
Summary: The percentage of students who have completed seven or more credits over the course of an academic year.
templates: a, ST
Detailed Description and technical Information:This metric includes any student who has been enrolled at any given time for any length of time over the course of a school year. The numerator is the number of students who attended the school during the school year who received seven or more credits in the respective school year, regardless of course type. The denominator is any student who enrolled in the school at any given time of the school year.

2012–13 S c h o o l S c o r e c a r d u S e r g u i d e
12
Safe and effective Schools
DcPS believes that all schools must provide caring and supportive environments. School environments that are safe and welcoming better enable students and staff to learn and teach.
Metrics in the Safe and effective Schools section are based on data related to a school’s culture, such as attendance and behavior. While school culture is necessarily hard to measure, DcPS believes these indicators are closely linked to student achievement in a school.
Student in-seat attendance Summary: The in-seat attendance rate of students attending school.
templates: K–8, hS, K–12, a, ST
Detailed Description and technical Information:In-seat attendance is calculated by dividing the membership days of each student minus full-day absences of those students by the membership days of each student. Some authorized absences, like out-of-school suspensions, are considered an absence.
School safety Summary: a score that represents student, parent, and staff perceptions of safety and order at this school. The scale is from 0 to 100, and the score is based on the results of a stakeholder survey.
templates: K–8, hS, K–12, a, ST
Detailed Description and technical Information:a description of the items used for this scale is located in appendix I.
expulsions and suspensions
Summary: The percentage of students who were expelled or suspended long-term (for 11 days or more).
templates: K–8, hS, K–12, a, ST
Detailed Description and technical Information:This metric is calculated by dividing the total number of long-term suspensions and expulsions (involuntary removals from school for 11 days or more, as defined by chapter 25 of the District of columbia Municipal regulations) by the total number of registered students in a school as of october 5 of each school year.

2012–13 S c h o o l S c o r e c a r d u S e r g u i d e
13
Student re-enrollment
Summary: The percentage of students who returned to school the following year. This does not include students in the school’s highest grade level.
templates: K–8, hS, K–12, a, SP, ST
Detailed Description and technical Information:This metric calculates the percentage of students enrolled on the last day of school and also enrolled in September of the following year. Students in the school’s highest grade level are excluded. Students repeating or skipping a grade still count as re-enrolled; this metric does not track grade level promotion.
Student engagement
Summary: a score that signals students’ level of effort and interest in their classes, as well as students’ confidence in their own educational success. The scale is from 0 to 100, and the score is based on the results of a student survey given every two years.
templates: K–8, hS, K–12, a, ST
Detailed Description and technical Information:This metric uses data from DcPS’ biennial Stakeholder Survey. a description of the items used for this scale is located in appendix I.
Serious student misbehavior
Summary: The number of long-term suspensions or expulsions for the most serious (Tier 5) student misbehaviors in this school per 100 students.
templates: hS, K–12, a, ST
Detailed Description and technical Information:This metric focuses specifically on long-term suspensions and expulsions that are for Tier 5 student misbehaviors, as identified in chapter 25 of the Dc Municipal regulations. Tier 5 contains behaviors that are illegal or cause substantial harm to self or others. examples include arson, assault, possession of drugs or alcohol, theft using force, and the possession or use of weapons.
Truant student attendance
Summary: The average daily attendance of students with 15 or more unexcused absences after their 15th unexcused absence.
templates: A
Detailed Description and technical Information:This metric includes all truant students within a school. It calculates the number of days present divided by the total days of membership after each student’s 15th unexcused absence to determine each truant student’s average daily attendance following his/her point of truancy.

2012–13 S c h o o l S c o r e c a r d u S e r g u i d e
14
evening program attendance
Summary: The average daily attendance of students attending evening academic programs.
templates: ST
Detailed Description and technical Information:This metric includes all students who attend evening programs within a school. The numerator is the number of days present for students enrolled in an evening program. The denominator is the number of membership days for students enrolled in an evening program.
truancy rateSummary: The percentage of chronically truant students at the school.
templates: K–8, hS, K–12, a, ST
Detailed Description and technical Information:This metric uses end-of-year data to calculate the percent of chronically truant students at a school. a student is considered chronically truant if he or she has accrued 15 or more unexcused absences between the ages of 5 and 18 and has 25 or more membership days at that school.
retention of effective and highly effective teachers
Summary: The percentage of teachers rated effective or highly effective who are returning to this school from the previous year.
templates: K–8, hS, K–12, a, P, SP, ST
Detailed Description and technical Information:This metric combines data on all classroom teachers’ IMPacT effectiveness rating in the IMPacT end-of-Year report (e.g., June 2009) with human resources data as of october 1 of each year. Teachers who are promoted or retire are still included in this calculation as nonretained, as well as teachers who are retained but are employed by a different school. Teachers who are shared across locations are counted for all schools in which they worked. Teachers working in both a comprehensive high school and a STaY program were counted only at their comprehensive high school and with the IMPacT rating associated with their performance in that school.
2012–13 S c h o o l S c o r e c a r d u S e r g u i d e
15
family and community engagement
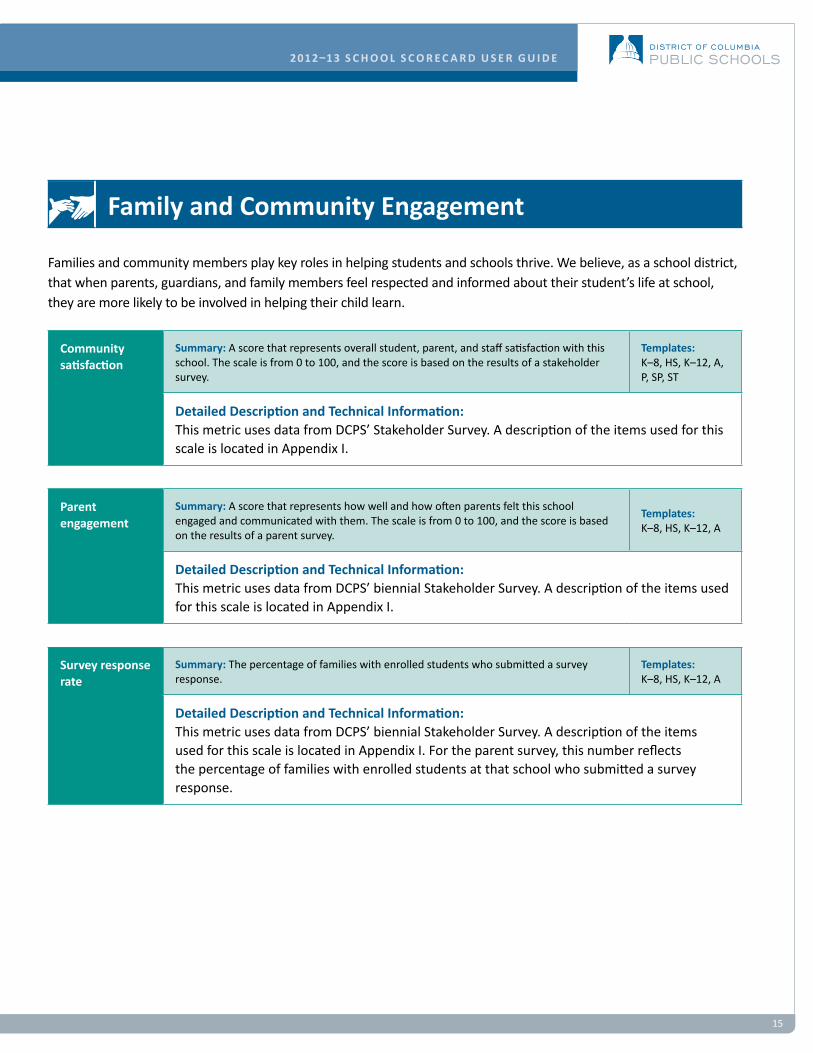
Families and community members play key roles in helping students and schools thrive. We believe, as a school district, that when parents, guardians, and family members feel respected and informed about their student’s life at school, they are more likely to be involved in helping their child learn.
community satisfaction
Summary: a score that represents overall student, parent, and staff satisfaction with this school. The scale is from 0 to 100, and the score is based on the results of a stakeholder survey.
templates: K–8, hS, K–12, a, P, SP, ST
Detailed Description and technical Information:This metric uses data from DcPS’ Stakeholder Survey. a description of the items used for this scale is located in appendix I.
Parent engagement
Summary: a score that represents how well and how often parents felt this school engaged and communicated with them. The scale is from 0 to 100, and the score is based on the results of a parent survey.
templates: K–8, hS, K–12, a
Detailed Description and technical Information:This metric uses data from DcPS’ biennial Stakeholder Survey. a description of the items used for this scale is located in appendix I.
Survey response rate
Summary: The percentage of families with enrolled students who submitted a survey response.
templates: K–8, hS, K–12, a
Detailed Description and technical Information:This metric uses data from DcPS’ biennial Stakeholder Survey. a description of the items used for this scale is located in appendix I. For the parent survey, this number reflects the percentage of families with enrolled students at that school who submitted a survey response.

2012–13 S c h o o l S c o r e c a r d u S e r g u i d e
16
APPeNDIx I: StAKeholDer SAtISfActIoN Survey MetrIcSon the student, parent, and administrator versions of the Stakeholder Satisfaction Survey, respondents were asked to answer questions using the following scale as shown in the tables below, unless otherwise specified: Strongly agree, agree, Disagree, and Strongly disagree. The scorecard metric values calculated using these answers are:
Student engagement
School safety
community satisfaction
Parent engagement
Student engagementQuestion Parent Survey Staff Survey Student Survey
I try hard to do well in school
I know what I do well in school and what areas I need to work on
I ask for help from my teachers or others when I need it
I set goals and then work to achieve them
I am confident I will graduate from high school
I like school
I attend all of my classes
I think doing well in school is important for my future
I can get help on schoolwork if I need it
My friends think it’s important to work hard to get high grades

2012–13 S c h o o l S c o r e c a r d u S e r g u i d e
17
School safetyQuestion Parent Survey Staff Survey Student Survey
everyone is expected to follow the school rules
how often do students in your school get into fights
Answer scale: Often, Sometimes, Rarely, and Never
how often do students in your school get made fun of for the way they look or talk
Answer scale: Often, Sometimes, Rarely, and Never
hallways, stairwells, and bathrooms are empty of students during class periods
how often do students in your school have things stolen or damaged by other students
Answer scale: Often, Sometimes, Rarely, and Never
how safe you feel in your classes
Answer scale: Very safe, Mostly safe, Somewhat safe, and Not safe
how safe you feel in the hallways and bathrooms of the school
Answer scale: Very safe, Mostly safe, Somewhat safe, and Not safe
how safe you feel outside around the school
Answer scale: Very safe, Mostly safe, Somewhat safe, and Not safe
I feel safe at my school
My school is clean and well maintained
My school is orderly and in control
School entrances are monitored consistently
School security devices are consistently operational
Security personnel at my school do a good job
how often do students in your school see gang activity in school
Answer scale: Often, Sometimes, Rarely, and Never
how satisfied are you with safety inside the school
This school applies discipline procedures fairly to all students
My school’s discipline plan is implemented uniformly
My school has effective discipline procedures in place

2012–13 S c h o o l S c o r e c a r d u S e r g u i d e
18
community satisfactionQuestion Parent Survey Staff Survey Student Survey
My school is on the right track for student achievement
I am strongly supported within my school
What grade would you give your school
Answer scale: Letter grades — A, B, C, D, F
I would recommend my school to other students
This school is a welcoming place for my family
Would you recommend that a friend send his or her child to this school
Answer scale: Yes, No
Parent engagementQuestion Parent Survey Staff Survey Student Survey
how the school communicates with parents
The level of parent engagement
The school keeps me regularly informed of my child(ren)’s progress
Teachers contact me promptly with concerns
I receive interpretations/translations when I need them
I am made to feel welcome in this school
School staff members are helpful in answering my questions


District of columbia Public Schools1200 first Street, NeWashington, Dc 20002www.dcps.dc.gov