School Speed Limits and Speeds In School...
7
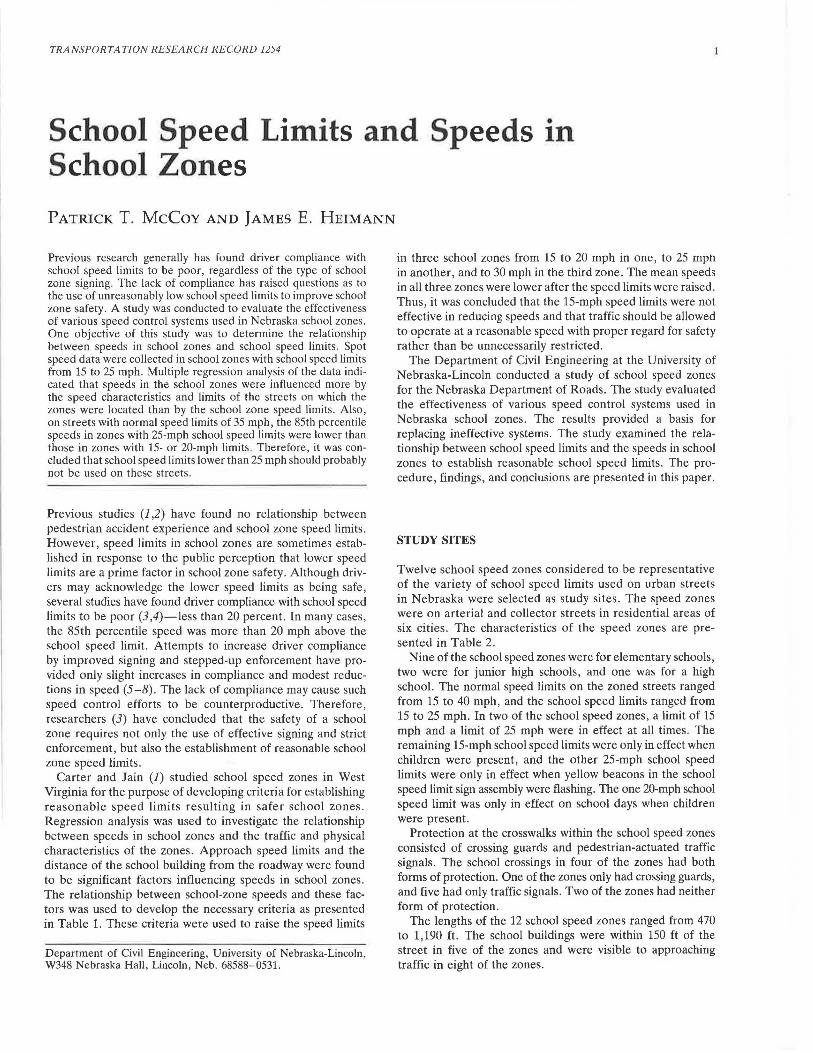
TRANSPORTATION RESEARCH RECORD 1254 School Speed Limits and Speeds School Zones • In PATRICK T. McCoy AND JAMES E. HEIMANN Previous research generally has found driver compliance with school speed limits to be poor, regardless of the type of school zone signing. The lack of compliance has raised questions as to the use of unreasonably low school speed limits to improve school zone safety. A study was conducted to evaluate the effectiveness of various speed control systems used in Nebraska school zones. One objective of this study was to determine the relationship between speeds in school zones and school speed limits. Spot speed data were collected in school zones with school speed limits from 15 to 25 mph. Multiple regression analysis of the data indi- cated that speeds in the school zones were influenced more by the speed characteristics and limits of the streets on which the zones were located than by the school zone speed limits. Also, on streets with normal speed limits of 35 mph, the 85th percentile speeds in zones with 25-mph school speed limits were lower than those in zones with 15- or 20-mph limits. Therefore, it was con- cluded that school speed limits lower than 25 mph should probably not be used on these streets. Previous studies (1,2) have found no relationship between pedestrian accident experience and school zone speed limits. However, speed limits in school zones are sometimes estab- lished in response to the public perception that lower speed limits are a prime factor in school zone safety. Although driv- ers may acknowledge the lower speed limits as being safe, several studies have found driver compliance with school speed limits to be poor (3,4)-less than 20 percent. In many cases, the 85th percentile speed was more than 20 mph above the school speed limit. Attempts to increase driver compliance by improved signing and stepped-up enforcement have pro- vided only slight increases in compliance and modest reduc- tions in speed (5-8). The lack of compliance may cause such speed control efforts to be counterproductive. Therefore, researchers (3) have concluded that the safety of a school zone requires not only the use of effective signing and strict enforcement, but also the establishment of reasonable school zone speed limits. Carter and Jain (1) studied school speed zones in West Virginia for the purpose of developing criteria for establishing reasonable speed limits resulting in safer school zones. Regression analysis was used to investigate the relationship between speeds in school zones and the traffic and physical characteristics of the zones. Approach speed limits and the distance of the school building from the roadway were found to be significant factors influencing speeds in school zones . The relationship between school-zone speeds and these fac- tors was used to develop the necessary criteria as presented in Table 1. These criteria were used to raise the speed limits Department of Civil Engineering , University of Nebraska-Lincoln, W348 Nebraska Hall, Lincoln, Neb. 68588-0531. in three school zones from 15 to 20 mph in one, to 25 mph in another, and to 30 mph in the third zone. The mean speeds in all three zones were lower after the speed limits were raised. Thus, it was concluded that the 15-mph speed limits were not effective in reducing speeds and that traffic should be allowed to operate at a reasonable speed with proper regard for safety rather than be unnecessarily restricted. The Department of Civil Engineering at the University of Nebraska-Lincoln conducted a study of school speed zones for the Nebraska Department of Roads. The study evaluated the effectiveness of various speed control systems used in Nebraska school zones. The results provided a basis for replacing ineffective systems. The study examined the rela- tionship between school speed limits and the speeds in school zones to establish reasonable school speed limits. The pro- cedure, findings, and conclusions are presented in this paper. STUDY SITES Twelve school speed zones considered to be representative of the variety of school speed limits used on urban streets in Nebraska were selected as study sites. The speed zones were on arterial and collector streets in residential areas of six cities. The characteristics of the speed zones are pre- sented in Table 2. Nine of the school speed zones were for elementary schools, two were for junior high schools, and one was for a high school. The normal speed limits on the zoned streets ranged from 15 to 40 mph, and the school speed limits ranged from 15 to 25 mph. In two of the school speed zones, a limit of 15 mph and a limit of 25 mph were in effect at all times. The remaining 15-mph school speed limits were only in effect when children were present, and the other 25-mph school speed limits were only in effect when yellow beacons in the school speed limit sign assembly were flashing. The one 20-mph school speed limit was only in effect on school days when children were present. Protection at the crosswalks within the school speed zones consisted of crossing guards and pedestrian-actuated traffic signals. The school crossings in four of the zones had both forms of protection. One of the zones only had crossing guards, and five had only traffic signals. Two of the zones had neither form of protection. The lengths of the 12 school speed zones ranged from 470 to 1,190 ft. The school buildings were within 150 ft of the street in five of the zones and were visible to approaching traffic in eight of the zones.
Transcript of School Speed Limits and Speeds In School...
TRANSPORTATION RESEARCH RECORD 1254
School Speed Limits and Speeds School Zones
• In
PATRICK T. McCoy AND JAMES E. HEIMANN
Previous research generally has found driver compliance with school speed limits to be poor, regardless of the type of school zone signing. The lack of compliance has raised questions as to the use of unreasonably low school speed limits to improve school zone safety. A study was conducted to evaluate the effectiveness of various speed control systems used in Nebraska school zones. One objective of this study was to determine the relationship between speeds in school zones and school speed limits. Spot speed data were collected in school zones with school speed limits from 15 to 25 mph. Multiple regression analysis of the data indicated that speeds in the school zones were influenced more by the speed characteristics and limits of the streets on which the zones were located than by the school zone speed limits. Also, on streets with normal speed limits of 35 mph, the 85th percentile speeds in zones with 25-mph school speed limits were lower than those in zones with 15- or 20-mph limits. Therefore, it was concluded that school speed limits lower than 25 mph should probably not be used on these streets .
Previous studies (1,2) have found no relationship between pedestrian accident experience and school zone speed limits. However, speed limits in school zones are sometimes established in response to the public perception that lower speed limits are a prime factor in school zone safety . Although drivers may acknowledge the lower speed limits as being safe, several studies have found driver compliance with school speed limits to be poor (3,4)-less than 20 percent. In many cases, the 85th percentile speed was more than 20 mph above the school speed limit. Attempts to increase driver compliance by improved signing and stepped-up enforcement have provided only slight increases in compliance and modest reductions in speed (5-8). The lack of compliance may cause such speed control efforts to be counterproductive. Therefore, researchers (3) have concluded that the safety of a school zone requires not only the use of effective signing and strict enforcement, but also the establishment of reasonable school zone speed limits.
Carter and Jain (1) studied school speed zones in West Virginia for the purpose of developing criteria for establishing reasonable speed limits resulting in safer school zones. Regression analysis was used to investigate the relationship between speeds in school zones and the traffic and physical characteristics of the zones . Approach speed limits and the distance of the school building from the roadway were found to be significant factors influencing speeds in school zones . The relationship between school-zone speeds and these factors was used to develop the necessary criteria as presented in Table 1. These criteria were used to raise the speed limits
Department of Civil Engineering, University of Nebraska-Lincoln, W348 Nebraska Hall, Lincoln, Neb. 68588-0531.
in three school zones from 15 to 20 mph in one, to 25 mph in another, and to 30 mph in the third zone . The mean speeds in all three zones were lower after the speed limits were raised. Thus, it was concluded that the 15-mph speed limits were not effective in reducing speeds and that traffic should be allowed to operate at a reasonable speed with proper regard for safety rather than be unnecessarily restricted.
The Department of Civil Engineering at the University of Nebraska-Lincoln conducted a study of school speed zones for the Nebraska Department of Roads. The study evaluated the effectiveness of various speed control systems used in Nebraska school zones. The results provided a basis for replacing ineffective systems. The study examined the relationship between school speed limits and the speeds in school zones to establish reasonable school speed limits. The procedure, findings, and conclusions are presented in this paper.
STUDY SITES
Twelve school speed zones considered to be representative of the variety of school speed limits used on urban streets in Nebraska were selected as study sites. The speed zones were on arterial and collector streets in residential areas of six cities . The characteristics of the speed zones are presented in Table 2.
Nine of the school speed zones were for elementary schools, two were for junior high schools, and one was for a high school. The normal speed limits on the zoned streets ranged from 15 to 40 mph, and the school speed limits ranged from 15 to 25 mph. In two of the school speed zones, a limit of 15 mph and a limit of 25 mph were in effect at all times . The remaining 15-mph school speed limits were only in effect when children were present, and the other 25-mph school speed limits were only in effect when yellow beacons in the school speed limit sign assembly were flashing. The one 20-mph school speed limit was only in effect on school days when children were present.
Protection at the crosswalks within the school speed zones consisted of crossing guards and pedestrian-actuated traffic signals. The school crossings in four of the zones had both forms of protection. One of the zones only had crossing guards, and five had only traffic signals. Two of the zones had neither form of protection.
The lengths of the 12 school speed zones ranged from 470 to 1,190 ft. The school buildings were within 150 ft of the street in five of the zones and were visible to approaching traffic in eight of the zones.

2 TRANSPORTATION RESEARCH RECORD 1254
TABLE 1 CRITERIA FOR ESTABLISHING SCHOOL SPEED LIMITS (1)
Distance of School
Building from Roadway
(ft) 25
0 - 55 20
56 - 100 25
Over 100 25
All uf lhe school speed zoned streets were two-way, with widths ranging from 30 ft with two lanes to 66 ft with four lanes plus a two-way left-turn lane. Nine of the zones were on tangent, level sections of roadway. The other three were on tangent sections with moderate grades . On-street parking was allowed in only two of the zones.
SPOT SPEED STUDIES
Spot speed studies were conducted at each of the sites. Speeds were measured with a radar speed gun, which was hand-held and plugged into the cigarette lighter of the data collector's car. The car was positioned along the roadway so that the angle between the radar beam and the traffic stream was within acceptable limits. In addition, care was taken to ensure that the car was inconspicuous to approaching traffic. Data were collected for both directions of traffic only if suitable data collection positions could be found; otherwise information was collected for just one direction. Each speed measurement was taken at the same point on the roadway, which was a school crosswalk near the middle of the school speed zone.
Speeds were recorded for passenger cars, trucks, and buses; tractors, off-road vehicles, and motorcycles were excluded. Speeds were measured only for free flowing vehicles, which were those not influenced by the movements of other vehicles on the roadway. In the school speed zones that had traffic signals at the school crossing, speeds were measured only for vehicles traveling unobstructed through the signal on a green light.
Speeds were measured during the designated school crossing times when the school speed zones were in effect and at other times of the day when the school speed zones were not in effect. Whether or not children were present was noted. Children were considered to be present if they were visible to traffic approaching the crosswalk at which speeds were measured. Thus, children in an unfenced playground near the street and visible to traffic were defined as present, but if the playground was fenced off from the street, the children were considered not present.
Approach Speed Limit
(mph)
35-45 55
20 30
25 30
30 35
DATA ANALYSiS
The objective of the analysis was to determine the relationship between the speeds in the school speed zones and the school speed limits. Previous research (J) had found that speeds in school zones were significantly influenced by the normal speed limit on the street. Therefore, the analysis considered the influence of the school speed limits on speeds in the zones not only when the school speed limits were in effect, but also when the school speed limits were not in effect. The speed characteristics considered were the mean and 85th percentile speeds in the zone when the school speed limit was not in effect, the normal speed limit on the zoned street, and the recommended normal speed limit for the street as determined by the procedure in the Institute of Transportation Engineers (ITE) Transportation and Traffic Engineering Handbook (9).
Multiple linear regression analysis was used to determine the relationship among the 85th percentile speeds in the zones, the school speed limits, and the speed characteristics of the street. Four models were examined. The dependent variable in each model was the 85th percentile speed in the zone when the school speed limit was in effect. Each model had two independent variables. One of them was the school speed limit and the other was one of the following:
• The normal speed limit on the street when the school speed limit was not in effect,
•The !TE-recommended normal speed limit for the street, • The mean speed in the zone when the school speed limit
was not in effect, or • The 85th percentile speed in the zone when the school
speed limit was not in effect.
Some school speed limits were in effect when children were present, some when beacons were flashing, and some were in effect at all times. Therefore, for the purpose of the data analysis, it was necessary to establish a common definition for determining when the various types of school speed limits were or were not in effect.
Because all of the school speed limits were in effect when children were present during the designated school crossing times, this was the primary criterion used to define when a school speed limit was in effect. A school speed limit desig-
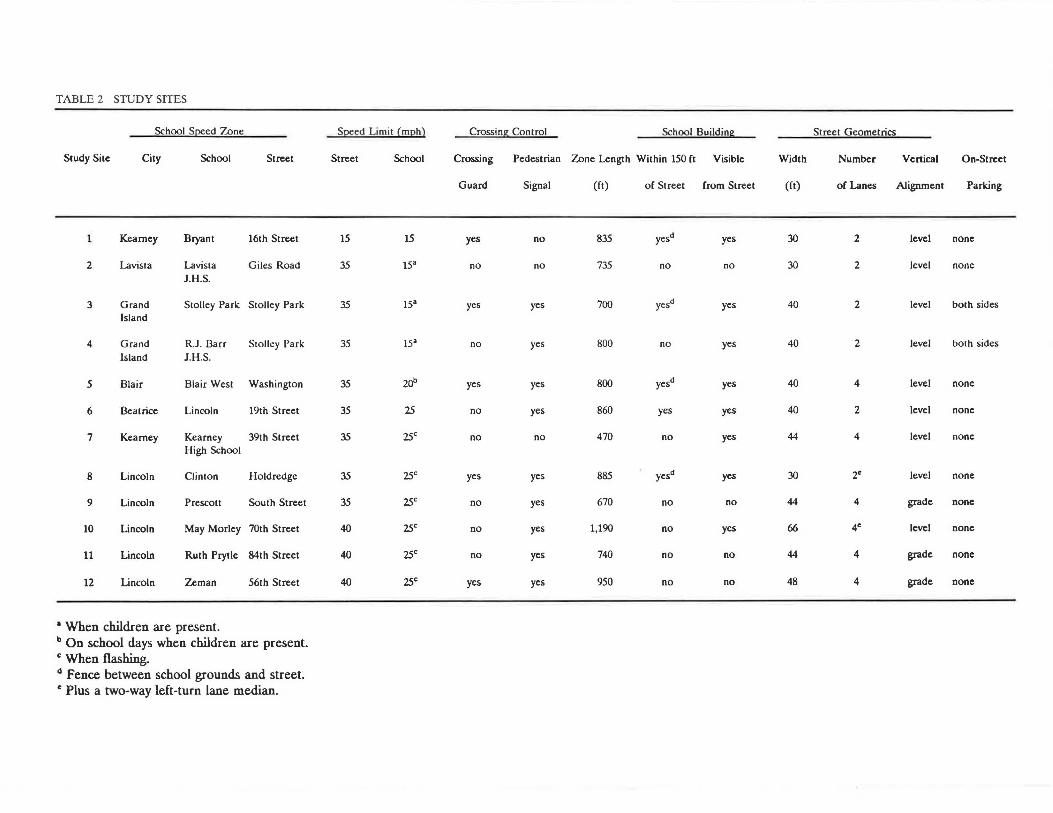
TABLE 2 STUDY SITES
School Sf2!:ed Zone Sf2!:ed Limit (m12hl Crossing Control School Building Street Geometrics
Study Site City School Street Street School Crossing Pedestrian Zone Length Within 150 ft Visible Width Number Vertical On-Street
Guard Signal (ft) of Street from Street (ft) of Lanes Alignment Parking
Kearney Bryant 16th Street 15 15 yes no 835 yesd yes 30 2 level none
2 Lavista Lavista Giles Road 35 15• no no 735 no no 30 2 level none J .H.S.
3 Grand Stolley Park Stolley Park 35 15• yes yes 700 yesd yes 40 2 level both sides Island
4 Grand R.J. Barr Stolley Park 35 1s• no yes 800 no yes 40 2 level both sides Island J.H.S.
5 Blair Blair West Washington 35 zob yes yes 800 yesd yes 40 4 level none
6 Beatrice Lincoln 19th Street 35 25 no yes 860 yes yes 40 2 level none
7 Kearney Kearney 39th Street 35 25c no no 470 no yes 44 4 level none High School
8 Lincoln Clinton Holdredge 35 25c yes yes 885 yesd yes 30 2e level none
9 Lincoln Prescott South Street 35 25c no yes 670 no no 44 4 grade none
10 Lincoln May Morley 70th Street 40 25c no yes 1,190 no yes 66 4e level none
11 Lincoln Ruth Prytle 84th Street 40 25c no yes 740 no no 44 4 grade none
12 Lincoln Zeman 56th Street 40 25c yes yes 950 no no 48 4 grade none
• When children are present. b On school days when children are present. c When flashing. d Fence between school grounds and street. e Plus a two-way left-turn lane median.
4
nated by a speed limit assembly with the message WHEN CHILDREN ARE PRESENT was considered to be in effect when children were present during the designated school crossing times. A school speed limit designated by a speed limit assembly with beacons and the message WHEN FLASHING was considered to be in effect when children were present during the designated school crossing times and when the beacons were flashing. A school speed limit designated by a standard speed limit sign without any qualifying message was considered to be in effect only when children were present during the designated school crossing times, even though it was legally in effect at all times .
The primary criterion used to define when a school speed limit was not in effect was when children were not present during times other than the designated school crossing times. A school speed limit designated by a speed limit assembly with the message WHEN CHILDREN ARE PRESENT was considered not to be in effect only when children were not present during times other than the designated school c1ossiug times. A school speed limit designated by a speed limit assembly with beacons and the message WHEN FLASHING was considered not to be in effect when children were not present and the beacons were not flashing . A school speed limit designated by a standard speed limit sign without any qualifying message was considered not to be in effect when children were not present during times other than the designated school crossing times, even though it was legally in effect at all times.
FINDINGS
The spot speed data collected were analyzed to compute the speed distribution parameters used in the regression analysis. The parameters computed were, for the zones when the school speed limits were in effect, (a) the 85th percentile speeds and (b) the mean speeds, and for the zones when the school speed limits were not in effect, (c) the 85th percentile speeds. The 10-mph paces of the speeds in the zones when the school speed limits were in effect were also determined. They were used, together with the 85th percentile speeds in the zones when the school speed limits were not in effect, to determine the !TE-recommended normal speed limits for the zoned streets . The results of these computations are presented in Table 3. Spot speed data were collected in both directions of traffic in five of the zones and in only one direction in the other seven zones .
The four models obtained from the regression analysis are presented in Table 4. In each model, the 85th percentile speed in a zone when the school speed limit was in effect is expressed as a linear function of the school speed limit and as one of the following variables:
• The mean speed in the zone when the school speed limit was not in effect,
• The 85th percentile speed in the zone when the school speed limit was not in effect,
•The !TE-recommended normal speed limit for the street , or
• The existing normal speed limit on the street.
The coefficients of determination for the first two models, which are functions of the mean and 85th percentile speeds
TRANSPORTATION RESEARCH RECORD 1254
in the zone when the school speed limit was not in effect, were higher than those for the last two models, which are functions of the !TE-recommended speed limit and the normal speed limit on the street . All of the models are statistically significant at the 0.01 percent level.
The coefficient of the school speed limit term was negative in all models, indicating that higher school speed limits would result in lower 85th percentile speeds in school zones when the school speed limit was in effect. The coefficient of the other independent variable was positive in all models , which indicated that the 85th percentile speeds in school zones when the school speed limit was in effect would be higher on streets with higher mean speeds, higher 85th percentile speeds, and higher normal speed limits. Also, the absolute values of the school speed limit coefficients were smaller than those of the other independent variables . Thus, the school zone speeds were more sensitive to the speed characteristics of the street than to the school speed limits.
Acco1diug tu the mutlels, 25-mph school speed limits would be the most effective, because they would result in the lowest 85th percentile speeds when the school speed limits were in effect. However, the regression coefficients of the school speed limit terms in the four models were not significantly different from zero at the 5 percent level of significance . This result indicates that the 85th percentile speeds in school zones when the school speed limits were in effect were independent of the school speed limits. Consequently, the results of a stepwise multiple regression analysis of the data conducted at the 5 percent level of significance revealed that the 85th percentile speeds in school speed zones when the school speed limits were in effect were simply a function of the speed characteristics of the streets (see Table 5). Once again, the highest coefficients of determination were for the first two models, indicating that the mean and 85th percentile speeds in the zones when the school speed limits were not in effect were better predictors of the 85th percentile speeds in the zones when the school speed limits were in effect.
A comparison of the speeds in the s.chool zones that were on streets with normal speed limits of 35 mph is presented in Table 6. In the six school zones on streets where the normal speed limit agreed with the !TE-recommended normal speed limit, the 85th percentile speeds when the school speed limits were in effect were lower in the 25-mph zones than they were in the 15- and 20-mph zones . However, in the six school zones on streets where the !TE-recommended normal speed limit was 40 mph, the 85th percentile speeds when the school speed limits were in effect were higher in two of the three 25-mph zones than they were in the 15-mph zones. Nevertheless, the results of a I-test conducted at the 5 percent level of significance indicated that the average 85th percentile speed (35.5 mph) in the 25-mph zones was not significantly higher than the average 85th percentile speed (35.2 mph) in the 15-mph zones when the school speed limits were in effect. This comparison indicates that the 25-mph school speed limits were more effective than the 15- or 20-mph school speed limits on streets with 35-mph normal speed limits , provided that this normal speed limit was consistent with ITE guidelines. Also, the comparison indicates that the effects of the 25-mph school speed limits were not significantly different from those of the lower speed limits on streets with 35 mph normal speed limits when the speed limit was lower than that recommended by the ITE guidelines.
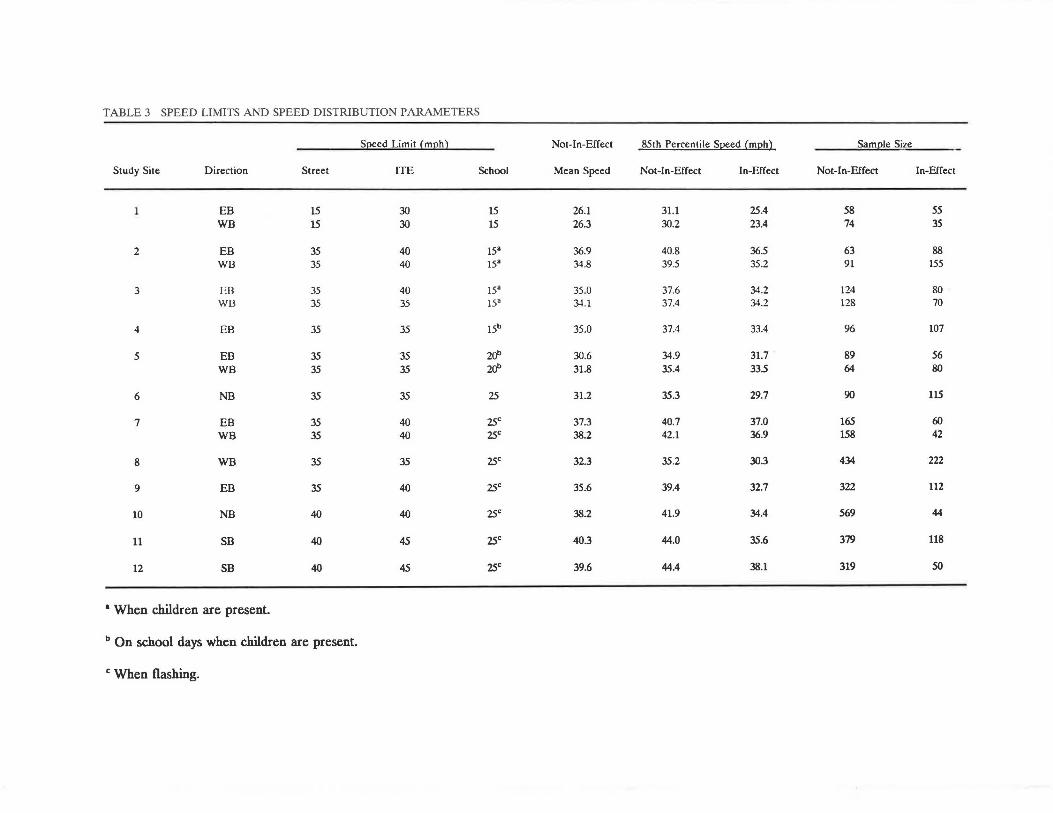
TABLE 3 SPEED LIMITS AND SPEED DISTRIBUTION PARAMETERS
Speed Limit (mph) Not-In-Effect 85th Percentile Speed (mph) Sample Size
Study Site Direction Street ITE School Mean Speed Not-In-Effect In-Effect Not-In-Effect In-Effect
EB 15 30 15 26.1 31.1 25.4 58 55 we 15 30 15 26.3 30.2 23.4 74 35
2 EB 35 40 is• 36.9 40.8 36.5 63 88 WB 35 40 15• 34.8 39.5 35.2 91 155
3 EB 35 40 is• 35.0 37.6 34.2 124 80 WU 35 35 15" 34 .1 37.4 34.2 128 70
4 EB 35 35 lSb 35.0 37.4 33.4 96 107
5 EB 35 35 2if 30.6 34.9 31.7 89 56 we 35 35 2if 31.8 35.4 33.5 64 80
6 NB 35 35 25 31.2 35.3 29.7 90 115
7 EB 35 40 25c 37.3 40.7 37.0 165 60
we 35 40 25c 38.2 42.1 36.9 158 42
8 WB 35 35 25c 32.3 35.2 30.3 434 222
9 EB 35 40 25c 35.6 39.4 32.7 322 112
10 NB 40 40 25c 38.2 41.9 34.4 569 44
11 SB 40 45 25c 40.3 44.0 35.6 379 118
12 SB 40 45 25c 39.6 44.4 38.1 319 50
---• When children are present.
b On school days when children are present.
c When flashing.
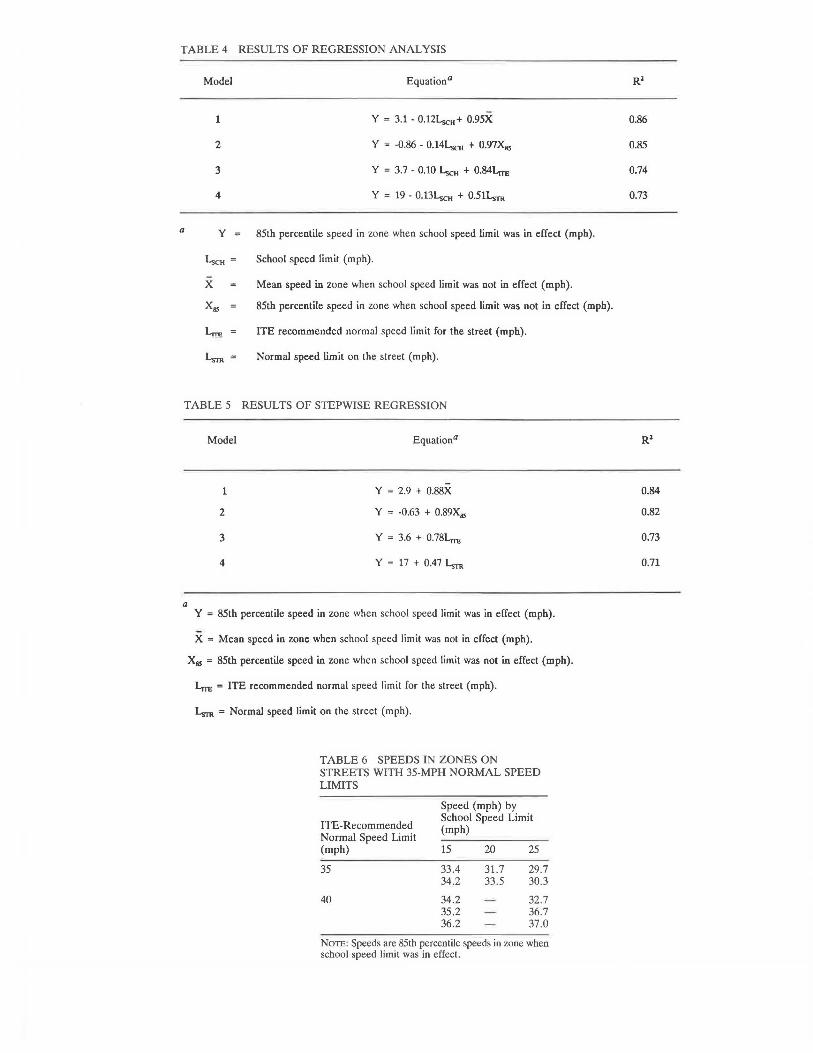
TABLE 4 RESULTS OF REGRESSION ANALYSIS
Model Equation°
1 Y = 3.1 - 0.121..scH+ 0.95X
2 Y = -0.86 - 0.141..scH + 0.97Xa.s
3 Y = 3.7 - 0.lQ LscH + 0.84Lrm
4 Y = 19 - 0.lJLscH + 0.51Lsr,.
a y = 85th percentile speed in zone when school speed limit was in effect (mph).
LscH = School speed limit (mph).
x Mean speed in zone when school speed limit was not in effect (mph).
Xa.s 85th percentile speed in zone when school speed limit was not in effect (mph).
4n, ITE recommended normal speed limit for the street (mph).
Lsra = Normal speed limit on the street (mph).
TABLE 5 RESULTS OF STEPWISE REGRESSION
a
Model
1
2
3
4
Equation°
Y = 2.9 + 0.88X
Y = -0.63 + 0.89Xa.s
y = 3.6 + 0.78Lm;
y = 17 + 0.47 l..,,-m
Y = 85th percentile speed in zone when school speed limit was in effect (mph).
X = Mean speed in zone when school speed limit was not in effect (mph).
Xa.s = 85th percentile speed in zone when school speed limit was not in effect (mph).
Lrm = ITE recommended normal speed limit for the street (mph).
Lsr,. = Normal speed limit on the street (mph).
TABLE 6 SPEEDS IN ZONES ON STREETS WITH 35-MPH NORMAL SPEED LIMITS
Speed (mph) by
!TE-Recommended School Speed Limit
Normal Speed Limit (mph)
(mph) 15 20 25
35 33.4 31.7 29.7 34.2 33.5 30.3
40 34.2 32.7 35.2 36.7 36.2 37.0
NoTE: Speeds are 85th percentile speeds in zone when school speed limit was in effect.
0.86
0.85
0.74
0.73
0.84
0.82
0.73
0.71
McCoy and Heimann
The findings of this study are consistent with those of the West Virginia study (1), which found that the normal speed limit had a significant influence on speeds in school speed zones and that the raising of school speed limits actually resulted in lower speeds in school speed zones. However, the findings may be confounded by factors that may influence speeds in school speed zones but that were not accounted for in this study. For example, some studies (3 ,5) have found that school speed limits signed with flashing beacons were more effective than passive forms of school speed limit signing. In this study , most of the 25-mph school speed zones were signed with flashing beacons, but the 15- and 20-mph school speed zones were not, which may suggest the reason why the 25-mph school speed zones had lower speeds. However, based on previous experience (8), it was assumed that the effects of the signing differences were minimal, because the school speed limits were defined as being in effect only when children were present. Also, previous research found that increased enforcement can reduce speeds in school zones . Although this study indicates otherwise, it is possible that the 25-mph school speed zones have received more enforcement than the 15- and 20-mph school speed zones, and therefore were more effective in reducing speeds.
CONCLUSIONS
The effectiveness of school speed limits in reducing speeds is limited. Speeds in school zones are influenced more by the normal speed limits and speed characteristics of the streets on which the zones were located than by the school speed limits . Also , 25-mph school speed limits are more effective than 15- or 20-mph school speed limits on streets with a normal speed limit of 35 mph, when the normal speed is consistent with ITE guidelines. Therefore, school speed limits lower than 25 mph should probably not be used on such streets.
The scope of this study was limited to school speed limits of 15 to 25 mph on urban streets with normal speed limits up to 40 mph. Additional studies are needed to substantiate these findings before the conclusions can be recommended as school speed zone policy. The limitations of this study can be avoided by accounting for the effects of school speed zone signing and enforcement. The additional studies should include 15- and 20-mph zones on streets with normal speed limits above 35 mph and consider the safety effects of school speed zones.
7
ACKNOWLEDGMENT
This paper was based on research conducted as part of the Nebraska Department of Roads (NDOR) Project No. RES1(0099) P424, "School-Related Reduced Speed Limits." The research was performed by the Department of Civil Engineering at the University of Nebraska-Lincoln. Special recognition is given to Robert L. Meyer, Traffic Engineering Division of the Nebraska Department of Roads, for his assistance during the study.
REFERENCES
1. E. C. Carter and R. P. Jain. Establishing Criteria for Speed Limils in School Zones. Engineering Experiment Station, West Virginia University, Morgantown, 1967.
2. R . J . Haden. Reduced Speed Zones Adjacent to School: A Report to the School Zone Study Committee. City of Lincoln, Nebraska, May 1976.
3. J . S. Koziol, Jr., A. R. Fulchino, P. H. Mengert, and G. Stewart. Effectiveness of Speed Control Signs in Rural School Zones and Small Communities. Report FHWA-RD-79-20. FHWA, U .S. Department of Transportation , Washington , D.C., July 1979.
4. Synrhesis of Safety Research Related to Traffic Conlrol and Roadway Elemenls, Vol. 2, Chap. 17. Report FHWA-TS-82-233. FHWA, U.S . Department of Transportation, Washington, D.C., December 1982.
5. M. J. Rosenbaum, P. Young, and S. R. Byington. Speed Control in Rural School Zones. In Transportalion Research Record 541, TRB, National Research Council, Washington, D.C., 1975, pp. 12-25.
6. C. V. Zegeer. The Effectiveness of School Signs with Flashing Beacons in Reducing Vehicle Speeds. Research Report 429. Kentucky Bureau of Highways, Lexington, July, 1975.
7. M. L. Reiss and H. D. Robertson . Driver Perception of School Traffic Control Devices. In Transportarion Research Record 600, TRB, National Research Council, Washington, D.C., 1976, pp. 36-39.
8. P. T. McCoy, A. K. Mohaddes, and R . J. Haden . Effectiveness of School Speed Zones and Their Enforcement. In Transportalion Research Record 811, TRB, National Research Council, Washington, D.C., 1981, pp . 1-7.
9. Institute of Transportation Engineers. Transporlation and Traffic Engineering Handbook, 2nd Ed. Prentice-Hall, Inc., Englewood Cliffs, N.J., 1982, p. 817.
The au/hors of the paper are solely responsible for the facts and accuracy of the data presented. The conlents do not necessarily reflect the official policies or views of the University of Nebraska-Lincoln or the Nebraska Departmenl of Roads.
Publication of this paper sponsored by Cammi/lee on Traffic Control Devices.