
School of Civil Engineering FACULTY OF ENGINEERING Earth, Wind and Fire Barry Clarke.
79
School of Civil Engineering FACULTY OF ENGINEERING Earth, Wind and Fire Barry Clarke
Transcript of School of Civil Engineering FACULTY OF ENGINEERING Earth, Wind and Fire Barry Clarke.

School of Civil EngineeringFACULTY OF ENGINEERING
Earth, Wind and Fire
Barry Clarke
• The Ground
• The Underlying Science
• Transformational Agenda
• Resilient Infrastructure
Introduction

The Ground
• Source of primary materials
• Stable platform for construction
• Protection of the environment, people and goods
• Geotechnical structures for storage and communications
The Ground

Primary Source of Materials

Primary materials
• The majority of our construction materials, fuel, minerals come from the ground.
1999
Aluminium 77
Cement 895
Clay 304
Coal 7662
Copper 25
Glass 150
Iron ore 553
Lead 14
Phosphate 340
Potash 44
Salt 395
Sand, gravel and stone 21640
Sulphur 111
Zinc 13
Oil 7782
Gas 7803
Uranium 0.25 Average American annual mineral consumption (lbs)

Primary materials

Construction materials
• UK use of sand, gravel and cement and concrete products
• Would cover13000 football pitches a year with concrete products a year
• Sand and gravel equivalent to 75 thousand elephants or 54 thousand buses would create a 500m high hill with side slopes of 1 in 3 or fill 200 Wembley stadia
Stable Ground
Stable platform
The province of the Engineer is to control the forces of nature and apply them to useful purposes, an object which is effected
by means of pieces of material suitably connected and arranged. The protection of life and property from destructive forces is accomplished by pieces rigidly connected with one
another which transmit the their action to bodies which are not injurious. (Cotterill, 1906)
.................it is assumed that the ground is that body.

Stable ground
• Instability caused by overloading of soil, and earthquakes

Stable ground
• Instability due to mass movement triggered by erosion, earthquakes, rainfall

Stable ground
• Instability caused by overloading of soil, collapse of underground caverns and degradation of foundations

Instability due to water pressure
• Instability due to water pressure

Stable ground?
• A week in the life of the earth

Human and property loss
• Ground movements result in delays to construction, damage to property and loss of human life
• 90% of total losses due to storms and flooding

Construction workload
• Current and predicted projects used to quantify skills requirements and indicate workload over next five years

Protection

Flood and coastal protection
• Embankments for flood protection, coastal erosion, wetlands, and river diversion

Defence
• Earth has and is still being used for defence of sensitive installations

Storage

Storage
• Storage of waste, water, energy, carbon and data

The Underlying Science

The ‘myths’
• The ground is made of either rock, sand or clay
• The majority of new build is based on sophisticated testing techniques

Soil particles
sand clay
10-11 m/sec10μm
10-6 m/sec2mm

Characterisation of Tills

Distribution of non text book soils
• Over 60% of the UK is covered by non text book materials

Glacial till• transported, partially weathered homogenized
sub glacial till subsequently weathered
• weathered sub glacial till
• deformation till
• transported partially homogenized sub glacial till incorporating elements of previous melt out till or periglacial features
• deformation till
• fluvioglacial deposits
• shear zones
• transported partially homogenized sub glacial till containing elements of bed rock
• deformation till or lodgment till
• rock
sand
sand and gravel
laminated clay
laminated clay sand and gravel

Characterisation of glacial tillsundrained shear strength (kPa)
0
2
4
6
8
10
12
14
16
18
20
0 50 100 150 200 250 300 350 400 450 500
undrained shear strength (kPa)
de
pth
(m
)
upper red tilllower red tilllower grey till
0
10
20
30
40
50
60
0 10 20 30 40 50 60 70 80 90
liquid limit (%)
plas
ticity
inde
x (%
)
Trenter, 1997Bell, 2000upper red tilllower red tilllower grey till
-2
-1.5
-1
-0.5
0
0.5
10 100 1000effective vertical stress (kPa)
undrained shear strength (kPa)
void
inde
x
upper red till strength
lower red till strength
lower grey till strength
reconstituted grey till strength
reconstituted red till strength
upper red till in situ stress
lower red till in situ stress
lower grey till in situ stress
ICLISuL SCL
• Creating a framework to characterise tills and develop a consistent approach to selection of design parameters

Stiffness

Local strain stiffness
10-4 10-3 10-2 10-1 100
shear strain %
CSBPPAF
0.8
0.4
0
G Go
0.8
0.4
0
0.8
0.4
0G G
o
0.8
0.4
0 corr
ecte
d
G
ur
reso
nant
col
umn
G
o
Gur from SBP tests in calibration chambers
Seed et al (1986)
corr
ecte
d
Gur
cros
s ho
le
Go
standard tests
machine foundations
soft ground construction
earthquakes
well designed foundations
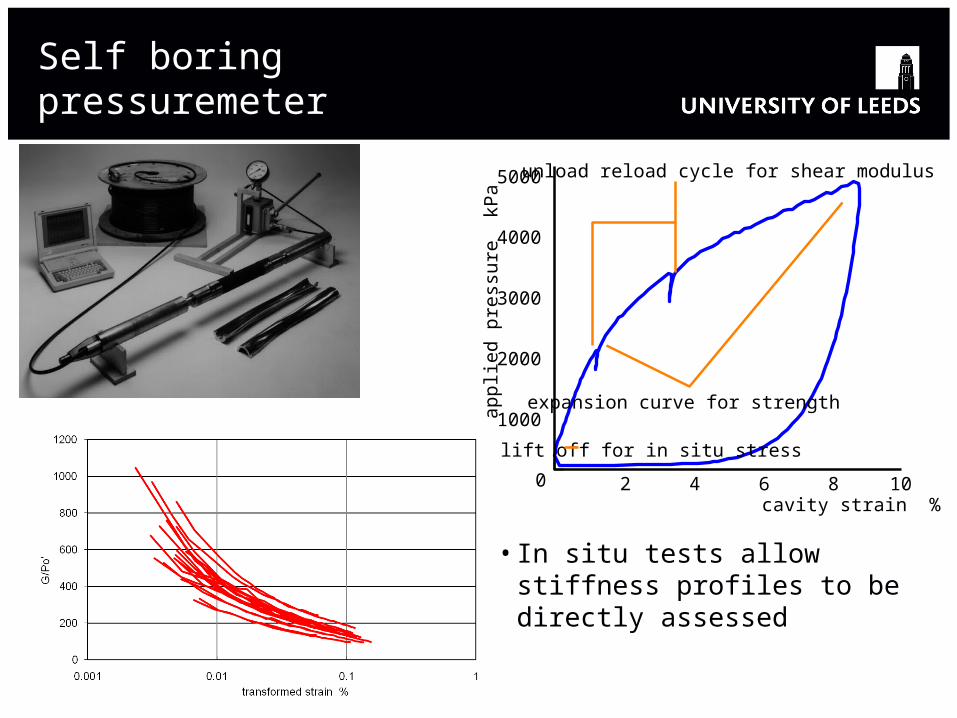
Self boring pressuremeter
cavity strain %2 4 6 8 100
1000
2000
3000
4000
5000
app
lied
pres
sure
kP
a
expansion curve for strength
unload reload cycle for shear modulus
lift off for in situ stress
• In situ tests allow stiffness profiles to be directly assessed
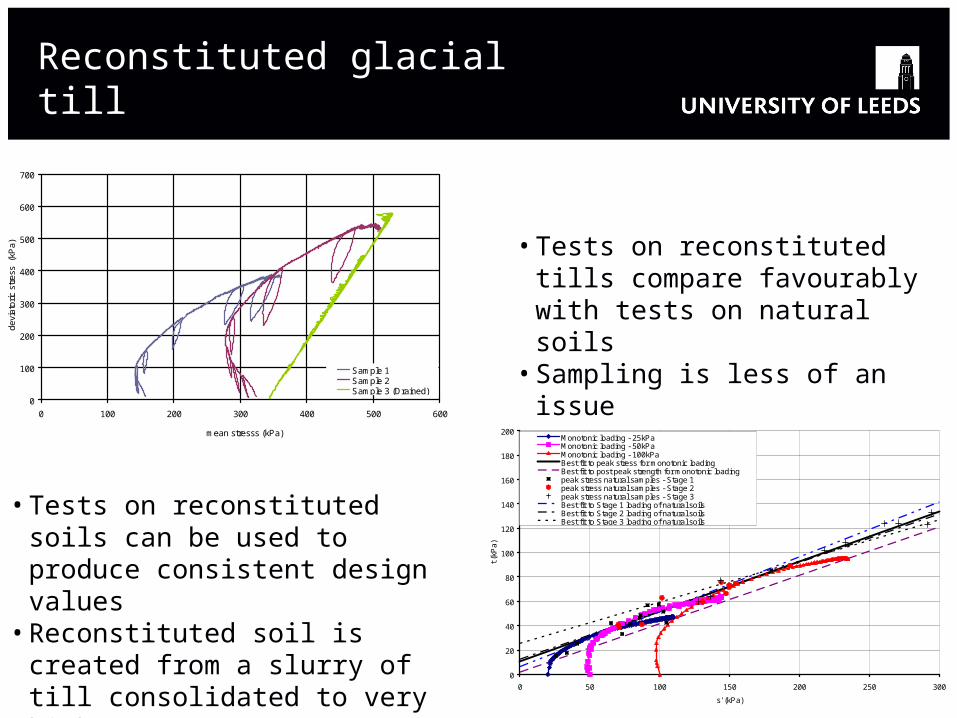
Reconstituted glacial till
0
100
200
300
400
500
600
700
0 100 200 300 400 500 600
mean stresss (kPa)
devi
ator
ic s
tres
s (
kPa)
Sample 1Sample 2Sample 3 (Drained)
Richmond, 2007
• Tests on reconstituted soils can be used to produce consistent design values
• Reconstituted soil is created from a slurry of till consolidated to very high pressures to create a heavily overconsolidated material
0
20
40
60
80
100
120
140
160
180
200
0 50 100 150 200 250 300
s' (kPa)
t (k
Pa
)
Monotonic loading - 25kPaMonotonic loading - 50kPaMonotonic loading - 100kPaBest fit to peak stress for monotonic loadingBest fit to post peak strength for monotonic loadingpeak stress natural samples - Stage 1peak stress natural samples - Stage 2peak stress natural samples - Stage 3Best fit to Stage 1 loading of natural soilsBest fit to Stage 2 loading of natural soilsBest fit to Stage 3 loading of natural soils
• Tests on reconstituted tills compare favourably with tests on natural soils
• Sampling is less of an issue

Reconstituted glacial till
0
100
200
300
400
500
600
700
0 100 200 300 400 500 600
mean stresss (kPa)
devi
ator
ic s
tres
s (
kPa)
Sample 1Sample 2Sample 3 (Drained) 0
50
100
150
200
250
300
350
400
0.0001 0.001 0.01 0.1 1 10
shear strain (%)
seca
nt
she
ar m
odu
lus
(MP
a) Sample 1Sample 2Sample 3 (Drained)
• It is possible to measure the local strain stiffness and obtain the design curve from tests on reconstituted till
• The stiffness design curve is obtained from the normalised shear modulus
• The shear modulus is normalised by the mean stress to provide a unique curve
0
100
200
300
400
500
600
700
800
900
0.0001 0.001 0.01 0.1 1 10
shear strain (%)
norm
alis
ed s
hea
r m
odu
lus
Sample 3 (Drained Shearing)Sample 1 (Undrained Shearing)Sample 2 (Undrained Shearing)

Reconstituted glacial till
0
50
100
150
200
250
300
350
1 10 100 1000 10000
cycles
shea
r m
odul
us/m
ean
eff
ectiv
e st
ress
CTX1 20kPa; 0 - 33%; undrained; local strainCTX2 50kPa; 0 - 33%; undrained; average strainCTX3 100kPa; 0 - 33%; undrained; local strainCTX4 20kPa; 0 - 66%; undrained; local strainCTX5 50kPa; 0 - 66%; undrained; average strainCTX6 100kPa; 0 - 66%; undrained; local strain
CTX3
CTX4
CTX6
CTX2
CTX1
CTX5
• This allows cyclic load test to be carried out to observe the degradation of stiffness with cycles

Conductivity
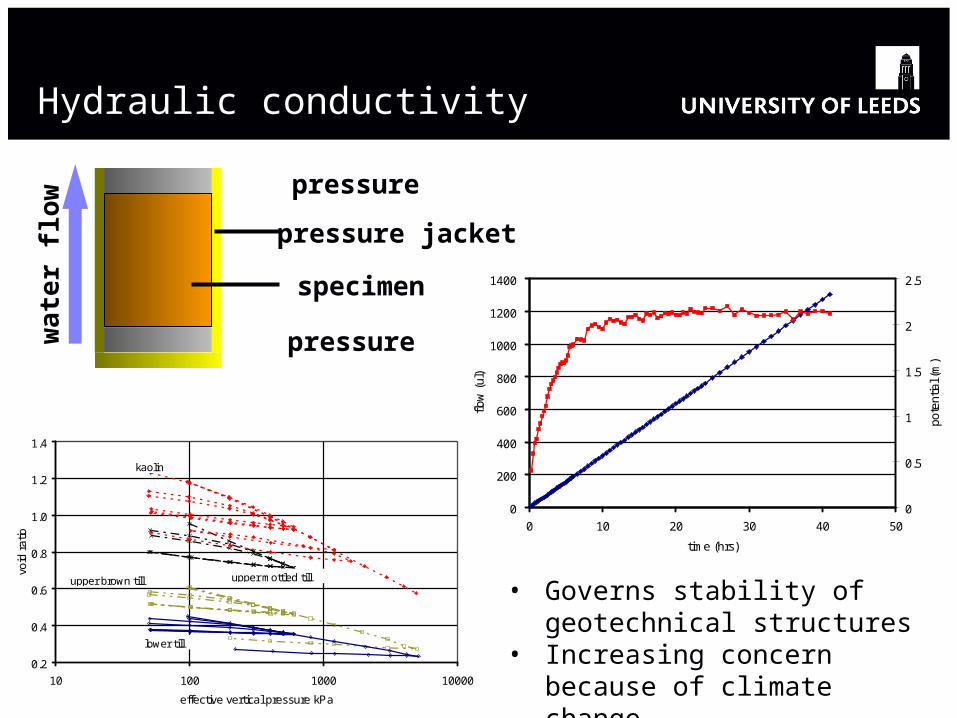
Hydraulic conductivity
wa
ter
flo
w pressure jacket
specimen
pressure
pressure
0
200
400
600
800
1000
1200
1400
0 10 20 30 40 50
time (hrs)
flow
(ul
)
0
0.5
1
1.5
2
2.5
pote
ntia
l (m
)
flow
head
0.2
0.4
0.6
0.8
1.0
1.2
1.4
10 100 1000 10000
effective vertical pressure kPa
void
rat
io
kaolin
upper mottled tillupper brown till
lower till
• Governs stability of geotechnical structures
• Increasing concern because of climate change

Thermal conductivity
he
at f
low insulation jacket
0
10
20
30
40
50
60
0 5 10 15 20 25 30 35 40
elapsed time (hr)
tem
pera
ture
(oC
)
heat source
room temperature
heat sink
constant potential
falling potential
specimen
heat sink
heat source
thermistor
• Applications in geothermal energy, melting of permafrost due to climate change, design of future landfills

Electrical conductivity
ele
ctr
ic f
low
insulation jacket
-195
-175
-155
-135
-115
-95
-75
-55
-35
-15
5
0.01 0.1 1 10 100 1000 10000time (mins)
nega
tive
por
e w
ater
pre
ssur
e (k
Pa)
5V
10V
15V
20V
25V
30V
specimen
cathode
anode
0
5
10
15
20
25
30
0 50 100 150 200 250
effective stress (kPa)
undr
aine
d sh
ear
stre
ngth
(kP
a)
• Applications in ground improvement, dewatering of slurries and stabilising of slopes

The Transformational Agenda

The Transformational Agenda
• Sustainable Built Environment
• Energy generation, dissipation and storage
• Carbon Critical Design
• Climate Change Mitigation and Adaption
• Regulation/Innovation

Sustainable Built Environment

Sustainable construction
• Sustainable construction is an aim that can be achieved through an incremental approach
• But there is much evidence that even that approach is too slow
• Of 123 contracts reported, only 54% had a sustainability clause
• Of the top ten contracts (by value) only 6 had a sustainability clause
• Only 3.1% of total spend on catering contracts had a sustainability clause
• 9 of the 21 Depts still do not include clauses regarding ‘Quick Win’ product standards in all contracts
BERR Mar 2008

Zero carbon by 2016undrained shear strength (kPa)

Sustainable ground engineering
• Baseline reporting to assess risk and increase client commitment to whole life costing and optimum designs
• Application of Eurocode to improve ground investigations to produce reliable, optimum designs
• Better application of ground characteristics
• Balanced approach to ground energy
• Reuse of excavated materials
• Use of waste as a resource
• Reuse of foundations

Energy

Geotechnical engineering for energy
• Foundations for energy structures including wind turbines, nuclear power stations, sea bed structures
• Storage of energy related resources including nuclear waste, carbon, heat
• Ground energy systems
• Barrages
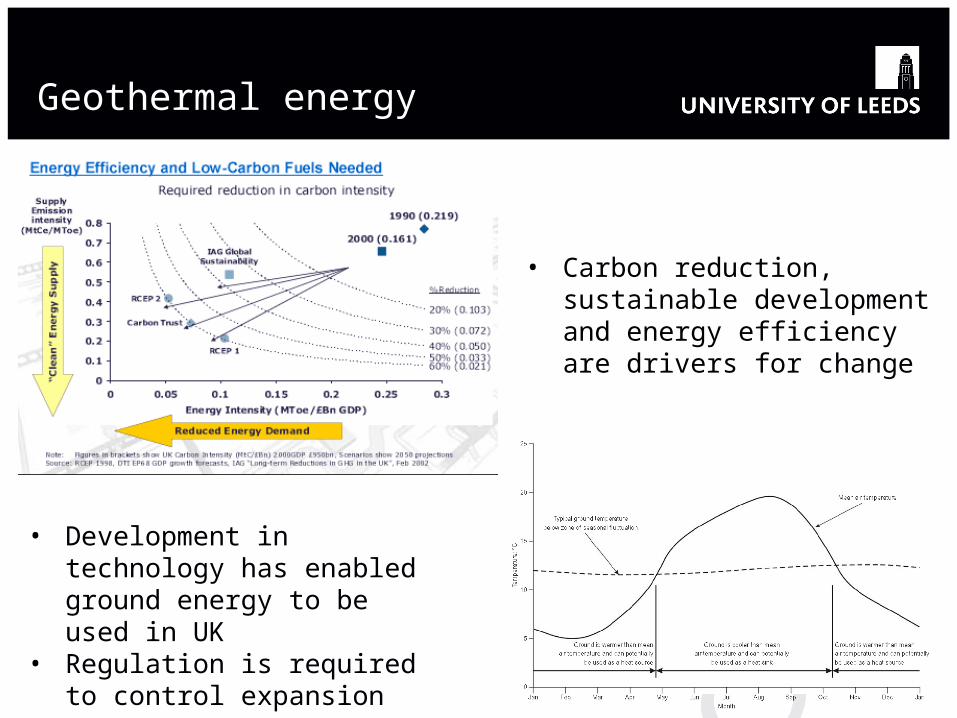
Geothermal energy
• Carbon reduction, sustainable development and energy efficiency are drivers for change
• Development in technology has enabled ground energy to be used in UK
• Regulation is required to control expansion

Ground energy
low to high enthalpy geothermal
ground source energy systems
stored/recharge solar energy and
geothermal flux from earth core
open loop surface water and
groundwater abstraction/discharge
closed loop ground loop heat exchangers
surface water (sea/lake/river)
aquifer bidirectional aquifer thermal energy storage
surface water (sea/lake/river)
geotechnical structures
horizontal trenching
vertical borehole

Energy systems
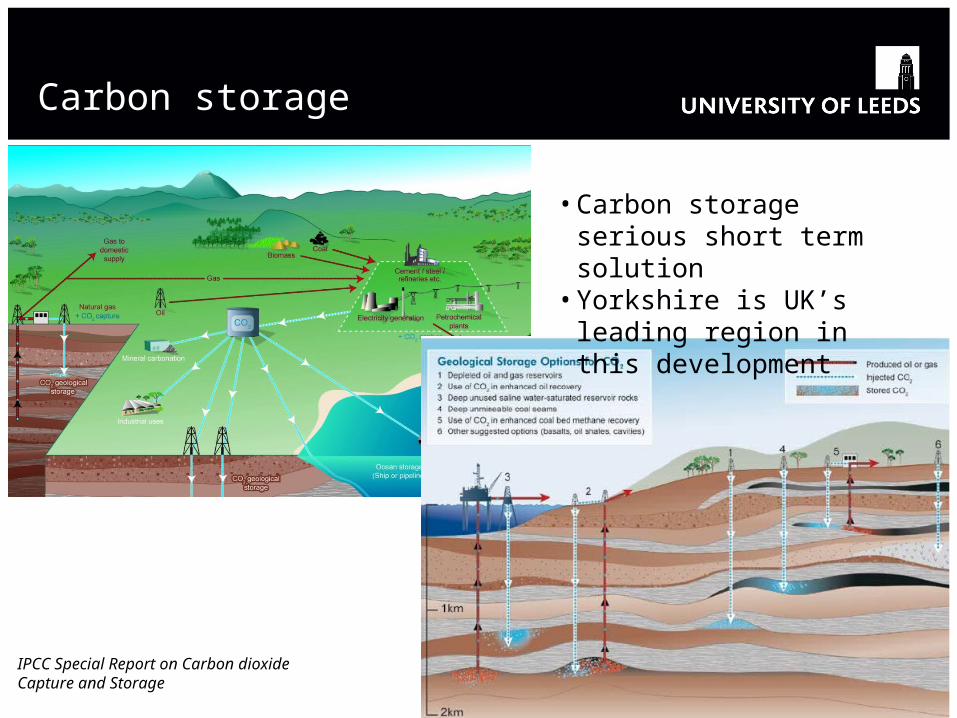
Carbon storage
• Carbon storage serious short term solution
• Yorkshire is UK’s leading region in this development
IPCC Special Report on Carbon dioxide Capture and Storage

Carbon Critical Design

Design criteria for performance
unacceptable performance for
new constructionbasic objective
essential/hazardous objective
safety critical objectiveVery Rare
Rare
Occasional
Frequent
Design Level
Near Collapse
Life SafeOperationalFully Operational
Performance Level
New Orleans1:200
London1:1000
Amsterdam1:10000
SLS ULSClimateChange
ClimateChange

Design criteria
UK Government view of sustainable development in 2000•Social progress which recognises the needs of everyone•Effective protection of the environment•Prudent use of natural resources•Maintenance of high and stable levels of economic growth and employment
Sustainable construction 2003•design for minimum waste•lean construction (& minimise waste)•minimise energy in construction & use•do not pollute•preserve and enhance biodiversity•conserve water resources•respect people and local environment•set targets (ie monitor & report, in order to benchmark performance)
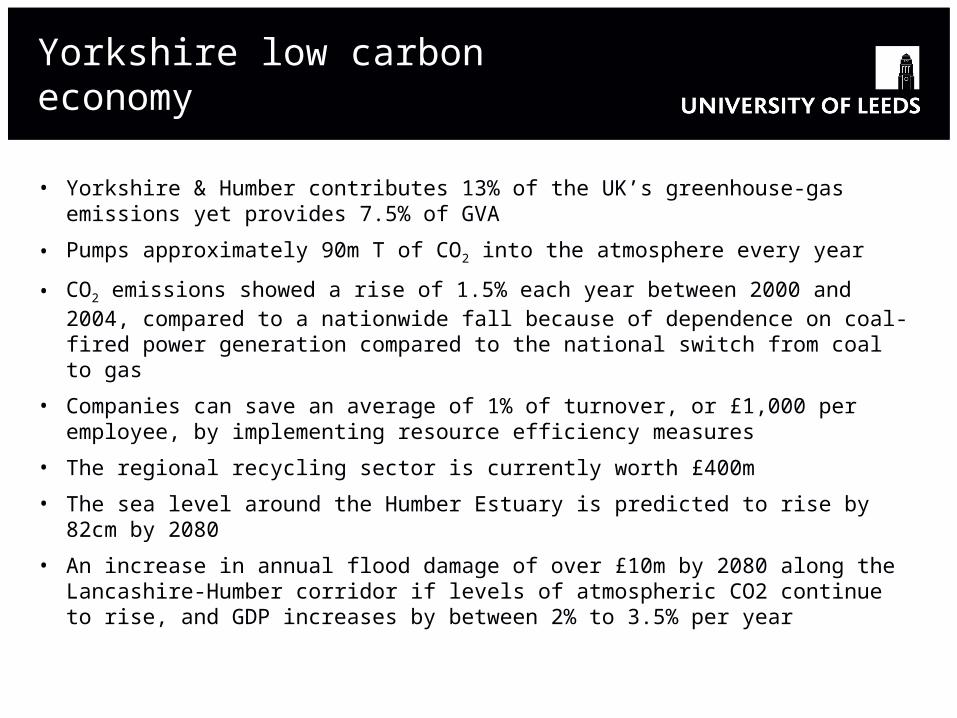
• Yorkshire & Humber contributes 13% of the UK’s greenhouse-gas emissions yet provides 7.5% of GVA
• Pumps approximately 90m T of CO2 into the atmosphere every year
• CO2 emissions showed a rise of 1.5% each year between 2000 and 2004, compared to a nationwide fall because of dependence on coal-fired power generation compared to the national switch from coal to gas
• Companies can save an average of 1% of turnover, or £1,000 per employee, by implementing resource efficiency measures
• The regional recycling sector is currently worth £400m
• The sea level around the Humber Estuary is predicted to rise by 82cm by 2080
• An increase in annual flood damage of over £10m by 2080 along the Lancashire-Humber corridor if levels of atmospheric CO2 continue to rise, and GDP increases by between 2% to 3.5% per year
Yorkshire low carbon economy

The carbon challenge
• Our sector (construction) is facing the most complex challenge it has ever dealt with. Changing the way we design the built environment is a phenomenal challenge, both technically, organisationally and culturally.
• Nobody knows enough today about how to solve or mitigate the carbon issues in the products that we design. We will not get there in a single step. We will no longer be able to design a building, and then do the energy calculation only to find it uses too much energy. The same is true how we design our public infrastructure, choose our materials and procure. It will radically change the design question to something that starts at the beginning.
(Clarke, 2009)

A carbon ‘free’ world
1999 1776
Aluminium 77 0
Cement 895 12
Clay 304 100
Coal 7662 40
Copper 25 1
Glass 150 1
Iron ore 553 20
Lead 14 2
Phosphate 340 0
Potash 44 1
Salt 395 4
Sand, gravel and stone 21640 1000
Sulphur 111 1
Zinc 13 0.5
Oil 7782
Gas 7803
Uranium 0.25

Design criteria
1 construction costs 5 maintenance costs
200 operating costsRAEng
whole life cost assessmentandwhole life carbon assessment

Climate Change

Climate change impactundrained shear strength (kPa)
• Exponential increase in floods and droughts• Increased frequency of extreme events• Cubical increase in storm damage• Quadratic increase in coastal damage• 200 m people, 2m km2 and $1trilion assets within 1m of sea level• 22 of top 50 cities under threat• 200m people will migrate because of increase in temperature and loss of land• Changes in soil conditions threaten stability of infrastructure (drought, rising
groundwater, melting permafrost)(Stern, 2005)

BIONICS
FLAC (Version 4.00)
LEGEND
10-Aug-06 13:03 step 24878487Cons. Time 2.8382E+08 -1.333E+00 <x< 2.533E+01 -1.333E+01 <y< 1.334E+01
Max. shear strain increment 1.00E-02 2.00E-02 3.00E-02 4.00E-02
Contour interval= 1.00E-02Grid plot
0 5E 0
-1.000
-0.500
0.000
0.500
1.000
(*10^1)
0.250 0.750 1.250 1.750 2.250(*10^1)
JOB TITLE : Flac\Shetran comparison (no overland flow)
Newcastle University U.K.
• Climate change will lead to instability of infrastructure due to pore pressure changes and changes in vegetation
• BIONICS is an EPSRC funded project to study this effect
(Glendinning, Davies and Hughes, 2008)

Climate Change Act 2008
An Act to set a target for the year 2050 for the reduction of targeted greenhouse gas emissions; to provide for a system of carbon budgeting; to establish a Committee on Climate Change; to confer powers to establish trading schemes for the purpose of limiting greenhouse gas emissions or encouraging activities that reduce such emissions or remove greenhouse gas from the atmosphere; to make provision about adaptation to climate change; to confer powers to make schemes for providing financial incentives to produce less domestic waste and to recycle more of what is produced; to make provision about the collection of household waste; to confer powers to make provision about charging for single use carrier bags; to amend the provisions of the Energy Act 2004 about renewable transport fuel obligations; to make provision about carbon emissions reduction targets; to make other provision about climate change; and for connected purposes.

Climate change in Yorkshire, 2050
• Annual average temperatures between 1.8°C - 1.9°C
• Summer average temperatures up between 2.1°C - 2.5°C
• Extreme hot temperatures up between 2.8°C - 3.2°C
• Annual rainfall down by approximately 6%
• Winter rainfall up by 12 – 17%
• Summer rainfall down by 22 – 26%
• Winter snowfall down by 54 – 68%
• Annual average wind speeds down by approximately 1%
• Winter average wind speeds up by approximately 1%
• Soil moisture annual average down by around 5 – 11%
• Mean sea level increase of 0.35 metres, with more severe surges.

The Innovation Agenda
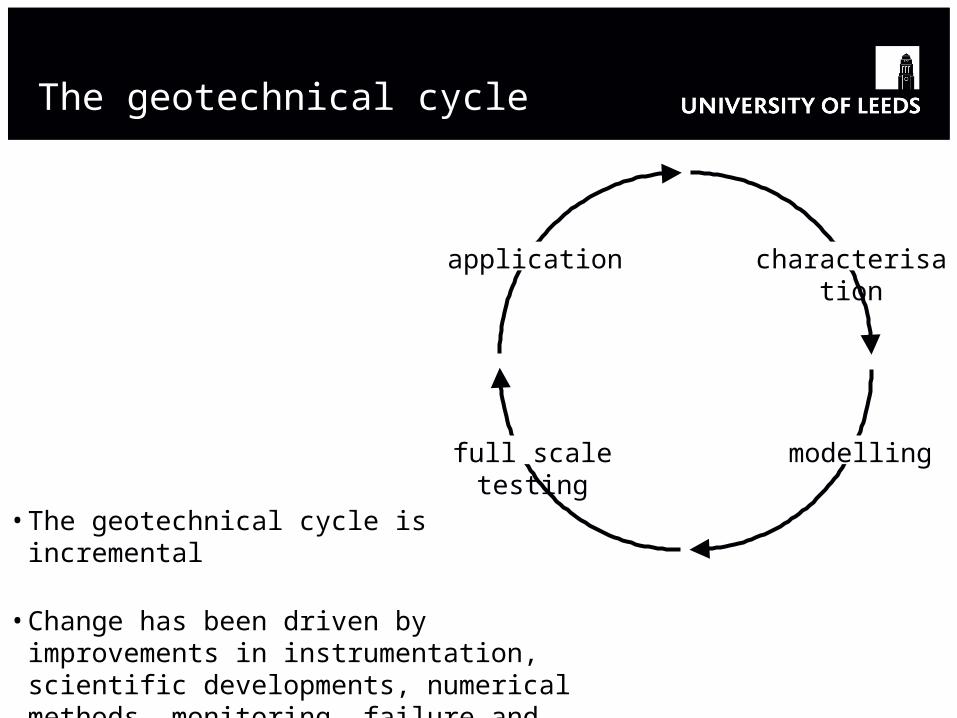
The geotechnical cycle
• The geotechnical cycle is incremental
• Change has been driven by improvements in instrumentation, scientific developments, numerical methods, monitoring, failure and products and processes
characterisation
modellingfull scale testing
application

Drivers for change
Carbon Emissions Water Reduction Waste Reduction Population
Driver Energy White Paper Water shortage and continuing
increase in population
Energy White Paper
Targets Zero carbon by 2016 for new build80% reduction in existing build by 2050
Reduction of 25% of water consumption by 2020 from the current water usage of 150
litres per day.
50% reduction in waste disposed from
Construction Projects by 2012
Policy Climate Change ActCode for sustainable homes
Code for Sustainable CommunitiesCommittee on Climate ChangeBuilding a low carbon economy
Waterwise and Govt Water Reduction
Targets
Waste and Resources Action Programme
(WRAP)
New BuildZero carbon
housing by 2016
Zero carbon schools by 2017
Zero carbon Public Buildings by 2018
Existing Stock80% reduction of 1990 CO2 levels
by 2050
+2.8m in UK 1996-2016
200m populationmigrationby 2050

Innovation
Product
ProcessPeople
e.g. Retrofit renewable energies
e.g. Remote excavation such as pipe jacking
e.g. Prefabricated components within a project such as tunnel formers
e.g. Offsite fabrication linked into design process where vertical and horizontal integration takes place.
e.g. Characterisation and modelling of the ground
e.g. Ground improvement techniques
(ConstructionSkills, 2009)

Construction continuum
Built heritagePre 1919
Traditional construction1920 - 2000
Modern Methods2000+
Offsite activity
Existing qualifications to meet existing needs and expanded to address
carbon agenda
New credit system to meet changing needs indentified by SSCs
Ind
ust
ry a
ctiv
ity
Tra
inin
g a
nd
Ed
uca
tio
n
Heritage skills
Fusion
Major international contractors and consultants
Regional contractors and consultants
National contractors and consultants
Large SMEs
Specialists contractors and consultants
Graduates
Professional development
Apprentices
Manufacturers
(ConstructionSkills, 2009)

School of Civil EngineeringFACULTY OF ENGINEERING
Institute of Resilient Infrastructure

Skirrid Fawr, S Wales a green and pleasant land, (Venables 2008)
The hidden lifelines

73
The lifelines

Resilient infrastructure
• Those lifeline systems that will be able to survive and perform well in an increasingly uncertain future.
• Existing and new infrastructure becoming more adaptable; and, being created, designed, built, operated, and / or, disposed of in current, new and emergent futures.
• The environmental, economic and social impact associated with demolition, disposal and replacement of infrastructure is comparable to the impacts created during its operational lifetime.
• Preserving and extending the life of infrastructure - i.e. enhancing its resilience - is the best way to maximise its sustainability and help protect our climate, resources and way of life.
Institute of Resilient Infrastructure
• The remit of the Institute covers sectors
• dealing with ‘civil-engineering structures’, for example, roads, railways, airports, flood defences, ports and harbours, water treatments plants, oil, gas and power plants and the utilities’ distribution infrastructures, and
• associated with ‘building-structures’ for example, schools, healthcare facilities, manufacturing plants, retail and industrial outlets, commercial offices, housing developments, and different types of government buildings.
• Short, medium and long term requirements

Engineering Solutions to
InfrastructureProvision
‘Old’ Technologies
New Technologies
Existing Technologies
‘Heritage’ Technologies
Investment Strategies
Asset ManagementManagerial & Supply
Structures
Existing Infrastructure
Institutional Structures
Policy Implications
New Infrastructure
Ca
teg
oris
ing
In
fra
stru
ctu
re
Typologies of
Response
Dri
vers
for
Ch
ang
e
Create Grand
Challenges
Developing Countries
Developed Countries
Institute of Resilient Infrastructure
Conclusion

Opportunities
• Energy • Efficiency through improved geotechnical processes• New distribution networks and storage systems• Barriers and barrages
• Protection and enhancement of sinks and reservoirs of greenhouse gases• Underground caverns• Storage in strata
• Protection of environment• Flood control• Ground water protection• Stabilisation of infrastructure• Future proofing landfill
• Promotion of sustainable forest management practices, afforestation and reforestation; • Landslide management
• Promotion of sustainable forms of agriculture; • Sustainable groundwater water supply• Water storage systems
• Renewable forms of energy, • Ground as a source of energy• Innovative geotechnical structures
• Waste• Reuse• Management

Future scenarios
Fortress Mentality: A closed economy without imports and exports or a transient migrant workforce forces re-localisation, generating a self-defence mentality. Cycling is the dominant modal share. Energy poverty reflects economic poverty as people lose their jobs and their homes. Exhaustion of crop and animal supply as people fight over resources.
Let it Rip: Economic growth and consumerism pursued at the expense of environment. The effects of climate change are well advanced and there is intense competition for increasingly scarce natural resources, the consumption of which has led to alarming levels of waste and C02 emissions. A heavy reliance on technology to combat climate change has increased the wealth gap between rich and poor nations.
Carbon Rationing: People's lifestyles are determined by a strict and enforced scheme of carbon consumption control, imposed by UK central government and overseen by the Carbon Commissar. Carbon is the new currency. Horizons and mobility have shrunk to an extent that people live a more local and community-focused lifestyle.
Technofix: Economic growth remains an important political objective, but state intervention promotes development of green and innovative technology, internalises external costs and redistributes of wealth. International cooperation ensures this is not an economic disadvantage. Choice and innovation still blossom. Following the global recession, London is no longer an international financial centre (nowhere is), but the UK is now a world leader in green technology
(Arup, 2009)

Speed of change
• Development of canal system over sixty years
• Development of rail system over sixty years

Acknowledgements
J Araruna, E Aflaki, A Harwood, C C Chen, D B Hughes, J R Peng, A Agab, K Kassim, A Akbar, P G Allan, S Hashemi, P N Hughes, A Richmond, O Davies, S Hamuda, T Boyd, A Crudgington, J Burland, C J F P Jones, S Glendinning, A Moir, C T Davie, S Patterson, M Martell, S Male, K Nizar, V Toporov, N J Smith, G Eton, S-H Lui, E Chen, M Latham, S Lilley, S Geary, S Wilkinson, P Purnell, A Sloan, D Nicholson, P Allen, D Cook, C Hunt, C P Wroth, D Windle, J Venables, C Dalton, A Gooding, H Butler
S Alexander, W Murphy, J R Barton, S M Bennett, P A Bishop, L Black, D A Bower, A E Brine, T W Cousens, R Creasey, M Cresciani, B E Evans, G P Flatt, J Webster, L A Fletcher, S Day, J P Forth, H S Gale, S W Garrity, I M Goodwill, R J Greenbank, M Mathews, D P Hamer, R Fowell, C Poole, Z Hickinson, N J Horan, M Karim, D Lam, D D Mara, M Marsden, S, Hudson, K Moodley, S Mortimer, C J Noakes, D Sagghedu, K A Pierre, JA Purkiss, I G Richardson, J West, Y Sheng, P A Sleigh, N J Smith, N Odling, E Stentiford, K Stevens, M Smith, D I Stewart, J A Tinker, G M Tomlinson, R Trembath, A Tutesigensi, J Uren, A S Watson, M Wilman, C A Wilson, E A Winning, J Ye