School Food Waste Reduction Summit Slides · The Facts about Food Waste ⊷ Approximately 30 to 40...
26
Welcome to the School Food Waste Reduction Summit
Transcript of School Food Waste Reduction Summit Slides · The Facts about Food Waste ⊷ Approximately 30 to 40...

Welcome to the
School Food
Waste Reduction
Summit

Welcome
Dr. Brian Schilling, PhD
• Director, Rutgers Cooperative Extension
• Senior Associate Director, NJ Agricultural Experiment Station

Food Insecurity & Food Waste
Dr. Shilpa Pai, MD
• Director, Resident Education in Advocacy & Community Health
• Co-Director, NJ Pediatric Residency Advocacy Collaborative
• AAP District III Community Access to Children's Health (CATCH) Facilitator
• Associate Professor of Pediatrics, Department of Pediatrics, Rutgers-Robert Wood Johnson Medical School

Case Study: Paterson, NJ
Sara Elnakib, RD, MPH
Family & Community Health Sciences Educator, Rutgers University

The Facts about Food Waste
⊷ Approximately 30 to 40 percent of the food supply, ends up as
food waste.
⊷ In 2010, an estimated 133 billion pounds of food from U.S. retail
food stores, restaurants, and homes–valued at approximately
$161 billion–went uneaten.
⊷ The land, water, labor, energy and other inputs used in producing,
processing, transporting, preparing, storing, and disposing of
discarded food is wasted.
⊷ In 2010, the bill for dumping food into landfills was more than $2
billion.
Source: https://www.usda.gov/oce/foodwaste/sources.htm
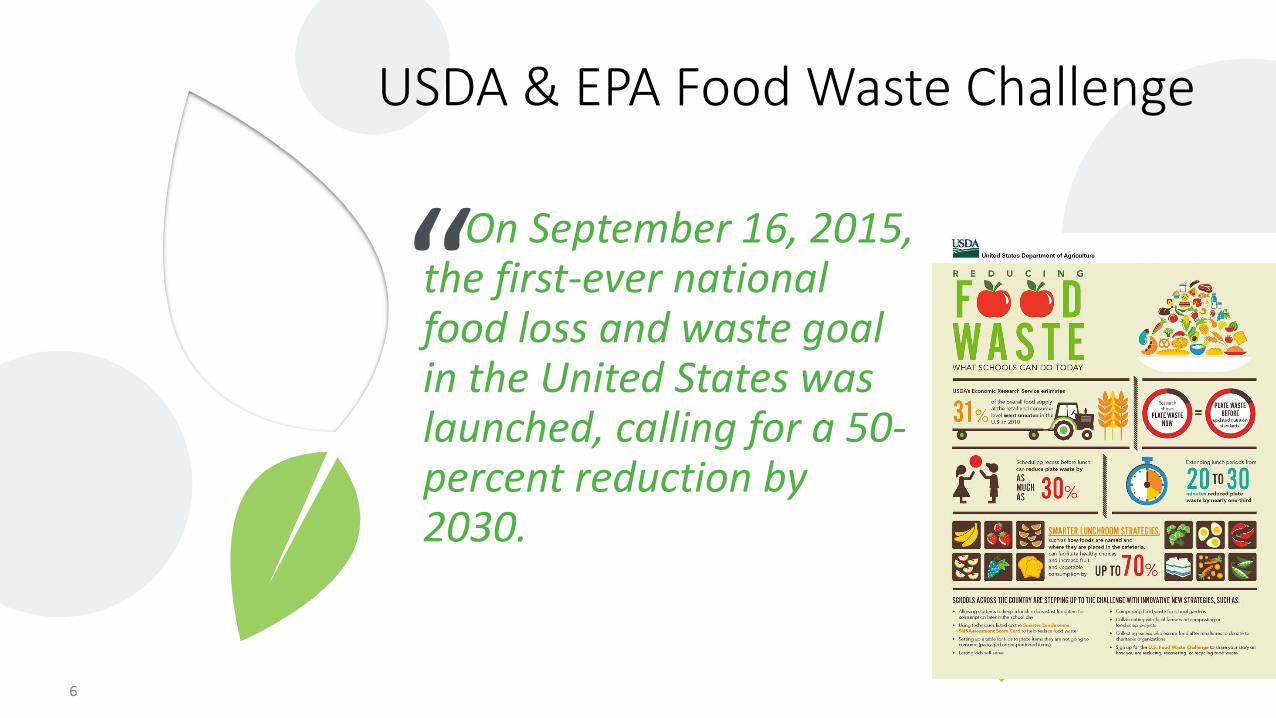
“On September 16, 2015, the first-ever national food loss and waste goal in the United States was launched, calling for a 50-percent reduction by 2030.
6
USDA & EPA Food Waste Challenge

The Guidelines for Schools
⊷ The NJDEP will be releasing the Food Waste Guidelines for both K-12 schools and Higher Education.
⊷ To achieve the goals of Bill S3027 we need to measure baseline food waste.
9

How to Reduce Food Waste?
10

11
Paterson’s Food Waste Program • Through a partnership with the Paterson
Public Schools we conducted an audit to assess the effect of training for Food Service Workers on food waste.
• Paterson Public Schools is under the Community Eligibility Provision
• All students receive free Breakfast & Lunch

Design of this Study⊷ We wanted to measure the plate waste before
and after the training. We only measured 15 elementary and middle schools that cooked their own meals.⊶ Sample tray were weighed as a pre-
consumption measure.⊶ After the food was consumed each food
component was weighed separately separately. (fruits, vegetables, milk and entrée [grain/protein])
⊶ Each school was measured twice before and after the training.

Training Program
⊷ Smarter Lunchrooms Movement
⊷ Offer Vs. Serve
13

Smarter Lunchrooms Movement
• The Cornell B.E.N. Center researches how behavioral economics influences students’ food choices.
• Make healthy choices visible, convenient, and appealing to students
• In the language of behavioral economics, these factors are called Visibility and Convenience, and they influence consumers’ choices.
• Most choices are so subliminal they seem automatic
• Choices influenced by environment
• Change your environment = Change your habits.
14

Examples of Smarter Lunchroom Strategies• Focus on Fruits
• At least two kinds of fruit are offered.
• Sliced or cut fruit is offered.
• Vary the Vegetables• Both hot and cold vegetables are offered.
• When cut, raw vegetables, are offered, they are paired with a low-fat dip such as ranch, hummus, or salsa.
• Highlight the Salad• Pre-packaged salads or a salad bar is available
to all students.
• Pre-packaged salads or a salad bar is in a high-traffic area.
• Move More White Milk• White milk is displayed in front of other beverages in
all coolers.
• 1% or non-fat white milk is identified as the featured milk and is labeled with a creative, descriptive name.
• Lunchroom Atmosphere• Attractive, healthful food posters are displayed in
dining and service areas.
• Cafeteria staff smile and greet students upon entering the service line and throughout meal service.
15

Offer vs. Serve
• According to guidelines by the USDA, students do not need to take all 5 components of a meal for the school to be reimbursed for that meal.
• A student may choose 3 our of the 5 components at lunch and the school will be reimbursed as long as the student takes a fruit or vegetable.

Food Waste-Pre Intervention
530 pounds of waste
570 pounds of waste
902 pounds of waste
471 pounds of waste
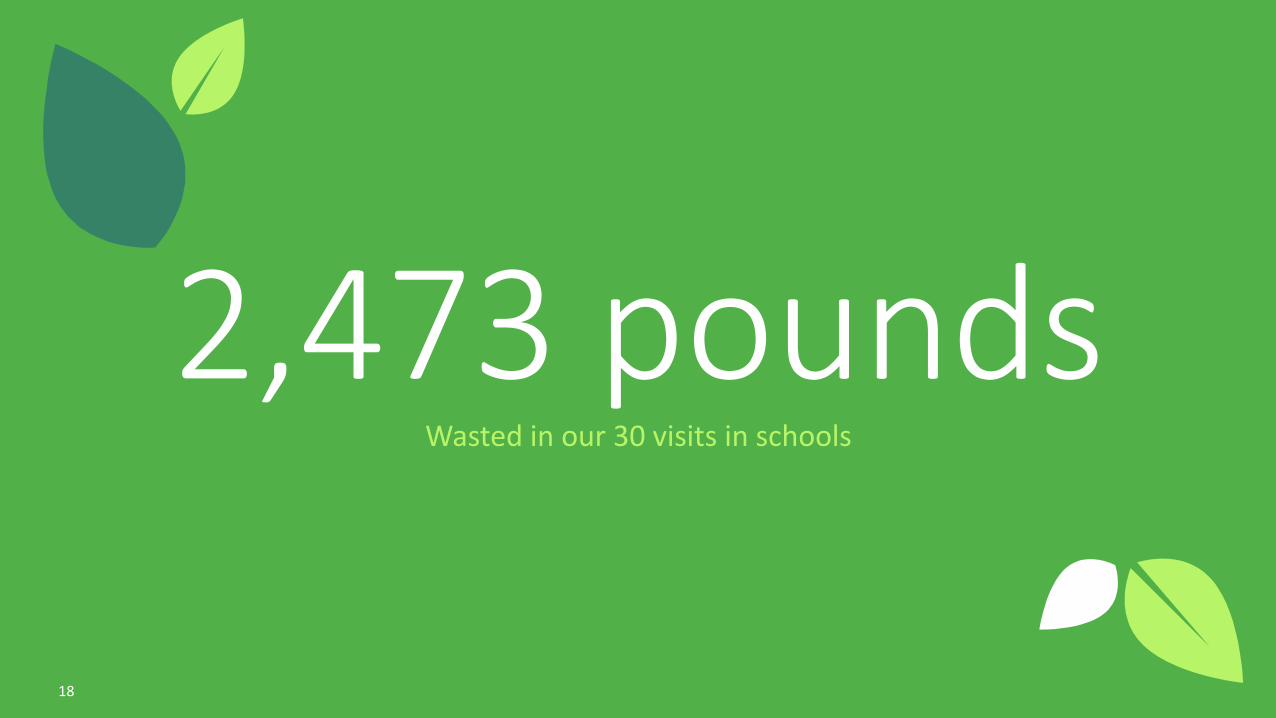
2,473 poundsWasted in our 30 visits in schools
18

What does this mean?
⊷ That is approximately 84 pounds of waste per school per day
⊷ Which means it can be as much as 14,838 pounds of waste a year per school.
⊷ 623,196 pounds of food waste for the whole district for the year.

Food Waste: Post-Intervention
380 pounds of waste
490 pounds of waste
804 pounds of waste
449 pounds of waste
28% of Fruit Saved
(150 lbs)
14% of Vegetables Saved
(80 lbs)
10% of Milk Saved
(98 lbs)
5% of Grain & Protein Saved (22 lbs)

350 poundsof food saved after our training
21
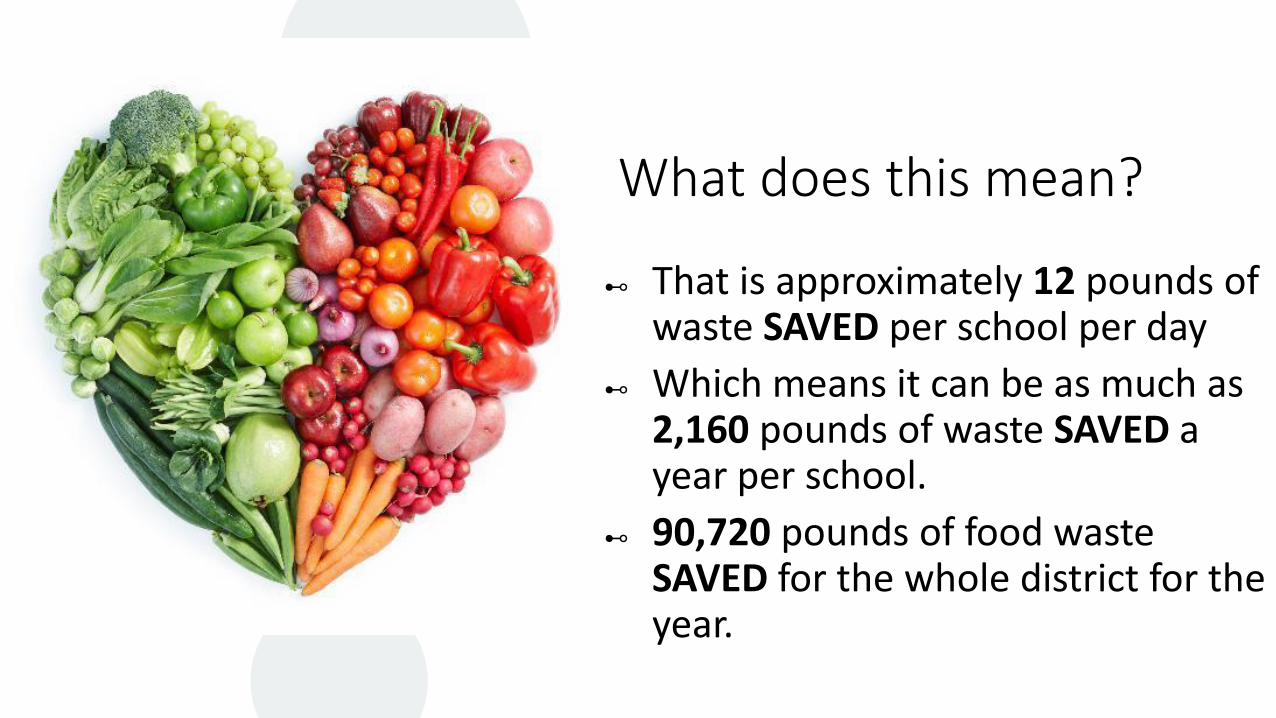
What does this mean?
⊷ That is approximately 12 pounds of waste SAVED per school per day
⊷ Which means it can be as much as 2,160 pounds of waste SAVED a year per school.
⊷ 90,720 pounds of food waste SAVED for the whole district for the year.

23
$76,452 cost savings for the school district per year

Panel Discussion
David Buchholtz
Director of Food Services,
Paterson Public Schools
Jennifer Apostol
Director of MCFOODS
Jennifer Shukaitis
Family & Community Health Sciences Educator,
Rutgers University
Dr. Shilpa Pai
Director, Resident Education in Advocacy & Community Health,
Rutgers-Robert Wood Johnson Medical School

School Food Waste
Design-a-thon

Thank You