School Finance in Colorado Research Publication No. 746 · 2020-04-23 · Base Per Pupil $ Funding...
66
2020 School Finance in Colorado
Transcript of School Finance in Colorado Research Publication No. 746 · 2020-04-23 · Base Per Pupil $ Funding...
2020School Finance in Colorado
debbie_grunlien
Text Box
Research Publication No. 746

FOREWORD
The purpose of this publication is to help readers understand how Colorado finances its public
elementary and secondary schools. The major focus is an explanation of the funding formula included
in the Public School Finance Act of 1994, including amendments made to the act in 2019. Several
illustrations are provided to help readers calculate funding under the formula. The booklet also
describes several other provisions of law that relate to school district funding. These provisions
include a description of revenue that is earmarked for specific functions, other local sources of
revenue, categorical programs, and the Colorado Preschool Program. Please note that this publication
is intended to provide a summary overview of programs that affect funding for schools; state law
should be consulted for more specific details on the operation of the programs or for information on
other programs that provide money to school districts.
This publication was prepared by the Colorado Legislative Council Staff, the nonpartisan research
staff of the Colorado General Assembly. It is available online at:
http://leg.colorado.gov/agencies/legislative-council-staff/school-finance
The numbers in this handbook reflect the FY 2019-20 appropriation contained in HB 20-1260, the
midyear supplemental adjustment, and are subject to change.

This page intentionally left blank.
TABLE OF CONTENTS
Summary of School Finance Funding ........................................................................................................... 1
Per Pupil Funding by District ..................................................................................................................... 2
Who Pays for a School District’s Funding? ........................................................................................... 3
Colorado’s School Finance Act ..................................................................................................................... 5
The Funding Formula ................................................................................................................................ 5
How Are Pupils Counted? ..................................................................................................................... 5
How Is Per Pupil Funding Calculated? ................................................................................................. 7
Statewide Base is Starting Point ........................................................................................................... 7
What Is At-Risk Funding? ................................................................................................................... 10
How Are Online and ASCENT Students Funded? .............................................................................. 13
What Is the Budget Stabilization Factor? ............................................................................................ 13
Local Share and State Aid ...................................................................................................................... 14
How Is the Local Share Calculated? ................................................................................................... 14
Property Taxes Provide Most Local Revenue ..................................................................................... 14
Specific Ownership Taxes Supplement Property Taxes ..................................................................... 15
How Is State Aid Calculated? ................................................................................................................. 16
State Aid Comes Primarily From Three Sources ................................................................................ 16
Modifications to the Funding Formula ..................................................................................................... 17
Earmarked Revenue ............................................................................................................................... 19
School Districts May Raise Additional Property Taxes for Operating Purposes ................................ 19
Unequalized District Property Taxes Also Pay for Debt ..................................................................... 20
“Growth” Districts May Raise Additional Property Taxes for Capital Improvements .......................... 21
Transportation Levies Require Voter Approval ................................................................................... 21
Full-Day Kindergarten May Be Funded From Voter-Approved Property Taxes ................................. 21
Voters May Also Approve Special Building or Technology Levies ..................................................... 21
Cash Flow Loan Program ....................................................................................................................... 22
State Contingency Reserve .................................................................................................................... 22
Capital Construction ................................................................................................................................ 22
The Public School Capital Construction Assistance Fund Provides Matching Grants to School Districts ................................................................................................................................................ 23
Charter Schools Receive Money for Capital ....................................................................................... 23
Funding Formulas ....................................................................................................................................... 25
Calculation Examples .................................................................................................................................. 27
Categorical Programs ................................................................................................................................. 33
Colorado Preschool Program ...................................................................................................................... 37
Glossary ...................................................................................................................................................... 39
Appendix A: School District Map Key ......................................................................................................... 43
Appendix B: School Districts in Colorado House Districts .......................................................................... 45
Appendix C: School Districts in Colorado Senate Districts ......................................................................... 55

This page intentionally left blank.

School Finance in Colorado 1
SUMMARY OF SCHOOL FINANCE FUNDING
1) Calculate Per Pupil Funding for Each District
Multiply statewide base per pupil funding by district-level factors to determine per pupil funding
for each district.
2) Calculate Total Funding Required for Each District
To determine total funding for each district, multiply district per pupil funding by the number of
students in the district, then add funding for at-risk, online, and ASCENT students.
3) Determine the Local Share of Funding
The local government share of funding comes from property tax and specific owner tax
collections from property owners in the district.
4) Determine the Required Amount of State Aid
Subtract the local share of funding across all districts from the total funding required across all
districts to determine the total amount of state aid required by the school finance act.
5) Apply the Budget Stabilization Factor
The budget stabilization factor is a state budget element that proportionately reduces the amount
of total funding for each district, such that state aid is reduced.
Statewide Base Per Pupil
Funding $ District Per Pupil Funding
$1,500.01 - $3,559.24
$1,000.01 - $1,500.00
$750.01 - $1,000.00
$500.01 - $750.00
$10.13 - $500.00
Cost-of-Living Adjustment per Pupil, 2016-17
Cost-of-Living and Personnel Cost
Adjustments
Size Adjustment
+ = +
$5,000.01 - $10,095.92
$2,000.01 - $5,000.00
$1,000.01 - $2,000.00
$500.01 - $1,000.00
$56.15 - $500.00
Enrollment Size Adjustment per Pupil, 2016-17
$ District Per Pupil Funding
× District Pupil Count
+
At-Risk, Online, and/or ASCENT
Funding Total Funding Per District
$ =
Residential and Nonresidential Property Tax
$ Local Share Per District
+ =
Specific Ownership Tax
$ Local Share
Across Districts
$ State Aid
Across Districts
= − Total Funding Across Districts
$
$
Actual Total District Funding
Budget Stabilization Factor
= × Total Funding Per District
$ −%

2 School Finance in Colorado
Per Pupil Funding by District
Figure 1 shows total per pupil funding across the state’s 178 school districts for FY 2019-20. In
FY 2019-20, funding per pupil ranged from $8,056 in the Academy School District to $18,446 in the
Agate School District. A key for the school districts is provided in Appendix A on page 43. Per pupil
funding is highest in rural districts due primarily to the enrollment size factor adjustment in the school
finance formula. Per pupil funding is lowest in districts that qualify for little additional funding from
the size, cost-of-living, or at-risk adjustment factors. Per pupil funding amounts shown in Figure 1
are after the application of the budget stabilization factor, which reduces funding across most districts
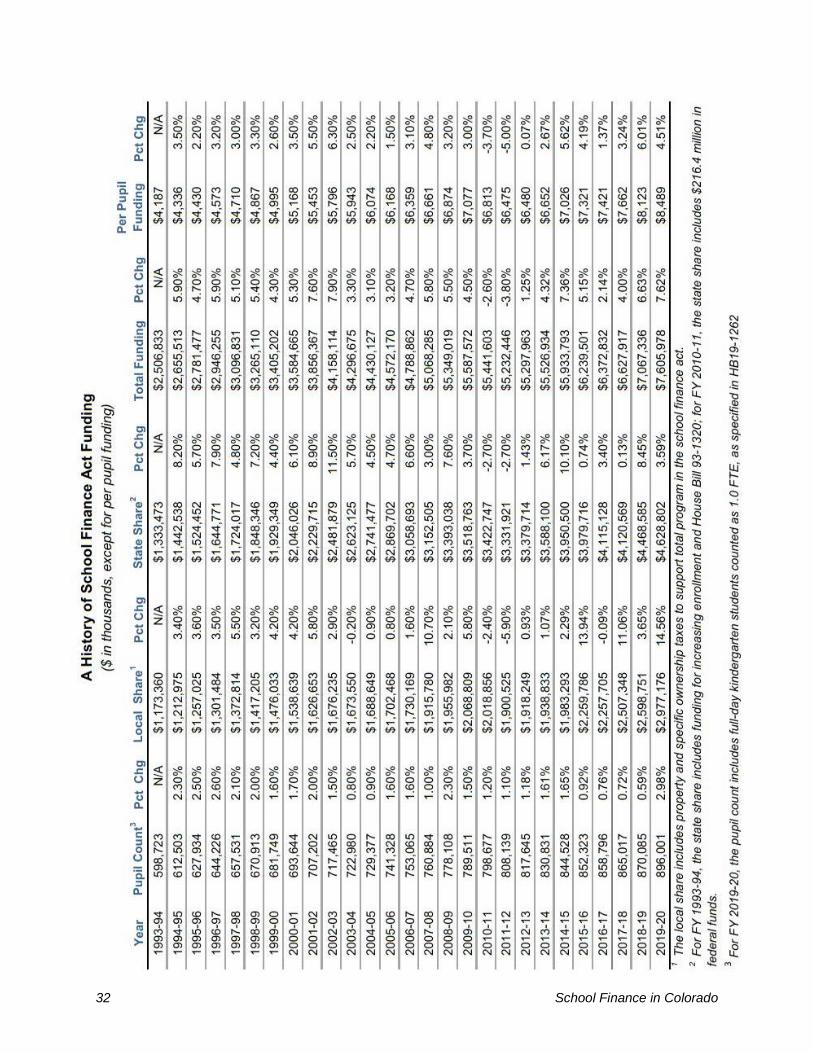
proportionally (see page 13 for more information). A history of total school finance act funding and
average per pupil funding is provided on page 32.
Figure 1 FY 2019-20 Total Per Pupil Funding
Source: Legislative Council Staff.
Note: Numbers in parentheses indicate the number of school districts in each tier.
School Finance in Colorado 3
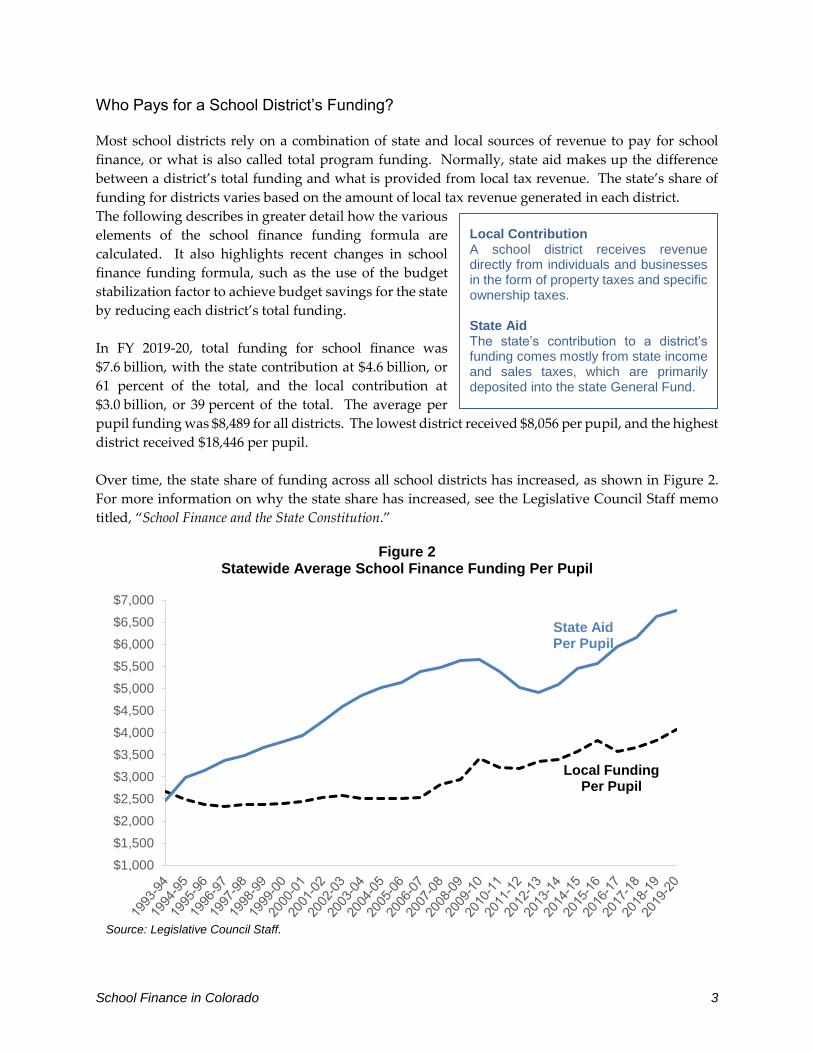
Who Pays for a School District’s Funding?
Most school districts rely on a combination of state and local sources of revenue to pay for school
finance, or what is also called total program funding. Normally, state aid makes up the difference
between a district’s total funding and what is provided from local tax revenue. The state’s share of
funding for districts varies based on the amount of local tax revenue generated in each district.
The following describes in greater detail how the various
elements of the school finance funding formula are
calculated. It also highlights recent changes in school
finance funding formula, such as the use of the budget
stabilization factor to achieve budget savings for the state
by reducing each district’s total funding.
In FY 2019-20, total funding for school finance was
$7.6 billion, with the state contribution at $4.6 billion, or
61 percent of the total, and the local contribution at
$3.0 billion, or 39 percent of the total. The average per
pupil funding was $8,489 for all districts. The lowest district received $8,056 per pupil, and the highest
district received $18,446 per pupil.
Over time, the state share of funding across all school districts has increased, as shown in Figure 2.
For more information on why the state share has increased, see the Legislative Council Staff memo
titled, “School Finance and the State Constitution.”
Figure 2 Statewide Average School Finance Funding Per Pupil
Source: Legislative Council Staff.
$1,000
$1,500
$2,000
$2,500
$3,000
$3,500
$4,000
$4,500
$5,000
$5,500
$6,000
$6,500
$7,000
State Aid Per Pupil
Local Funding Per Pupil
Local Contribution A school district receives revenue directly from individuals and businesses in the form of property taxes and specific ownership taxes. State Aid The state’s contribution to a district’s funding comes mostly from state income and sales taxes, which are primarily deposited into the state General Fund.

This page intentionally left blank.

School Finance in Colorado 5
COLORADO’S SCHOOL FINANCE ACT
Colorado’s school finance act distributed nearly $7.6 billion in state and local dollars to the state’s
178 school districts for K-12 public education in FY 2019-20. Currently, this money is allocated under
a law called the “Public School Finance Act of 1994.” The school finance act contains a formula that
calculates a per pupil funding amount for each school district based on the individual characteristics
of the district, such as the cost to live in the district and the number of students enrolled. The act is
explained in detail on the following pages, including amendments made under the most recent school
finance bill, Senate Bill 19-246, as amended through the mid-year supplemental, House Bill 20-1260
and including additional changes resulting from House Bill 19-1262, State Funding of Full Day
Kindergarten. The numbers in this handbook are subject to change.
The Funding Formula
A district’s funding under the school finance act is the number of pupils in the district multiplied by
the district’s preliminary per pupil funding level, plus an amount of money provided to compensate
a district for at-risk pupils, online students, and pupils participating in the accelerating students
through concurrent enrollment (ASCENT) program.
The following describes elements contained in state law that determine how pupils are counted and
how a school district’s per pupil funding is adjusted by certain factors. Most recently, because of
ongoing state budget constraints, the budget stabilization factor was implemented to reduce each
school district’s funding by a fixed percentage. This reduction is made after all other adjustments in
the funding formula are calculated. The budget stabilization factor was previously known as the
negative factor. An example of this adjustment is illustrated on page 31.
How Are Pupils Counted?
Funding under the school finance act is based on the number of pupils enrolled in the school district
on October 1. Thus, the number of pupils counted on October 1, 2019, determines funding for the
budget year beginning July 1, 2019. Because the fiscal year begins before the count date, state aid is
distributed based on estimated pupil counts. State aid is adjusted to reflect the actual count, usually
starting in January of the fiscal year.
The act provides an alternative to the October 1 count date in certain instances, such as when students
in a year-round educational program will be on vacation on October 1. This alternative count date
must be within 45 calendar days of the first school day after October 1.
School District Funding =
(Number of Pupils × Preliminary Per Pupil Funding)
+ At-Risk Funding + Online and ASCENT Funding
× Budget Stabilization Factor

6 School Finance in Colorado
The pupil count is expressed in full-time equivalent (FTE) pupils to reflect the amount of time a
student spends in an instructional setting. Preschool students are usually counted half time. Full-day
kindergarten students are counted 1.0 FTE, and half-day kindergarten students are counted as 0.58 of
a pupil. A school district’s pupil count also includes students who are enrolled in online programs
and students who are eligible to complete a fifth year of high school while enrolled concurrently in
higher education courses. The latter is called the ASCENT program.
The formula also makes enrollment allowances for districts that lose pupils from one year to
the next, recognizing that such districts may have difficulty budgeting for fewer pupils. The
pupil count for declining enrollment districts is the greater of a two-year, three-year, four-year,
or five-year average of the October counts.
Online, ASCENT, and a portion of preschool, kindergarten, and Charter School Institute students are
not included in the averaging formula. The number of pupils for which a district receives funding is
called the funded pupil count.
Figure 3 shows the funded pupil count for FY 2019-20, ranging from the smallest districts funded at
the minimum level of 50 FTE to Denver, funded at 91,185 FTE. The highest density of students is
along the Front Range from Pueblo north through Fort Collins. Other districts with relatively high
enrollment include those containing the cities of Grand Junction and Durango and districts located
along the western I-70 corridor between Summit County and Glenwood Springs. The smallest
districts are in the central and southern portions of the Eastern Plains and the northern portion of the
San Luis Valley. Figure 3
FY 2019-20 Funded Pupil Count
Source: Colorado Department of Education. Map created by Legislative Council Staff. Note: Numbers in parentheses indicate the number of school districts in each tier.
Funded Pupil Count = 0.5 x Preschool Count + Online and ASCENT Counts + .08 Half-Day Kindergarten Count + Greater of the current year’s K-12 count or a two-year, three-year, four-year, or five-year average of K-12 counts

School Finance in Colorado 7
How Is Per Pupil Funding Calculated?
A district’s preliminary per pupil funding is the result of adjusting the statewide base by various
factors representing district-specific characteristics including cost-of-living, personnel and
nonpersonnel costs, and enrollment size.
Statewide Base is Starting Point
The calculation of each district’s pupil funding starts with a statewide base per pupil funding amount
which is set annually by the General Assembly. The statewide base for FY 2019-20 is $6,951.53, an
increase of 2.7 percent ($182.76) over the prior year. Base funding accounts for about $6.2 billion of
the money allocated under the formula in FY 2019-20, or about 76 percent of total funding before
application of the budget stabilization factor.
Although the General Assembly sets the base annually, Article IX, Section 17, of the Colorado
Constitution, commonly referred to as Amendment 23, requires minimum increases for the base. The
amendment required that through FY 2010-11, the General Assembly increase the base each year at
least by the rate of inflation plus 1 percent, and by inflation thereafter. Because the inflation rate for
calendar year 2019 was 1.9 percent, a 1.9 percent increase is the minimum increase for FY 2020-21
required by Amendment 23. Figure 4 provides a history of statewide base per pupil funding dating
back to FY 2001-02. The gray portion of each bar represents the previous year’s per pupil funding,
while the blue portion represents the per pupil increase required by Amendment 23.
Figure 4 Statewide Base Per Pupil Funding
Source: Legislative Council Staff.
$2,000
$3,000
$4,000
$5,000
$6,000
$7,000
$8,000
Required Increases under Amendment 23
Preliminary Per Pupil Funding = (Statewide Base × Personnel Costs Factor × Cost of Living Factor) + (Statewide Base × Nonpersonnel Costs Factor)
× Size Factor
8 School Finance in Colorado
The Statewide Base Is Adjusted for Cost of Living
Each school district is assigned a factor to indicate the cost of living in the district relative to the cost
of living in other districts in the state. For FY 2019-20, the cost-of-living factors for school districts
range from about 1 percent to 65 percent. Statewide, an estimated $1.2 billion in FY 2019-20 school
finance funding is attributed to the cost-of-living factor, or 14.7 percent of total funding, before
application of the budget stabilization factor.
State law contains the method for calculating cost-of-living factors, but not the actual factors
themselves. Cost-of-living factors are certified to the Colorado Department of Education by the
Legislative Council Staff every two years following a study that measures the cost in each district of
an identical set of items, such as housing, goods and services, and transportation. The 2019 study set
factors for the 2020-21 and 2021-22 budget years. Under state law, a district’s factor from the prior
two-year cycle is increased when the cost of living in the district increases by a greater percentage
than the increase in the statewide average teacher salary used in the study. The 2019 study uses
representative purchases made by a household earning an average teacher’s salary of $56,547 per year.
This amount reflects the average salary for a teacher with a bachelor’s degree and ten or more years
of teaching experience, and represents a 6.46 percent increase over the $53,115 salary for a comparable
teacher in 2017.
In periods when average salaries increase by 1.0 percent or more, the increase in the factor is equal to
the percentage change in the district's cost of living divided by the percentage change in the salary
level divided by 1,000. The increase in the factor is rounded to three decimal places.
District “Personnel Costs Factor” Defines the Portion of the Statewide Base Adjusted for Cost of Living
The formula recognizes that differences in the cost of living primarily affect the salaries that must be
paid to hire and retain qualified personnel. Therefore, the cost-of-living factor is applied only to the
portion of the base that relates to personnel, as defined by the personnel costs factor.
The personnel costs factor ranges from 79.9 percent to 90.5 percent and differs by district according to
enrollment. Smaller districts have smaller factors and, therefore, a smaller portion of the base is
increased for cost of living. Larger districts spend a higher proportion of their budgets on personnel
costs than smaller districts, and thus receive a larger increase to their base from the cost-of-living
factor. The formula for determining district personnel costs factors is illustrated on page 28.
Each district's "nonpersonnel costs factor" is the difference between 100 percent and the district's
personnel costs factor. It is the portion of the base that is not adjusted for cost of living and ranges
from 9.5 percent to 20.1 percent.
For FY 2019-20, Figure 5 shows the adjustments made for cost of living and personnel costs across
school districts. Adjustments range from $14 to $3,886 per pupil. As the figure demonstrates, the
highest cost-of-living adjustments come in districts associated with the resort communities of Aspen
and Telluride. Districts along the Front Range and in other areas of the mountain region also receive
relatively high cost-of-living adjustments. Rural districts in the central and southern portions of the
Eastern Plains receive the lowest adjustments for this factor.

School Finance in Colorado 9
Figure 5
Per Pupil Funding Increase from Cost-of-Living and Personnel Cost Factor Adjustments, FY 2019-20
Source: Legislative Council Staff. Note: Numbers in parentheses indicate the number of school districts in each tier.
Size Factor Adjusts for Economies of Scale
The act includes a size factor that provides additional money to all school districts, but particularly
small school districts unable to take advantage of economies of scale. In FY 2019-20, approximately
$343.3 million is allocated through the size factor, or about 4.2 percent of total funding, before
application of the budget stabilization factor.
Like the personnel costs factor, a size factor is calculated under a formula using district
enrollment. The smallest districts — districts with enrollments of fewer than 5,000 students — receive
the largest size factors and, therefore, more funding per pupil. All other districts receive a size factor,
which provides an increase in per pupil funding of about 3 percent. The formula for calculating a
school district's size factor appears on page 29.
Since the formula for determining the size factor is based on a district's enrollment, the act
acknowledges that the formula inherently provides incentives and disincentives for districts to
reorganize and take advantage of the formula. For example, when a reorganization results in a lower
size factor, and less funding per pupil, the lower size factor is phased in over six years. When a
reorganization results in a higher size factor, and more funding per pupil, the district or districts
involved in the reorganization receive the lower size factor of the original district. Thus, the act lessens
the negative fiscal impact of reorganization, while prohibiting a district from taking advantage of a
higher size factor following reorganization.

10 School Finance in Colorado
The act also attempts to minimize the effect that charter schools may have on the size factor of small
school districts. The size factor for districts with fewer than 500 pupils is calculated using the district's
enrollment minus 65 percent of the pupils enrolled in charter schools.
For FY 2019-20, Figure 6 shows the adjustment made for the enrollment size factor across school
districts. Adjustments range from $83 to $11,029 per pupil. Districts that receive the largest funding
adjustment from this factor are the small rural districts concentrated on the Eastern Plains and the
northern and southern portions of the San Luis Valley. The largest enrollment districts receiving the
smallest funding adjustment from this factor are clustered along the Front Range and the western I-70
corridor.
Figure 6
Per Pupil Funding Increase from the Size Factor Adjustment, FY 2019-20
Source: Legislative Council Staff. Note: Numbers in parentheses indicate the number of school districts in each tier.
What Is At-Risk Funding?
Colorado's school finance act provides additional funding for school districts that serve students who
are at risk of failing or dropping out of school. The additional funding depends on the district's
preliminary per pupil funding, the number of at-risk students, and the proportion of at-risk students
in the district. In FY 2019-20, the act provides $360.3 million in at-risk funding statewide, or 4.4 percent
of total funding, before application of the budget stabilization factor. At-risk funding is determined
according to the following formula.
At-Risk Funding = (At-Risk Pupils × 12% × Preliminary Per Pupil Funding) + At-Risk Funding Premium
School Finance in Colorado 11
Definition of At-Risk Pupils Follows the Federal Free Lunch Program and Includes Some Students with Limited English Skills
Under the act, at-risk pupils are defined as students from low-income families, as measured by
eligibility for free lunches under the National School Lunch Act. The definition of at-risk pupils also
includes a limited number of non-English-speaking students.
Students qualify for free meals at school based on their family's income. The act defines at-risk
pupils as those who are eligible for free lunches so districts can receive funding for students who do
not actually participate in the federal program. As an alternative, the act allows districts to use the
proportion of free-lunch students in grades one through eight multiplied by the district's enrollment
if it produces a larger number than the actual count. This alternative count is provided because some
high schools do not offer free lunches, and some students choose not to participate in the free lunch
program, especially at the high school level.
A student with limited English skills, as defined by the English Language Proficiency Act, can be
included in the at-risk count if the student meets one of two criteria. First, a student can be counted
if he or she took the statewide assessment in a language other than English in the preceding year.
Second, a student can be counted if the student’s assessment scores were not included in calculating
school academic performance. In either case, a student can be counted as at-risk only once; therefore,
a student who is counted under the income guidelines of the free lunch program cannot be counted
because of limited proficiency in English.
Preschool students are not included in a district's at-risk count. The official date for counting at-risk
pupils is October 1.
Proportion of At-Risk Students Determines At-Risk Funding
The proportion of at-risk students in a district determines the amount of funding a district receives
for its at-risk pupils. Every district receives at least 12 percent of its preliminary per pupil funding for
each at-risk pupil.
Districts with higher-than-average proportions of at-risk students receive a premium above this initial
amount for those at-risk pupils. The amount of this premium depends upon enrollment in the district
and the degree to which the district's share of at-risk students exceeds the statewide average. For
districts with enrollments between 459 and 50,000, the premium is equal to 12 percent plus 0.30 of a
percentage point for each percentage point that the district's at-risk percentage exceeds the
statewide average. Thus, if the statewide average is 30 percent, and 41 percent of a particular
district's students qualify for at-risk funding, the district would receive a premium of 15.3 percent
(12.0 + (0.3 × 11) = 15.3) for qualifying students. For districts with enrollments greater than 50,000, the
premium is equal to 12 percent plus 0.36 of a percentage point for each percentage point that the
district's at-risk percentage exceeds the statewide average. The premium is capped at 30 percent, so
18 percentage points is the maximum that can be added to the existing 12 percent of per pupil
funding provided for each at-risk student.
12 School Finance in Colorado
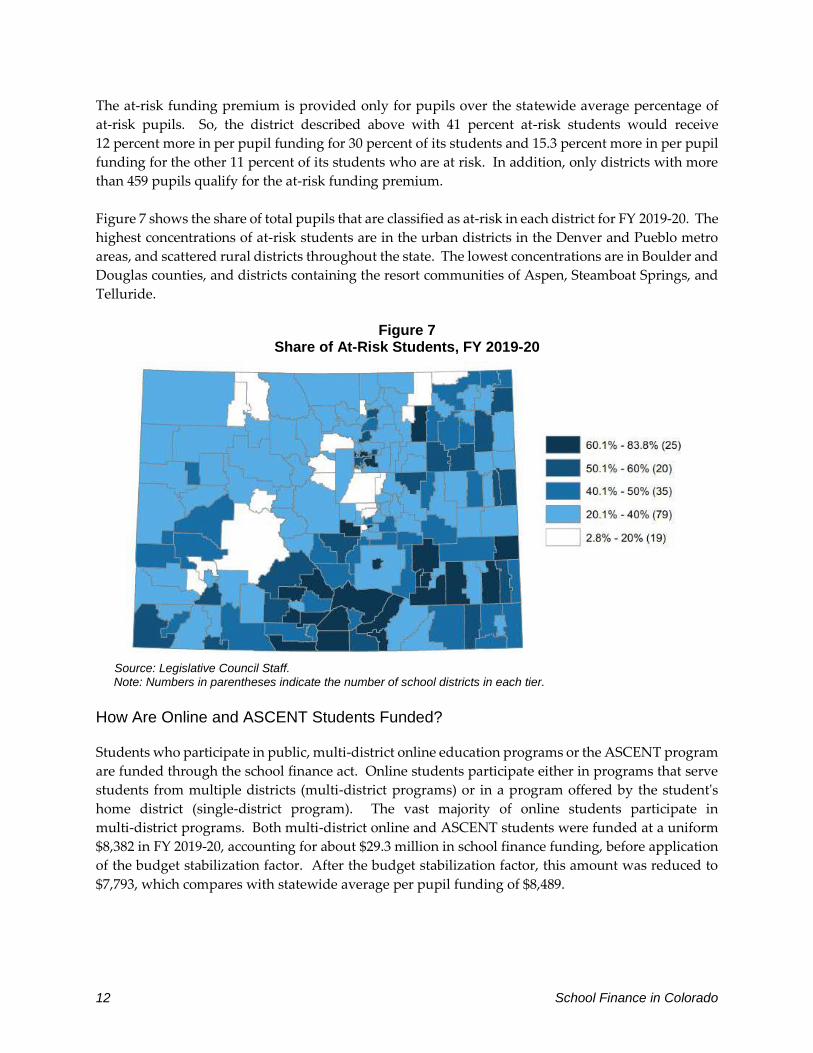
The at-risk funding premium is provided only for pupils over the statewide average percentage of
at-risk pupils. So, the district described above with 41 percent at-risk students would receive
12 percent more in per pupil funding for 30 percent of its students and 15.3 percent more in per pupil
funding for the other 11 percent of its students who are at risk. In addition, only districts with more
than 459 pupils qualify for the at-risk funding premium.
Figure 7 shows the share of total pupils that are classified as at-risk in each district for FY 2019-20. The
highest concentrations of at-risk students are in the urban districts in the Denver and Pueblo metro
areas, and scattered rural districts throughout the state. The lowest concentrations are in Boulder and
Douglas counties, and districts containing the resort communities of Aspen, Steamboat Springs, and
Telluride.
Figure 7
Share of At-Risk Students, FY 2019-20
Source: Legislative Council Staff. Note: Numbers in parentheses indicate the number of school districts in each tier.
How Are Online and ASCENT Students Funded?
Students who participate in public, multi-district online education programs or the ASCENT program
are funded through the school finance act. Online students participate either in programs that serve
students from multiple districts (multi-district programs) or in a program offered by the student's
home district (single-district program). The vast majority of online students participate in
multi-district programs. Both multi-district online and ASCENT students were funded at a uniform
$8,382 in FY 2019-20, accounting for about $29.3 million in school finance funding, before application
of the budget stabilization factor. After the budget stabilization factor, this amount was reduced to
$7,793, which compares with statewide average per pupil funding of $8,489.

School Finance in Colorado 13
What Is the Budget Stabilization Factor?
In an effort to generate budget savings for the state, House Bill 10-1369 included a new factor called
the budget stabilization factor for FY 2010-11 and FY 2011-12. For most districts, after all the funding
adjustments required by the school finance act are calculated, this factor reduces total funding
proportionately across districts.
Senate Bill 11-230 changed the name of this factor to the negative factor and extended its applicability
indefinitely; Senate Bill 17-296 changed the name back to budget stabilization factor. In FY 2019-20,
for most districts, the budget stabilization factor reduced total funding by approximately 7.0 percent,
or a total of $572.4 million compared to what would have been funded without the factor. Per pupil
funding fell by a similar percentage, although certain districts with limited state aid did not lose as
much funding. Districts with limited state aid were instead required to contribute through a buyout
of state spending on categorical programs, described on page 18.
For FY 2019-20, Figure 8 shows the adjustment made for the budget stabilization factor across school
districts, ranging from $0 to $1,394 per pupil. While the budget stabilization factor imposes the same
percentage reduction on total and per pupil funding for all districts not fully paid with local sources,
the per pupil reduction can vary widely on a level basis. Front Range districts incur a smaller funding
reduction because they have lower per pupil funding levels. In contrast, small rural districts on the
Eastern Plains and in the northern San Luis Valley incur a larger reduction on a per pupil basis due to
their higher per pupil funding levels. In FY 2019-20, the funding reduction for Jefferson County
School District was $627 per pupil, while the funding reduction for the Karval School District was
$1,304 per pupil. In general, the per pupil reduction is inversely related to the degree to which the
district is locally funded, and the funded pupil count.
Figure 8
Budget Stabilization Factor Per Pupil Funding Decrease, FY 2019-20
Source: Legislative Council Staff. Note: Numbers in parentheses indicate the number of school districts in each tier.
14 School Finance in Colorado
Local Share and State Aid
The money to fund the school finance act comes from a combination of local and state sources. In
FY 2019-20, local taxes contributed 39 percent of total funding, or $3.0 billion, while state sources
accounted for the remaining 61 percent, or $4.6 billion. These percentages vary widely among
individual school districts, however, because districts have different amounts of property wealth and
different property tax rates. Under the act, each district's local share is calculated first, and state aid
makes up the difference between the local portion and the total funding need identified through the
formula. The principle of using state aid to make up for differences in local property wealth is called
"equalization."
How Is the Local Share Calculated?
A district's local share comes from two sources — property taxes and specific ownership taxes.
Property taxes are paid on real estate and business equipment; specific ownership taxes are paid on
motor vehicles. Of the two taxes, property taxes produce the vast majority of the local contribution,
roughly 93 percent of the total. Both of these taxes are described in greater detail below.
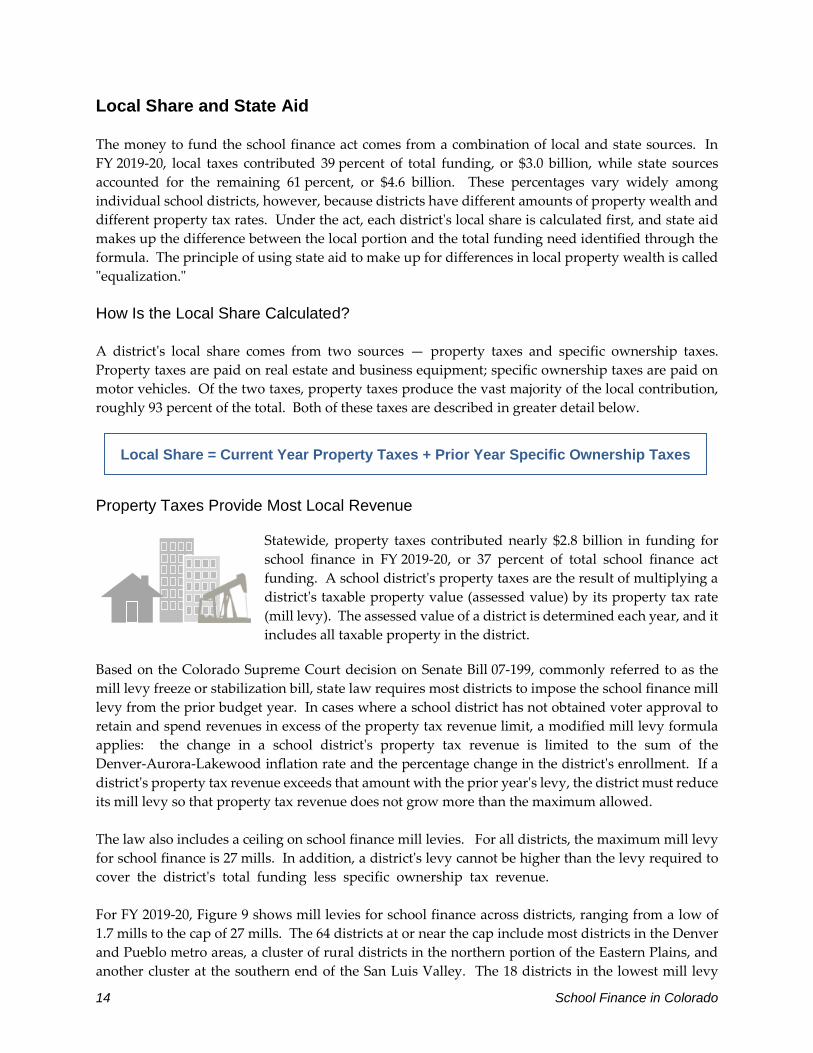
Property Taxes Provide Most Local Revenue
Statewide, property taxes contributed nearly $2.8 billion in funding for
school finance in FY 2019-20, or 37 percent of total school finance act
funding. A school district's property taxes are the result of multiplying a
district's taxable property value (assessed value) by its property tax rate
(mill levy). The assessed value of a district is determined each year, and it
includes all taxable property in the district.
Based on the Colorado Supreme Court decision on Senate Bill 07-199, commonly referred to as the
mill levy freeze or stabilization bill, state law requires most districts to impose the school finance mill
levy from the prior budget year. In cases where a school district has not obtained voter approval to
retain and spend revenues in excess of the property tax revenue limit, a modified mill levy formula
applies: the change in a school district's property tax revenue is limited to the sum of the
Denver-Aurora-Lakewood inflation rate and the percentage change in the district's enrollment. If a
district's property tax revenue exceeds that amount with the prior year's levy, the district must reduce
its mill levy so that property tax revenue does not grow more than the maximum allowed.
The law also includes a ceiling on school finance mill levies. For all districts, the maximum mill levy
for school finance is 27 mills. In addition, a district's levy cannot be higher than the levy required to
cover the district's total funding less specific ownership tax revenue.
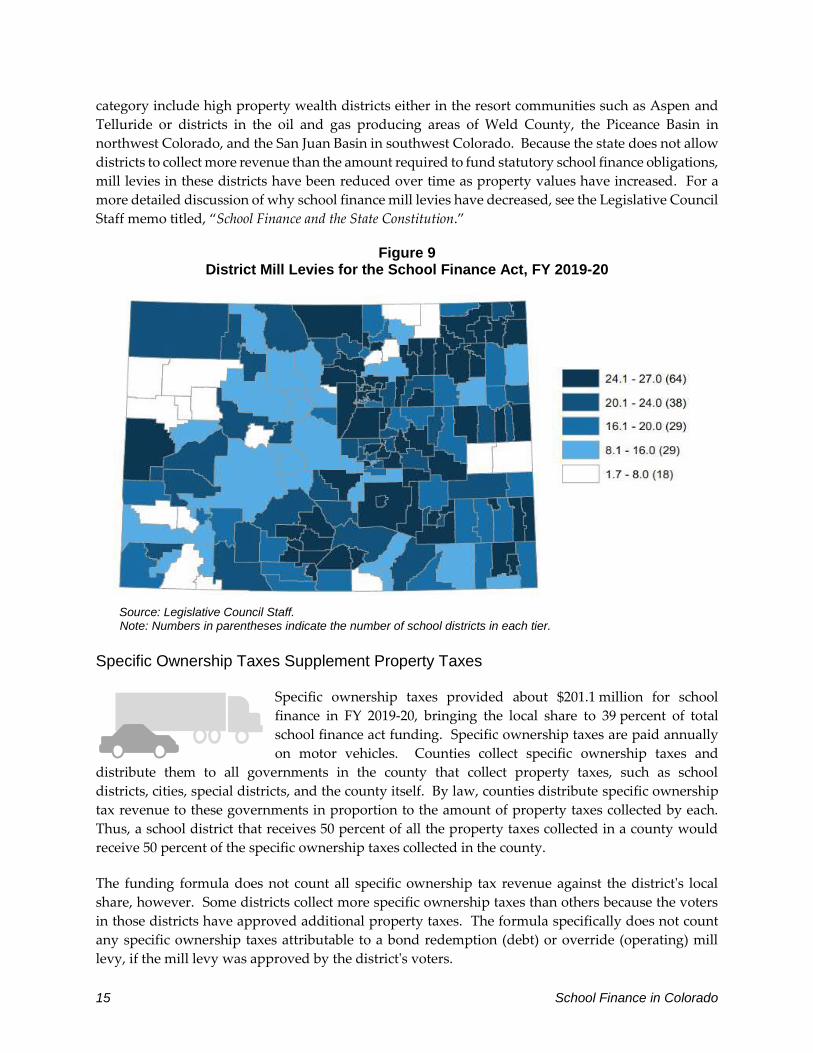
For FY 2019-20, Figure 9 shows mill levies for school finance across districts, ranging from a low of
1.7 mills to the cap of 27 mills. The 64 districts at or near the cap include most districts in the Denver
and Pueblo metro areas, a cluster of rural districts in the northern portion of the Eastern Plains, and
another cluster at the southern end of the San Luis Valley. The 18 districts in the lowest mill levy
Local Share = Current Year Property Taxes + Prior Year Specific Ownership Taxes
15 School Finance in Colorado
category include high property wealth districts either in the resort communities such as Aspen and
Telluride or districts in the oil and gas producing areas of Weld County, the Piceance Basin in
northwest Colorado, and the San Juan Basin in southwest Colorado. Because the state does not allow
districts to collect more revenue than the amount required to fund statutory school finance obligations,
mill levies in these districts have been reduced over time as property values have increased. For a
more detailed discussion of why school finance mill levies have decreased, see the Legislative Council
Staff memo titled, “School Finance and the State Constitution.”
Figure 9 District Mill Levies for the School Finance Act, FY 2019-20
Source: Legislative Council Staff. Note: Numbers in parentheses indicate the number of school districts in each tier.
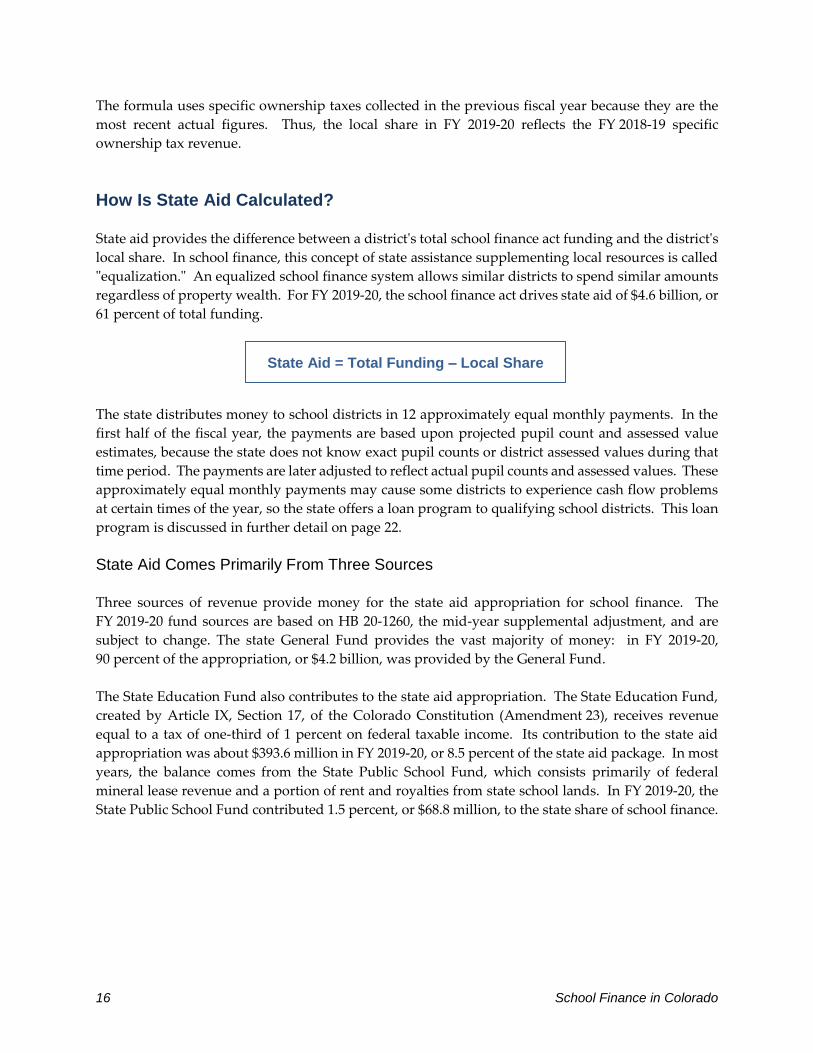
Specific Ownership Taxes Supplement Property Taxes
Specific ownership taxes provided about $201.1 million for school
finance in FY 2019-20, bringing the local share to 39 percent of total
school finance act funding. Specific ownership taxes are paid annually
on motor vehicles. Counties collect specific ownership taxes and
distribute them to all governments in the county that collect property taxes, such as school
districts, cities, special districts, and the county itself. By law, counties distribute specific ownership
tax revenue to these governments in proportion to the amount of property taxes collected by each.
Thus, a school district that receives 50 percent of all the property taxes collected in a county would
receive 50 percent of the specific ownership taxes collected in the county.
The funding formula does not count all specific ownership tax revenue against the district's local
share, however. Some districts collect more specific ownership taxes than others because the voters
in those districts have approved additional property taxes. The formula specifically does not count
any specific ownership taxes attributable to a bond redemption (debt) or override (operating) mill
levy, if the mill levy was approved by the district's voters.
16 School Finance in Colorado
The formula uses specific ownership taxes collected in the previous fiscal year because they are the
most recent actual figures. Thus, the local share in FY 2019-20 reflects the FY 2018-19 specific
ownership tax revenue.
How Is State Aid Calculated?
State aid provides the difference between a district's total school finance act funding and the district's
local share. In school finance, this concept of state assistance supplementing local resources is called
"equalization." An equalized school finance system allows similar districts to spend similar amounts
regardless of property wealth. For FY 2019-20, the school finance act drives state aid of $4.6 billion, or
61 percent of total funding.
The state distributes money to school districts in 12 approximately equal monthly payments. In the
first half of the fiscal year, the payments are based upon projected pupil count and assessed value
estimates, because the state does not know exact pupil counts or district assessed values during that
time period. The payments are later adjusted to reflect actual pupil counts and assessed values. These
approximately equal monthly payments may cause some districts to experience cash flow problems
at certain times of the year, so the state offers a loan program to qualifying school districts. This loan
program is discussed in further detail on page 22.
State Aid Comes Primarily From Three Sources
Three sources of revenue provide money for the state aid appropriation for school finance. The
FY 2019-20 fund sources are based on HB 20-1260, the mid-year supplemental adjustment, and are
subject to change. The state General Fund provides the vast majority of money: in FY 2019-20,
90 percent of the appropriation, or $4.2 billion, was provided by the General Fund.
The State Education Fund also contributes to the state aid appropriation. The State Education Fund,
created by Article IX, Section 17, of the Colorado Constitution (Amendment 23), receives revenue
equal to a tax of one-third of 1 percent on federal taxable income. Its contribution to the state aid
appropriation was about $393.6 million in FY 2019-20, or 8.5 percent of the state aid package. In most
years, the balance comes from the State Public School Fund, which consists primarily of federal
mineral lease revenue and a portion of rent and royalties from state school lands. In FY 2019-20, the
State Public School Fund contributed 1.5 percent, or $68.8 million, to the state share of school finance.
State Aid = Total Funding – Local Share

School Finance in Colorado 17
Figure 10 shows the state share of total funding across school districts for FY 2019-20, ranging from a
low of 0 percent to a high of 94.4 percent. Seven districts, Cripple Creek, Estes Park, Fort Lupton,
North Park, Pawnee, Platte Valley, and Prairie, were fully locally funded in FY 2019-20. As discussed
on page 18, these districts had to buy back some of their state funding for categorical programs, as
they could not fully implement the required budget stabilization factor reduction. Districts receiving
a relatively high state share include districts in the Las Animas, Piceance, and San Juan basins where
oil and natural gas production has declined. As a result, because district mill levies were previously
reduced, the decline in the property tax base required additional state funding for school finance.
Figure 10 State Share of Total Funding After Application of the Budget Stabilization Factor,
FY 2019-20
Source: Legislative Council Staff.
Note: Numbers in parentheses indicate the number of school districts in each tier.
Modifications to the Funding Formula
The state's basic funding formula applies to nearly all districts. However, the act makes modifications
to the formula to account for unusual situations or to achieve policy objectives. These modifications
may cause a district's total funding to be computed differently than the formula described in the
preceding pages. In addition, the act contains modifications that may alter the share of a district's
funding that comes from state or local sources. These modifications include the following.
18 School Finance in Colorado
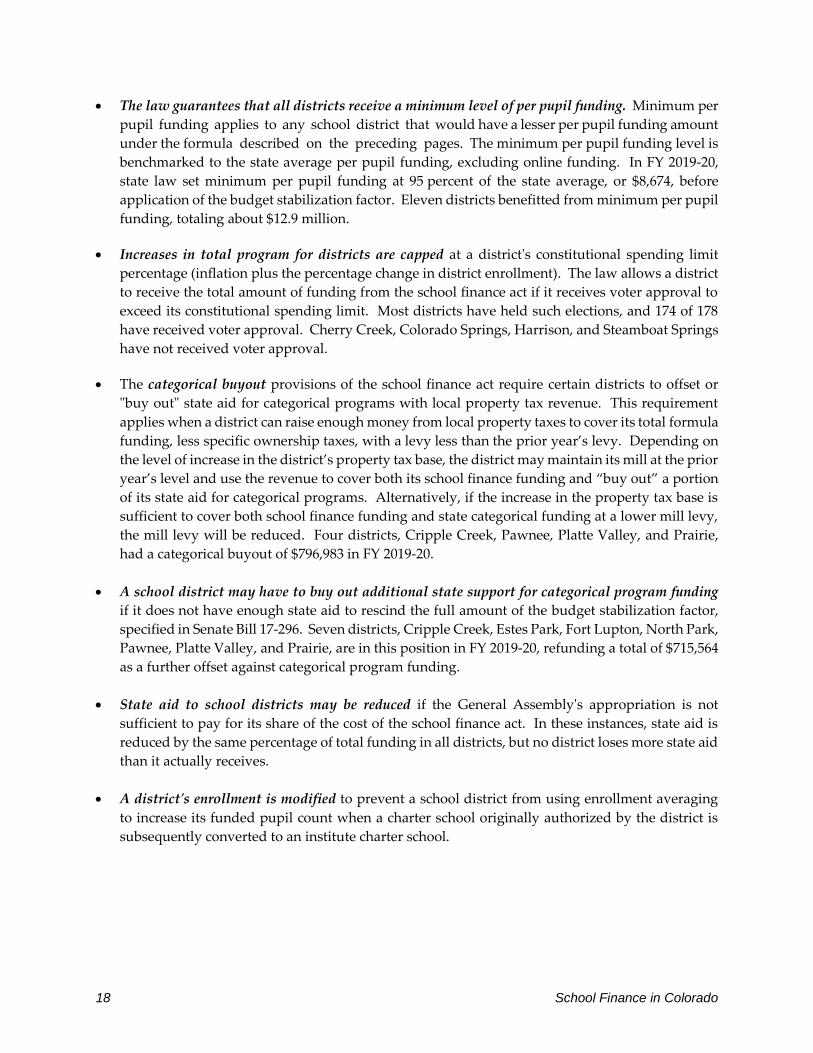
The law guarantees that all districts receive a minimum level of per pupil funding. Minimum per
pupil funding applies to any school district that would have a lesser per pupil funding amount
under the formula described on the preceding pages. The minimum per pupil funding level is
benchmarked to the state average per pupil funding, excluding online funding. In FY 2019-20,
state law set minimum per pupil funding at 95 percent of the state average, or $8,674, before
application of the budget stabilization factor. Eleven districts benefitted from minimum per pupil
funding, totaling about $12.9 million.
Increases in total program for districts are capped at a district's constitutional spending limit
percentage (inflation plus the percentage change in district enrollment). The law allows a district
to receive the total amount of funding from the school finance act if it receives voter approval to
exceed its constitutional spending limit. Most districts have held such elections, and 174 of 178
have received voter approval. Cherry Creek, Colorado Springs, Harrison, and Steamboat Springs
have not received voter approval.
The categorical buyout provisions of the school finance act require certain districts to offset or
"buy out" state aid for categorical programs with local property tax revenue. This requirement
applies when a district can raise enough money from local property taxes to cover its total formula
funding, less specific ownership taxes, with a levy less than the prior year’s levy. Depending on
the level of increase in the district’s property tax base, the district may maintain its mill at the prior
year’s level and use the revenue to cover both its school finance funding and “buy out” a portion
of its state aid for categorical programs. Alternatively, if the increase in the property tax base is
sufficient to cover both school finance funding and state categorical funding at a lower mill levy,
the mill levy will be reduced. Four districts, Cripple Creek, Pawnee, Platte Valley, and Prairie,
had a categorical buyout of $796,983 in FY 2019-20.
A school district may have to buy out additional state support for categorical program funding
if it does not have enough state aid to rescind the full amount of the budget stabilization factor,
specified in Senate Bill 17-296. Seven districts, Cripple Creek, Estes Park, Fort Lupton, North Park,
Pawnee, Platte Valley, and Prairie, are in this position in FY 2019-20, refunding a total of $715,564
as a further offset against categorical program funding.
State aid to school districts may be reduced if the General Assembly's appropriation is not
sufficient to pay for its share of the cost of the school finance act. In these instances, state aid is
reduced by the same percentage of total funding in all districts, but no district loses more state aid
than it actually receives.
A district's enrollment is modified to prevent a school district from using enrollment averaging
to increase its funded pupil count when a charter school originally authorized by the district is
subsequently converted to an institute charter school.

School Finance in Colorado 19
Earmarked Revenue
School districts are no longer required to earmark revenue for instructional supplies, materials, capital
outlay, capital reserve, and risk management. However, districts are still required to allocate a
portion of the at-risk moneys they receive for specific purposes. Seventy-five percent of at-risk
moneys must be allocated for instructional programs or staff development efforts that relate directly
to at-risk pupils. All other money distributed to school districts under the school finance act can be
spent at the discretion of districts.
Unequalized Local Revenue
Many school district revenues are equalized, meaning that the state provides funding to equalize
property wealth. However, the school finance act also allows local school districts some discretion to
raise additional local revenue, for which the state provides no equalization. A description of these
unequalized local revenue sources follows.
School Districts May Raise Additional Property Taxes for Operating Purposes
With voter approval, the act allows districts to raise and spend property taxes over and above those
that support the school finance act. These additional property taxes are called mill levy overrides.
The act limits override revenue to 25 percent (30 percent for small rural districts) of a district's total
funding, prior to application of the budget stabilization factor, or $200,000, whichever is greater, plus
the FY 2001-02 supplemental cost-of-living adjustments. (The FY 2001-02 supplemental cost-of-living
adjustment is a flat dollar amount in 104 districts that resulted from a calculation required by law
based on the results of the 1999 cost-of-living study.)
The school finance act counts other revenue sources against a district's override limit. These other
sources of revenue may limit a district's ability to request voter approval for a property tax increase
equal to the full amount of the limit. For example, in FY 2019-20, the override for 27 districts includes
approximately $4.7 million in property taxes relating to hold harmless provisions that used to be in
the law. This funding was designed to hold districts harmless from any decrease in per pupil funding
resulting from the passage of the 1994 act.
In FY 2019-20, 125 school districts authorized $1.4 billion in override property taxes. Since some
districts are phasing in overrides, the amount of taxes collected may be somewhat less than the
amount authorized by voters.
For FY 2019-20, Figure 11 shows per pupil mill levy override funding across districts. In FY 2019-20,
125 districts received mill levy override revenue, and 53 districts did not. Districts without overrides
are concentrated on the Eastern Plains and the southern end of the San Luis Valley. Pueblo is the only
Front Range metropolitan district without an override. Most of the other metropolitan districts have
overrides, but the funding per pupil is relatively low because enrollment is comparatively high. The
highest override per pupil funding levels occur in resort communities and a handful of districts on
the Eastern Plains with low enrollment.

20 School Finance in Colorado
Figure 11 Mill Levy Override Funding Per Pupil, FY 2019-20
Source: Legislative Council Staff. Note: Numbers in parentheses indicate the number of school districts in each tier.
House Bill 17-1375 required that all school districts with mill levy overrides implement a plan to
distribute mill levy override revenue to charter and innovation schools, or distribute to those schools
95% of mill levy override per pupil revenue, beginning in FY 2019-20. The bill also created the Mill
Levy Equalization Fund to provide an annual appropriation for state Charter School Institute schools
that are in school districts that have passed mill levy overrides. Any moneys in the fund must be
distributed on a per pupil basis. In FY 2019-20, $7.0 million was distributed to charter schools.
Unequalized District Property Taxes Also Pay for Debt
Independent of the school finance act, state law permits school districts to request voter approval to
incur debt by issuing bonds. This is known as bonded debt. Districts repay the debt with a dedicated
mill levy. Bonded debt is generally used by school districts for major capital construction projects.
Revenue collected from a bonded debt mill levy must be credited to the district's bond redemption
fund and used to repay the bondholders. In FY 2019-20, 131 school districts collected about
$355.5 million from bonded debt mill levies.
State law imposes a limit on the amount of bonded debt a school district may incur. Districts are
prohibited from issuing bonded debt in excess of 20 percent of the district's assessed valuation or
6 percent of market value, whichever is greater. For districts that meet specified enrollment growth
criteria, the limit is the greater of 25 percent of assessed value or 6 percent of market value.
School Finance in Colorado 21
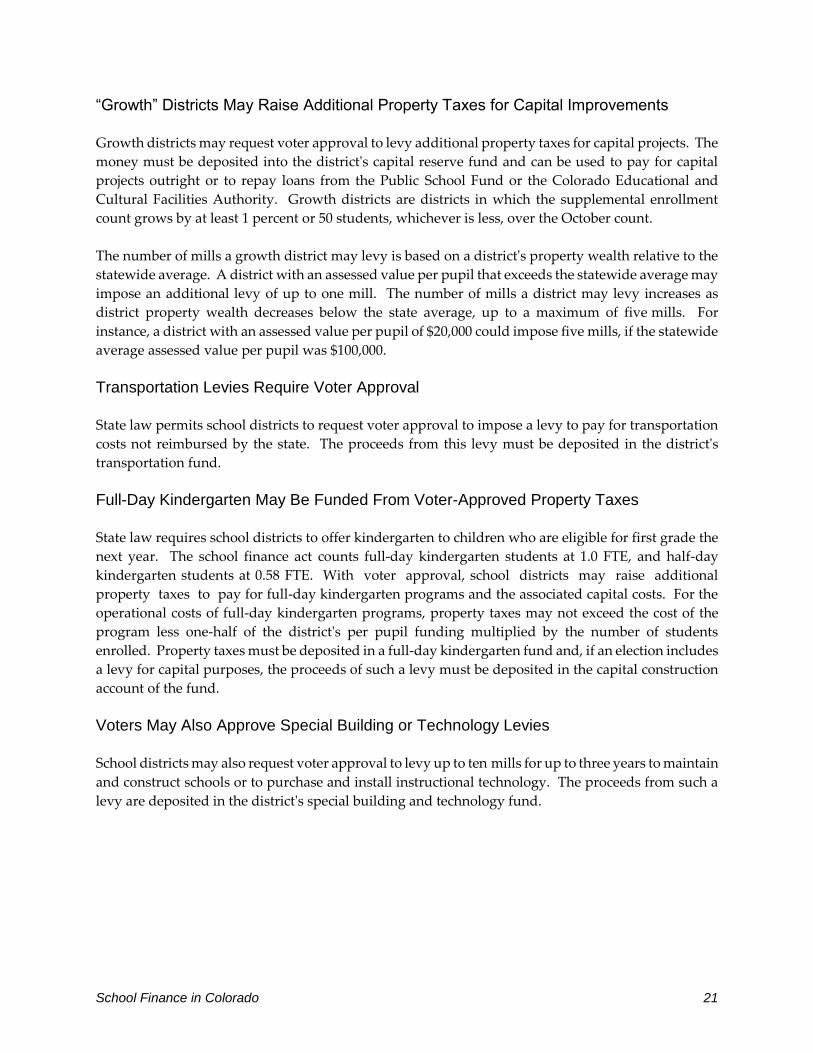
“Growth” Districts May Raise Additional Property Taxes for Capital Improvements
Growth districts may request voter approval to levy additional property taxes for capital projects. The
money must be deposited into the district's capital reserve fund and can be used to pay for capital
projects outright or to repay loans from the Public School Fund or the Colorado Educational and
Cultural Facilities Authority. Growth districts are districts in which the supplemental enrollment
count grows by at least 1 percent or 50 students, whichever is less, over the October count.
The number of mills a growth district may levy is based on a district's property wealth relative to the
statewide average. A district with an assessed value per pupil that exceeds the statewide average may
impose an additional levy of up to one mill. The number of mills a district may levy increases as
district property wealth decreases below the state average, up to a maximum of five mills. For
instance, a district with an assessed value per pupil of $20,000 could impose five mills, if the statewide
average assessed value per pupil was $100,000.
Transportation Levies Require Voter Approval
State law permits school districts to request voter approval to impose a levy to pay for transportation
costs not reimbursed by the state. The proceeds from this levy must be deposited in the district's
transportation fund.
Full-Day Kindergarten May Be Funded From Voter-Approved Property Taxes
State law requires school districts to offer kindergarten to children who are eligible for first grade the
next year. The school finance act counts full-day kindergarten students at 1.0 FTE, and half-day
kindergarten students at 0.58 FTE. With voter approval, school districts may raise additional
property taxes to pay for full-day kindergarten programs and the associated capital costs. For the
operational costs of full-day kindergarten programs, property taxes may not exceed the cost of the
program less one-half of the district's per pupil funding multiplied by the number of students
enrolled. Property taxes must be deposited in a full-day kindergarten fund and, if an election includes
a levy for capital purposes, the proceeds of such a levy must be deposited in the capital construction
account of the fund.
Voters May Also Approve Special Building or Technology Levies
School districts may also request voter approval to levy up to ten mills for up to three years to maintain
and construct schools or to purchase and install instructional technology. The proceeds from such a
levy are deposited in the district's special building and technology fund.
22 School Finance in Colorado
Cash Flow Loan Program
School districts may participate in an interest-free cash flow loan program sponsored by the state.
Under this program, the state borrows money on behalf of school districts and pays the interest costs
of the loan. In some circumstances, the state may lend money directly to school districts, charging the
district interest. Participating school districts are required to pledge their property taxes toward the
loan's repayment. The loan program was created to help districts deal with the fact that property tax
collections occur late in the budget year. A school district applies to the State Treasurer for a loan. A
district is eligible for a loan from the state in any month in which the district can demonstrate that a
cash deficit will exist in its general fund and that it has the capacity to repay the loan by June 25 of the
state fiscal year in which the loan was made. A loan may not be made to provide assistance for matters
eligible for payment from the contingency reserve or to cover a foreseeable level of uncollectible
property taxes, nor may a loan be used by a district for arbitrage.
State Contingency Reserve
State law requires the General Assembly to annually determine the amount to appropriate to a
contingency reserve fund to provide supplemental assistance to school districts. Money in the fund
can be allocated by the State Board of Education to school districts for certain types of financial
emergencies. Money may also be allocated in the following situations: if a district's abatement levy
is insufficient to refund property taxes; if children placed in the district by a court create an unusual
financial burden; to offset the impact of a decline in enrollment resulting from a detachment and
annexation; or to offset the cost of pupils moving to a district after the count date. This last option is
only available for districts with fewer than 2,000 pupils and only for the cost of the additional pupils.
In cases of extreme emergency, the state board may consider factors that are not specifically delineated
in law and may provide financial aid from the contingency reserve to districts that could not maintain
their schools without such additional assistance. In determining which districts receive payments
from the contingency reserve and the amount of the payment, the state board must consider the
amount of assistance requested as a percentage of each district's total funding.
In some situations, such as when disputed property taxes are eventually paid to a district,
districts reimburse the state, thereby providing a source of revenue for the fund. For FY 2019-20, the
General Assembly appropriated $1.0 million to the fund.
Capital Construction
The state offers several programs to assist with school district capital construction projects.
Depending on the program, the state provides assistance as a grant or a matching grant.

School Finance in Colorado 23
The Public School Capital Construction Assistance Fund Provides Matching Grants to School Districts
Through the Building Excellent Schools Today (BEST) Act, the Public School Capital Construction
Assistance Fund provides matching grant money to school districts, charter schools, and boards of
cooperative services to ensure that the condition and capacity of public school facilities are sufficient
to provide a safe and uncrowded environment that is conducive to learning. The State Treasurer is
authorized to enter into lease-purchase agreements and to sell certificates of participation to raise
money to finance public school capital construction projects.
Under the law, a board within the Colorado Department of Education is responsible for establishing
construction guidelines. These guidelines, which are used to assess and prioritize capital construction
needs and evaluate requests for assistance, are required to identify construction, renovation, and
equipment standards that meet educational and safety needs at a reasonable cost. In addition, the
board is responsible for the conduct of a financial assistance priority assessment. For purposes of
awarding assistance, the law prioritizes projects as follows:
projects that address safety hazards and health or security concerns at existing public school
facilities;
projects that relieve overcrowding;
projects that will provide career and technical education capital construction; and
projects that are designed to incorporate technology into the educational environment.
Recipients of assistance from the BEST program are expected to pay a portion of the cost of the project
unless a waiver is granted. Among the criteria taken into account in determining the local portion of
a project's cost are the property and income wealth of a district and current efforts of districts and
schools to finance capital improvements.
The Public School Capital Construction Assistance Fund is capitalized from a variety of revenue
sources: state public school lands income; the proceeds from the sale of certificates of
participation; some lottery money; and local matching money. In addition, starting in FY 2019-20, the
fund will receive all revenue from the 15 percent excise tax on retail marijuana. The fund is used to
provide financial assistance for projects, pay the administrative costs of the program, and to make
lease payments. The amount of the annual lease payments is limited by law to $105 million in
FY 2019-20.
Charter Schools Receive Money for Capital
The General Assembly appropriated $28.0 million from the State Education Fund and the Public
School Capital Construction Assistance Fund for charter school capital construction in FY 2019-20. A
charter school qualifies for money if it has costs associated with constructing, demolishing,
remodeling, financing, purchasing or leasing land, buildings, or facilities. Each charter school receives
its proportionate share of the appropriation based on the number of pupils enrolled in the charter
school.

This page intentionally left blank.

School Finance in Colorado 25
FUNDING FORMULAS
Type of Funding Formula Used
School District Funding (Total Funding)
(Pupils × Preliminary Per Pupil Funding) + At-Risk Funding + Online and ASCENT Funding
Funded Pupil Count
0.5 x Preschool Count + Online/ASCENT Counts + .08 x Half Day Kindergarten Count + the Greater of: The Current Year’s K-12 Count or a Two-year, Three-year, Four-year, or Five-year average of the October Counts
Preliminary Per Pupil Funding [(Statewide Base × Personnel Costs Factor × Cost of Living Factor) + (Statewide Base × Nonpersonnel Costs Factor)] × Size Factor
At-Risk Funding At-Risk Pupils × 12% × Preliminary Per Pupil Funding + At-Risk Funding Premium
Online + ASCENT Funding (Online + ASCENT Pupil Count) × Per Pupil Funding for Online and ASCENT Students
Local Share Current Year Property Taxes + Prior Year Specific Ownership Taxes
State Aid Total Funding – Local Share

This page intentionally left blank.
School Finance in Colorado 27
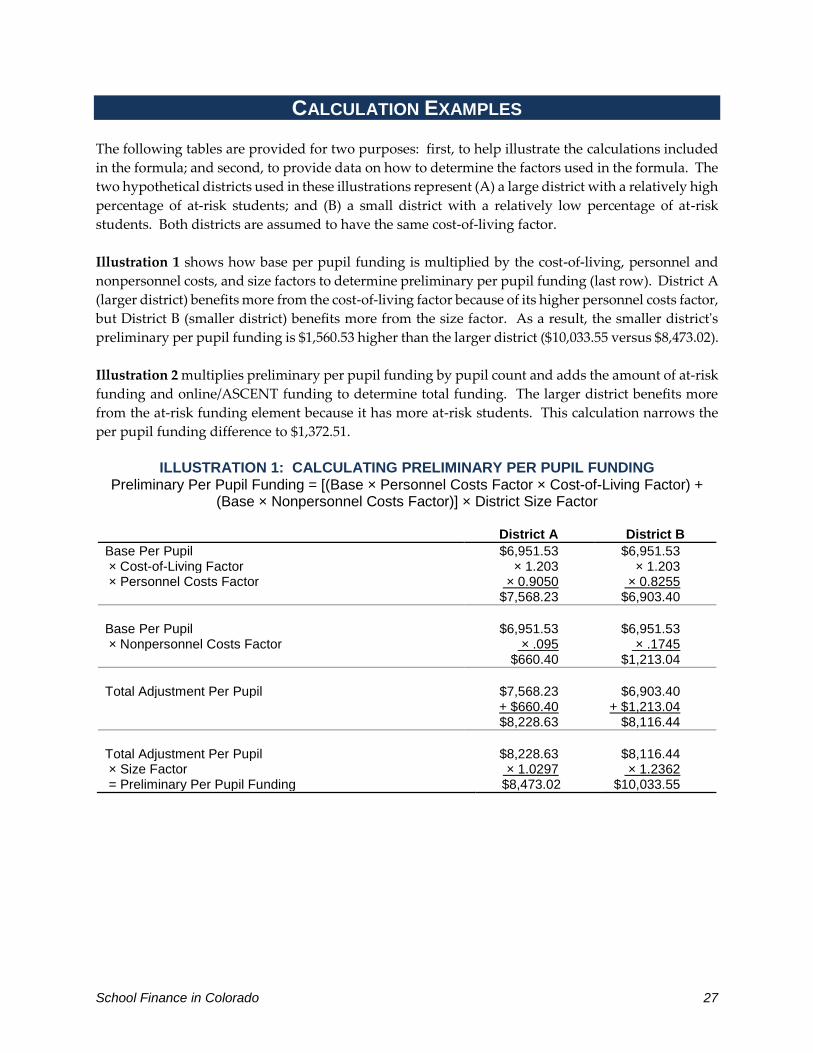
CALCULATION EXAMPLES
The following tables are provided for two purposes: first, to help illustrate the calculations included
in the formula; and second, to provide data on how to determine the factors used in the formula. The
two hypothetical districts used in these illustrations represent (A) a large district with a relatively high
percentage of at-risk students; and (B) a small district with a relatively low percentage of at-risk
students. Both districts are assumed to have the same cost-of-living factor.
Illustration 1 shows how base per pupil funding is multiplied by the cost-of-living, personnel and
nonpersonnel costs, and size factors to determine preliminary per pupil funding (last row). District A
(larger district) benefits more from the cost-of-living factor because of its higher personnel costs factor,
but District B (smaller district) benefits more from the size factor. As a result, the smaller district's
preliminary per pupil funding is $1,560.53 higher than the larger district ($10,033.55 versus $8,473.02).
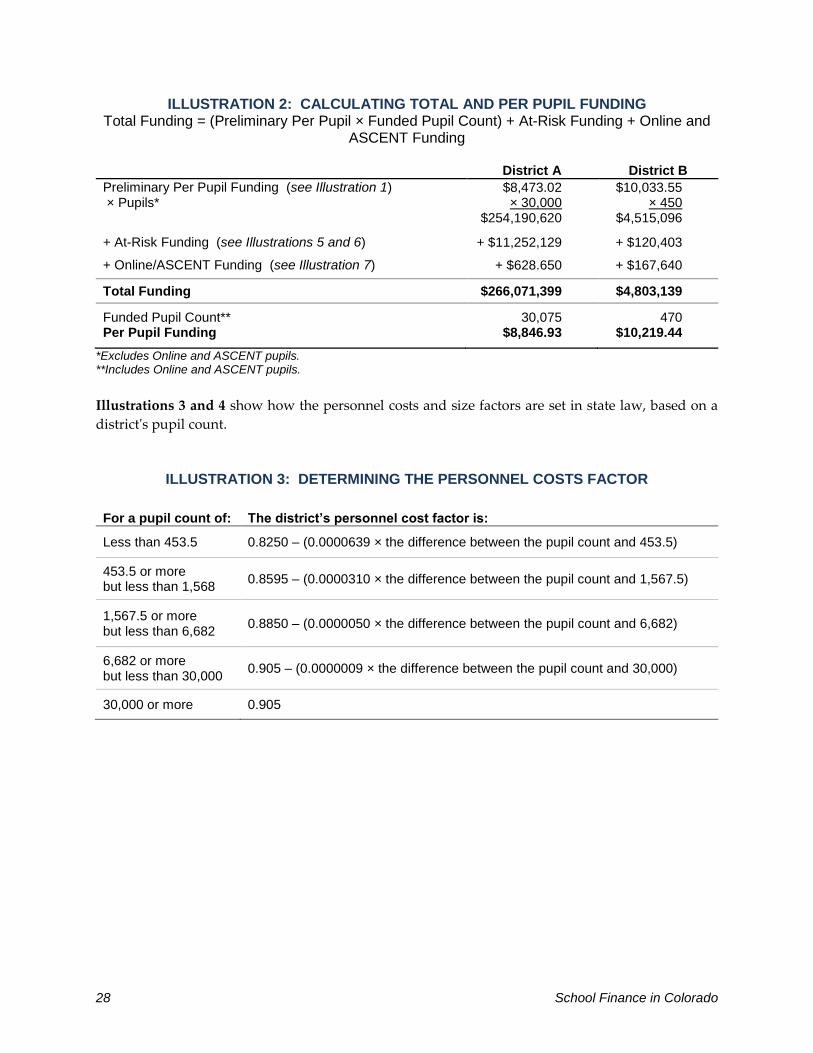
Illustration 2 multiplies preliminary per pupil funding by pupil count and adds the amount of at-risk
funding and online/ASCENT funding to determine total funding. The larger district benefits more
from the at-risk funding element because it has more at-risk students. This calculation narrows the
per pupil funding difference to $1,372.51.
ILLUSTRATION 1: CALCULATING PRELIMINARY PER PUPIL FUNDING
Preliminary Per Pupil Funding = [(Base × Personnel Costs Factor × Cost-of-Living Factor) + (Base × Nonpersonnel Costs Factor)] × District Size Factor
District A District B
Base Per Pupil $6,951.53 $6,951.53 × Cost-of-Living Factor × 1.203 × 1.203 × Personnel Costs Factor × 0.9050 × 0.8255 $7,568.23 $6,903.40
Base Per Pupil $6,951.53 $6,951.53 × Nonpersonnel Costs Factor × .095 × .1745 $660.40 $1,213.04
Total Adjustment Per Pupil $7,568.23 $6,903.40 + $660.40 + $1,213.04 $8,228.63 $8,116.44
Total Adjustment Per Pupil $8,228.63 $8,116.44 × Size Factor × 1.0297 × 1.2362 = Preliminary Per Pupil Funding $8,473.02 $10,033.55
28 School Finance in Colorado
ILLUSTRATION 2: CALCULATING TOTAL AND PER PUPIL FUNDING Total Funding = (Preliminary Per Pupil × Funded Pupil Count) + At-Risk Funding + Online and
ASCENT Funding
District A District B
Preliminary Per Pupil Funding (see Illustration 1) × Pupils*
$8,473.02 × 30,000
$254,190,620
$10,033.55 × 450
$4,515,096
+ At-Risk Funding (see Illustrations 5 and 6) + $11,252,129 + $120,403
+ Online/ASCENT Funding (see Illustration 7) + $628.650 + $167,640
Total Funding $266,071,399 $4,803,139
Funded Pupil Count** 30,075 470 Per Pupil Funding $8,846.93 $10,219.44
*Excludes Online and ASCENT pupils. **Includes Online and ASCENT pupils.
Illustrations 3 and 4 show how the personnel costs and size factors are set in state law, based on a
district's pupil count.
ILLUSTRATION 3: DETERMINING THE PERSONNEL COSTS FACTOR
For a pupil count of: The district’s personnel cost factor is:
Less than 453.5 0.8250 – (0.0000639 × the difference between the pupil count and 453.5)
453.5 or more but less than 1,568
0.8595 – (0.0000310 × the difference between the pupil count and 1,567.5)
1,567.5 or more but less than 6,682
0.8850 – (0.0000050 × the difference between the pupil count and 6,682)
6,682 or more but less than 30,000
0.905 – (0.0000009 × the difference between the pupil count and 30,000)
30,000 or more 0.905

School Finance in Colorado 29
ILLUSTRATION 4: DETERMINING THE SIZE FACTOR
For a pupil count of: The district’s size factor is:
Less than 276 1.5457 + (0.00376159 × the difference between the district’s pupil count and 276)
276 or more but less than 459
1.2385 + (0.00167869 × the difference between the district’s pupil count and 459)
459 or more but less than 1,027
1.1215 + (0.00020599 × the difference between the district’s pupil count and 1,027)
1,027 or more but less than 2,293
1.0533 + (0.00005387 × the difference between the district’ pupil count and 2,293)
2,293 or more but less than 3,500
1.0368 + (0.00001367 × the difference between the district’s pupil count and 3,500)
3,500 or more but less than 5,000
1.0297 + (0.00000473 × the difference between the district’s pupil count and 5,000)
5,000 or more 1.0297
Note: The size factor for districts with fewer than 500 pupils is calculated using the district’s enrollment minus 65 percent of the district’s pupils in charter schools.
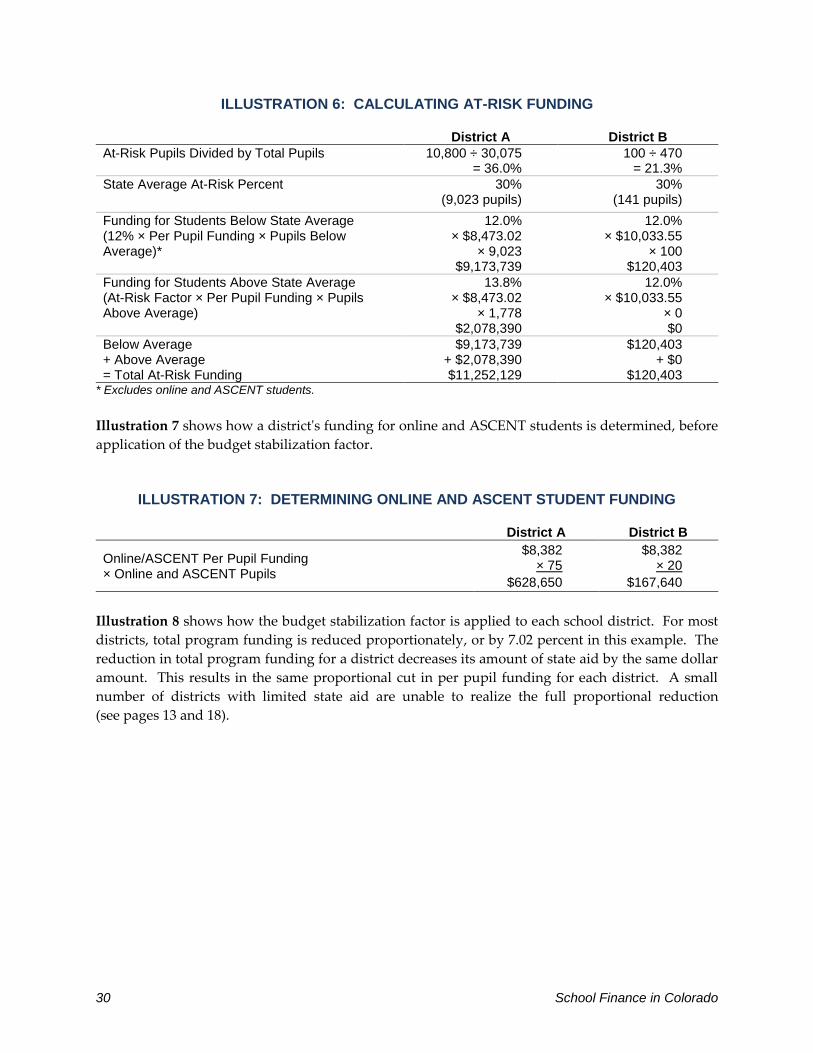
Illustration 5 shows how the at-risk factor is determined, with District A getting additional funding
for at-risk students that exceed the statewide average. In this example, District A's percentage of
at-risk students exceeds the statewide average by 5.9 percentage points. As a result, District A's at-risk
funding for students above the statewide average is equal to 13.8 percent of its preliminary per pupil
funding (last row).
Illustration 6 shows how the at-risk factor is applied to these two school districts, with District A
receiving additional funding for the number of at-risk students exceeding the statewide average
(last row).
ILLUSTRATION 5: DETERMINING THE AT-RISK FACTOR
At-Risk Factor = 12.0% of preliminary per pupil funding for pupils below the statewide average; 12.0% plus 0.3 (0.36 for districts with pupil counts greater than 50,000) for each percentage
point over the statewide average
District A District B
At-Risk Pupils Divided by Total Pupils 10,800 ÷ 30,075 100 ÷ 470
= 35.9% = 21.3%
State Average At-Risk Percent 30.0% 30.0%
Does District Percentage Exceed Statewide Average
Yes: No: 35.9% - 30.0% = 21.3% - 30.0% = (5.9% pts. Over) (8.7% pts. under)
District Receives 0.3 Percentage Points for Each Percentage Point Over Statewide Average
5.9% × 0.3 0.0% × 0.3 = 1.8% = 0.0%
At-Risk Factor for Pupils > State Average 12.0% + 1.8% 12.0% + 0.0%
= 13.80% = 12.0%
30 School Finance in Colorado
ILLUSTRATION 6: CALCULATING AT-RISK FUNDING
District A District B
At-Risk Pupils Divided by Total Pupils 10,800 ÷ 30,075 100 ÷ 470 = 36.0% = 21.3%
State Average At-Risk Percent 30% 30% (9,023 pupils) (141 pupils)
Funding for Students Below State Average (12% × Per Pupil Funding × Pupils Below Average)*
12.0% 12.0% × $8,473.02 × $10,033.55
× 9,023 × 100 $9,173,739 $120,403
Funding for Students Above State Average (At-Risk Factor × Per Pupil Funding × Pupils Above Average)
13.8% 12.0% × $8,473.02 × $10,033.55
× 1,778 × 0 $2,078,390 $0
Below Average + Above Average = Total At-Risk Funding
$9,173,739 $120,403 + $2,078,390 + $0 $11,252,129 $120,403
* Excludes online and ASCENT students.
Illustration 7 shows how a district's funding for online and ASCENT students is determined, before
application of the budget stabilization factor.
ILLUSTRATION 7: DETERMINING ONLINE AND ASCENT STUDENT FUNDING
District A District B
Online/ASCENT Per Pupil Funding × Online and ASCENT Pupils
$8,382 $8,382 × 75 × 20
$628,650 $167,640
Illustration 8 shows how the budget stabilization factor is applied to each school district. For most
districts, total program funding is reduced proportionately, or by 7.02 percent in this example. The
reduction in total program funding for a district decreases its amount of state aid by the same dollar
amount. This results in the same proportional cut in per pupil funding for each district. A small
number of districts with limited state aid are unable to realize the full proportional reduction
(see pages 13 and 18).

School Finance in Colorado 31
ILLUSTRATION 8: DETERMINING TOTAL PROGRAM WITH BUDGET STABILIZATION FACTOR*
District A District B
Before Budget Stabilization Factor
Total Program Funding from Illustration 2 $266,071,399 $4,803,139
Funded Pupil Count (includes Online and ASCENT pupils) 30,075 470
Final Per Pupil Funding $8,847 $10,219
After Budget Stabilization Factor
Assuming a 7.02% factor applied to a district’s total program ($18,678,212) ($337,180)
Total Program with Budget Stabilization Factor % Change
$247,393,187 (7.02%)
$4,465,958 (7.02%)
Total Per Pupil Funding with Budget Stabilization Factor % Change
$8,225.87 (7.02%)
$9,085.07 (7.02%)
*Assumes enough state aid to enact full 7.02 percent rescission.
32 School Finance in Colorado
School Finance in Colorado 33
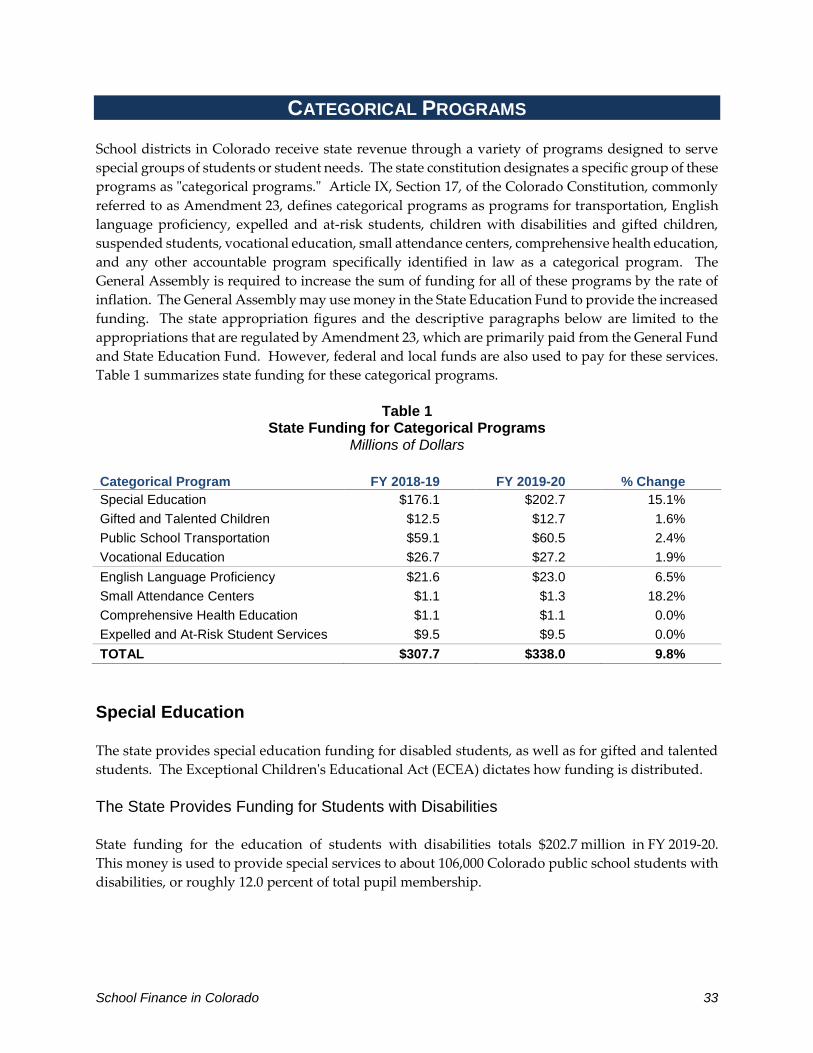
CATEGORICAL PROGRAMS
School districts in Colorado receive state revenue through a variety of programs designed to serve
special groups of students or student needs. The state constitution designates a specific group of these
programs as "categorical programs." Article IX, Section 17, of the Colorado Constitution, commonly
referred to as Amendment 23, defines categorical programs as programs for transportation, English
language proficiency, expelled and at-risk students, children with disabilities and gifted children,
suspended students, vocational education, small attendance centers, comprehensive health education,
and any other accountable program specifically identified in law as a categorical program. The
General Assembly is required to increase the sum of funding for all of these programs by the rate of
inflation. The General Assembly may use money in the State Education Fund to provide the increased
funding. The state appropriation figures and the descriptive paragraphs below are limited to the
appropriations that are regulated by Amendment 23, which are primarily paid from the General Fund
and State Education Fund. However, federal and local funds are also used to pay for these services.
Table 1 summarizes state funding for these categorical programs.
Table 1
State Funding for Categorical Programs Millions of Dollars
Categorical Program FY 2018-19 FY 2019-20 % Change
Special Education $176.1 $202.7 15.1%
Gifted and Talented Children $12.5 $12.7 1.6%
Public School Transportation $59.1 $60.5 2.4%
Vocational Education $26.7 $27.2 1.9%
English Language Proficiency $21.6 $23.0 6.5%
Small Attendance Centers $1.1 $1.3 18.2%
Comprehensive Health Education $1.1 $1.1 0.0%
Expelled and At-Risk Student Services $9.5 $9.5 0.0%
TOTAL $307.7 $338.0 9.8%
Special Education
The state provides special education funding for disabled students, as well as for gifted and talented
students. The Exceptional Children's Educational Act (ECEA) dictates how funding is distributed.
The State Provides Funding for Students with Disabilities
State funding for the education of students with disabilities totals $202.7 million in FY 2019-20.
This money is used to provide special services to about 106,000 Colorado public school students with
disabilities, or roughly 12.0 percent of total pupil membership.
34 School Finance in Colorado
Funding to provide educational services to students with disabilities is distributed to administrative
units. An administrative unit could be a school district, a board of cooperative services, or a
combination of school districts. Under the law, an administrative unit receives $1,250 for each student
with a disability. Administrative units also receive an additional distribution based on each unit's
proportion of students with specific disabilities compared to the number of students statewide with
these disabilities. These specific disabilities include vision or hearing disabilities, autism, a significant
identifiable emotional disability, a traumatic brain injury, multiple disabilities, or significant limited
intellectual capacity. These distribution mechanisms account for about $195.4 million of the special
education appropriation.
A relatively small portion of the appropriation ($7.3 million) is set aside for three specific purposes.
Administrative units that pay tuition to facilities to provide special education services to students
whose parents cannot be located or are incarcerated or whose parents' rights have been relinquished
or terminated receive $500,000 of the appropriation for services for children with disabilities. Four
million dollars is distributed in grants to administrative units for "high cost" students. Administrative
units also receive funding — about $2.8 million in FY 2019-20 — to identify children who may benefit
from early intervention services.
The State Provides Funding for Programs to Serve Gifted and Talented Students
For FY 2019-20, the General Assembly appropriated about $12.7 million for district gifted and talented
programs. These programs serve about 67,000 students, representing about 8 percent of the student
population. This money is used to provide staff, activities, and educational materials and equipment
to serve gifted students.
Public School Transportation
School districts are reimbursed for some of the cost of transporting pupils between their home and
school. The reimbursement formula is two-pronged; it takes into account mileage and costs. The
formula provides 37.87 cents for each mile traveled, plus 33.87 percent of the difference between
district transportation expenditures and the mileage allowance. Transportation expenditures that are
reimbursable include items such as motor fuel and oil, vehicle maintenance costs, equipment,
facilities, driver employment costs, and insurance. Districts are not eligible for reimbursement for the
cost of purchasing buses or for field trips.
The law sets a minimum funding level equal to the amount a district was entitled to receive in the
prior year. However, the law also applies a cap of 90 percent of allowable district transportation
expenditures. For FY 2019-20, the General Assembly appropriated just over $60.5 million for the
transportation program. Each district's funding is prorated if the appropriation is less than the
required amount.

School Finance in Colorado 35
Vocational Education
Unlike the school finance act and the other categorical programs discussed in this booklet, which are
administered by the Colorado Department of Education, the vocational education program is
administered by the State Board for Community Colleges and Occupational Education. Vocational
education courses are designed to provide students with entry-level occupational skills and
knowledge required by business and industry. Any school district conducting approved vocational
education courses is entitled to funding from moneys appropriated by the General Assembly.
Vocational education aid is disbursed to districts according to the full-time equivalent (FTE) cost of a
program. The state provides funding for instructional personnel, contracted educational services,
books and supplies, and equipment. Each district is required to pay its program costs per FTE at
70 percent of its per pupil revenue. For costs exceeding 70 percent, the state pays 80 percent of the
first $1,250 per FTE and 50 percent of any additional costs above the $1,250 level. If the state
appropriation is less than the amount required by the funding formula, district allocations are
prorated. The FY 2019-20 appropriation for this program is $27.2 million.
English Language Proficiency
The English Language Proficiency Act (ELPA) provides financial assistance to districts with students
whose dominant language is not English. Districts are required to identify, assess, and provide
programs for students in the following classifications:
a) students who do not comprehend or speak any English;
b) students who comprehend or speak some English but whose predominant language is not
English; and
c) students who comprehend and speak English and at least one other language, whose dominant
language is difficult to determine, and who score at or below an acceptable level on a
state-developed test.
ELPA funding is disbursed to districts for up to five years for each participating student. The state
appropriation for this program in FY 2019-20 is $23.0 million. Of this total, a portion is distributed to
districts with students in classifications (a) and (b). The remainder is distributed to districts with
students in category (c). Money is allocated to districts on a per pupil basis: the respective portions of
the appropriation are divided by the total number of students in categories (a) and (b) and the total
number of students in category (c); each district receives the per pupil funding amount for qualifying
students.

36 School Finance in Colorado
Small Attendance Centers
The state provides additional funding for school districts that operate small attendance centers, which
are defined as schools with fewer than 200 pupils that are at least 20 miles from a similar school in the
same district. To receive funding for such a school, a district must have received funding prior to the
2008-09 budget year.
Eligible districts receive 35 percent of the difference between the district's per pupil funding and the
per pupil funding the school would receive if it were a separate school district. This amount is further
refined to take into account the size of the school relative to the cut-off point of 200 pupils for small
attendance center funding. Smaller schools receive a higher percentage of the calculated per pupil
funding, while larger schools receive a smaller percentage. The General Assembly appropriated
$1.3 million for this program in FY 2019-20. Twelve schools in ten districts qualify for funding this
year.
Expelled and At-Risk Student Services Grant Program
For FY 2019-20, the General Assembly appropriated about $9.5 million to the Colorado Department
of Education to distribute as grants for programs to serve expelled and truant students and students
at risk of expulsion or suspension. The department may distribute money to school districts, charter
schools, public alternative schools, and non-parochial private schools whose programs have been
approved by the State Board, boards of cooperative services, the state Department of Military and
Veterans Affairs, and pilot schools under contract with the State Board to serve expelled and at-risk
students.
In awarding grants, the State Board must consider, among other issues, the quality and
cost-effectiveness of the services to be provided, the demonstrated effectiveness of services funded by
previous grants to an applicant, and the number of students receiving services. Forty-five percent of
the appropriation must be awarded to applicants who provide services to students from more than
one school district.
Comprehensive Health Education
School districts and boards of cooperative services may receive grants to provide a local
comprehensive health education program, which must include a law-related education program to
reduce the incidence of gang involvement and substance abuse, and a local student wellness program.
State law requires that student wellness programs be coordinated with health education to receive
funding. One revenue source for the grant program is money appropriated, but not spent, for school
finance; the program receives 50 percent of any unspent money. For FY 2019-20, the General
Assembly appropriated $1.1 million for this program.

School Finance in Colorado 37
COLORADO PRESCHOOL PROGRAM
The Colorado Preschool Program, which has been in operation since 1989, serves children aged three
to five years old who lack overall learning readiness, who are in need of language development, or
who participate in state programs for neglected or dependent children. A school district may provide
the program itself, or contract with a Head Start or local child care agency to provide all or a portion
of the program. School districts must meet specific state requirements regarding class size, parental
involvement, and teacher training and planning to participate in the program.
The Colorado Preschool Program is funded through the school finance act. Children participating in
the program are counted as half-day pupils. For FY 2019-20, state law caps the number of children
who are funded in the program at 29,360. Funding provided for the program may be used to fund a
full day of preschool. In FY 2019-20, approximately $124.2 million may be attributed to school finance
funding, prior to application of the budget stabilization factor.

This page intentionally left blank.

School Finance in Colorado 39
GLOSSARY
Accelerating Students through Concurrent Enrollment (ASCENT): A program that allows eligible
students to complete a fifth year of high school while enrolled concurrently in higher education
courses. Students who have completed at least 12 credit hours of postsecondary coursework prior
to completion of their 12th grade year may be eligible for the ASCENT Program. They remain
students in their Local Education Provider (LEP) for one year following their 12th grade year, and
the LEP receives ASCENT specific per pupil funding that it uses to pay their college tuition at the
resident community college rate. Students receive their high school diplomas at the end of their
ASCENT year.
Amendment 23: A constitutional amendment adopted in 2000 that sets minimum levels of increase
in the statewide base per pupil funding amount and for total categorical program funding. It also
creates the State Education Fund and earmarks a portion of income tax revenue for the fund.
Amendment 23 is codified as Article IX, Section 17, Colorado Constitution.
Assessed Value: The taxable value of property as determined by a tax assessor or government agency.
Property taxes are paid on the basis of a property's assessed valuation, which represents only a
fraction of a property's market value.
At-Risk Pupils: Students who are eligible for the federal free lunch program because they come from
families with incomes below a certain level or who lack proficiency in English. The act provides
additional funding based on the number of at-risk pupils enrolled in each district.
At-Risk Factor: The percentage increase in a district's per pupil funding for the presence of
at-risk pupils. Each district starts with an at-risk factor of 12.0 percent. Districts with more than
the statewide average proportion of at-risk pupils receive an at-risk factor of 12.0 percent
plus three-tenths of one percentage point — 0.36 percentage point for a district with a pupil
count greater than 50,000 — for every percentage point that the district's proportion exceeds the
statewide average, up to 30 percent.
Base Funding Amount: See Statewide Base Per Pupil Funding Amount.
Bonded Indebtedness: Obligations of a school district to make payments on a loan, generally for
major capital construction projects. With voter approval, districts can issue bonded debt and
impose a mill levy to repay the debt over time.
Budget Year: Same as a fiscal year, the period beginning on July 1 of each year and ending on the
following June 30.
Capital Outlay: Money spent to acquire fixed assets that can be expected to last for more than one
year. Fixed assets include land, buildings, machinery, and furniture.

40 School Finance in Colorado
Capital Reserve Fund: A fund used by school districts for long-term capital outlay expenditures.
Districts can only use the capital reserve fund to acquire land and buildings, construct new
buildings or additions to buildings, purchase equipment and furnishings, alter or improve
existing buildings when the cost exceeds $2,500, acquire school buses or other equipment with a
per unit cost of at least $1,000, enter into long-term lease agreements, or purchase software licenses
that cost at least $1,000. Starting in FY 2009-10, districts are no longer required to allocate a
specified amount of money per pupil to the capital reserve fund or the risk management fund.
Categorical Programs: Programs that are funded separately from the school finance act and are
identified in the state constitution. Examples include vocational education, special education, and
pupil transportation.
Charter School: A public school operated by a group of parents, teachers and/or community members
as a semi-autonomous school of choice within a school district, operating under a charter between
the members of the charter school community and an authorizer, which is either the local board
of education or the state Charter School Institute.
Constitutional Spending Limit: The maximum allowable change in a school district's spending from
one year to the next. The limit for school districts is equal to the percentage change in a district's
enrollment plus the Denver-Aurora-Lakewood inflation rate in the prior calendar year.
Cost-of-Living Factor: One of the three main factors used in calculating a district's per pupil funding.
The cost-of-living factor reflects the relative differences among the state's 178 districts in the costs
of housing, goods, and services for the regions in which districts are located.
District Per Pupil Funding: The amount that results from combining the statewide base with the
components of the formula. A district's per pupil funding is multiplied by its pupil count to
determine funding, before accounting for online and at-risk students.
Enrollment: The number of pupils enrolled on October 1 within the budget year.
Equalization Aid: State funding provided to equalize the property wealth of districts.
Growth Districts: School districts whose February enrollment count grows by at least 1 percent or
50 students, whichever is less, over the October count. Growth districts can request voter
approval to levy additional property taxes for capital projects.
Local Share: The portion of a district's total program contributed directly by local taxpayers of the
district. A district's local share includes revenue from property taxes and specific ownership taxes.
Mill Levy: A property tax rate based on dollars per thousand of assessed valuation. One mill is the
same as one tenth of one percent (.001). Thus, one mill will generate $1 when levied on $1,000 of
a property's assessed value.

School Finance in Colorado 41
Minimum Per Pupil Funding: A minimum funding level guaranteed to each district. In FY 2019-20,
the law guarantees 95 percent of statewide average per pupil funding, or $8,674 per pupil before
application of the budget stabilization factor. After application of the budget stabilization factor,
minimum per pupil finding is $8,065 in FY 2019-20.
Minimum State Aid District: A district that can generate its entire total program from local property
and specific ownership taxes and, thus, only receives the minimum amount of state aid per pupil.
House Bill 10-1318 eliminated minimum state aid through FY 2014-15, and Senate Bill 15-267
eliminated minimum state aid altogether.
Budget Stabilization Factor: A new factor introduced in House Bill 10-1369 and extended indefinitely
in Senate Bill 11-230, to achieve budget savings for the state. In FY 2019-20, the factor reduced
total funding for school finance by $572 million, or 7.02 percent.
Nonpersonnel Costs Factor: A percentage representing the difference between 100 percent and a
district's personnel costs factor.
Online Students: Students enrolled in an online education program that provides a sequential
program of instruction through the use of technology via the internet in a virtual or remote setting.
Some students participate in programs that serve students from more than one school district
(multi-district programs) and some participate in programs offered by their own district
(single district programs).
Override: Local voter-approved property tax revenue in excess of funding provided through the
school finance act.
Personnel Costs Factor: One of the factors used in calculating a district's per pupil funding. The
personnel costs factor is a percentage that represents the estimated portion of a district's budget
that is attributed to personnel costs. It is formula-driven and differs by district based on
enrollment.
Per Pupil Revenues/PPR: A district's total funding divided by its funded pupil count. It represents
a district's final per pupil funding.
Preliminary Per Pupil Funding: The amount that results from combining the statewide base with the
components of the formula. A district's preliminary per pupil funding is multiplied by its pupil
count to determine funding, before accounting for online, ASCENT, and at-risk students.
Property Tax: A local tax that is calculated by applying a mill levy to assessed value. Revenue from
the property tax represents the primary source of local funding for K-12 public education.
Pupil Count/Funded Pupil Count: The number of pupils for which a school district receives funding
under the school finance act. For funding purposes, pupils are counted on October 1 within the
applicable budget year.
42 School Finance in Colorado
Size Factor: One of the three main factors used in calculating a district's per pupil funding. The size
factor is designed to compensate smaller districts for being unable to realize economies of scale.
It is formula-driven and based on enrollment.
Specific Ownership Tax: A tax paid annually on motor vehicles instead of property taxes. Specific
ownership taxes are part of a district's local contribution to school funding.
Small Attendance Center: A school of fewer than 200 students that is located more than 20 miles
from a similar school in the same district. Small attendance centers are eligible for categorical
program funding.
State Aid: Funding provided by the state under the school finance act. State aid is the difference
between a district's total funding and what is provided from local property and specific ownership
taxes.
Statewide Base Per Pupil Funding Amount: The dollar amount to which the factors are applied in
determining each district's per pupil funding level. Each district receives the same base per pupil
funding amount. For FY 2019-20, the base is $6,951.53.
Total Program Funding: The total funding amount for each district through the school finance act. It
is the sum of the local share and state aid.

School Finance in Colorado 43
APPENDIX A: SCHOOL DISTRICT MAP KEY
73
110
43
90
39
77
17
108
98
7541
139
138
129
79
95
71
67
87
30
111
147
9
42
23
140
99
72
114
74
68 78106
18
37
97
81
29
96
38
145
27
35
8
64
1932
24
115
85
109
5
80
2036
102
82
107
46
176
101
152
66
3494
92
175
120
26
28
144
16
134
48
6
173
158
123
159
4
162
63
88
174
25
31
141
146
148
86
22
65
14
91
171
117
155
130
8345
62
165
69
133
116
135
132
89
100
59
177
172
112
150
131
178
105
119
93
113
84
57
151
127
49
76
149
103
160
128
157
154
169
104
21
156
153
44
52
142
33
118
56
161
58
2
163
1540
164
47
61
60
12
126
3
121
55
124
70
143
53
170
168
137
122136
166
51
167
54
125
7
1311
Colorado School Districts
5
4
78
40
2
15
12
3
26
16525 170
7
13
1
42 44
1011
45
57
52
61
60
56
58
55
156
53
157
5154
5964
50
65
42 47
49
Denver Area
Colorado Springs Area

44 School Finance in Colorado
Colorado School Districts Sorted by Number
1 Mapleton 51 Widefield 101 Karval 151 Telluride
2 Adams 12 52 Fountain 102 Valley 152 Norwood
3 Commerce City 53 Colorado Springs 103 Frenchman 153 Julesburg
4 Brighton 54 Cheyenne Mountain 104 Buffalo 154 Platte Valley RE-3
5 Bennett 55 Manitou Springs 105 Plateau 155 Summit
6 Strasburg 56 Academy 106 DeBeque 156 Cripple Creek
7 Westminster 57 Ellicott 107 Plateau Valley 157 Woodland Park
8 Alamosa 58 Peyton 108 Mesa Valley 158 Akron
9 Sangre de Cristo 59 Hanover 109 Creede 159 Arickaree
10 Englewood 60 Lewis-Palmer 110 Moffat County RE 1 160 Otis
11 Sheridan 61 Falcon 111 Montezuma 161 Lone Star
12 Cherry Creek 62 Edison 112 Dolores RE-4A 162 Woodlin
13 Littleton 63 Miami-Yoder 113 Mancos 163 Gilcrest
14 Deer Trail 64 Canon City 114 Montrose 164 Eaton
15 Aurora 65 Florence 115 West End 165 Keenesburg
16 Byers 66 Cotopaxi 116 Brush 166 Windsor
17 Archuleta 67 Roaring Fork RE-1 117 Fort Morgan 167 Johnstown
18 Walsh 68 Rifle 118 Weldon 168 Greeley
19 Pritchett 69 Parachute 119 Wiggins 169 Platte Valley RE-7
20 Springfield 70 Gilpin 120 East Otero 170 Fort Lupton
21 Vilas 71 West Grand 121 Rocky Ford 171 Ault-Highland
22 Campo 72 East Grand 122 Manzanola 172 Briggsdale
23 Las Animas 73 Gunnison 123 Fowler 173 Prairie
24 McClave 74 Hinsdale 124 Cheraw 174 Pawnee
25 St. Vrain 75 Huerfano 125 Swink 175 West Yuma
26 Boulder 76 La Veta 126 Ouray 176 East Yuma
27 Buena Vista 77 North Park 127 Ridgway 177 Idalia
28 Salida 78 Jefferson 128 Platte Canyon 178 Liberty
29 Kit Carson 79 Eads 129 Park County 30 Cheyenne R-5 80 Plainview 130 Holyoke 31 Clear Creek 81 Arriba-Flagler 131 Haxtun 32 North Conejos 82 Hi Plains 132 Aspen 33 Sanford 83 Stratton 133 Granada 34 South Conejos 84 Bethune 134 Lamar 35 Centennial 85 Burlington 135 Holly 36 Sierra Grande 86 Lake 136 Wiley 37 Crowley 87 Durango 137 Pueblo City 38 Westcliffe 88 Bayfield 138 Pueblo Rural 39 Delta 89 Ignacio 139 Meeker 40 Denver 90 Poudre 140 Rangely 41 Dolores County RE-2 91 Thompson 141 Del Norte 42 Douglas 92 Estes Park 142 Monte Vista 43 Eagle 93 Trinidad 143 Sargent 44 Elizabeth 94 Primero 144 Hayden 45 Kiowa 95 Hoehne 145 Steamboat Springs 46 Big Sandy 96 Aguilar 146 South Routt 47 Elbert 97 Branson 147 Mountain Valley 48 Agate 98 Kim 148 Moffat 2 49 Calhan 99 Genoa-Hugo 149 Center 50 Harrison 100 Limon 150 Silverton

School Finance in Colorado 45
APPENDIX B: SCHOOL DISTRICTS IN COLORADO HOUSE DISTRICTS
64
57
65
6258
59
60
61
13
26
54
63
47
49
19
56
39
25
46
48
30
20
21
11
7
45
51
15
36
32
12
27
3
55
33
52
44
10
24
50
18
14
5
3716
29
53
923
3843
17
31
25
63
30
7
36
32
39
56
12
27
3
3313
44
10
45
56
24
11
39
5
64
37
1
6
29
9
23
38
28
8
22
2
4
43
31
42
40
35 34
41
19
20
39
15
21
18
14
16
17
Denver Area
Colorado Springs Area
4948
63
51
52
50
53
Fort Collins-Loveland Area
House Districts
School Districts
Legend
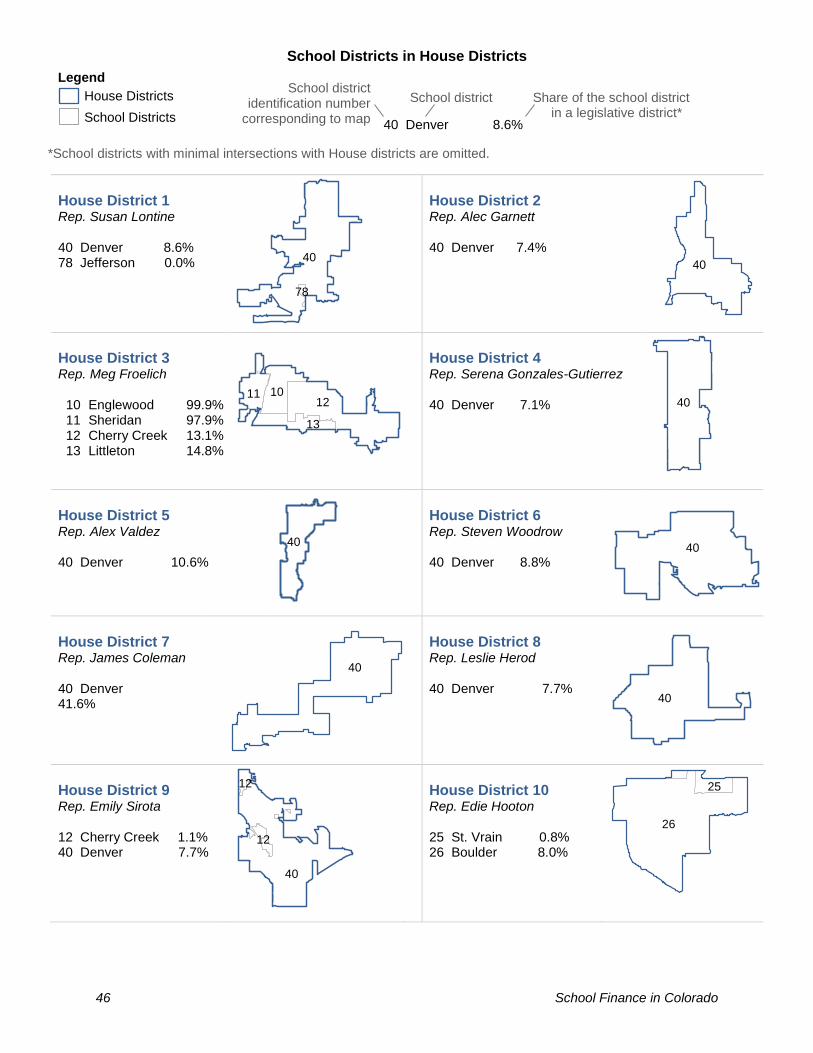
46 School Finance in Colorado
School Districts in House Districts
*School districts with minimal intersections with House districts are omitted.
House District 1 Rep. Susan Lontine 40 Denver 8.6% 78 Jefferson 0.0%
House District 2 Rep. Alec Garnett 40 Denver 7.4%
House District 3 Rep. Meg Froelich
10 Englewood 99.9% 11 Sheridan 97.9% 12 Cherry Creek 13.1% 13 Littleton 14.8%
House District 4 Rep. Serena Gonzales-Gutierrez 40 Denver 7.1%
House District 5 Rep. Alex Valdez 40 Denver 10.6%
House District 6 Rep. Steven Woodrow 40 Denver 8.8%
House District 7 Rep. James Coleman 40 Denver 41.6%
House District 8 Rep. Leslie Herod 40 Denver 7.7%
House District 9 Rep. Emily Sirota 12 Cherry Creek 1.1% 40 Denver 7.7%
House District 10 Rep. Edie Hooton 25 St. Vrain 0.8% 26 Boulder 8.0%
40
78
40
12 10 11
13 40
40 40
40
40
40
12
12
26
25
40 Denver 8.6%
Share of the school district in a legislative district*
School district
School district identification number
corresponding to map
House Districts
School Districts
Legend

School Finance in Colorado 47
School Districts in House Districts
House District 11 Rep. Jonathan Singer
25 St. Vrain 42.8% 26 Boulder 1.9% 91 Thompson 1.7% 92 Estes Park 7.1%
House District 12 Rep. Sonya Jaquez-Lewis
25 St. Vrain 6.8% 26 Boulder 9.4%
House District 13 Rep. KC Becker
25 St. Vrain 9.5% 26 Boulder 75.1% 31 Clear Creek 100% 70 Gilpin 100% 71 West Grand 85.9% 72 East Grand 100% 77 North Park 100% 92 Estes Park 10.8%
House District 14 Rep. Shane Sandridge
53 Colorado Springs 4.7% 56 Academy 23.0% 61 Falcon 0.1%
House District 15 Rep. Dave Williams
50 Harrison 7.9% 51 Widefield 41.1% 53 Colorado Springs 13.0% 56 Academy 0.5% 57 Ellicott 3.3% 61 Falcon 24.8%
House District 16 Rep. Larry Liston
53 Colorado Springs 28.8% 56 Academy 0.2%
House District 17 Rep. Tony Exum
50 Harrison 67.9% 51 Widefield 2.0% 53 Colorado Springs 6.7%
House District 18 Rep. Marc Snyder
50 Harrison 5.5% 53 Colorado Springs 30.1% 54 Cheyenne Mountain 9.4% 55 Manitou Springs 6.2%
House District 19 Rep. Tim Geitner
46 Big Sandy 10.6% 49 Calhan 79.2% 51 Widefield 13.2% 52 Fountain 24.6% 57 Ellicott 96.7% 58 Peyton 92.3%
59 Hanover 84.9% 56 Academy 36.9% 60 Lewis-Palmer 54.9% 61 Falcon 75.0% 62 Edison 46.9% 63 Miami-Yoder 52.8%
25
92
26
91
26
25
77
71 72
31
26
70
92 25
56
53 61
61
51
53 57
50
56
53 56
50
53
51
53 55
54 50
57
59
63
49
62
58
61
60 46 56
52
51

48 School Finance in Colorado
School Districts in House Districts
House District 20 Rep. Terri Carver 50 Harrison 18.5% 52 Fountain 1.8% 53 Colorado Springs 16.7% 54 Cheyenne Mountain 80.8% 55 Manitou Springs 93.8% 56 Academy 39.4% 60 Lewis-Palmer 45.1%
House District 21 Rep. Lois Landgraf 51 Widefield 43.7% 52 Fountain 73.5% 54 Cheyenne Mountain 9.8% 59 Hanover 15.1% 65 Florence 19.4%
House District 22 Rep. Colin Larson 78 Jefferson 3.0%
House District 23 Rep. Chris Kennedy 78 Jefferson 3.3%
House District 24 Rep. Monica Duran 78 Jefferson 4.7%
House District 25 Rep. Lisa Cutter 78 Jefferson 74.5%
House District 26 Rep. Dylan Roberts
43 Eagle 75.8% 67 Roaring Fork 17.6% 71 West Grand 5.9%
144 Hayden 100% 145 Steamboat Springs 100% 146 South Routt 97.8%
House District 27 Rep. Brianna Titone 78 Jefferson 7.4%
House District 28 Rep. Kerry Tipper 78 Jefferson 3.1%
House District 29 Rep. Tracy Kraft-Tharp 78 Jefferson 3.5%
78
55
60
56
54
53
50 52
52
65 59
51 54
78
78
78
43
145 144
146
67
71
78
78 78
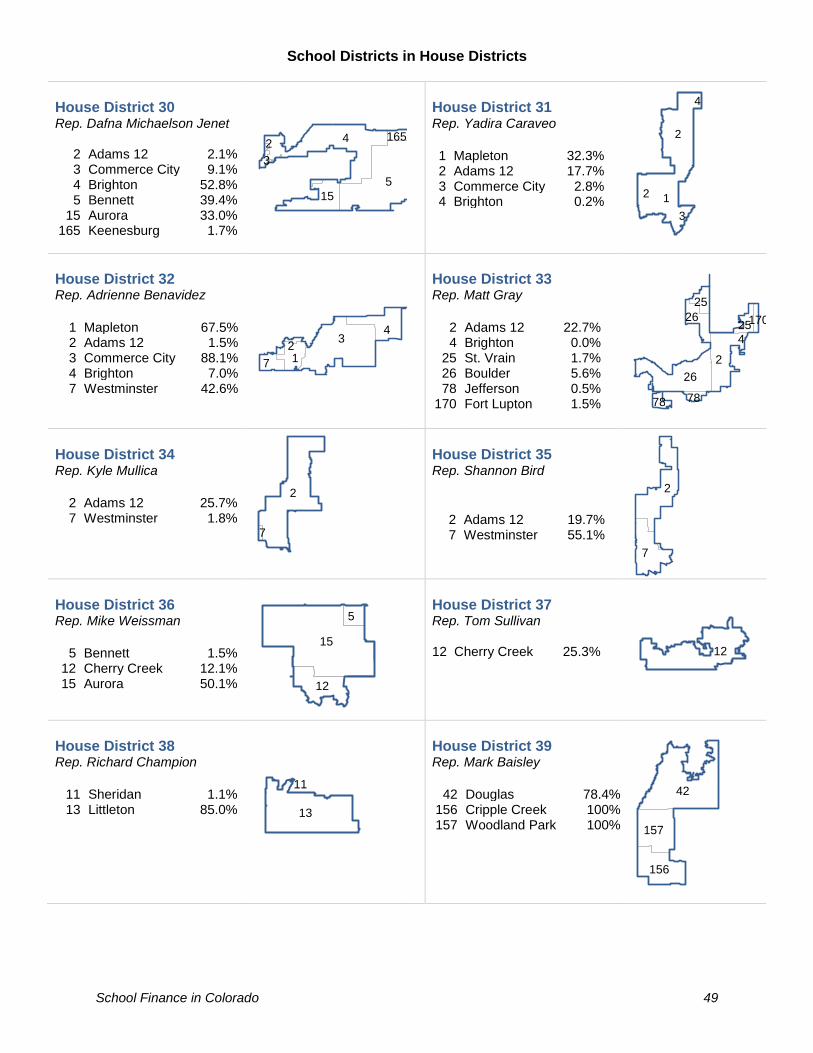
School Finance in Colorado 49
School Districts in House Districts
House District 30 Rep. Dafna Michaelson Jenet
2 Adams 12 2.1% 3 Commerce City 9.1% 4 Brighton 52.8% 5 Bennett 39.4%
15 Aurora 33.0% 165 Keenesburg 1.7%
House District 31 Rep. Yadira Caraveo
1 Mapleton 32.3% 2 Adams 12 17.7% 3 Commerce City 2.8% 4 Brighton 0.2%
House District 32 Rep. Adrienne Benavidez
1 Mapleton 67.5% 2 Adams 12 1.5% 3 Commerce City 88.1% 4 Brighton 7.0% 7 Westminster 42.6%
House District 33 Rep. Matt Gray
2 Adams 12 22.7% 4 Brighton 0.0%
25 St. Vrain 1.7% 26 Boulder 5.6% 78 Jefferson 0.5%
170 Fort Lupton 1.5%
House District 34 Rep. Kyle Mullica
2 Adams 12 25.7% 7 Westminster 1.8%
House District 35 Rep. Shannon Bird
2 Adams 12 19.7% 7 Westminster 55.1%
House District 36 Rep. Mike Weissman
5 Bennett 1.5%
12 Cherry Creek 12.1% 15 Aurora 50.1%
House District 37 Rep. Tom Sullivan 12 Cherry Creek 25.3%
House District 38 Rep. Richard Champion
11 Sheridan 1.1% 13 Littleton 85.0%
House District 39 Rep. Mark Baisley
42 Douglas 78.4%
156 Cripple Creek 100% 157 Woodland Park 100%
2
12
4
3
5
4
15
3
165 2
3 4
1 7 2
2 26
26 25
25
78 78
170 4
2
7
2
7
15
12
5
12
13
11 42
157
156

50 School Finance in Colorado
School Districts in House Districts
House District 40 Rep. Janet Buckner
12 Cherry Creek 15.8% 15 Aurora 2.6%
House District 41 Rep. Jovan Melton
12 Cherry Creek 7.1% 15 Aurora 4.3%
House District 42 Rep. Dominique Jackson
12 Cherry Creek 0.9% 15 Aurora 8.7% 40 Denver 0.1%
House District 43 Rep. Kevin Van Winkle
42 Douglas 2.2%
House District 44 Rep. Kim Ransom
42 Douglas 5.2%
House District 45 Rep. Patrick Neville
42 Douglas 11.3%
House District 46 Rep. Daneya Esgar
137 Pueblo City 52.0% 138 Pueblo Rural 28.1%
House District 47 Rep. Bri Buentello
62 Edison 8.8% 123 Fowler 88.1% 64 Canon City 23.9% 124 Cheraw 99.9% 65 Florence 42.0% 125 Swink 100%
120 East Otero 100% 137 Pueblo City 27.4% 121 Rocky Ford 100% 138 Pueblo Rural 65.3% 122 Manzanola 83.6%
House District 48 Rep. Stephen Humphrey
163 Gilcrest 79.9% 164 Eaton 37.6% 166 Windsor 56.2% 167 Johnstown 68.2% 168 Greeley 65.7% 169 Platte Valley 0.6% 171 Ault-Highland 20.0%
House District 49 Rep. Perry Buck
25 St. Vrain 8.3% 90 Poudre 96.2% 91 Thompson 74.3% 92 Estes Park 82.1%
166 Windsor 43.8% 167 Johnstown 28.0%
12
15
12 15
15
12
40 42
42 42
138 137
138
120
123
64
65
121 124 122
125
62 137
163
171
164
167
168
166
169
90
92 91 25
166
167
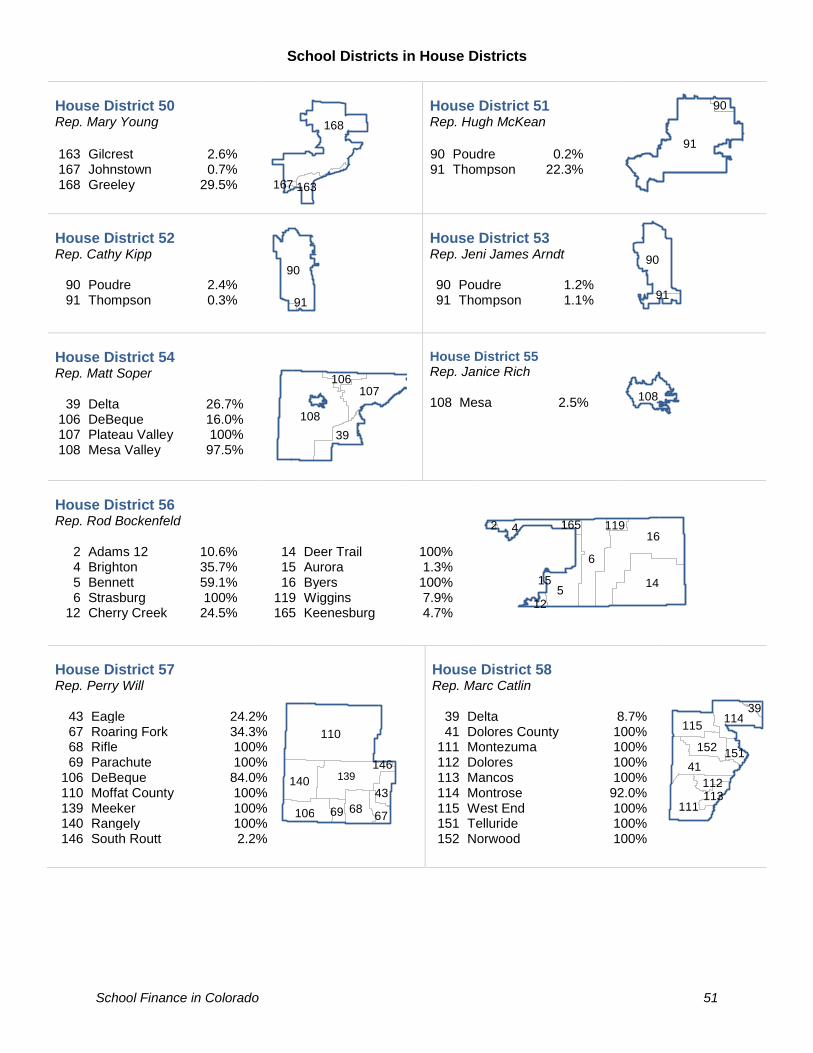
School Finance in Colorado 51
School Districts in House Districts
House District 50 Rep. Mary Young
163 Gilcrest 2.6% 167 Johnstown 0.7% 168 Greeley 29.5%
House District 51 Rep. Hugh McKean
90 Poudre 0.2% 91 Thompson 22.3%
House District 52 Rep. Cathy Kipp
90 Poudre 2.4% 91 Thompson 0.3%
House District 53 Rep. Jeni James Arndt 90 Poudre 1.2% 91 Thompson 1.1%
House District 54 Rep. Matt Soper
39 Delta 26.7% 106 DeBeque 16.0% 107 Plateau Valley 100% 108 Mesa Valley 97.5%
House District 55 Rep. Janice Rich 108 Mesa 2.5%
House District 56 Rep. Rod Bockenfeld
2 Adams 12 10.6% 4 Brighton 35.7% 5 Bennett 59.1% 6 Strasburg 100%
12 Cherry Creek 24.5%
14 Deer Trail 100% 15 Aurora 1.3% 16 Byers 100%
119 Wiggins 7.9% 165 Keenesburg 4.7%
House District 57 Rep. Perry Will
43 Eagle 24.2% 67 Roaring Fork 34.3% 68 Rifle 100% 69 Parachute 100%
106 DeBeque 84.0% 110 Moffat County 100% 139 Meeker 100% 140 Rangely 100% 146 South Routt 2.2%
House District 58 Rep. Marc Catlin
39 Delta 8.7% 41 Dolores County 100%
111 Montezuma 100% 112 Dolores 100% 113 Mancos 100% 114 Montrose 92.0% 115 West End 100% 151 Telluride 100% 152 Norwood 100%
168
163 167
91
90
90
91
90
91
108
107
39
106
108
16
6
14 5
4
12
119 165 2
15
110
139 140
68 106
43
67 69
146 41
111
114 115
152
112 113
151
39

52 School Finance in Colorado
School Districts in House Districts
House District 59 Rep. Barbara McLachlan
17 Archuleta 100% 73 Gunnison 30.4% 74 Hinsdale 100% 87 Durango 100% 88 Bayfield 100% 89 Ignacio 100%
114 Montrose 8.0% 126 Ouray 100% 127 Ridgway 100% 150 Silverton 100%
House District 60 Rep. James Wilson
27 Buena Vista 100% 28 Salida 100% 38 Westcliffe 100% 64 Canon City 76.1% 65 Florence 38.7% 66 Cotopaxi 100%
128 Platte Canyon 100% 129 Park County 100%
House District 61 Rep. Julie McCluskie
39 Delta 64.6% 67 Roaring Fork 48.1% 71 West Grand 8.2% 73 Gunnison 48.7% 86 Lake 100%
132 Aspen 100% 155 Summit 100%
House District 62 Rep. Donald Valdez
8 Alamosa 100% 9 Sangre de Cristo 100%
32 North Conejos 100% 33 Sanford 100% 34 South Conejos 100% 35 Centennial 100% 36 Sierra Grande 100% 73 Gunnison 20.9% 75 Huerfano 100% 76 La Veta 100%
109 Creede 100% 137 Pueblo City 20.7% 138 Pueblo Rural 6.6% 141 Del Norte 100% 142 Monte Vista 100% 143 Sargent 100% 147 Mountain Valley 100% 148 Moffat 2 100% 149 Center 100%
House District 63 Rep. Lori Saine
4 Brighton 4.2% 25 St. Vrain 30.1% 91 Thompson 0.2%
118 Weldon 0.5% 119 Wiggins 39.9% 163 Gilcrest 17.5% 164 Eaton 62.4% 165 Keenesburg 93.6%
167 Johnstown 3.2% 168 Greeley 4.8% 169 Platte Valley 99.4% 170 Fort Lupton 98.5% 171 Ault-Highland 80.0% 172 Briggsdale 99.9% 173 Prairie 99.9% 174 Pawnee 100%
17
73
87
74
88
89
150
127
126
114 129
38
27
66 64 28
128
65
73 39
67 86
155
132
71
75
147
9
73
35
8
32
109
36
34
141
148
76
149
142
33
138
143
137
173
174
165
171
172
169
25
119
164
170
4
163
168
167 91 118
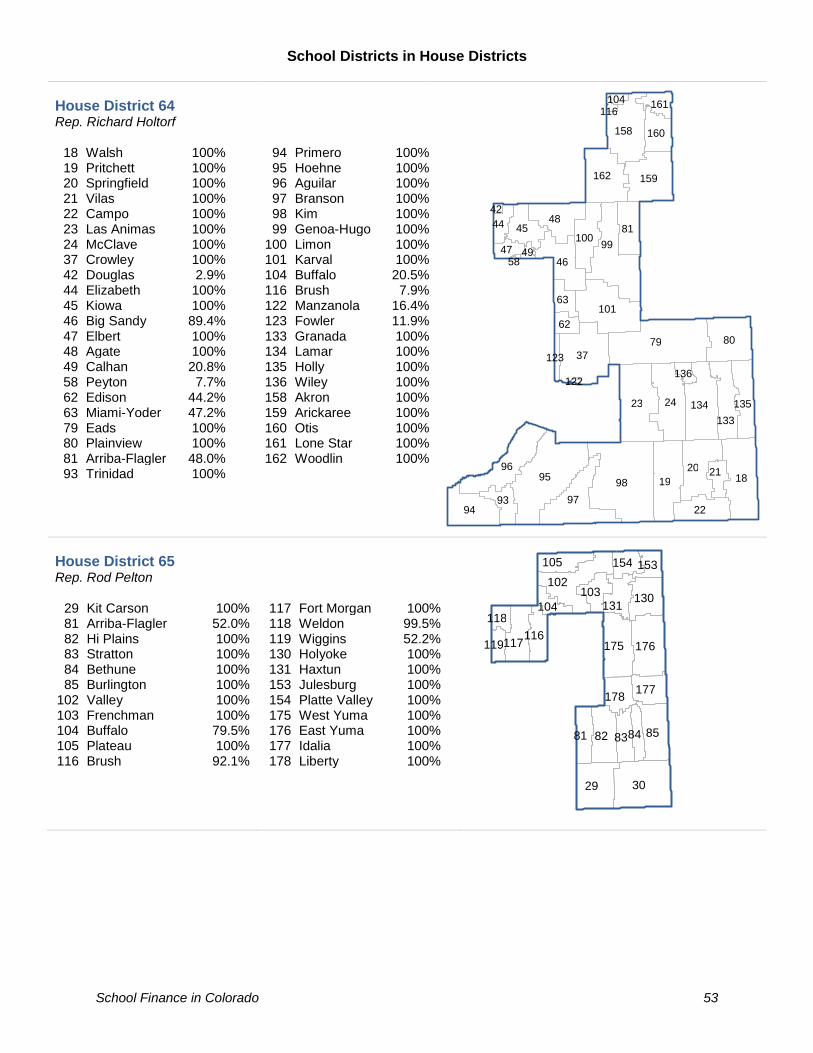
School Finance in Colorado 53
School Districts in House Districts
House District 64 Rep. Richard Holtorf
18 Walsh 100% 19 Pritchett 100% 20 Springfield 100% 21 Vilas 100% 22 Campo 100% 23 Las Animas 100% 24 McClave 100% 37 Crowley 100% 42 Douglas 2.9% 44 Elizabeth 100% 45 Kiowa 100% 46 Big Sandy 89.4% 47 Elbert 100% 48 Agate 100% 49 Calhan 20.8% 58 Peyton 7.7% 62 Edison 44.2% 63 Miami-Yoder 47.2% 79 Eads 100% 80 Plainview 100% 81 Arriba-Flagler 48.0% 93 Trinidad 100%
94 Primero 100% 95 Hoehne 100% 96 Aguilar 100% 97 Branson 100% 98 Kim 100% 99 Genoa-Hugo 100%
100 Limon 100% 101 Karval 100% 104 Buffalo 20.5% 116 Brush 7.9% 122 Manzanola 16.4% 123 Fowler 11.9% 133 Granada 100% 134 Lamar 100% 135 Holly 100% 136 Wiley 100% 158 Akron 100% 159 Arickaree 100% 160 Otis 100% 161 Lone Star 100% 162 Woodlin 100%
House District 65 Rep. Rod Pelton
29 Kit Carson 100% 81 Arriba-Flagler 52.0% 82 Hi Plains 100% 83 Stratton 100% 84 Bethune 100% 85 Burlington 100%
102 Valley 100% 103 Frenchman 100% 104 Buffalo 79.5% 105 Plateau 100% 116 Brush 92.1%
117 Fort Morgan 100% 118 Weldon 99.5% 119 Wiggins 52.2% 130 Holyoke 100% 131 Haxtun 100% 153 Julesburg 100% 154 Platte Valley 100% 175 West Yuma 100% 176 East Yuma 100% 177 Idalia 100% 178 Liberty 100%
98
79
95
23
99
18
37
97
96 19
24
80
20
101
94
46
134
48
158
159 162
22
81 45
133 135
100
93
160
63
21
44
62
47
161
136 123
49
104
42
116
122
58
30 29
85
102
82
176 175
81
117
130
83
177
131
178
105 154
116
84
103
153
104 118
119

School Finance in Colorado 54
This page intentionally left blank.
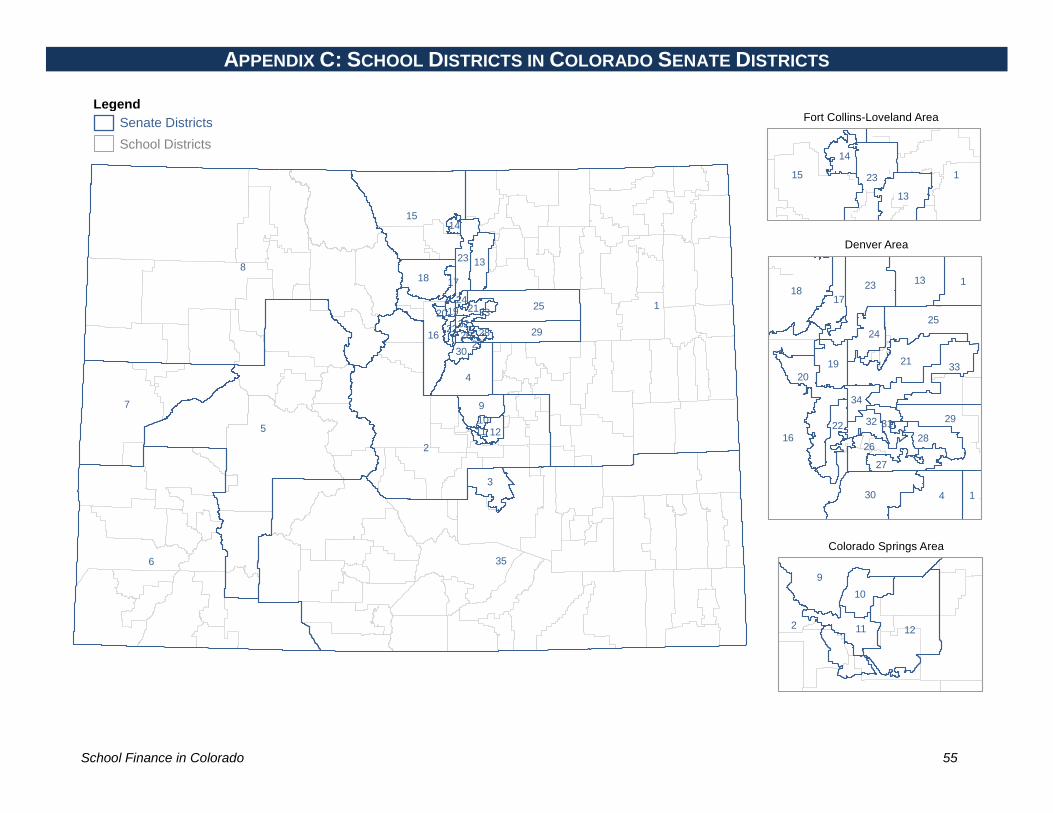
School Finance in Colorado 55
APPENDIX C: SCHOOL DISTRICTS IN COLORADO SENATE DISTRICTS
1
8
356
5
2
7
15
4
25
3
16
9
29
18
23 13
12
30
2120
17
33
14
26
2419
2827
11
22
10
32
16
4
25
181
30
21
23
29
20
13
33
1
26
17
24
19
28
27
22 32
34
31
2
9
1211
10
Denver Area
Colorado Springs Area
115 23
13
14
Fort Collins-Loveland AreaSenate Districts
School Districts
Legend
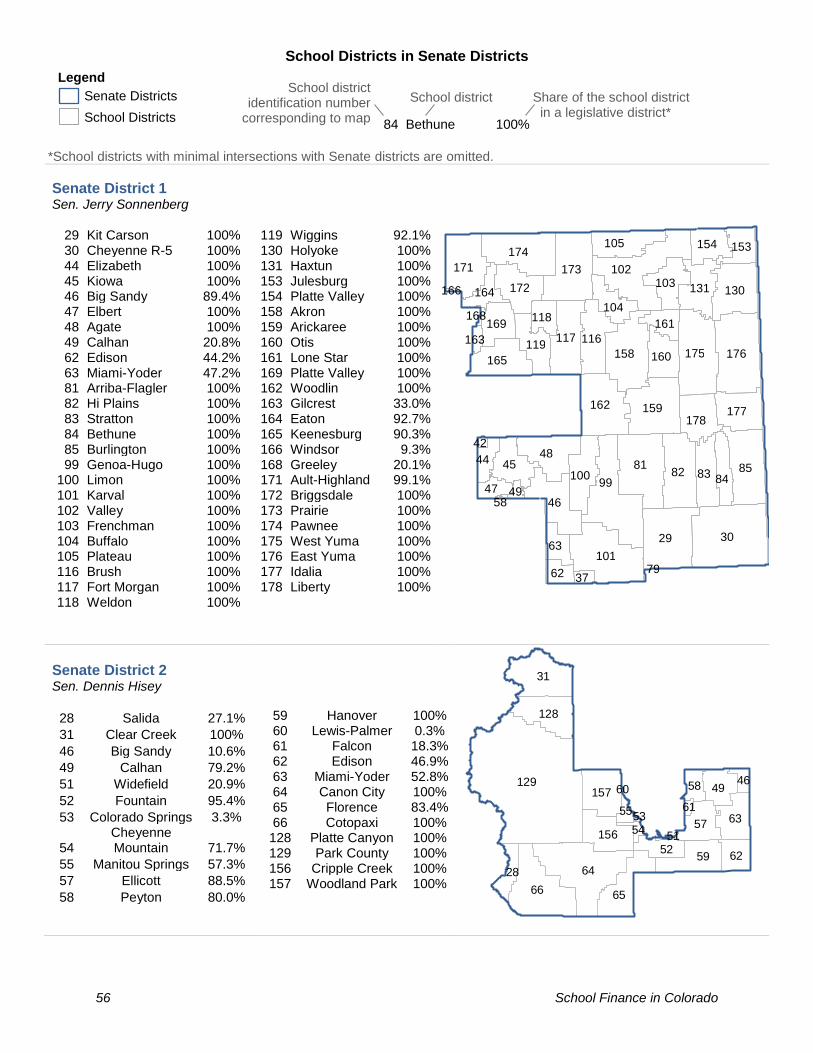
56 School Finance in Colorado
School Districts in Senate Districts
*School districts with minimal intersections with Senate districts are omitted.
Senate District 1 Sen. Jerry Sonnenberg
29 Kit Carson 100% 30 Cheyenne R-5 100% 44 Elizabeth 100% 45 Kiowa 100% 46 Big Sandy 89.4% 47 Elbert 100% 48 Agate 100% 49 Calhan 20.8% 62 Edison 44.2% 63 Miami-Yoder 47.2% 81 Arriba-Flagler 100% 82 Hi Plains 100% 83 Stratton 100% 84 Bethune 100% 85 Burlington 100% 99 Genoa-Hugo 100%
100 Limon 100% 101 Karval 100% 102 Valley 100% 103 Frenchman 100% 104 Buffalo 100% 105 Plateau 100% 116 Brush 100% 117 Fort Morgan 100% 118 Weldon 100%
119 Wiggins 92.1% 130 Holyoke 100% 131 Haxtun 100% 153 Julesburg 100% 154 Platte Valley 100% 158 Akron 100% 159 Arickaree 100% 160 Otis 100% 161 Lone Star 100% 169 Platte Valley 100% 162 Woodlin 100% 163 Gilcrest 33.0% 164 Eaton 92.7% 165 Keenesburg 90.3% 166 Windsor 9.3% 168 Greeley 20.1% 171 Ault-Highland 99.1% 172 Briggsdale 100% 173 Prairie 100% 174 Pawnee 100% 175 West Yuma 100% 176 East Yuma 100% 177 Idalia 100% 178 Liberty 100%
Senate District 2 Sen. Dennis Hisey
28 Salida 27.1%
31 Clear Creek 100%
46 Big Sandy 10.6%
49 Calhan 79.2%
51 Widefield 20.9%
52 Fountain 95.4%
53 Colorado Springs 3.3%
54 Cheyenne Mountain 71.7%
55 Manitou Springs 57.3%
57 Ellicott 88.5%
58 Peyton 80.0%
59 Hanover 100% 60 Lewis-Palmer 0.3% 61 Falcon 18.3% 62 Edison 46.9% 63 Miami-Yoder 52.8% 64 Canon City 100% 65 Florence 83.4% 66 Cotopaxi 100% 128 Platte Canyon 100% 129 Park County 100% 156 Cripple Creek 100% 157 Woodland Park 100%
129
64
66
31
65
59
63
128
57
157
156
49
6252
58
28
46
55
54
61
51
53
60
30
99
81
29
85
102
82
176
101
175
46
48
173
158
159 162
174 171
117
130
83 45
116
165
100
177
172 131
178
105
84
119
103
160
63
154
169 104
153
44
62
47
118 161
164
37
49
163
42
168
58
166
79
84 Bethune 100%
Share of the school district in a legislative district*
School district
School district identification number
corresponding to map
Senate Districts
School Districts
Legend

School Finance in Colorado 57
School Districts in Senate Districts
Senate District 3 Sen. Leroy Garcia 137 Pueblo City 77.0% 138 Pueblo Rural 18.9%
Senate District 4 Sen. Jim Smallwood 42 Douglas 82.5%
Senate District 5 Sen. Kerry Donovan
17 Archuleta 18.9% 27 Buena Vista 100% 28 Salida 72.9% 39 Delta 82.0% 43 Eagle 71.5% 67 Roaring Fork 65.7%
71 West Grand 5.9% 73 Gunnison 79.1% 74 Hinsdale 100% 86 Lake 100%
114 Montrose 3.9% 132 Aspen 100%
Senate District 6 Sen. Don Coram
17 Archuleta 81.1% 39 Delta 8.7% 41 Dolores County 100% 87 Durango 100% 88 Bayfield 100% 89 Ignacio 100%
111 Montezuma 100% 112 Dolores 100%
113 Mancos 100% 114 Montrose 96.1% 115 West End 100% 126 Ouray 100% 127 Ridgway 100% 150 Silverton 100% 151 Telluride 100% 152 Norwood 100%
Senate District 7 Sen. Ray Scott
39 Delta 9.3% 106 DeBeque 16.0% 107 Plateau Valley 100% 108 Mesa Valley 100%
Senate District 8 Sen. Bob Rankin
43 Eagle 28.5% 67 Roaring Fork 34.3% 68 Rifle 100% 69 Parachute 100% 71 West Grand 94.1% 72 East Grand 100% 77 North Park 100%
106 DeBeque 84.0% 110 Moffat County 100%
139 Meeker 100% 140 Rangely 100% 144 Hayden 100%
145 Steamboat Springs 100%
146 South Routt 100% 155 Summit 100%
42
138
137
73 39
43
74
67
27
86
28
17
132
71
114
41
17 87 111
114 115
152
88
89
112
150 151
113
127
39
126
108
107
39
106
110 77
139 71 140
72
68
145
106
43
144
146
67 155 69
43
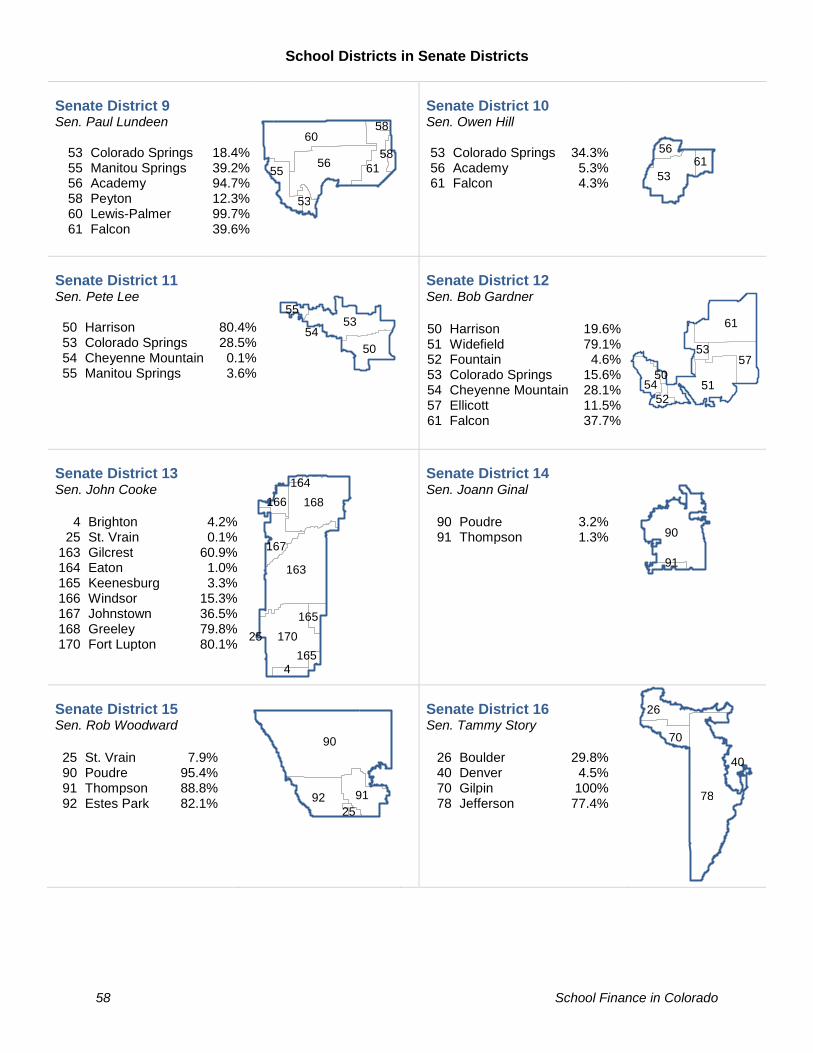
58 School Finance in Colorado
School Districts in Senate Districts
Senate District 9 Sen. Paul Lundeen
53 Colorado Springs 18.4% 55 Manitou Springs 39.2% 56 Academy 94.7% 58 Peyton 12.3% 60 Lewis-Palmer 99.7% 61 Falcon 39.6%
Senate District 10 Sen. Owen Hill 53 Colorado Springs 34.3% 56 Academy 5.3% 61 Falcon 4.3%
Senate District 11 Sen. Pete Lee 50 Harrison 80.4% 53 Colorado Springs 28.5% 54 Cheyenne Mountain 0.1% 55 Manitou Springs 3.6%
Senate District 12 Sen. Bob Gardner
50 Harrison 19.6% 51 Widefield 79.1% 52 Fountain 4.6% 53 Colorado Springs 15.6% 54 Cheyenne Mountain 28.1% 57 Ellicott 11.5% 61 Falcon 37.7%
Senate District 13 Sen. John Cooke
4 Brighton 4.2%
25 St. Vrain 0.1% 163 Gilcrest 60.9% 164 Eaton 1.0% 165 Keenesburg 3.3% 166 Windsor 15.3% 167 Johnstown 36.5% 168 Greeley 79.8% 170 Fort Lupton 80.1%
Senate District 14 Sen. Joann Ginal
90 Poudre 3.2% 91 Thompson 1.3%
Senate District 15 Sen. Rob Woodward
25 St. Vrain 7.9% 90 Poudre 95.4% 91 Thompson 88.8% 92 Estes Park 82.1%
Senate District 16 Sen. Tammy Story
26 Boulder 29.8% 40 Denver 4.5% 70 Gilpin 100% 78 Jefferson 77.4%
60
56 61 55
53
58
58
53
56 61
53
50
55
54 61
51
57
54
53
52
50
163
170
168
167
4
166
165
165
164
25
90
91
90
92 91 25
78
26
70
40

School Finance in Colorado 59
School Districts in Senate Districts
Senate District 17 Sen. Mike Foote
25 St. Vrain 10.7% 26 Boulder 7.3%
Senate District 18 Sen. Stephen Fenberg
25 St. Vrain 50.0% 26 Boulder 60.7% 91 Thompson 1.7% 92 Estes Park 17.9%
Senate District 19 Sen. Rachel Zenzinger
78 Jefferson 5.8%
Senate District 20 Sen. Jessie Danielson
78 Jefferson 11.3%
Senate District 21 Sen. Dominick Moreno
1 Mapleton 74.1% 2 Adams 12 4.6% 3 Commerce City 89.6% 4 Brighton 19.5% 7 Westminster 83.4%
Senate District 22 Sen. Brittany Pettersen
78 Jefferson 4.9%
Senate District 23 Sen. Vicki Marble
2 Adams 12 22.7%
25 St. Vrain 31.3% 26 Boulder 2.2% 78 Jefferson 0.5% 90 Poudre 1.4% 91 Thompson 8.1%
163 Gilcrest 6.1% 164 Eaton 6.3% 166 Windsor 75.4% 167 Johnstown 63.5% 170 Fort Lupton 19.8% 171 Ault-Highland 0.9%
Senate District 24 Sen. Faith Winter
1 Mapleton 1.0% 2 Adams 12 64.7% 4 Brighton 1.8% 7 Westminster 16.1%
Senate District 25 Sen. Kevin Priola
1 Mapleton 24.8% 2 Adams 12 8.1%
3 Commerce City 10.4%
4 Brighton 74.5% 5 Bennett 50.8% 6 Strasburg 70.0%
14 Deer Trail 22.8% 15 Aurora 33.0% 16 Byers 80.6%
119 Wiggins 7.9% 165 Keenesburg 6.4%
25
26 26
25 92 91
78
78
3 4
7 1
2
78
25
166
167
2
170
91
90
26
164
163
171
78
168
2
4
7 1
16 6
4
5 14 15
165 119
3 2 1

60 School Finance in Colorado
School Districts in Senate Districts
Senate District 26 Sen. Jeff Bridges
10 Englewood 99.9% 11 Sheridan 99.0% 12 Cherry Creek 24.9% 13 Littleton 64.0% 40 Denver 0.2%
Senate District 27 Sen. Jack Tate
12 Cherry Creek 28.3% 13 Littleton 35.9%
Senate District 28 Sen. Nancy Todd
12 Cherry Creek 21.4% 15 Aurora 16.3%
Senate District 29 Sen. Rhonda Fields
5 Bennett 49.1% 6 Strasburg 29.9%
12 Cherry Creek 24.2% 14 Deer Trail 77.2%
15 Aurora 50.7% 16 Byers 19.4% 40 Denver 0.1%
Senate District 30 Sen. Chris Holbert
42 Douglas 14.7%
Senate District 31 Sen. Chris Hansen
12 Cherry Creek 1.1% 40 Denver 13.9%
Senate District 32 Sen. Robert Rodriguez
40 Denver 16.2%
Senate District 33 Sen. Angela Williams
40 Denver 49.0%
Senate District 34 Sen. Julie Gonzales
40 Denver 15.9%
12
13
10 11 40 12
13
12
15
5 14 6 16 15
12
40
42
40
12
40
40
40
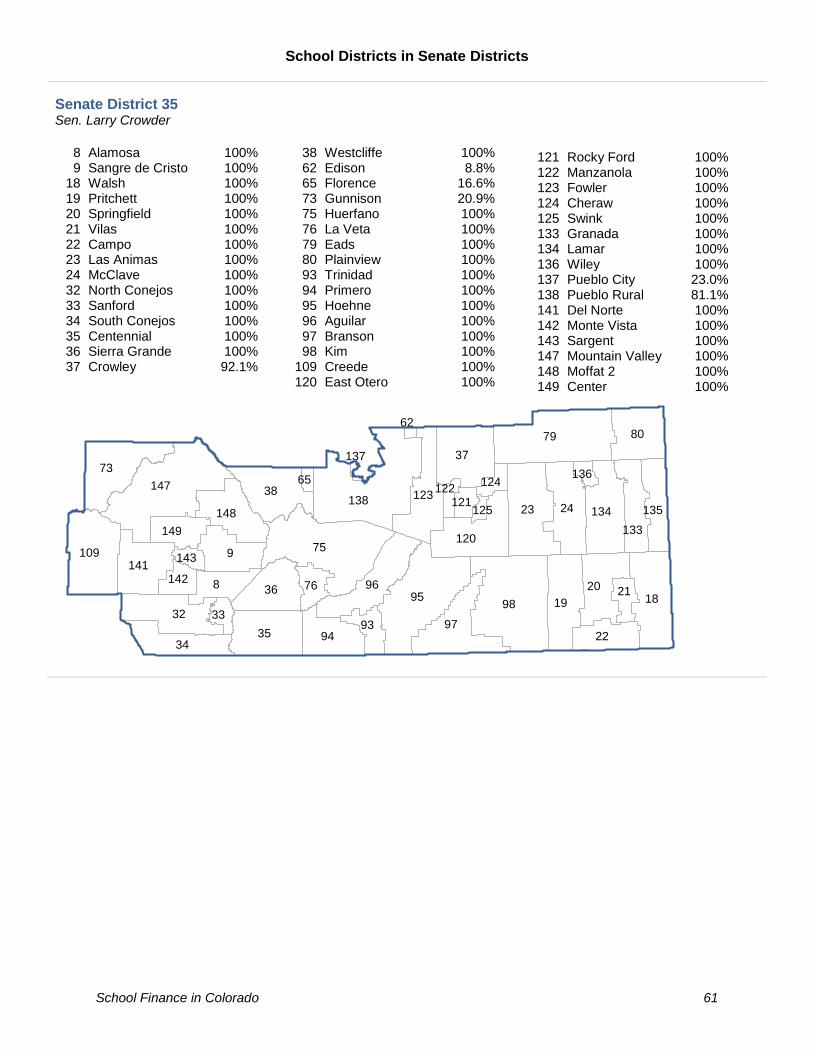
School Finance in Colorado 61
School Districts in Senate Districts
Senate District 35 Sen. Larry Crowder
8 Alamosa 100% 9 Sangre de Cristo 100%
18 Walsh 100% 19 Pritchett 100% 20 Springfield 100% 21 Vilas 100% 22 Campo 100% 23 Las Animas 100% 24 McClave 100% 32 North Conejos 100% 33 Sanford 100% 34 South Conejos 100% 35 Centennial 100% 36 Sierra Grande 100% 37 Crowley 92.1%
38 Westcliffe 100% 62 Edison 8.8% 65 Florence 16.6% 73 Gunnison 20.9% 75 Huerfano 100% 76 La Veta 100% 79 Eads 100% 80 Plainview 100% 93 Trinidad 100% 94 Primero 100% 95 Hoehne 100% 96 Aguilar 100% 97 Branson 100% 98 Kim 100%
109 Creede 100% 120 East Otero 100%
121 Rocky Ford 100% 122 Manzanola 100% 123 Fowler 100% 124 Cheraw 100% 125 Swink 100% 133 Granada 100% 134 Lamar 100% 136 Wiley 100% 137 Pueblo City 23.0% 138 Pueblo Rural 81.1% 141 Del Norte 100% 142 Monte Vista 100% 143 Sargent 100% 147 Mountain Valley 100% 148 Moffat 2 100% 149 Center 100%
98
75
79
95
138 147
9
23
73
18
97
37
96
38
35
8
19 32
24
109
80
20 36
34 94
120
134 123
141
148
22
133
135
93
76
149
21 142
33
121
124
143
122 136
65
125
62
137