SCHOOL EFFECTIVENESS IN READING AND MATHEMATICS IN
84
INTERNATIONAL INSTITUTE FOR EDUCATIONAL PLANNING UNESCO-IIEP/2012 SCHOOL EFFECTIVENESS IN READING AND MATHEMATICS IN ZAMBIA: Analysis of SACMEQ III Data by PATRICK M. LUFUNDA ZAMBIA Adviser: STEPHANIE DOLATA This Memoir is presented within the framework of the IIEP 2011/2012 Advanced Training Programme in Educational Planning and Management.
Transcript of SCHOOL EFFECTIVENESS IN READING AND MATHEMATICS IN
INTERNATIONAL INSTITUTE FOR EDUCATIONAL PLANNING UNESCO-IIEP/2012
SCHOOL EFFECTIVENESS IN READING AND MATHEMATICS IN
ZAMBIA: Analysis of SACMEQ III Data
by
PATRICK M. LUFUNDA
ZAMBIA
Adviser: STEPHANIE DOLATA
This Memoir is presented within the framework of the IIEP 2011/2012 Advanced Training Programme in Educational Planning and Management.
i
ABSTRACT
In Zambia, as the focus shifts from achieving access to primary education to quality of
education comes the need to hold schools accountable for the performance of their intakes. In
as much as this should be the case, care must be taken to ensure that schools are held
accountable only for the things they can influence. School effectiveness research offers the
possibility for achieving this in that it is possible to determine school effects on pupil scores
by statistically isolating other contributing factors. This therefore offers a possibility for fairly
ranking schools according to performance. When school management teams accept the
ranking criterion as fair and that what is being measured is the core purpose for which they
were set out to achieve, they will strive to improve and consequently make schools better
learning environments.
This study takes advantage of the array of data collected through SACMEQ III project on
grade 6 pupils’ home background, school resources, teachers and head teacher’s
characteristics and links the same to school mean scores in reading and mathematics in order
to assess school effectiveness. A three-pronged approach was employed: Firstly, correlation
was used to isolate indicators having greater association with school mean scores. Secondly,
the pupil socio-economic composite indicator was used to determine more effective and less
effective schools and thirdly, the isolated indicators having greater association with school
mean scores were then compared between more effective and less effective schools to give a
portrait of a more effective school. The study concludes by pointing to a set of indicators that
planners and policy makers can focus on when planning for school effectiveness and school
improvement.

ii
DEDICATION
This memoir is dedicated to my lovely wife, Eunice H. Lufunda who has been so very
supportive and able to copy with my long absence, my children: Patrick Ndapewa Lufunda,
Einstein Kasanga Lufunda and Isaac Lufunda. This project would not have been possible
without their support and encouragement.

iii
ACKNOWLEDGEMENTS
I wish to first and foremost thank and acknowledge the Almighty God for making it possible
for me to be able to come to Paris and undertake training in Education Planning and
Management.
Special gratitude goes to the Director, Planning and Information, Dr. Felix Phiri, Ministry of
Education in Zambia for having facilitated my sponsorship. I will always cherish this gesture.
I am also indebted to my former Provincial Education Officer, Mrs. F.B. Kanchebele, Mr.
Alex Kaba and Mrs Ruth Zulu for their consistent support, advice and encouragement.
My sincere gratitude goes to my supervisor, Stephanie Dolata, for her technical advice,
patience and encouragement without which it would not have been possible to come up with
this memoir.
Last but not the least; my special thanks go to the entire IIEP professional and support team
for their hard work and coordination as well as to all my fellow trainees from whom I learnt a
lot.
iv
TABLE OF CONTENTS
ABSTRACT ................................................................................................................................ i DEDICATION ........................................................................................................................... ii ACKNOWLEDGEMENTS ...................................................................................................... iii LIST OF TABLES ................................................................................................................... vii LIST OF FIGURES ................................................................................................................. viii LIST OF ABBREVIATIONS AND ACRONYMS .................................................................. ix CHAPTER ONE: INTRODUCTION .................................................................................... 1
1.1 Background to the Study .................................................................................................. 2 1.2 Learning Achievements at Primary level in Zambia ........................................................ 3 1.3 Rationale of the Study ...................................................................................................... 4 1.4 The Research Problematic ................................................................................................ 5 1.5 Research Questions ........................................................................................................... 6 1.6 The main objectives of the Study ..................................................................................... 6 1.7 Scope and Limitations of the study .................................................................................. 6 1.8 The Methodology Employed in the Study ........................................................................ 7 1.9 Structure of the memoir .................................................................................................... 8
CHAPTER TWO: THE SETTING OF THE STUDY ....................................................... 10 2.1 Location and Geography ................................................................................................ 10 2.2 Population and Demographics ........................................................................................ 10 2.3 Political and Socio-Cultural ............................................................................................ 10 2.4 Macro-economic and Finance ........................................................................................ 11 2.5 Zambian Education System ............................................................................................ 12
2.5.1 The Structure of Education System in Zambia ........................................................ 13
2.6 Trends in Key Education Indicators in Zambia .............................................................. 14 2.6.1 Equity ....................................................................................................................... 14
2.6.2 Internal Efficiency.................................................................................................... 15
2.6.3 Access ...................................................................................................................... 16
2.6.4 Quality ...................................................................................................................... 16
2.6.5 Management ............................................................................................................. 21
2.6.6 Cost and Financing .................................................................................................. 22
2.6.7 Teachers ................................................................................................................... 22
CHAPTER THREE: LITERATURE REVIEW ON SCHOOL EFFECTIVENESS ...... 23 3.1 Defining School Effectiveness ....................................................................................... 23 3.2 Measures of School Effectiveness .................................................................................. 24 3.3 The concept of school effectiveness and Fairness .......................................................... 26

v
3.4 School Effectiveness as seen from different Perspectives .............................................. 27 3.5 Research on School Effectiveness .................................................................................. 28 3.6 Statistical Formulation of School Effectiveness ............................................................. 29
3.6.1 Student level Regression Models ............................................................................. 29
3.6.2 School Aggregate Regression Models ..................................................................... 30
3.6.3 Multilevel models .................................................................................................... 30
3.7 Evidence from School Effectiveness Studies ................................................................. 31 3.8 Conclusion ...................................................................................................................... 34
CHAPTER FOUR: BRIEF DESCRIPTION OF THE SACMEQ III STUDY AND POLICY IMPLICATIONS IN ZAMBIA ............................................................................ 35
4.1 Introduction .................................................................................................................... 35 4.2 SACMEQ: Governance, Mission and Projects ............................................................... 35 4.3 General Policy Concerns ................................................................................................ 36 4.4 Sampling Design: population and sampling procedure .................................................. 37 4.5 SACMEQ Test Design ................................................................................................... 38 4.6 Generating pupil scores (outcomes indicators) .............................................................. 41 4.7 SACMEQ Questionnaires and generating input indicators ............................................ 41 4.8 Policy Implications of SACMEQ Study in Zambia ....................................................... 42
4.8.1 Pupils and their Learning Environments .................................................................. 42
4.8.2 Teachers Characteristics and their Views ................................................................ 42
4.8.3 School Heads Characteristics and their Views ........................................................ 43
4.8.3 Equity in Allocation of Material, Resources and Human among Regions .............. 44
4.8.4 Reading and Mathematics Achievements Levels of Pupils ..................................... 44
CHAPTER FIVE: THE SELECTION OF INDICATORS FOR THE STUDY .............. 45 5.1 Indicators Designated for further study .......................................................................... 45
5.1.1 Pupil Characteristic at Home ................................................................................... 45
5.1.2 School Resources and Teacher Characteristics ........................................................ 46
5.1.3 Teacher Characteristics ............................................................................................ 46
5.1.4 School Management and Development ................................................................... 47
5.2 Conclusion ...................................................................................................................... 48 CHAPTER SIX: INDICATORS DESCRIMINATING BETWEEN MORE EFFECTIVE AND LESS EFFECTIVE SCHOOLS .................................................................................. 49
6.1 Identification of More Effective and Less Effective Schools ......................................... 49 6.2 Regression Analysis – SES on Reading and Mathematics ............................................. 50 6.3 Determination of 20 Most Effective Schools and 20 Less Effective Schools ................ 52 6.4 Twenty (20) Most Effective Schools in Reading and Mathematics ............................... 52

vi
6.5 Twenty (20) Less Effective Schools in Reading and Mathematics ................................ 53 6.6 A Portrait of a More Effective School ............................................................................ 55
6.6.1 Pupil Characteristics at Home .................................................................................. 55
6.6.2 School Resources and Characteristics...................................................................... 56
6.6.3 Teacher Characteristics ............................................................................................ 57
6.6.4 School Management and Development ................................................................... 58
6.7 What were the Characteristics of School Effectiveness? ............................................... 59 6.8 Conclusion ...................................................................................................................... 59 6.9 Policy Suggestions for achieving School Effectiveness in Zambia. .............................. 59
CHAPTER SEVEN: SUMMARY AND CONCLUSION ................................................... 61 7.1 Indicators with strongest association with pupil mean scores ........................................ 61 7.2 Indicators most differentiating between more effective and less effective schools ....... 62 7.3 The extent to which pupil home background account for School performance ............. 62 7.4 The extent to which School Resources account for performance in schools ................. 62 7.5 What indicators (changeable by government policy) should planners focus on most when planning for school effectiveness? .............................................................................. 62 7.6 Conclusion ...................................................................................................................... 63
APPENDIX A: CORRELATION RESULTS .......................................................................... 64 APPENDIX B: REGRESSION ANALYSIS ON SCHOOL MEAN SCORES AND SCHOOLS RESOURCES ........................................................................................................ 65 APPENDIX C: LIST OF SCHOOLS RANKED BY RESIDUAL MORE AND LESS EFFECTIVE SCHOOL ............................................................................................................ 67 REFFERENCES ....................................................................................................................... 71
vii
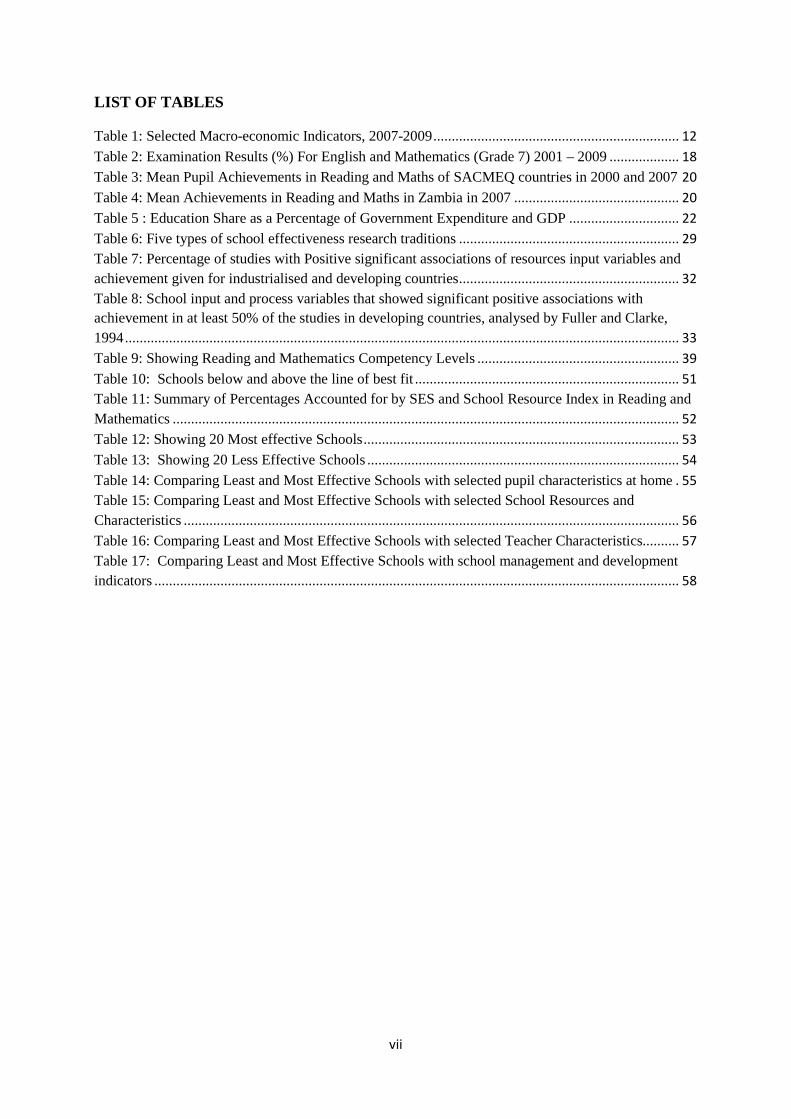
LIST OF TABLES
Table 1: Selected Macro-economic Indicators, 2007-2009 ................................................................... 12 Table 2: Examination Results (%) For English and Mathematics (Grade 7) 2001 – 2009 ................... 18 Table 3: Mean Pupil Achievements in Reading and Maths of SACMEQ countries in 2000 and 2007 20 Table 4: Mean Achievements in Reading and Maths in Zambia in 2007 ............................................. 20 Table 5 : Education Share as a Percentage of Government Expenditure and GDP .............................. 22 Table 6: Five types of school effectiveness research traditions ............................................................ 29 Table 7: Percentage of studies with Positive significant associations of resources input variables and achievement given for industrialised and developing countries ............................................................ 32 Table 8: School input and process variables that showed significant positive associations with achievement in at least 50% of the studies in developing countries, analysed by Fuller and Clarke, 1994 ....................................................................................................................................................... 33 Table 9: Showing Reading and Mathematics Competency Levels ....................................................... 39 Table 10: Schools below and above the line of best fit ........................................................................ 51 Table 11: Summary of Percentages Accounted for by SES and School Resource Index in Reading and Mathematics .......................................................................................................................................... 52 Table 12: Showing 20 Most effective Schools ...................................................................................... 53 Table 13: Showing 20 Less Effective Schools ..................................................................................... 54 Table 14: Comparing Least and Most Effective Schools with selected pupil characteristics at home . 55 Table 15: Comparing Least and Most Effective Schools with selected School Resources and Characteristics ....................................................................................................................................... 56 Table 16: Comparing Least and Most Effective Schools with selected Teacher Characteristics.......... 57 Table 17: Comparing Least and Most Effective Schools with school management and development indicators ............................................................................................................................................... 58

viii
LIST OF FIGURES
Figure 1: Enrolment Trends in Basic Education Sub-sector (2000 to 2010) ........................................... 3 Figure 2: The Structure of Ministry of Education ................................................................................. 13 Figure 3: Gender Parity Index in Basic Education (2000-2010) ........................................................... 14 Figure 4: Repetition and Drop-out Rates, 2000-2010 ........................................................................... 15 Figure 5: Transition rate from Grade 7 to 8 and 9 to 10, 2001-2010 .................................................... 15 Figure 6: Net Enrolment Rates in Basic Education from 2000 to 2010 ................................................ 16 Figure 7: Pass Rates for Examinations at Grade 7, 1997 – 2010 ......................................................... 17 Figure 8: National Mean Score in Reading and Numeracy in National Assessment ............................ 19 Figure 9: Figure 10: School Effectiveness Design ................................................................................ 28 Figure 10: School mean score in mathematics against Socio-economic Composite Indicator ............. 50

ix
LIST OF ABBREVIATIONS AND ACRONYMS
BESSIP Basic Education Sub-Sector Investment Plan
CDC Curriculum Development Centre
CPD Continuous Professional Development
DRC Democratic Republic of Congo
ECCDE Early Childhood, Care, Development and Education
ECZ Examination Council Of Zambia
EFA Education for All
EIA International Association for the Evaluation of Educational
Achievement
FBO Faith-Based Organisations
GDP Gross Domestic Product
GRZ Government of the Republic of Zambia
HAKT HIV and AIDS Knowledge Test
HIV/AIDS Human Immune Virus/Acquired Immune Deficient Syndrome
IOB Ministry of Foreign Affairs of the Netherlands
MARK Mathematics Rainbow Kit
MDG Millennium Development Goals
MMD Movement for Multi-Party Democracy
MoESP Ministry of Education Strategic Plan
NAS National Assessment Survey
NER Net Enrolment Ratio
NGOs Non-Governmental Organisation
NIF National Implementation Plan
NRC National Research Coordinators
PSLCE Primary School Leaving Certificate Examination
PTA Parent Teachers Associations
SACMEQ Southern and Eastern Africa Consortium for Monitoring Educational
Quality
SES Socio-Economic Status
SPSS Statistical Package for the Social Sciences
TIMSS Third International Mathematics and Science Study

x
UK United Kingdom
UNESCO United Nations Education and Scientific and Cultural Organisation
UNIP United National Independence Party
USA United Sates of America
WINDEM Windows Data Entry Manager
PEBGMM Principles of Education Boards Governance and Management Manual

1
CHAPTER ONE: INTRODUCTION
Parents world-over tend to look for what they term ‘better’ schools to take their children to.
The indicator that is used by parents as a yardstick for making this kind of judgements is
mostly student achievement which is usually measured by success rates in examinations
(Postlethwaite T. N and Ross K. N. 1992 P. 9). Better schools may also be termed as
‘effective schools’ because virtually everyone agrees that the mastery of basic skills is an
important component of effective schools. This is true because if pupils are not performing
well academically it would be difficult to make a convincing case to policy makers, parents
and the public that a particular school is more effective than the other (Uline C.L; Miller
M.M; Tschannen-Moran M. 1998). Research has shown that schools with an intake of pupils
from good home backgrounds will have easier time in getting them to learn than schools
where the children come from poor backgrounds. The schools that then deviate from this
general norm by performing better irrespective of the background of the pupils they serve are
said to be more effective schools because they seem to ‘add’ something to the performance of
their pupils as compared to other schools. The identification of effective schools by what they
‘add’ to the performance of their students has not been contested upon in the study of
effective schools, however what has been an issue is how to measure School Effectiveness
(Scheerens 2000 p. 9).
The concept of School effectiveness will be dealt with in greater detail in chapter three;
however, what need to emphasised here is that there will always be a general tendency for
schools serving privileged communities to have higher average scores than schools serving
poor communities when subjected to the same standardised assessment. Yet, there will always
be exceptions to this fact. It follows therefore that measures of school effectiveness are based
on comparative rather than absolute standards.
This therefore means that a fair comparison between schools can be made by assessing the
‘added value’ of a period of schooling as reflected by student achievement, when that
achievement can only be attributed to having attend school X rather than school Y (Scheerens
J. 2000). The questions would then be: Why does school X do better than School Y? Which
school characteristics lead to relatively higher performance in school X which were lacking in
School Y? Answers to these questions may be important to planners and policy makers who
would want to improve the learning achievement of pupils in primary schools in Zambia.
2
This study analysed reading and mathematics scores as well as the home background or socio-
economic status of the pupils that participated in SACMEQ III study to identify ‘more
effective’ and ‘less effective’ schools among the schools involved in the study. The study also
identified the indicators which had highest association with school mean scores in reading and
mathematics. It also isolated and analysed in greater detail the indicators that discriminated
most between more effective and less effective schools.
1.1 Background to the Study
The Basic Education sub-sector in Zambia has received a lot of attention in terms of
investment under Basic Education Sub-Sector Investment Plan (BESSIP 1999-2002),
Ministry of Education Strategic Plan (MoESP 2003-2007) and National Implementation Plan
(NIF 2008 – 2010). This investment has been mostly in form of increasing access to basic
education through the construction of new schools and additional classrooms at existing
schools. Between 2005 and 2009, the number of basic schools increased by 475, of which 275
were GRZ and grant-aided while the remainder were mainly community schools. The
government recruited 9000 extra teachers for the basic education sector and constructed 5000
extra classrooms. These resources both encouraged and were necessary to cope with a huge
growth in enrolments at the lower and middle basic levels (the primary level), from 2.6
million in 2005 to 2.9 million in 2009 (IOB Evaluation Report, 2011 P 13). The move to
improve access has been guided by the Government’s commitment to achieving the
Millennium Development Goals (MDG) and Education For All (EFA) goals on access to
basic education and the strategy has been to absorb and retain the growing number of learners
especially in disadvantaged areas. The increase in enrolment has also been boasted by the
free basic education policy which was introduced in February, 2002. Figure 1 presents the
trends in enrolment growth for the basic education sector in Zambia from 2000 to 2010.

3
Figure 1: Enrolment Trends in Basic Education Sub-sector (2000 to 2010)
Source: Zambian EMIS /Statistical Bulletin (Author’s Graphing)
The numbers of male and female students have increased similarly and rapidly from 942, 072
and 864, 682 to 1, 764, 000 and 1, 745, 000 respectively between 2000 and 2010. It is also
clear that the Government ensured that both male and female pupils were given equal
opportunity to basic education.
1.2 Learning Achievements at Primary level in Zambia
Primary education consists of the seven years of lower and middle basic education. Pupils
complete their primary education by taking a Primary School Leaving Certificate
Examination (PSLCE). The results of the examinations are used to select pupils for the upper
basic education, that is Grade 8 and 9.
In line with the enrolment growth, the number of examination candidates at grades 7 and 9
grew very rapidly. However, despite the increase in the number of pupils completing primary
and upper basic education the average test scores and examination results have not much
improved. The poor performance in the sub-sector has been demonstrated by the National
Public Examinations (at Grade 7), the National Assessment Survey (conducted for Grade 5
pupils every 2 years) as well as the regional SACMEQ studies.
In recent years, the pass rates for public examinations at Grade 7 increased from 50% to more
than 80%. This trend is mainly a reflection of improved access to Grade 8, rather than an

4
expression of better results. For example, the examination results (expressed in %) in English
and Mathematics maintained a low national mean score of around 30% from 2001 to 2009
(IOB Evaluation Report).
Every 2-years, a National Assessment Survey has been conducted at Grade 5 level since 1999.
In all the five times that the assessment has been conducted, the national mean scores have
always been relatively poor and stable (less than 35% in reading and just close to 40% in
mathematics). Though the Ministry maintains that the relative stagnated quality in itself
should be perceived to be a laudable achievement for the Ministry of Education if contrasted
with the exponential increase in enrolments at basic education level in the recent times, there
is no doubt that more needs to be done in the area of learning achievements in Zambia.
The low and stable trend in performance at primary level in Zambia has been consistent even
in sub-region standardised assessments conducted by the Southern and Eastern Africa
Consortium for Monitoring Educational Quality (SACMEQ) at upper primary level. While in
a number of countries the reading and mathematics pupil results improved between 2000 and
2007, in Zambia the pupil performance scores remained low, below the SACMEQ overall
mean fixed at 500 with a standard deviation of 100: The average reading score of pupils
slightly went down from 440 to 434 while that of mathematics maintained the same figure of
435 in both years.
In summary, the relatively low learning achievement in the primary sector is still a challenge
in the Zambian education sector and the problem has been compounded by recent rapid
increases in enrolment in the education system that translates into bigger class size.
1.3 Rationale of the Study
Access to basic education has indeed improved in Zambia in the past decade but there is still a
widespread problem with school quality, specifically learning achievement. Considering the
above scenario, it is clear that Zambia may find it hard to achieve EFA goal number 6 in 2015
which states that:
“Improving all aspects of the quality of education and ensuring excellence of all so
that recognized and measurable learning outcomes are achieved by all, especially in
literacy, numeracy and essential life skills” (UNESCO 2000)
5
Overcrowded classrooms, poor infrastructure, a lack of teaching and learning materials,
teacher shortages, inadequate pupil-teacher contact time and language of instructions are
some of the problems that have been associated with low learning achievements. However,
what is interesting to note is that despite all these problems, it has been noted that some
schools have been performing better than others. The fact that some schools perform better
than others indicates that such schools maybe more effective in using the resources at their
disposal to improve learning achievement than those that perform otherwise. The question
that arises then is: What characteristics make one school perform better than another?
The rationale of this study therefore is to link the learning achievement with characteristics
surrounding pupil, school, head teacher and teachers so as to identify indicators that have
strong association with learning achievements which could be used by educational planners
and policy makers to improve learning achievements. It also shades some light on more
effective and less effective schools in the face of sustained under performance in the primary
sub-sector. The study is premised on the fact that once effective schools and the
characteristics that have the greatest association with learning achievement have been
identified, planners and policy makers may potentially use them not only to understand the
possible elements and aspects of school environments, schooling and school functioning that
have a bearing on school effectiveness, but they would also use them to improve learning
achievements in schools.
1.4 The Research Problematic
It is clear from the Public Examinations, National Assessment Surveys as well as SACMEQ
Research Projects that Zambia indeed has a critical challenge with respect to low learning
achievement of pupils in the primary sub-sector which needs an urgent solution. One of the
critical and challenging findings for planners from SACMEQ III country report in Zambia
(Bupe and Kaba, 2011) is the stability in low learning achievement of pupils attending upper
primary schools since 1995.As an example, the overall pupil performance of Grade 6 pupils in
reading remained at 435 far below the overall SACMEQ average fixed at 500.
This study therefore sought to analyse the pupil learning achievement through a different
perspective, compared to the traditional one of descriptive analysis employed in the
SACMEQ III country report. More precisely, the study isolates pupil, teacher, school heads
and school factors that have the greatest association with learning achievement and uses pupil

6
socio-economic status composite indicator to determine more and less school effective
schools. By comparing pupil, teacher, school heads and school factors that have the greatest
association with school mean scores between more and less effective schools; the study gives
a picture of what makes up an effective school. It is expected that this information could be
used by planners and decision makers to improve school effectiveness and consequently
learning achievements for all pupils at primary level.
1.5 Research Questions
The following are the five research questions for this study:
1. Which indicators have the strongest association with pupil scores?
2. Which indicators are most important for differentiating between more effective and
less effective schools?
3. To what extent do the pupil home background account for performance in schools?
4. To what extent do the school Resources account for performance in schools?
5. What indicators (changeable by government policy) should planners focus on most
when planning for school effectiveness?
1.6 The main objectives of the Study
In order to adequately answer the above research questions, below are the objectives of this
study:
1. To find out indicators that have the strongest association with pupil scores
2. To find out indicators that most differentiating between more effective and less
effective schools
3. Find out to what extent does the pupil home background account for the performance
in schools
4. To find out to what extent do the school Resources account for the performance in
schools
5. To determine which indicators planners should focus on most when planning for
school effectiveness
1.7 Scope and Limitations of the study
The scope of the study is limited to the analysis of 2007 SACMEQ III data for pupil
performance in English and mathematics for all the nine provinces of Zambia. The limitations
of the study are twofold: (i) The study does not measure the precise magnitude of the effect of

7
any given variable or indicator on pupil or school average score (ii) The study does not
estimate errors in the statistical analyses performed.
1.8 The Methodology Employed in the Study
The correlation and regression analysis were used in this study to identify key indicators as
well as assess the relative effectiveness of primary schools in Zambia respectively.
The conceptual framework
The definition of a more effective and less effective school employed in this study is based on
the interpretation used by Poslethwaite and Ross in “Effective schools in reading. Implications
for educational planners. An exploratory study” (1992) defined as follows: A ‘more effective
school’ was taken to be a school in which the average student score was higher than would be
expected or predicted given the home circumstances of students attending that school.
Similarly, for a ‘less effective school’ the mean student score would be lower than would be
expected or predicted”. It is important to note that interpretation of school mean scores is to
be done after taking into consideration the socio-economic or home background of the pupils
that that attended that particular school. Note that throughout this study, the term ‘pupil’ will
refer to the grade six pupils that participated in the SACMEQ III study in Zambia.
Outcome variables
The outcome variables of interest in this study are pupil achievement test scores in reading
and mathematics from SACMEQ III research project.
Input variables
In the SACMEQ research projects, it was the responsibility of the National Research
Coordinators (NRCs) to identify common indicators that were perceived to be important for
explaining differences among pupils, schools, teachers, principals and education systems.
Therefore, this study analyses data (relevant to this study) collected from SACMEQ III
background questionnaires: Pupil Questionnaire, Teacher Questionnaire, Head Teacher
Questionnaire and School Information Booklet. The SACMEQ III data archive contains the
responses from around 446 relevant variables from where a total of 380 derived variables
(singleton and composite indicators) have been re-derived.

8
Steps in the analysis
Step 1: Correlation was used to come up with a final list of indicators having significant
association with school mean scores in both reading and mathematics. Two criterions were
employed: Firstly, only the variables that met the coefficient correlation cut-off point of +0.05
in both reading and mathematics and secondly, only those indicators common to both reading
and mathematics were to be selected for further study. The general understanding is that if
pupils are able to read and write as well as solve basic mathematical problems, chances are
that they would be able to understand the other subjects. Note that the total number of
derived variables in the SACMEQ database is 380 and out of this, only representative and
relevant variables to the study were subjected to correlation analysis. After examination, a
total of 151 variables were deemed relevant to the study and these are the ones that were
correlated with school mean scores in both reading and mathematics. Out of the 151 derived
variables analysed, only 28 meet the criterion set by this study (Appendix A). The 28
indicators were then categorised into 7 groups (Details in chapter five).
Step 2: This step examined how much primary schools in Zambia “added” something to the
performance of their students (school effectiveness) by regressing pupil achievement test
performance of schools on pupil socio-economic status – that schools cannot control: the
schools placed above the regression line were interpreted as exhibiting reading or
mathematics scores that were higher than could be expected of them, that is, after taking into
account the home background of their intakes. In the same way, schools below the regression
line were interpreted as having lower results than what would be expected of them.
The more and less effective schools were identified and ranked by their “distance” between
their actual achievement test score and the score predicted by the regression line (residuals).
Step 3: For each subject area, the first 20 schools were deemed ‘more effective’ and the last
20 schools as ‘less effective’. These schools were then subjected to further analysis with the
shortlisted indicators identified in Step1 in order to provide a detailed portrait of most
effective schools.
1.9 Structure of the memoir
The memoir is organized into seven chapters. Chapter 1 introduces the rationale, the research
problematic and methodology of the study and is followed by Chapter 2 which discusses “the
9
setting of the study” by providing contextual information on Zambia, its location and
geography, population and demographics, political and socio-cultural, economy and finance
as well as description of the education system. Chapter 3, “Literature Review on school
effectiveness” defines school effectiveness and its different perspectives, measurement of
effectiveness and reviews findings from research studies conducted in the area. Chapter 4
briefly describes SACMEQ III study: mission, projects, methodological procedures
(collection, entry and data management), questionnaires and outcome indicators with the pupil
test achievement in reading and mathematics.
The selection of relevant input indicators for the study is explained in Chapter 5. The analysis
and summary of findings on the “more effective” and “less effective” primary schools in
Zambia as well as policy suggestions for effective schools are presented in chapter 6. Chapter
7 presents the summary and conclusions of the study.
10
CHAPTER TWO: THE SETTING OF THE STUDY
This chapter attempts to give an overview of Zambia’s location, population and
demographics, social well-being, economic and financial status and political setting. It also
contextualises the education system within the country by describing the education structure
and presents trends in various key education indicators.
2.1 Location and Geography
Zambia is a Republic in south central Africa, bounded on the north by the Democratic
Republic of the Congo (DRC, formerly Zaire) and Tanzania; on the east by Malawi; on the
southeast by Mozambique; on the south by Zimbabwe, Botswana, and the Caprivi Strip of
Namibia; and on the west by Angola. The area is 752,614 sq km (290,586 sq mi). Zambia’s
capital and largest city is Lusaka. Zambia was divided into nine (9) Provinces until 2011
when a 10th Provinces was added by splitting one of the largest provinces (Northern) into two.
The names of the Province are Lusaka, Luapula, Northwestern, Western, Central, Eastern,
Copperbelt, Southern, Northern and the latest one called Muchinga Province. Each of the
Provinces is divided into Districts and there are currently a total of 78 Districts.
2.2 Population and Demographics
The population of Zambia has been increasing from 7,759,161 in 1990; 9,885,591 in 2000 and
13,046,508 persons in 2010 with 39% of the population living in urban and 61% living in
rural areas. The average annual growth rate for the period between 2000 and 2010 is 2.8
percent. Of the 13,046,508 people currently living in Zambia, 49 percent are males and 51
percent are females. The average population density is 17.3 persons per square kilometre
(2010 Population Census Report).
2.3 Political and Socio-Cultural
Zambia became a republic immediately upon attaining independence in October 1964. In
December 1973, Zambia abrogated the original 1964 constitution by having a new one on
August 25, 1973 followed by elections which took place in December 1973 and elected Dr.
Kenneth Kaunda, Zambia’s first president. The 1973 constitution provided for a strong
president and a National Assembly. National policy was formulated by the Central Committee
of the United National Independent Party (UNIP), the sole legal party in Zambia then. Under
11
the one-party system, President Kaunda was able to win every election between 1973 and
1991 – some, with as much as 95 percent of the vote (New Economia, 2010).
Zambia then enacted a new constitution in August 1991, which enlarged the National
Assembly, established an electoral commission and allowed for more than one presidential
candidate who no longer had to be a member of UNIP. The first multi-party elections in
November 1991 resulted in the victory for the newly-formed Movement for Multi-Party
Democracy (MMD) and the election of President Frederick T. Chiluba. The present
constitution dates from June 1996.
Zambia is generally considered one of the more politically stable countries in the region.
Under British rule, Zambia’s state lines were drawn up rather arbitrarily. For this reason the
country now accommodates a large number of different ethnic groups, none of which hold a
majority. This diversity is frequently cited as an important reason for stability. In 1990,
Zambia officially became a multiparty democracy. Movement for Multiparty Democracy
(MMD) has been in power ever since 1991, until the recent September, 20th 2011 elections
which saw the Patriotic Front leader, Mr. Michael Chilufya Sata become the president of
Zambia.
Socio-economically, around 65%, of Zambians live in poverty. Zambia however experienced
a decline in HIV prevalence from 16% in 2003 to 14.3% in 2007 (Zambia Health
Demographic Survey Report, 2007). Zambia’s labour force remains unskilled due to the fact
that most people leave school at an early age. Increased social investment is needed to
enhance access to education and health.
2.4 Macro-economic and Finance
Zambia recently qualified as a new-lower middle income country with per capita GNIs of
between $1,006 and $3,975 per year (Africanews 2011). Before this, Zambia was classified as
low-income country, with 64% of the population living on less than one dollar a day. Despite
ten years of steady GDP growth, averaging 4.8% GDP per capita remains below the Sub-
Sahara African average (Anouk Ruhaak 2010). Zambia’s income stems from three major
sources: agriculture, mining and services. The first, agriculture, employs 75% of the
population, but only accounts for 20% of GDP. The services sector, on the other hand,
comprises 50% of GDP and is especially relevant in urban areas. Copper and cobalt mining
12
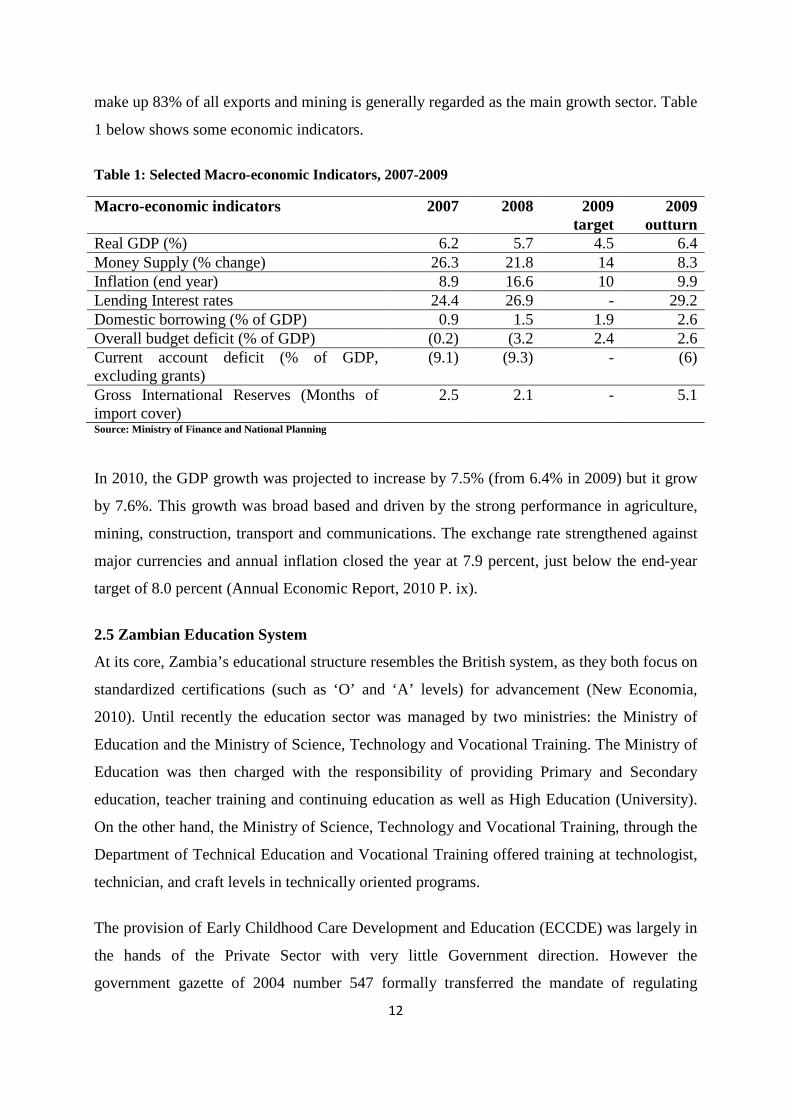
make up 83% of all exports and mining is generally regarded as the main growth sector. Table
1 below shows some economic indicators.
Table 1: Selected Macro-economic Indicators, 2007-2009
Macro-economic indicators 2007 2008 2009 target
2009 outturn
Real GDP (%) 6.2 5.7 4.5 6.4 Money Supply (% change) 26.3 21.8 14 8.3 Inflation (end year) 8.9 16.6 10 9.9 Lending Interest rates 24.4 26.9 - 29.2 Domestic borrowing (% of GDP) 0.9 1.5 1.9 2.6 Overall budget deficit (% of GDP) (0.2) (3.2 2.4 2.6 Current account deficit (% of GDP, excluding grants)
(9.1) (9.3) - (6)
Gross International Reserves (Months of import cover)
2.5 2.1 - 5.1
Source: Ministry of Finance and National Planning
In 2010, the GDP growth was projected to increase by 7.5% (from 6.4% in 2009) but it grow
by 7.6%. This growth was broad based and driven by the strong performance in agriculture,
mining, construction, transport and communications. The exchange rate strengthened against
major currencies and annual inflation closed the year at 7.9 percent, just below the end-year
target of 8.0 percent (Annual Economic Report, 2010 P. ix).
2.5 Zambian Education System
At its core, Zambia’s educational structure resembles the British system, as they both focus on
standardized certifications (such as ‘O’ and ‘A’ levels) for advancement (New Economia,
2010). Until recently the education sector was managed by two ministries: the Ministry of
Education and the Ministry of Science, Technology and Vocational Training. The Ministry of
Education was then charged with the responsibility of providing Primary and Secondary
education, teacher training and continuing education as well as High Education (University).
On the other hand, the Ministry of Science, Technology and Vocational Training, through the
Department of Technical Education and Vocational Training offered training at technologist,
technician, and craft levels in technically oriented programs.
The provision of Early Childhood Care Development and Education (ECCDE) was largely in
the hands of the Private Sector with very little Government direction. However the
government gazette of 2004 number 547 formally transferred the mandate of regulating
13
ECCDE provision to the Ministry of Education from the Ministry of Local Government and
Housing. Since then the government has formulated a policy framework which is waiting for
Cabinet approval as of June 2010 (National Implementation Framework III 2010). The fact
that the Pre-primary sub-sector has been left in the hands of the private sector for that long has
made it inaccessible to most Zambians and only those who can afford to pay for private
education at one of the few facilities available in the country have access. In 2010, only
15.8% (mostly in urban areas) of pupils starting their first grade had pre-primary experience
and the Government has projected to increase this figure to 30% by 2015 (NIF III 2010 P.3).
Following the change of Government on 20th September, 2011 the new Government has
combined the Ministry of Education and Ministry of Science, Technology and Vocational
Training and the Ministry is now known as Ministry of Education Science, Technology and
Vocational Training. Currently, the education system is under-going restructuring exercise
aimed at aligning the two Ministries into one.
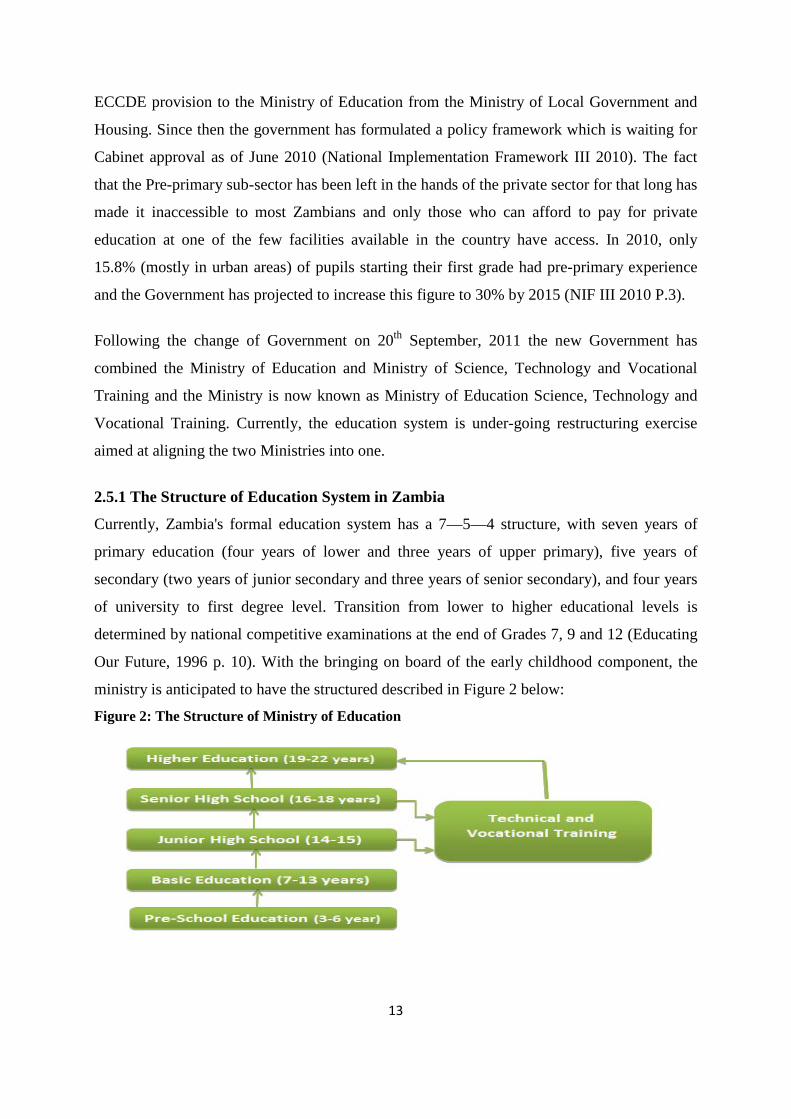
2.5.1 The Structure of Education System in Zambia
Currently, Zambia's formal education system has a 7—5—4 structure, with seven years of
primary education (four years of lower and three years of upper primary), five years of
secondary (two years of junior secondary and three years of senior secondary), and four years
of university to first degree level. Transition from lower to higher educational levels is
determined by national competitive examinations at the end of Grades 7, 9 and 12 (Educating
Our Future, 1996 p. 10). With the bringing on board of the early childhood component, the
ministry is anticipated to have the structured described in Figure 2 below:
Figure 2: The Structure of Ministry of Education

14
The official age for starting pre-school as stipulated in the draft Early Childhood policy is 3,
meaning that children will have to spend 3-years at pre-primary level before entering primary
school at an official age of 7.
2.6 Trends in Key Education Indicators in Zambia
This section briefly discusses the trends in key education indicators in Zambia. The indicators
discussed are related to quality, equity, internal efficiency, external efficiency, access,
management and cost and financing.
2.6.1 Equity
Indicators of equity measure how equitable the education services are being distributed
among the population and include gender, underprivileged communities, ethnic grouping as
well as children with special education needs. In Zambia, basic education has become more
accessible to underprivileged families living in rural areas because most of the school
infrastructure development in the past years had targeted the rural communities in order to
achieve the EFA goal on universal access to primary education. The increase in enrolment
also took into account the gender. Figure 3 below shows trends in gender parity Index from
2000 to 2010.
Figure 3: Gender Parity Index in Basic Education (2000-2010)
Source: Ministry of Education 2010 Statistical Bulletin (Author’ graphing)
As can be seen from the graph, the GPI has been increasing from 0.93 in 2000 to 0.98 in
2010. This means that the gap between boys and girls attending basic education is slowly
getting narrower. Currently, there are slightly more boys accessing basic education than girls.
15
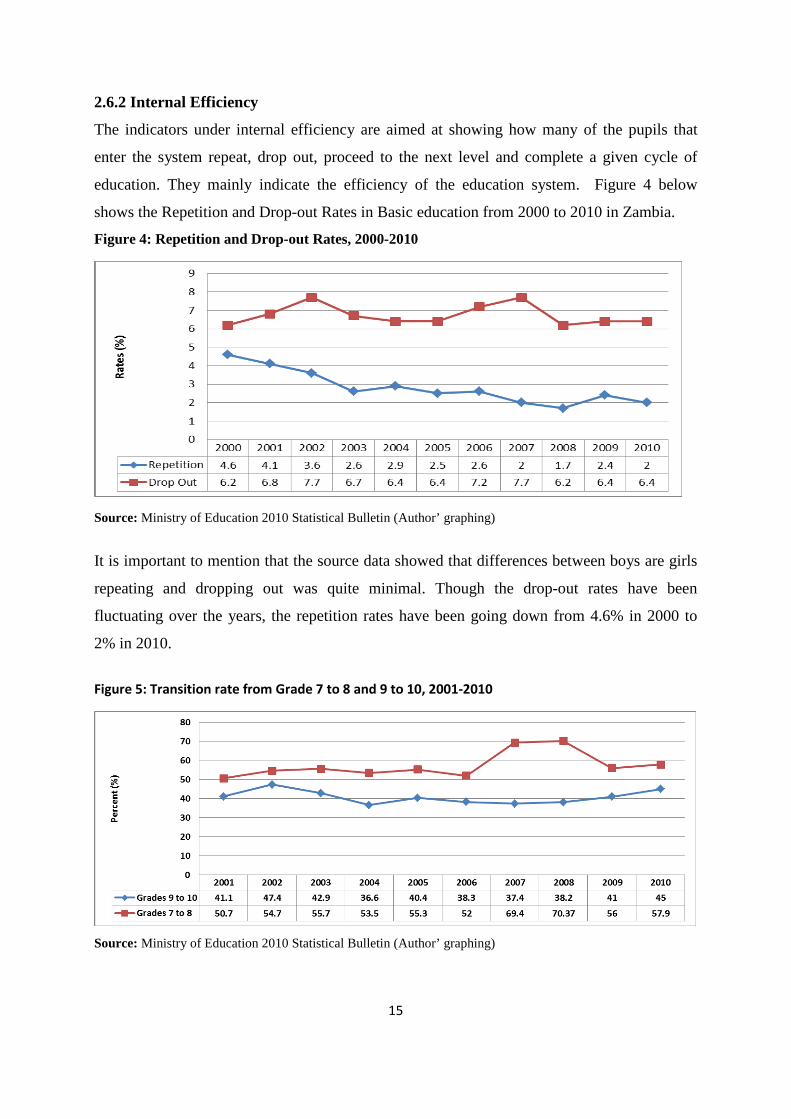
2.6.2 Internal Efficiency
The indicators under internal efficiency are aimed at showing how many of the pupils that
enter the system repeat, drop out, proceed to the next level and complete a given cycle of
education. They mainly indicate the efficiency of the education system. Figure 4 below
shows the Repetition and Drop-out Rates in Basic education from 2000 to 2010 in Zambia.
Figure 4: Repetition and Drop-out Rates, 2000-2010
Source: Ministry of Education 2010 Statistical Bulletin (Author’ graphing)
It is important to mention that the source data showed that differences between boys are girls
repeating and dropping out was quite minimal. Though the drop-out rates have been
fluctuating over the years, the repetition rates have been going down from 4.6% in 2000 to
2% in 2010.
Figure 5: Transition rate from Grade 7 to 8 and 9 to 10, 2001-2010
Source: Ministry of Education 2010 Statistical Bulletin (Author’ graphing)

16
Figure 5 above shows the transition rates from 2000 to 2010. The source data showed that
there were no significant differences between the girls and boys transitioning from grades 7 to
8 and grades 9 to 10 respectively. Very sharp increases were experienced in 2007 and 2008
and then a decline in transition rates in 2009. The lower rates of transition from grades 9 to 10
can be explained by limited places in post-secondary sub-sector.
2.6.3 Access
Access to basic education is one of the major aspects on which education in any given
country is evaluated and refers to the extent to which education is being accessed by the
general eligible population at a given education entrance level. Figure 6 below shows Net
Enrolment Ratios (NER) in basic education from 2000 to 2010.
Figure 6: Net Enrolment Rates in Basic Education from 2000 to 2010
Source: Ministry of Education 2010 Statistical Bulletin (Author’ graphing)
Note: NER cannot exceed 100%, so, in years where the figure exceeds 100%, the most
logical explanation is that the population figures that were being used as a base were not in
line with pupil population growth.
2.6.4 Quality
In order to track quality of education, there is need to ensure that the learning achievements of
learners are periodically assessed. Quality in education is a multi-dimension concept which
includes such things as knowledge, skills and altitudes acquired by pupils, learning
environment, the content of the curriculum and its relevance as well as the teaching staff and
process of teaching. This section will only discuss quality with respect to learning outcomes.
17
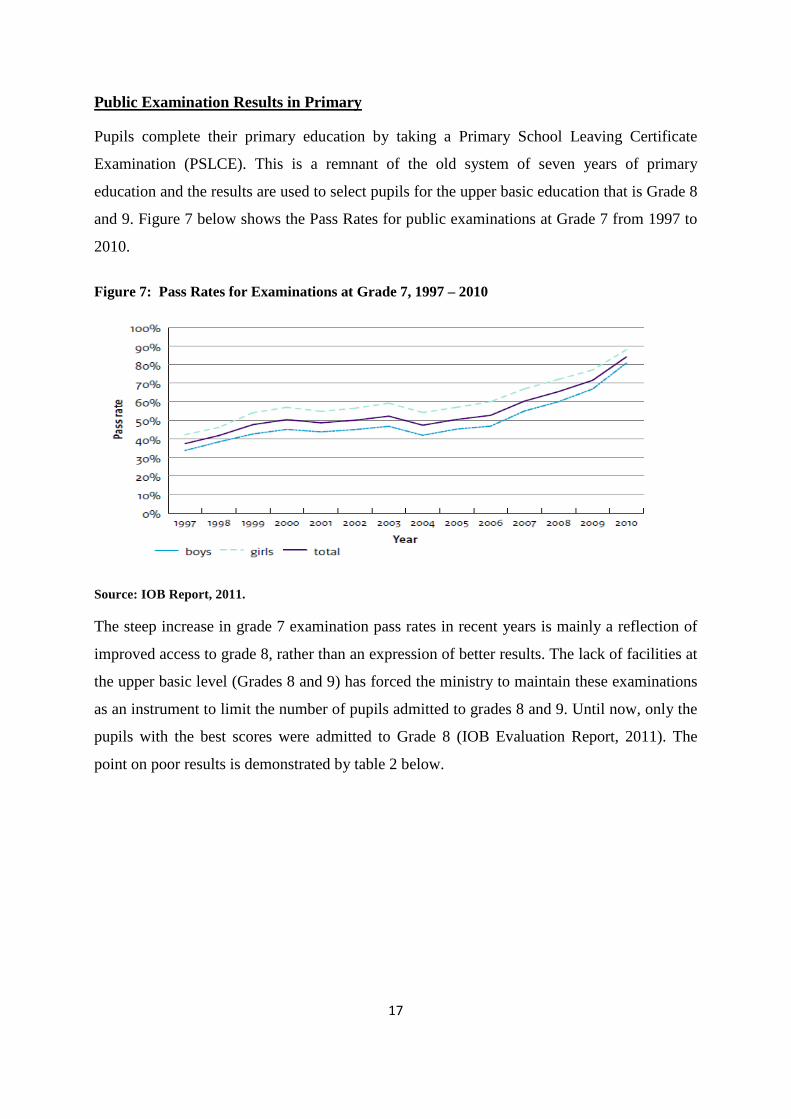
Public Examination Results in Primary
Pupils complete their primary education by taking a Primary School Leaving Certificate
Examination (PSLCE). This is a remnant of the old system of seven years of primary
education and the results are used to select pupils for the upper basic education that is Grade 8
and 9. Figure 7 below shows the Pass Rates for public examinations at Grade 7 from 1997 to
2010.
Figure 7: Pass Rates for Examinations at Grade 7, 1997 – 2010
Source: IOB Report, 2011.
The steep increase in grade 7 examination pass rates in recent years is mainly a reflection of
improved access to grade 8, rather than an expression of better results. The lack of facilities at
the upper basic level (Grades 8 and 9) has forced the ministry to maintain these examinations
as an instrument to limit the number of pupils admitted to grades 8 and 9. Until now, only the
pupils with the best scores were admitted to Grade 8 (IOB Evaluation Report, 2011). The
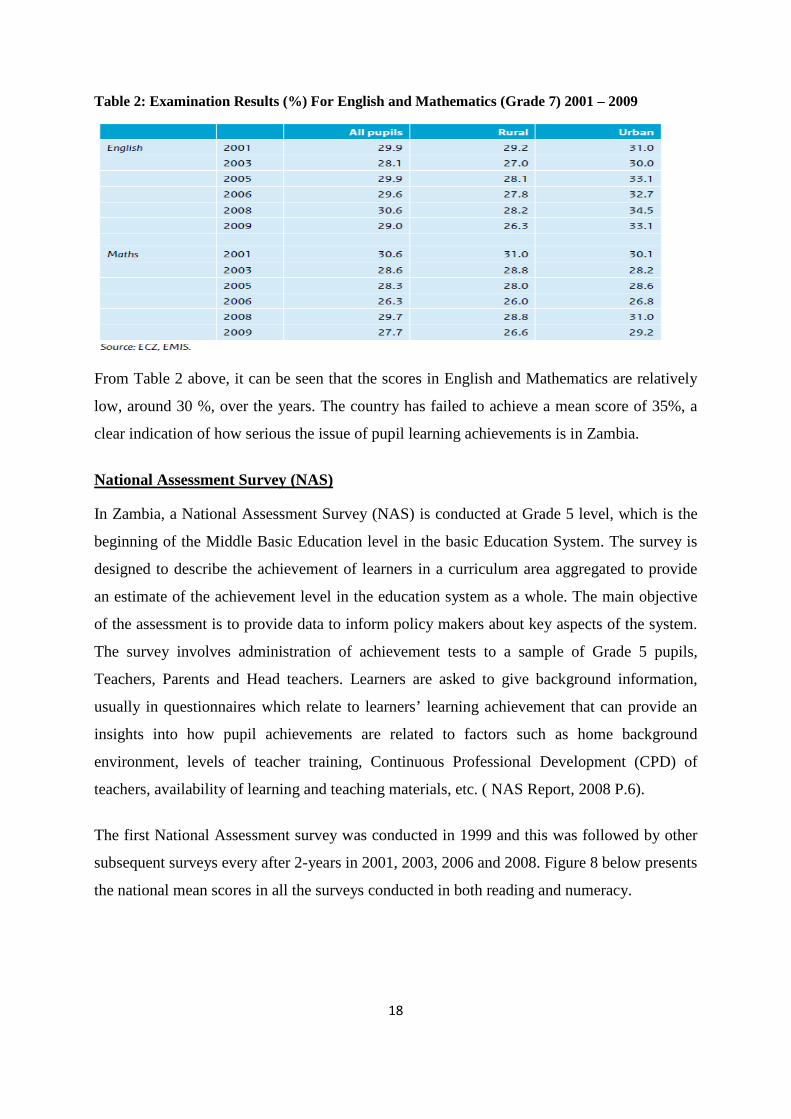
point on poor results is demonstrated by table 2 below.
18
Table 2: Examination Results (%) For English and Mathematics (Grade 7) 2001 – 2009
From Table 2 above, it can be seen that the scores in English and Mathematics are relatively
low, around 30 %, over the years. The country has failed to achieve a mean score of 35%, a
clear indication of how serious the issue of pupil learning achievements is in Zambia.
National Assessment Survey (NAS)
In Zambia, a National Assessment Survey (NAS) is conducted at Grade 5 level, which is the
beginning of the Middle Basic Education level in the basic Education System. The survey is
designed to describe the achievement of learners in a curriculum area aggregated to provide
an estimate of the achievement level in the education system as a whole. The main objective
of the assessment is to provide data to inform policy makers about key aspects of the system.
The survey involves administration of achievement tests to a sample of Grade 5 pupils,
Teachers, Parents and Head teachers. Learners are asked to give background information,
usually in questionnaires which relate to learners’ learning achievement that can provide an
insights into how pupil achievements are related to factors such as home background
environment, levels of teacher training, Continuous Professional Development (CPD) of
teachers, availability of learning and teaching materials, etc. ( NAS Report, 2008 P.6).
The first National Assessment survey was conducted in 1999 and this was followed by other
subsequent surveys every after 2-years in 2001, 2003, 2006 and 2008. Figure 8 below presents
the national mean scores in all the surveys conducted in both reading and numeracy.

19
Figure 8: National Mean Score in Reading and Numeracy in National Assessment
Source: Ministry of Education 2010 Statistical Bulletin (Author’ graphing)
Even though there has been marginal increment in mean scores over years, all surveys have
indicated a national mean score of less than 40% in the two areas of assessment – a clear
indication of how critical the issue of learning achievement in Zambia is.
Regional Comparison
The Zambian Ministry of Education is one of the members of the Southern and Eastern Africa
Consortium for Monitoring Educational Quality (SACMEQ) engaged in monitoring and
evaluating the quality of education in developing countries. The target group for the study in
SACMEQ is Grade 6 pupils in the mainstream primary education systems of participating
countries1. Table 3 below shows the average scores for SACMEQ participating countries –
including Zambia- in reading and mathematics
1 A brief description of the SACMEQ research projects with the main findings is provided in a separate chapter of the study.
20
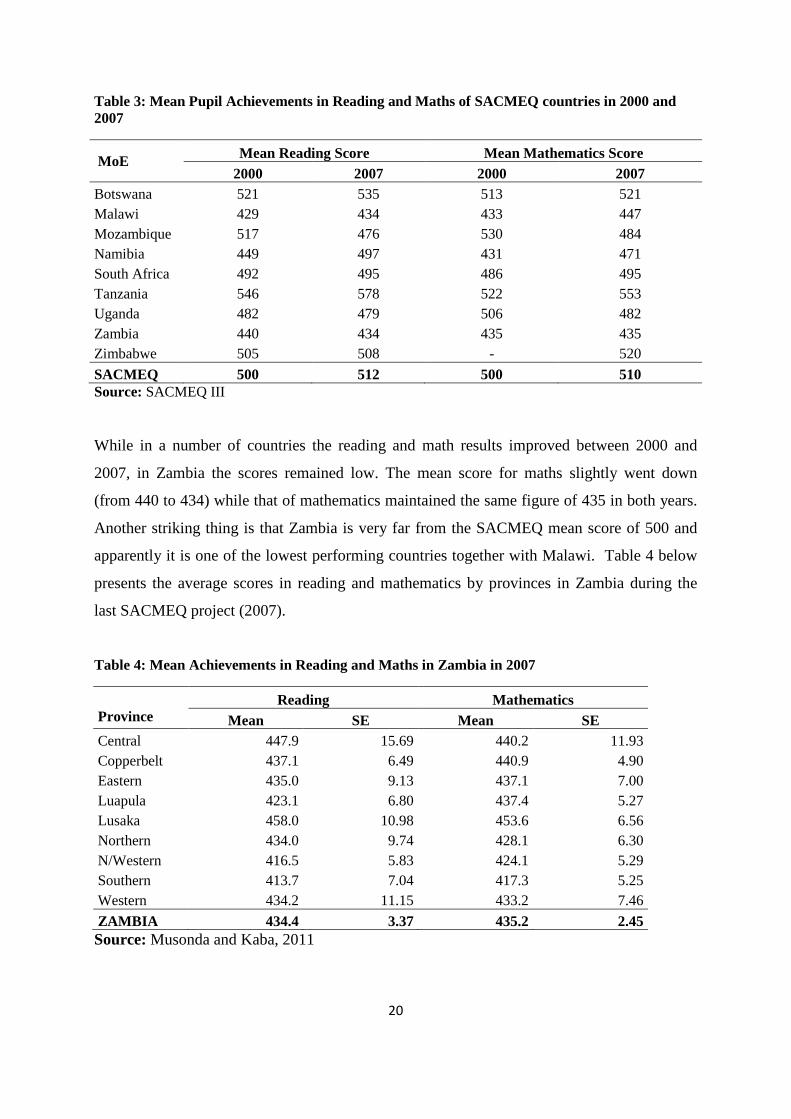
Table 3: Mean Pupil Achievements in Reading and Maths of SACMEQ countries in 2000 and 2007
MoE Mean Reading Score Mean Mathematics Score 2000 2007 2000 2007
Botswana 521 535 513 521 Malawi 429 434 433 447 Mozambique 517 476 530 484 Namibia 449 497 431 471 South Africa 492 495 486 495 Tanzania 546 578 522 553 Uganda 482 479 506 482 Zambia 440 434 435 435 Zimbabwe 505 508 - 520 SACMEQ 500 512 500 510 Source: SACMEQ III
While in a number of countries the reading and math results improved between 2000 and
2007, in Zambia the scores remained low. The mean score for maths slightly went down
(from 440 to 434) while that of mathematics maintained the same figure of 435 in both years.
Another striking thing is that Zambia is very far from the SACMEQ mean score of 500 and
apparently it is one of the lowest performing countries together with Malawi. Table 4 below
presents the average scores in reading and mathematics by provinces in Zambia during the
last SACMEQ project (2007).
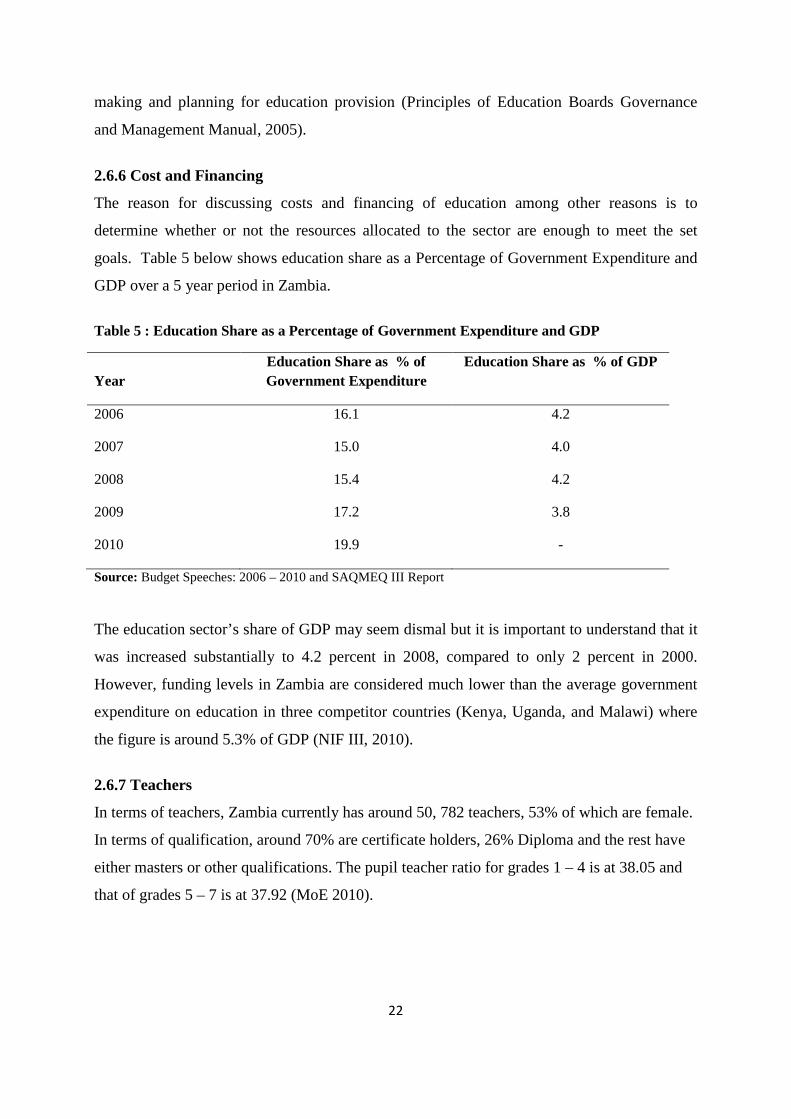
Table 4: Mean Achievements in Reading and Maths in Zambia in 2007
Province
Reading Mathematics Mean SE Mean SE
Central 447.9 15.69 440.2 11.93 Copperbelt 437.1 6.49 440.9 4.90 Eastern 435.0 9.13 437.1 7.00 Luapula 423.1 6.80 437.4 5.27 Lusaka 458.0 10.98 453.6 6.56 Northern 434.0 9.74 428.1 6.30 N/Western 416.5 5.83 424.1 5.29 Southern 413.7 7.04 417.3 5.25 Western 434.2 11.15 433.2 7.46 ZAMBIA 434.4 3.37 435.2 2.45 Source: Musonda and Kaba, 2011

21
A general comment can be made on the relatively low pupil performance on both subjects
across the provinces. The highest performing province is Lusaka Province with 458 and 454
in reading and mathematics respectively while the lowest scores were recorded in Southern
Province with 414 and 417. There is a relative difference of around 40 point scores (half of
one standard deviation) between these two “extreme” provinces.
A recently published evaluation report entitled ‘Unfinished business: Making a difference in
basic education’ conducted by IOB and Ministry of Education officials in Zambian comments
on the results:
‘’While the survey results were disappointing, it is important to acknowledge the
limitations of such international comparisons….one cannot arrive at conclusions
without taking into account changes in enrolment in the countries involved. One has
to bear in mind that in Zambia, the major difference between 2000 and 2007 was the
large increase in the number of children enrolled in schools in poor and remote
areas…Taking into account this effect, the decline in the average results for reading
in Zambia is modest. The Tanzanian results appear to be much better than those in
Zambia. However, an important explanation is that in Tanzania the reading tests
were conducted in Kiswahili, the national language, while in Zambia they were
conducted in English, a language that few Zambians have mastered’’ ( P.108)
Indeed, rapid increase in enrolment in an education system translates into bigger class size. It
is also generally accepted that the larger the class size, the lower the student achievements.
Therefore, reducing class size to increase student achievement is an approach that has been
tried, debated, and analyzed for several decades. The premise seems logical: with fewer
students to teach, teachers can attend to each one of them better. However research has also
shown that teachers can still create vibrant environments for learning even without the
potential for one-on-one interaction (Bartlett 2010)
2.6.5 Management
The education delivery in Zambia has been decentralised with the establishment of Education
Boards at District, High School and Colleges of education. The basic schools are managed by
the District boards and the Parent Teachers Association (PTAs). This is in order to allow
lower levels of the management structures and the communities participate in decision-
22
making and planning for education provision (Principles of Education Boards Governance
and Management Manual, 2005).
2.6.6 Cost and Financing
The reason for discussing costs and financing of education among other reasons is to
determine whether or not the resources allocated to the sector are enough to meet the set
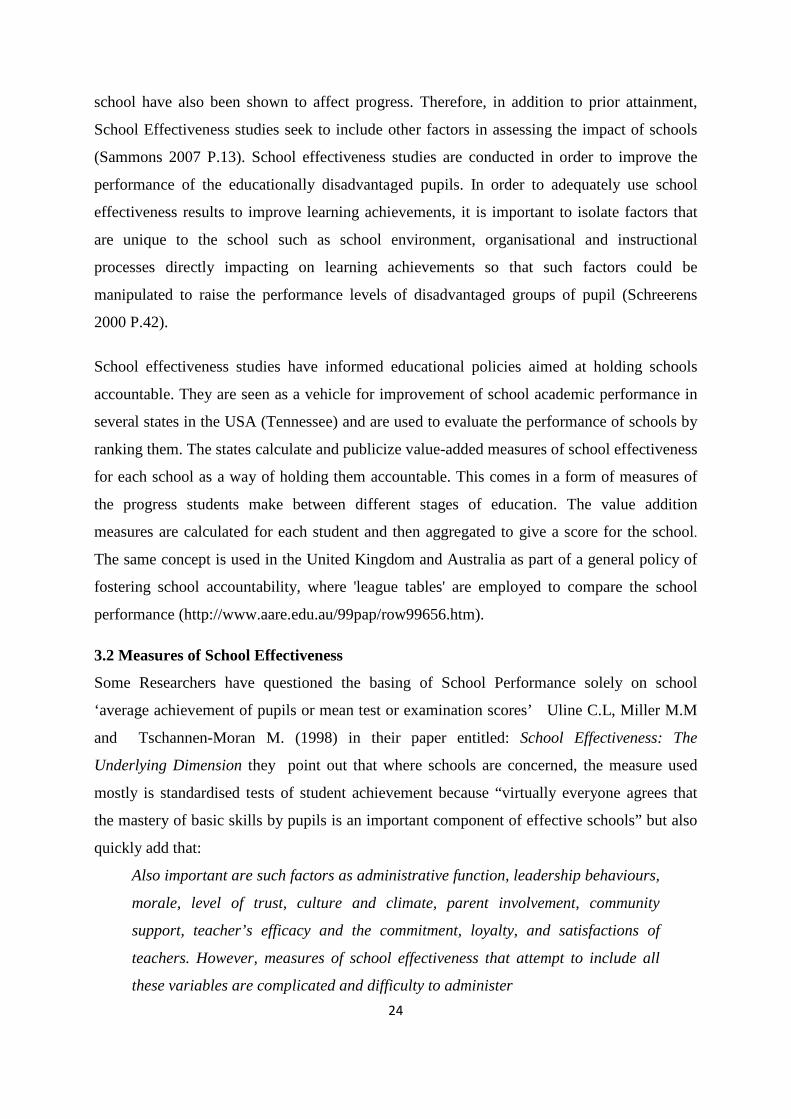
goals. Table 5 below shows education share as a Percentage of Government Expenditure and
GDP over a 5 year period in Zambia.
Table 5 : Education Share as a Percentage of Government Expenditure and GDP
Year Education Share as % of Government Expenditure
Education Share as % of GDP
2006 16.1 4.2
2007 15.0 4.0
2008 15.4 4.2
2009 17.2 3.8
2010 19.9 -
Source: Budget Speeches: 2006 – 2010 and SAQMEQ III Report
The education sector’s share of GDP may seem dismal but it is important to understand that it
was increased substantially to 4.2 percent in 2008, compared to only 2 percent in 2000.
However, funding levels in Zambia are considered much lower than the average government
expenditure on education in three competitor countries (Kenya, Uganda, and Malawi) where
the figure is around 5.3% of GDP (NIF III, 2010).
2.6.7 Teachers
In terms of teachers, Zambia currently has around 50, 782 teachers, 53% of which are female.
In terms of qualification, around 70% are certificate holders, 26% Diploma and the rest have
either masters or other qualifications. The pupil teacher ratio for grades 1 – 4 is at 38.05 and
that of grades 5 – 7 is at 37.92 (MoE 2010).
23
CHAPTER THREE: LITERATURE REVIEW ON SCHOOL EFFECTIVENESS
This chapter attempts to provide a conceptual basis for defining school effectiveness. It will
also discuss the measurement of school effectiveness and shade some light on some studies
conducted in the area. It is important to note that a comprehensive and detailed review of the
concept of school effectiveness exceeds the scope of this study and that the purpose of this
chapter is to provide a framework against which this study is being conducted.
3.1 Defining School Effectiveness
Now that the shift is moving from increasing enrolment and input-based approach (teachers,
classrooms etc.) to the quality of education offered, educational planners have become
interested in school effectiveness (Schreerens 2000 P. 9). The question then is what is School
Effectiveness? Different schools of thought have defined school effectiveness from their own
perspective and notably among these are economists and organisational science experts
(Schreerens 2000 P 18). Yet, despite differences in perspectives, there is a consensus that
school effectiveness is a comparative rather than an absolute study and that it examines
differences in the impact of one institution (school) in comparison with another, taking into
account the intake of the pupils.
Sammons (2007 P.13) defines an effective school as “one in which students progress is higher
than might be expected considering its intake”. This definition is somewhat in resonance with
the conceptualisation of school effectiveness as discussed by T.N. Postlethwaite and K.N.
Ross (1992). They write:
“There are some schools that serve poor communities which perform well above a
level that might be expected given their circumstances, and there are some schools
that serve affluent communities which perform well below a level that one would
expect given their circumstances. The above expectation schools are often referred
to as ‘more effective’ schools and the below expectations schools as less ‘less
effective’ schools’’
From the definitions above, it is clear that an effective school thus adds extra value to its
students' outcomes in comparison with other schools serving similar intakes. In order to assess
the added value by a school, measures of individual student’s prior attainment are needed to
provide a baseline against which subsequent progress can be assessed. Other factors such as
gender, socio-economic status, mobility and fluency in the language of instruction used at
24
school have also been shown to affect progress. Therefore, in addition to prior attainment,
School Effectiveness studies seek to include other factors in assessing the impact of schools
(Sammons 2007 P.13). School effectiveness studies are conducted in order to improve the
performance of the educationally disadvantaged pupils. In order to adequately use school
effectiveness results to improve learning achievements, it is important to isolate factors that
are unique to the school such as school environment, organisational and instructional
processes directly impacting on learning achievements so that such factors could be
manipulated to raise the performance levels of disadvantaged groups of pupil (Schreerens
2000 P.42).
School effectiveness studies have informed educational policies aimed at holding schools
accountable. They are seen as a vehicle for improvement of school academic performance in
several states in the USA (Tennessee) and are used to evaluate the performance of schools by
ranking them. The states calculate and publicize value-added measures of school effectiveness
for each school as a way of holding them accountable. This comes in a form of measures of
the progress students make between different stages of education. The value addition
measures are calculated for each student and then aggregated to give a score for the school.
The same concept is used in the United Kingdom and Australia as part of a general policy of
fostering school accountability, where 'league tables' are employed to compare the school
performance (http://www.aare.edu.au/99pap/row99656.htm).
3.2 Measures of School Effectiveness
Some Researchers have questioned the basing of School Performance solely on school
‘average achievement of pupils or mean test or examination scores’ Uline C.L, Miller M.M
and Tschannen-Moran M. (1998) in their paper entitled: School Effectiveness: The
Underlying Dimension they point out that where schools are concerned, the measure used
mostly is standardised tests of student achievement because “virtually everyone agrees that
the mastery of basic skills by pupils is an important component of effective schools” but also
quickly add that:
Also important are such factors as administrative function, leadership behaviours,
morale, level of trust, culture and climate, parent involvement, community
support, teacher’s efficacy and the commitment, loyalty, and satisfactions of
teachers. However, measures of school effectiveness that attempt to include all
these variables are complicated and difficulty to administer

25
The authors question the practicality of including such measures by stating that “measures of
school effectiveness that attempt to include all these variables are complicated and difficulty
to administer”
To this effect, E. Anthon Eff (2004 P. 9) in his paper entitled A Flexible –Weights School
Effectiveness Index used five subjects namely language, mathematics, reading, science and
social studies to come up with a school effectiveness index. He acknowledges the fact that
mandatory testing using standardised tests and the consequential use of ‘school average’
scores based on the performance of pupils in key subjects to determine school effectiveness
was appropriate because it helped determine “how well each school carries out its core
mission of educating students”.
He also points out that there is need to have a ‘summary judgement’ which can be used by
evaluators to rank schools to others because officials may wish to identify the worst schools in
order to focus remedial efforts, administrators and researchers may wish to identify the best
schools so that their management practices may be examined and emulated and home buyers
may wish to know the best schools in their area of interest E. Anthon Eff (2004 P. 2). He
went on to argue that there was need for an ‘agreed-upon’ way of combining the various test
scores into a single measure of school effectiveness in order to avoid “confusion over the
actual merits of any school”.
E. Anthon Eff points out three characteristics of a good school effectiveness index as below:
a) Consolidate the array of school performance data into the smallest possible
amount of meaningful information: He says the information contained in the index
should be meaningful to those who refer to it; it should help parents identify the
best schools, and it should give schools a sense of how they stand relative to other
schools. He maintains that all subjects taught at each school should be considered
when coming up with a school effectiveness index in order to avoid what he terms
“encouraging specialization among schools” by ensuring that all schools teach all
subjects well.

26
b) The Index should be fair: He points out that a fair index should be readily
acceptable to both the schools that are being evaluated and to the general public.
He says that when schools accept the legitimacy of the index, they accept the
notion that the index reveals which schools are the best, and they accept the index
as a measure of their own improvement and such an index would most likely guide
school improvement.
c) The Index should measure the right kind of Improvement: E. Anthon Eff) argues
that the improvements giving the evaluated school the greatest increase in its index
should be rationally and by law what they should be pursuing and should be the
kind of improvements that policymakers would most likely wish to see.
There is no doubt in the fact that meeting all the conditions outlined by E. Anthon would
create a school effectiveness index that will be inclusive and measures the right kind of
improvement but surely not fair because the author fails to take into account the intakes of the
schools to be compared.
3.3 The concept of school effectiveness and Fairness
The concept of school effectiveness is based on the fact that schools differ in their
performance. School Effectiveness studies conducted in the US, UK and a growing number of
countries have pointed to the existence of significant school effects in the performance of
schools, while acknowledging the important influence of student background (Sammons
2007). This therefore has led some researchers to ask the question: By how much do schools
differ and why? In order to make a fair comparison among schools, it is important that the
principle of fairness is applied. Natural justice demands that schools are held accountable for
only those things they can influence (for good or ill) and not for all the existing differences
between their intakes. It therefore follows that fairness in the comparison of school A to
school B should be assessed based on the ‘added value’ of a period of schooling attributable
only to having attended school A and not school B (Postlethwaite T.N and K.N Ross, 1992
p.10) and (Scheerens 2000 P. 19).
In school-effectiveness research, assessing added differences between school A and school B
is not enough, the really interesting question to researchers comes after establishing the fact
that there is variation between school performances. The question then becomes: what
27
characteristics caused school A to perform better than school B? The answer to this question
has policy implications in that the ‘traits’ in a better performing school may be replicated in
not so well performing schools with a view to improving school learning achievements.
3.4 School Effectiveness as seen from different Perspectives
Effectiveness may be defined differently depending on the normative criteria related to the
various schools of thought. Organisation theorists assume that “the interpretation chosen
depends on the organisational theory and the specific interests of the group posing the
question of effectiveness” (Schreerens 2000 P.28). According to (Schreerens 2000)
Organisational effectiveness is usually seen from five different approaches: Economic,
Organic System, Human Relations, the Bureaucracy and Political Model. Due to limited space
and time however, only the economic perspective will be discussed as it relates more to this
study.
In the field of economics, the terms such as effectiveness and efficiency are related to the
production process of an organisation which could be a company, factory or a school. From
an economic point of view, the process of production involves three things: input,
transformation and output. Relating this to a school situation, input would include pupils,
financial and material resources, teachers etc. and out output would then be pupil’s attainment
in terms of realisation of learning goals at the end of school. The term ‘transformation’ or
throughput can be understood as “all the instruction methods, curriculum choices and
organisational preconditions that make it possible for pupils to acquire knowledge”
(Scheerens, 2000 P.21). School effectiveness is then the extent to which the desired level of
output (acquisition of know knowledge) is achieved. Cheng (1993) includes the term efficiency in the whole equation of school effectiveness in
which he defines efficiency as the “desired level of output against the lowest possible cost”.
He further amplifies the definition of outputs by grouping them into two categories: Technical
effectiveness and efficiency and Social effectiveness and efficiency. According to Cheng,
Technical effectiveness and efficiency refers to “school outputs limited to those in school and
or just after schooling (e.g. learning behaviour, skills obtained, attitude change etc.)” and
Social effectiveness and efficiency refer to “effects on the society level or the life-long
effects on individuals (e.g. social mobility, earnings, work productivity)”.

28
Economic analysis of efficiency and effectiveness include expressing the value of inputs and
outputs in terms of money. The characterisation of school effectiveness as discussed above
has its own problems and these include how to cost the inputs such as teaching materials and
teacher’s salaries etc. how to define the ‘desired output’ of a school (leaving school certificate
or grades achieved; basic skills acquired or higher cognitive process? Should social and/or
affective returns on education be assessed as well?). (Scheerens, 2000 P.23).
3.5 Research on School Effectiveness
Research traditions in school effectiveness are said to vary depending on what type of outputs
are expected. Nevertheless, the common denominator though is the design, which in most
cases associates outputs or outcomes of schooling with the inputs, processes and context. The
overall design of educational effectiveness studies are based on the basic economic model
where effectiveness-enhancing conditions are on the input side and a school is seen as a
‘black box’ within which processes take place to transform the inputs into output which are
usually student achievements. The inclusion of the environmental or contextual dimension
completes the model by placing the school within its context. Figure 9 below illustrates the
model used in school effectiveness studies.
Figure 9: Figure 10: School Effectiveness Design
Source: Scheerens, 2000 P.35
The importance of school effectiveness studies is to show the impact of relevant input
characteristics on the output, the impact of contextual or environmental conditions (pupil
social-economic background and school location etc.) as well as showing which types of
processes at school level are more effective in achieving the desired results, which are usually
pupil achievements.
Process or throughput
Context
Input Output
School Level Classroom level
29
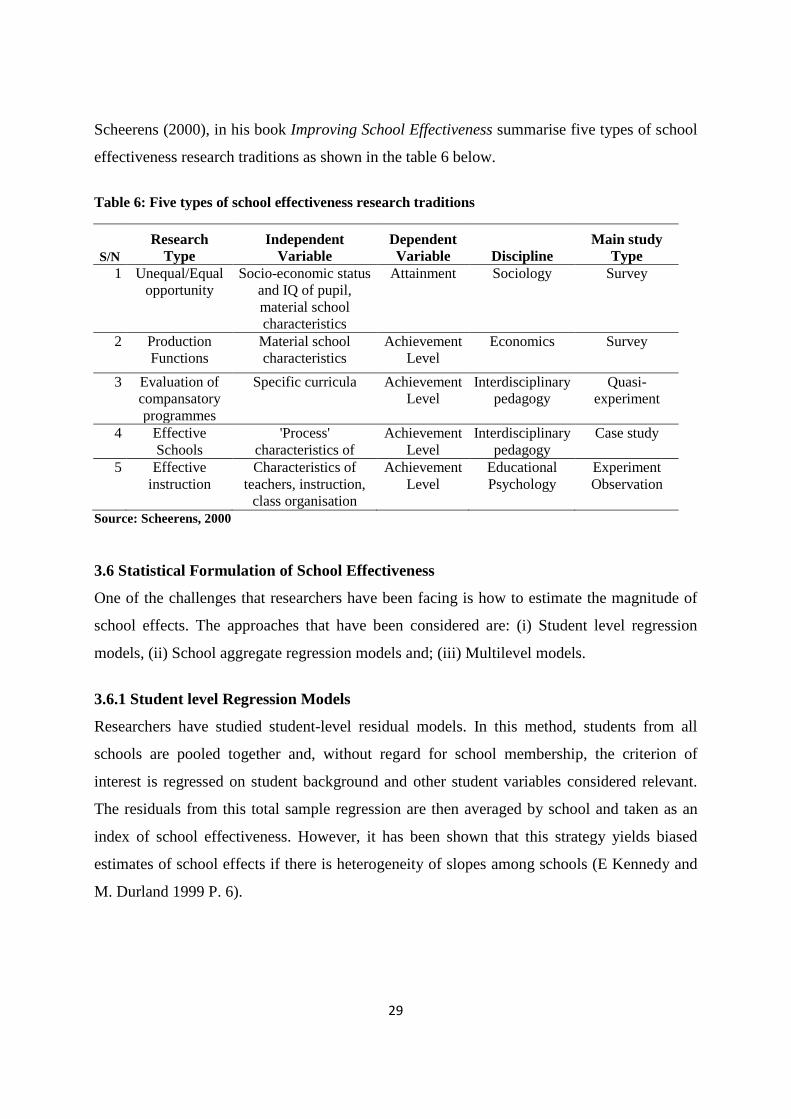
Scheerens (2000), in his book Improving School Effectiveness summarise five types of school
effectiveness research traditions as shown in the table 6 below.
Table 6: Five types of school effectiveness research traditions
S/N Research
Type Independent
Variable Dependent Variable Discipline
Main study Type
1 Unequal/Equal opportunity
Socio-economic status and IQ of pupil, material school characteristics
Attainment Sociology Survey
2 Production Functions
Material school characteristics
Achievement Level
Economics Survey
3 Evaluation of compansatory programmes
Specific curricula Achievement Level
Interdisciplinary pedagogy
Quasi-experiment
4 Effective Schools
'Process' characteristics of
Achievement Level
Interdisciplinary pedagogy
Case study
5 Effective instruction
Characteristics of teachers, instruction,
class organisation
Achievement Level
Educational Psychology
Experiment Observation
Source: Scheerens, 2000
3.6 Statistical Formulation of School Effectiveness
One of the challenges that researchers have been facing is how to estimate the magnitude of
school effects. The approaches that have been considered are: (i) Student level regression
models, (ii) School aggregate regression models and; (iii) Multilevel models.
3.6.1 Student level Regression Models
Researchers have studied student-level residual models. In this method, students from all
schools are pooled together and, without regard for school membership, the criterion of
interest is regressed on student background and other student variables considered relevant.
The residuals from this total sample regression are then averaged by school and taken as an
index of school effectiveness. However, it has been shown that this strategy yields biased
estimates of school effects if there is heterogeneity of slopes among schools (E Kennedy and
M. Durland 1999 P. 6).

30
3.6.2 School Aggregate Regression Models
In this model, all student-level data (mean scores) is aggregate to the school-level and
regressed on student background, the standardized discrepancy score between actual student
achievement and predicted student achievement is calculated. The standardized discrepancy
scores for each school, also known as residuals are ranked with the largest on top and lowest
at the bottom. Naturally , all schools that have scores higher than would be expected
(predicted) are deemed more effective and those with scores lower than what would be
expected are deemed as less effective, that is, after taking into consideration the home
background of their intakes.
3.6.3 Multilevel models
Eugene Kennedy and Maryann Durland (1999) suggested in their people entitled: Validation
of Competing Statistical Formulation of School Effectiveness that multilevel models attempt
to incorporate both student and school-level variables in the modelling process and that in
theory, more realistically mirror the processes operating in schools. They also say that
because of this, many researchers have enthusiastically embraced these models. They argue
that models which allow for the possibility that lower level units may be nested within several
higher level units permit modelling of multiple outcomes and allow for the presence of
measurement of errors’. This point is shared by Hungi (2005) who writes:
“In practice, most educational research studies select pupils as a sample who are
nested within classrooms, and the classrooms are in turn nested within schools,
schools within districts, provinces, or countries. In this situation, the pupils selected
for the study are not independent, but rather nested within organizational units,
and ignoring this fact results in problems of ‘aggregation bias and mis-estimated
precision’ ” Kenya SACMEQ II Country Report (2005)
While most investigators would agree that these models offer the possibility of more realistic
modelling of school processes; their sophistication may be a hindrance to their use in practical
settings. Specifically, the greatest limitations has been that of they are not easily understood
by lay persons and that they have questionable ‘fairness appeal’ for school accountability
purposes (E Kennedy and M. Durland 1999 P. p.4)
31
The consolation though is that, according to Fitz-Gibbon C.T. (1996), evidence has it that
estimates of school effects based on multilevel models “may not yield school rankings which
differ significantly from more easily understood regression based procedures”.
3.7 Evidence from School Effectiveness Studies
Most researchers have cited Coleman’s report published in 1966 as the cornerstone for
school-effectiveness studies. Though the study intended to show the extent to which school
achievement is related to students’ ethnic social background, the possible influence of the
‘school’ factor on learning achievement was also examined. Scheerens (2000 P. 36 and 37)
reports that in a survey which was conducted, teacher characteristics, material facilities,
curriculum and characteristics of the group or classes in which the pupils were placed were
measured and examined. When the influence of ethnic origin and socio-economic status of the
pupil was statistically eliminated, the study showed that the three characteristics together
accounted for only 10 percent of the variance in pupil performance - which meant that socio-
economic and ethnic origin played a central role in pupil achievement.
Scheerens (2000 P.37) reports that other large-scale studies such as those conducted by
Hauser, Sewell and Alwin (1976) indicated that there was “relatively high correlation between
socio-economic and ethnic family characteristics on the one hand, and the learning attainment
on the other, compared to a small or even negligible influence from school and instruction
characteristics”
Scheerens (2000) reports that both research findings were criticised by educationists on
‘limited interpretation of school characteristics’ and ‘narrow choice of school characteristics’
as well as on the ‘methodological grounds’ respectively. The conclusions from the above
studies which indicated that schools did not really matter much in terms of differences in the
level of learning achievement prompted a number of researchers to study the school
characteristics in much detail - the organisation, form and content of schools. Table 7 below
presents the effects of resources in developing countries based on 1996 studies by Hunushek
(1995):
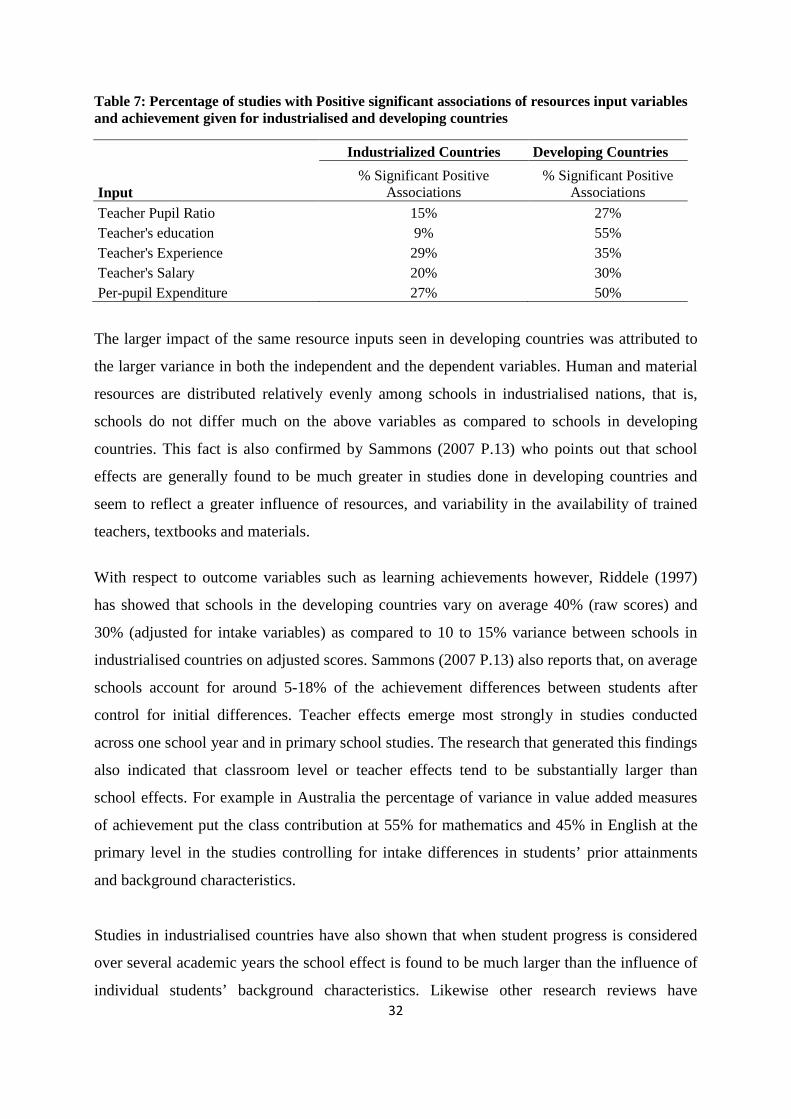
32
Table 7: Percentage of studies with Positive significant associations of resources input variables and achievement given for industrialised and developing countries
Input
Industrialized Countries Developing Countries % Significant Positive
Associations % Significant Positive
Associations Teacher Pupil Ratio 15% 27% Teacher's education 9% 55% Teacher's Experience 29% 35% Teacher's Salary 20% 30% Per-pupil Expenditure 27% 50%
The larger impact of the same resource inputs seen in developing countries was attributed to
the larger variance in both the independent and the dependent variables. Human and material
resources are distributed relatively evenly among schools in industrialised nations, that is,
schools do not differ much on the above variables as compared to schools in developing
countries. This fact is also confirmed by Sammons (2007 P.13) who points out that school
effects are generally found to be much greater in studies done in developing countries and
seem to reflect a greater influence of resources, and variability in the availability of trained
teachers, textbooks and materials.
With respect to outcome variables such as learning achievements however, Riddele (1997)
has showed that schools in the developing countries vary on average 40% (raw scores) and
30% (adjusted for intake variables) as compared to 10 to 15% variance between schools in
industrialised countries on adjusted scores. Sammons (2007 P.13) also reports that, on average
schools account for around 5-18% of the achievement differences between students after
control for initial differences. Teacher effects emerge most strongly in studies conducted
across one school year and in primary school studies. The research that generated this findings
also indicated that classroom level or teacher effects tend to be substantially larger than
school effects. For example in Australia the percentage of variance in value added measures
of achievement put the class contribution at 55% for mathematics and 45% in English at the
primary level in the studies controlling for intake differences in students’ prior attainments
and background characteristics.
Studies in industrialised countries have also shown that when student progress is considered
over several academic years the school effect is found to be much larger than the influence of
individual students’ background characteristics. Likewise other research reviews have
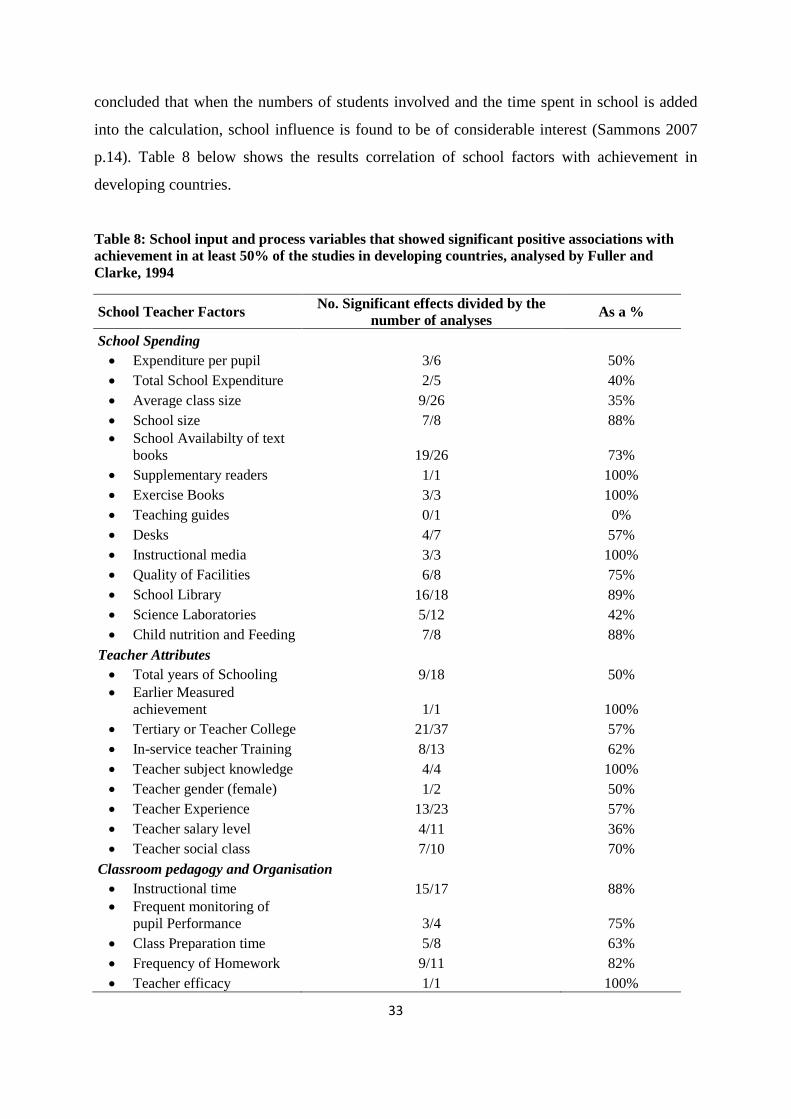
33
concluded that when the numbers of students involved and the time spent in school is added
into the calculation, school influence is found to be of considerable interest (Sammons 2007
p.14). Table 8 below shows the results correlation of school factors with achievement in
developing countries.
Table 8: School input and process variables that showed significant positive associations with achievement in at least 50% of the studies in developing countries, analysed by Fuller and Clarke, 1994
School Teacher Factors No. Significant effects divided by the number of analyses As a %
School Spending • Expenditure per pupil 3/6 50% • Total School Expenditure 2/5 40% • Average class size 9/26 35% • School size 7/8 88% • School Availabilty of text
books 19/26 73% • Supplementary readers 1/1 100% • Exercise Books 3/3 100% • Teaching guides 0/1 0% • Desks 4/7 57% • Instructional media 3/3 100% • Quality of Facilities 6/8 75% • School Library 16/18 89% • Science Laboratories 5/12 42% • Child nutrition and Feeding 7/8 88%
Teacher Attributes • Total years of Schooling 9/18 50% • Earlier Measured
achievement 1/1 100% • Tertiary or Teacher College 21/37 57% • In-service teacher Training 8/13 62% • Teacher subject knowledge 4/4 100% • Teacher gender (female) 1/2 50% • Teacher Experience 13/23 57% • Teacher salary level 4/11 36% • Teacher social class 7/10 70%
Classroom pedagogy and Organisation • Instructional time 15/17 88% • Frequent monitoring of
pupil Performance 3/4 75% • Class Preparation time 5/8 63% • Frequency of Homework 9/11 82% • Teacher efficacy 1/1 100%
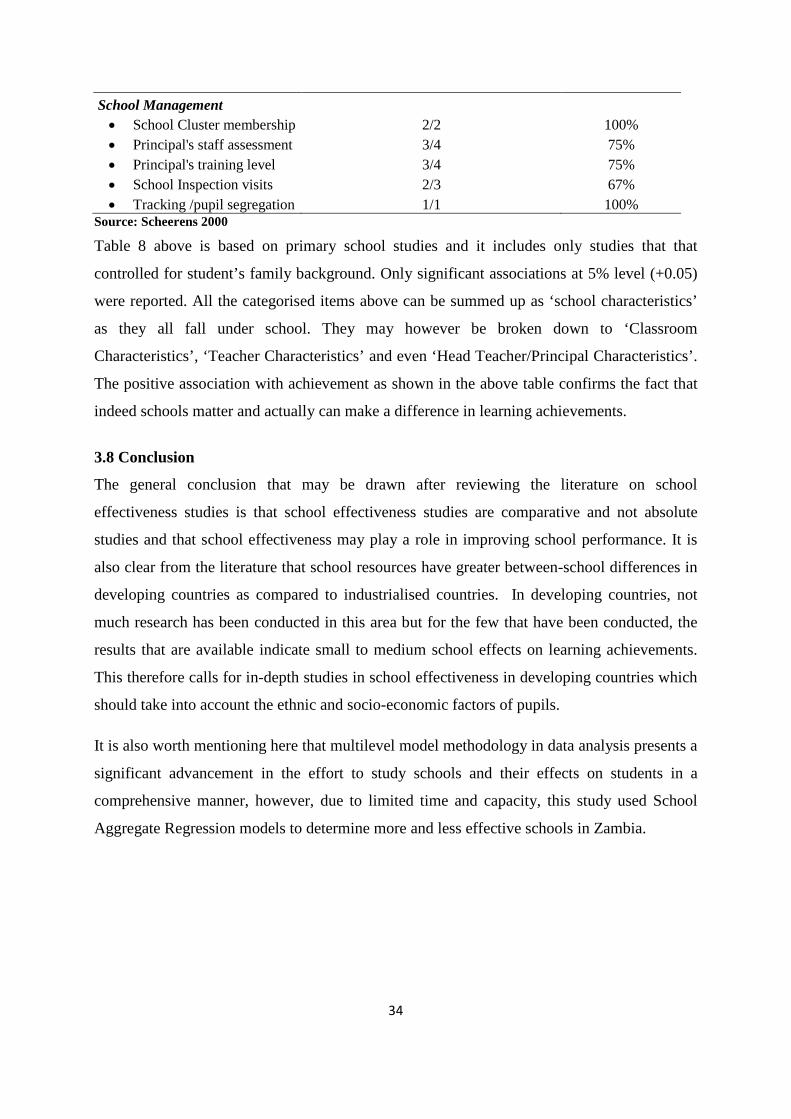
34
School Management • School Cluster membership 2/2 100% • Principal's staff assessment 3/4 75% • Principal's training level 3/4 75% • School Inspection visits 2/3 67% • Tracking /pupil segregation 1/1 100%
Source: Scheerens 2000
Table 8 above is based on primary school studies and it includes only studies that that
controlled for student’s family background. Only significant associations at 5% level (+0.05)
were reported. All the categorised items above can be summed up as ‘school characteristics’
as they all fall under school. They may however be broken down to ‘Classroom
Characteristics’, ‘Teacher Characteristics’ and even ‘Head Teacher/Principal Characteristics’.
The positive association with achievement as shown in the above table confirms the fact that
indeed schools matter and actually can make a difference in learning achievements.
3.8 Conclusion
The general conclusion that may be drawn after reviewing the literature on school
effectiveness studies is that school effectiveness studies are comparative and not absolute
studies and that school effectiveness may play a role in improving school performance. It is
also clear from the literature that school resources have greater between-school differences in
developing countries as compared to industrialised countries. In developing countries, not
much research has been conducted in this area but for the few that have been conducted, the
results that are available indicate small to medium school effects on learning achievements.
This therefore calls for in-depth studies in school effectiveness in developing countries which
should take into account the ethnic and socio-economic factors of pupils.
It is also worth mentioning here that multilevel model methodology in data analysis presents a
significant advancement in the effort to study schools and their effects on students in a
comprehensive manner, however, due to limited time and capacity, this study used School
Aggregate Regression models to determine more and less effective schools in Zambia.

35
CHAPTER FOUR: BRIEF DESCRIPTION OF THE SACMEQ III STUDY AND
POLICY IMPLICATIONS IN ZAMBIA
4.1 Introduction
In this chapter the main general characteristics of SACMEQ and specific aspects of the
methodology followed in the latest SACMEQ project have been outlined and this includes a
description of the sampling design used, test design and domains, generation of pupil scores
and major findings as well as policy suggestions for Zambia.
This chapter was largely inspired by the following existing documents on SACMEQ projects
and methodology2:
- “The conduct of the SACMEQ III project. Ch. 3 of SACMEQ South Africa
report.”Moloi and Chetty, 2012.
- “What are the levels and trends in reading and mathematics achievement?”.
SACMEQ Policy Issues Series. Makuwa, 2011.
- “In search of quality: what the data tell us”. IIEP Newsletter.Vol. XXVIII, No. 3
September-December 2010.
- “Pupil Achievement Results”. SACMEQ Working document n°2. Hungi, Makuwa,
Ross, Saito, Dolata, Van Cappelle, Paviot, & Vellien, 2010.
- “The conduct of the SACMEQ II project. Ch. 2 of SACMEQ Reports”. Ross, Saito,
Dolata, Ikeda, Zuze, Murimba, Postlethwaite & Griffin, 2005.
4.2 SACMEQ: Governance, Mission and Projects
The Southern and Eastern Africa Consortium for Monitoring Educational Quality (SACMEQ)
is an international non-profit developmental organisation of 15 Ministries of Education in
Southern and Eastern Africa engaged in monitoring and evaluating the quality of primary
education in developing countries. The SACMEQ network comprises now: Botswana, Kenya
Lesotho, Malawi, Mauritius, Mozambique, Namibia, Seychelles, South Africa, Swaziland,
Tanzania, Uganda, Zambia, Zanzibar and Zimbabwe.
2 available under http://www.sacmeq.org and/or http://www.iiep.unesco.org/fileadmin/user_upload/Info_Services_Newsletter/pdf/eng/2010/2010_3En.pdf

36
SACMEQ's mission is to undertake integrated research and training activities that will (a)
expand opportunities for educational planners to gain the technical skills required to monitor
and evaluate the quality of basic education and (b) generate information that can be used by
decision-makers to plan and improve the quality of education.
The general SACMEQ orientation of the projects is decided by the SACMEQ Ministers
during the Assembly of SACMEQ Ministers that is held every two-years in Paris. The main
purpose of the SACMEQ Projects is to gather information that could be used by ministries of
education to track trends in (a) the general conditions of schooling and, (b) the achievement
levels of Grade 6 pupils and their teachers in reading, mathematics and HIV&AIDS
knowledge.
SACMEQ has successfully completed three large-scale educational policy projects at 5–6
year intervals in order to monitor change over time. The SACMEQ I Project was conducted
during the period 1995–1998 and covered around 1,000 schools and 20,000 Grade 6 pupils in
seven countries. The SACMEQ II Project was conducted from 1999 to 2004 and covered
around 2,000 schools and 40,000 Grade 6 pupils from 14 countries. In 2005, the Assembly
launched the SACMEQ III research project with the same focus as previous projects on the
Quality of Education at primary level. Preparations for SACMEQ III Project data collection
commenced during 2006, with the design of the study, development of tests, trial testing, and
refinement of all survey instruments. The data collection took place in 2007, and involved
around 60,000 pupils, 8,000 teachers and 2,800 school heads. And the first findings were
presented to the Assembly in 2009.
4.3 General Policy Concerns
Ministries were tasked through their National Research Coordinators (NRCs) to identify
major policy concerns and specific research questions that were of interest to their education.
All the fifteen SACMEQ NRCs initiated discussions with senior members in their ministries
of education in order to identify priority policy concerns associated with their education
systems. The responses from all countries were then analysed in order to identify groups of
‘General Policy Concerns’. Below is a summary of six themes that informed the general
policy concerns for SACMEQ III:
1. Pupils’ characteristics and their learning environments.
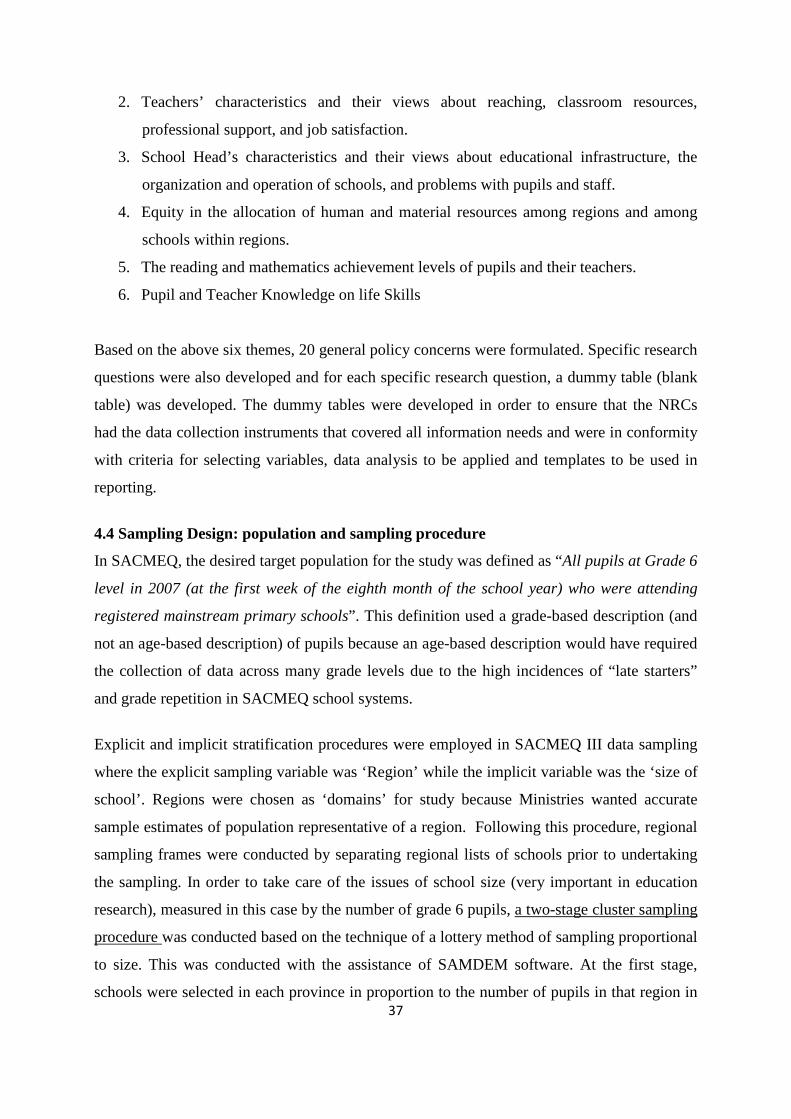
37
2. Teachers’ characteristics and their views about reaching, classroom resources,
professional support, and job satisfaction.
3. School Head’s characteristics and their views about educational infrastructure, the
organization and operation of schools, and problems with pupils and staff.
4. Equity in the allocation of human and material resources among regions and among
schools within regions.
5. The reading and mathematics achievement levels of pupils and their teachers.
6. Pupil and Teacher Knowledge on life Skills
Based on the above six themes, 20 general policy concerns were formulated. Specific research
questions were also developed and for each specific research question, a dummy table (blank
table) was developed. The dummy tables were developed in order to ensure that the NRCs
had the data collection instruments that covered all information needs and were in conformity
with criteria for selecting variables, data analysis to be applied and templates to be used in
reporting.
4.4 Sampling Design: population and sampling procedure
In SACMEQ, the desired target population for the study was defined as “All pupils at Grade 6
level in 2007 (at the first week of the eighth month of the school year) who were attending
registered mainstream primary schools”. This definition used a grade-based description (and
not an age-based description) of pupils because an age-based description would have required
the collection of data across many grade levels due to the high incidences of “late starters”
and grade repetition in SACMEQ school systems.
Explicit and implicit stratification procedures were employed in SACMEQ III data sampling
where the explicit sampling variable was ‘Region’ while the implicit variable was the ‘size of
school’. Regions were chosen as ‘domains’ for study because Ministries wanted accurate
sample estimates of population representative of a region. Following this procedure, regional
sampling frames were conducted by separating regional lists of schools prior to undertaking
the sampling. In order to take care of the issues of school size (very important in education
research), measured in this case by the number of grade 6 pupils, a two-stage cluster sampling
procedure was conducted based on the technique of a lottery method of sampling proportional
to size. This was conducted with the assistance of SAMDEM software. At the first stage,
schools were selected in each province in proportion to the number of pupils in that region in

38
the defined target population. At the second stage, a simple random sample of 25 pupils was
taken within each selected school.
For SACMEQ III project, the effective sample size of Zambia was based on a coefficient of
intra-class correlation (rho) 3 of 0.304 and a cluster size of 25 equivalent to a simple random
sample of 400 at 95% confidence limit of ±0.1s for means and ±5 percent for percentages
(where ‘s’ is the value of the pupil standard deviation).
In Zambia 2,895 pupils and 265 teachers were selected from 157 schools across the 9
provinces which participated in the SACMEQ III research project.
4.5 SACMEQ Test Design
The SACMEQ Ministers interpreted the concept of “literacy” as “the ability to understand
and use those written language forms required by society and/or valued by the individual.”
that were transmitted through school language and reading instruction programmes. They
interpreted “numeracy” as meaning the numerical and mathematical reasoning skills that
formed the core of school mathematics programmes.
The SACMEQ Ministers wanted their school systems to be judged by the extent to which
pupils acquired the knowledge and skills that they were expected to acquire – as specified in
official school curricula, textbooks, and teachers’ guides.
Domains
In the SACMEQ projects, three broad content domains for reading literacy were agreed upon
as providing a balanced coverage of the main reading domains and the required reading skills:
- Narrative prose: Continuous texts in which the writer aims to tell a story – whether
this be fact or fiction.
- Expository prose: Continuous text in which the writer aims to describe, explain, or
otherwise convey factual information or opinion to the reader.
3 The rho measures the tendency of pupil characteristics to be more homogeneous within schools than would be the case if pupils were assigned to schools at random. 4 This value was estimated from the previous SACMEQ II project
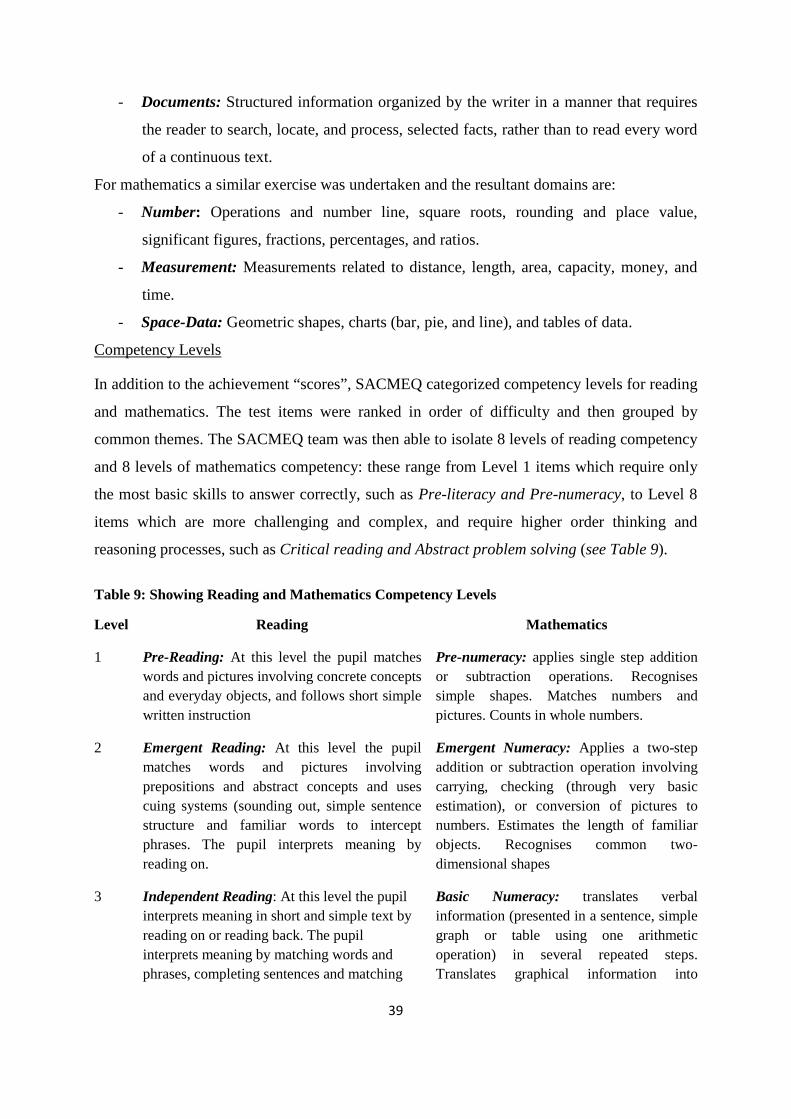
39
- Documents: Structured information organized by the writer in a manner that requires
the reader to search, locate, and process, selected facts, rather than to read every word
of a continuous text.
For mathematics a similar exercise was undertaken and the resultant domains are:
- Number: Operations and number line, square roots, rounding and place value,
significant figures, fractions, percentages, and ratios.
- Measurement: Measurements related to distance, length, area, capacity, money, and
time.
- Space-Data: Geometric shapes, charts (bar, pie, and line), and tables of data.
Competency Levels
In addition to the achievement “scores”, SACMEQ categorized competency levels for reading
and mathematics. The test items were ranked in order of difficulty and then grouped by
common themes. The SACMEQ team was then able to isolate 8 levels of reading competency
and 8 levels of mathematics competency: these range from Level 1 items which require only
the most basic skills to answer correctly, such as Pre-literacy and Pre-numeracy, to Level 8
items which are more challenging and complex, and require higher order thinking and
reasoning processes, such as Critical reading and Abstract problem solving (see Table 9).
Table 9: Showing Reading and Mathematics Competency Levels
Level Reading Mathematics
1 Pre-Reading: At this level the pupil matches words and pictures involving concrete concepts and everyday objects, and follows short simple written instruction
Pre-numeracy: applies single step addition or subtraction operations. Recognises simple shapes. Matches numbers and pictures. Counts in whole numbers.
2 Emergent Reading: At this level the pupil matches words and pictures involving prepositions and abstract concepts and uses cuing systems (sounding out, simple sentence structure and familiar words to intercept phrases. The pupil interprets meaning by reading on.
Emergent Numeracy: Applies a two-step addition or subtraction operation involving carrying, checking (through very basic estimation), or conversion of pictures to numbers. Estimates the length of familiar objects. Recognises common two-dimensional shapes
3 Independent Reading: At this level the pupil interprets meaning in short and simple text by reading on or reading back. The pupil interprets meaning by matching words and phrases, completing sentences and matching
Basic Numeracy: translates verbal information (presented in a sentence, simple graph or table using one arithmetic operation) in several repeated steps. Translates graphical information into

40
adjacent words. fractions. Interprets place value of whole numbers up to thousands. Interprets simple common everyday units of measurement.
4 Interpretive and Inferential: At this level the pupil reads on or reads back in order to link and interpret information located in various parts of the text.
Beginning Numeracy: Translates verbal and graphic information into simple arithmetic problems. Uses multiple different arithmetic operations (in the correct order) on whole numbers, fractions, and/or decimals.
5 Critical Reading: At this level the pupil reads on or reads back in order to combine and interpret information from various parts of the text in association with external information (based on recalled factual knowledge) that ‘completes’ and contextualises meaning.
Competent Numeracy: Translates verbal graphic or tabular information into simple arithmetic problems (using the correct order of arithmetic operations) involving everyday units of measurements and/or whole and mixed numbers . Converts basic measurement units from one level of measurement to another (for example, metres to centimetres).
6 Analytical Reading: At this level the pupil reads on or reads back through longer texts (of narrative, documentary or expository nature) to combine information from various parts of the text to infer the writer’s purpose.
Mathematically Skilled: Solves multi operational problems (using the correct order of arithmetic operations) involving fractions, ratios, and decimals. Translates verbal and graphic representation information into symbolic, algebraic and equation form in order to solve a given mathematical problem. Checks and estimates answer using external knowledge (not provided within the problem.)
7 Insightful Reading: At this level the pupil locates information in longer texts (of a narrative, documentary or expository nature) by reading on and reading back in order to combine information from various parts of the text so as to infer the writer’s personal beliefs, prejudices or biases.
Problem Solving: Extracts and coverts (for example, with respect to measurement units) information from tables, charts, visual and symbolic presentation in order to identify, and sole multi-step problems.
8 Critical Reading: At this level the pupil locates information in longer texts (of a narrative, documentary or expository nature) by reading on and reading back in order to combine information from various parts of the text. The pupil is able to evaluate the writer’s assumptions on both the topic and the characteristics of the reader – such as age,
Abstract problem solving: identifies the nature of an un-stated mathematical problem embedded within verbal or graphic information, and then translates this into algebraic or equation from in order to solve the problem

41
knowledge, and personal beliefs, prejudices or biases.
4.6 Generating pupil scores (outcomes indicators)
Since SACMEQ II, the Rasch scaling procedures has been used to generate the reading and
mathematics scores in the SACMEQ projects. This procedure allows to compare the scores
between the pupils and teachers and to compare the scores between the projects. In order to
facilitate the interpretation, the scores (initially expressed in logit) were adjusted to an overall
SACMEQ mean score of 500 with a standard deviation of 100 fixed during the SACMEQ II
project. Because of this, the pupil and teacher scores generated during the SACMEQ III
project were “aligned” to the previous scale. In other words, the scores of participants (pupils
and teachers) by projects (SACMEQ I, II and III) are placed on the same continuum scale for
each subject (reading and mathematics). The pupil (Rasch) scores would be used as outcome
indicators in the regression analysis later in this study.
4.7 SACMEQ Questionnaires and generating input indicators
As the achievement test, SACMEQ teams constructed collectively seven common
questionnaires for pupils, teachers and school head in order to collect information to respond
to the general policy concerns of their respective Ministries of Education. In the SACMEQ III
instruments, there were a total 205 questions (excluding those for HIV/AIDS Knowledge) out
of which 65 questions were administered to pupils, 41 to teachers and 99 to head teachers who
answered questions about themselves as ‘School Principal’ as well as those for their
‘Schools’. A total of 446 variables were produced.
In some cases, one question (“sex of the pupil” or “teacher age”, etc.) was used as an indicator
(singleton indicators). In other cases, more than one variable or question were used to
construct a composite indicator or derived indicators. For example, the pupil socioeconomic
status (SES) indicator is a composite indicator based on 18 variables (Dolata, 2005): Home
quality, home possessions, father and mother level of education, number of books and source
of lighting to read at home. Out of the 380 derived variables only 151 representative and
relevant variables to the study were shortlisted for analysis. A total of 151 variables were
correlated with school mean scores.

42
4.8 Policy Implications of SACMEQ Study in Zambia
This section briefly summarises the major findings in the SACMEQ III country report for
Zambia and highlights some policy suggestions. This section was informed by the “The
SACMEQ III project in Zambia: a study of the conditions of schooling and the quality of
education.,” Bupe Musonda and Alex Kaba, 2011.
4.8.1 Pupils and their Learning Environments
This section highlights the general background of Grade 6 pupils that participated in the
SACMEQ III study. First of all, 64.7% of the schools which participated were located in rural
areas. The average age of the Grade 6 pupils who participated in the study was 14 and 48%
were girls while 52% were boys. The average level of education of parents coded on a scale
of 1 to 12 was 6.8 (equivalent to secondary education) while the average number of meals
eaten per week by pupils was 10.7. The report also indicates that 87.6% of the pupils only
took the evening meal and that the pupils that spoke the language of the test outside school
was 78.4%. Only 31.1% of the pupils received homework and 54.3% of them reported
teachers corrected their homework while 34.5% of them responded that they were assisted by
family with homework. The report also indicates that out of the total of 22 days per month,
pupils were absent for 2.53 days on average and those that repeated grade 6 were only 7.8%.
In terms of extra tuitions, only 12.7% reported receiving extra tuition.
The policy suggestions under pupils and their learning environment included research into
why pupils repeat and why the use of English at home declined, abolishing weekly boarding,
ensuring schools complied with the homework policy and banning of extra lessons in schools
while intensifying remedial lessons especially for poor performing leaners.
4.8.2 Teachers Characteristics and their Views
This section summarises teacher’s characteristics such as age, gender professional
qualification and teaching experience as reported in the SACMEQ III Report. The average
age of teachers who taught Grade 6 pupils at the time of the study was found to be 31.8 years
and 52.9% of them were female teachers who were more concentrated in urban areas. The
average number of years of training remained at 2 years while the number of years of teaching
experience was at 6 implying that they were young and most likely inexperienced. The

43
average number of periods taught per week was 31.1 as compared to a minimum of 40
required by Government, while the average number of hours teachers spent on lesson
planning and marking was 11.3 hours per week.
As regards parents signing homework, 90.9% of teachers asked parents to sign their children’s
maths and 62.2% reading homework respectively. With respect to classroom furniture, 47.0%
of teachers had a table, 53.3% had a chair, 16.5% had a cupboard and 15.1% had a bookshelf
and in terms of access to teaching aids, the report says many teachers were not adequately
equipped.
Some policy suggestions on teachers included providing attractive incentives and adequate
social amenities to attract female teachers to rural areas, strengthen external and internal
monitoring systems to ensure that teachers prepared lesson plans and marked pupil’s work,
reinforcement of homework policy in schools and ensuring that adequate teaching and
learning materials and classroom furniture were provided to schools. Suggestions also
included Government to increase funding to the education sector.
4.8.3 School Heads Characteristics and their Views
With regard to school heads, the average age of the school heads was 50.2years and 31.5% of
them were female while the average years of experience in leadership position was at 6.5. In
terms of teacher support, 73% of the teachers reported receiving advice at least once a term
from the school head while only 2% reported not having received any advice. Only 4.5% of
school head teachers reported that their schools were in good condition while 43.3% of
schools reported that they needed major repairs.
The School heads reported a general decline in almost all forms of community contributions
(building, teaching and provision of learning supplies, maintenance etc.) and they also
reported a notable increase in pupil’s behaviour problems of all sorts (absenteeism, theft, drug
use vandalism etc.) in SACMEQ III to SACMEQ II. With regard to teachers’ behavioral
problems, school heads also reported that almost all teacher problems (absenteeism, skipping
classes, alcohol etc.), increased during SACMEQ III except for late arrival and health
problems.

44
Among the policy suggestions were to increase frequency of school visits, balance the gender
differences among school heads in all provinces, institutionalize the programme of leadership
and management for school heads, focus on investing in general infrastructure and preventive
maintenance in schools and research on the reasons for high levels of pupil and teacher
behavioural problems.
4.8.3 Equity in Allocation of Material, Resources and Human among Regions
On average, the report indicates that the distribution of school resources, equipment and
facilities among the provinces was not equitably done because urban schools such as those on
the Copperbelt and Lusaka were better resourced as compared to the rest of the provinces.
There was also a reduction in the availability of resources as compared to SACMEQ II. In
terms of gender, urban provinces such as Copperbelt (47.7%) and Lusaka (44%) had a fairly
good distribution of female teachers while Central province had the least with 13.4%.
The policy suggestions emphasised the use of the Education Management Information System
(EMIS) when planning for the allocation and distribution of resources equitably including
allocation of human resources.
4.8.4 Reading and Mathematics Achievements Levels of Pupils
The reading mean score for Zambia in SACMEQ III was 434.4 while that of mathematics was
435.2. All the nine provinces were below the SACMEQ mean score of 500.In terms of
reading competency skills for pupils, the majority of the pupils were reading at level 2
(Emergent reading) and level 3 (basic reading) with 28.3% and 28.6% respectively out of the
8 level described in table 9 above. In mathematics, the modal competency was level 2
(emergent numeracy) at 53.6%. Generally the boys performed better than the girls and schools
in urban set-up performed better than those in the rural set-up.
The policy suggestions included more investment in learning and teaching materials,
continued provision of pedagogical support, continued recruitment and deployment of
teachers especially to rural schools, enhancement of the Continuous Professional
Development (CPD) for primary reading and numeracy programmes, ensuring that the
Primary Reading Programme is strictly adhered to and consideration for development of
supplementary readers for pupils at all levels as well as re-introduction of the Mathematics
Rainbow Kit (MARK), an initiative that made the teaching of mathematics interactive and
engaging

45
CHAPTER FIVE: THE SELECTION OF INDICATORS FOR THE STUDY
This chapter discusses correlation results and the shortlisted indicators described briefly in
chapter one under methodology. As explained in chapter one, this study used data from the
SACMEQ III project and correlated ‘singleton’ and ‘derived’ indicators from the four
questionnaires administer to pupils, teachers and head teachers during the SACMEQ III study
with school reading and mathematics mean scores. This chapter presents and interprets the
results of the correlation analysis.
5.1 Indicators Designated for further study
Note that two criterions were used to come up with a final subset of indicators: only the
indicators that met the coefficient correlation cut-off point of +0.05 and also common to both
reading and mathematics were to be selected for further analysis. This step reduced the
number of analysed indicators from the initial 151 examined to only 28 (Appendix A). The 28
indicators were then categorised into four groups. The section below lists and briefly
describes the shortlisted indicators.
5.1.1 Pupil Characteristic at Home Below is a list of indicators under pupil characteristics at home.
1. Pupil Socio-Economic Status (ZPSESSCR) 2. Pupil speaking the language of instruction at home (zpenglis) 3. Pupil preschool (zpnurser) 4. Pupil meals per week (zpregme) 5. Extra Tuition-Science (zpextsci) 6. Extra Tuition-Other Subjects (zpextoth) 7. Extra Tuition-Maths(zpextmat) 8. Pupil task – shopping (zptask11) 9. Pupil has used a computer (zpcomptr)
This group of indicators describe conditions under which the grade 6 pupils that participated
in the SACMEQ III study lived. It must be explained that the socio-economic status
(ZPSESSCR) is a composite indicator which include 18 variables under such things as (i) the
level of education of the father and mother, (ii) the number of books in the home, (iii) the
presence of eleven items in the home (a newspaper, a magazine, a radio, a television, a VCR,
an audio cassette player, a telephone, a refrigerator, a car, running water and a table), (iv) the
structural quality of the house (floor, outside walls and roof) and; (v) the main source of light,
determining whether or not pupils can read (S. Dolata, 2005).

46
The ability to afford extra tuition, access to a computer and having attended pre-school are
attributes of privileged families. It is not surprising to note that the above nine indicators did
not only met correlation coefficient cut-off point set by this study, but that they were common
to both reading and mathematics. A critical look at them shows that indeed they are all key in
influencing pupil learning abilities.
5.1.2 School Resources and Teacher Characteristics Below is a list of 7 indicators that survived the set criterion under School Resources and
Teacher Characteristics:
1. School Resources composite Indicator (zsresloc) 2. School location (zsloc) 3. School type (zstype) 4. Maximum number of pupils among shifts (bigshift) 5. School problem-Pupils Dropout (zspupp04) 6. Number of shifts (zssessnu) 7. Ratio of girls (zspupgir)
Note that School Resources was composite indicator (zsresloc) incorporating over 150 school
resources which include teaching and learning materials, furniture, water, office equipment,
electricity, school buildings, presence of a cafeteria, playground, piped water, telephone and
so on ( Mioko 2007). This is not surprising in that literature review has shown that school
resources have a bearing on pupil academic performance. School type and location were also
among the School Resources and Teacher Characteristics. Obviously the type of school that
pupils go to have a bearing on whether the pupils come from a privileged family or not
because only well placed pupils will have access to private schools. Similarly, the location of
a school has a bearing on the kind of pupils they teach, i.e. rural or remote schools have most
of their intakes with under privileged children who are not easy to teach. Furthermore, the
number of shifts and the number of pupils in shifts are said to have a bearing on pupil
academic performance if the same teachers are engaged.
5.1.3 Teacher Characteristics
Below is a list of four indicators under teacher characteristics that meet the criterion set by
this study and they describe attributes of teachers who taught in schools with higher mean
schools.

47
1. Teacher asking parents to sign on homework (zxsignhm) 2. Homework being corrected (zphmwkc) 3. Being given homework (zphmwk) 4. Reading teacher years of professional training (zxqprof)
Giving homework, asking parents to sign for it and correcting it are all well-researched factors
that are known to enhance learning (S.R. Hara and D.J. Burke 1998). The duration of
professional training also matters because it determines how well the content and pedagogical
aspects of training have been covered.
5.1.4 School Management and Development
There are eight indicators the met the criterion set by this study under School Management
and Development as listed below. Community involvement has been linked to pupil academic
achievements in many studies. The particular community involvements that had significant
association with pupil mean scores were teacher bonus, purchase of text books, staff salary
and staff bonus as presented below. The issues of salary and bonus are all aspects of
teacher/staff motivation and motivated teachers/staff are said to perform better. The issue of
textbooks is also essential in increasing the knowledge base for pupils.
1. Community contribution to school-Teacher Bonus (zscomm09) 2. Community contribution to school-Purchase Textbooks (zscomm04) 3. Community contribution to school-Staff Salary (zscomm10) 4. Community contribution to school-Staff Bonus (zscomm11) 5. School problem-Pupil Theft (zspupp09) 6. School problem-Pupil Cheating (zspupp06) 7. School problem-Pupil Use Abusive Language (zspupp07) 8. School problem-Pupil Sexually Harrass Teachers (zspupp14)
In Zambia, the Government is generally responsible for teacher and staff salaries and
purchase of text books including staff and teacher incentives. There is however other players
such as Faith Based Organisations (FBOs), Non-Governmental Organisations (NGOs) and the
private sectors that run schools which may have a lot of dependence on communities for
supplies of textbooks and staff/teacher bonuses and salaries. Nevertheless, due to limited
resources, some Government schools have benefited through participation of local
communities. Other than community contribution, pupil behavioural problems were among
the indicators under School Management and Development. Anyone wouldn’t easily imagine

48
that there would be a positive relationship between learning achievements and pupil bad
behavioural problems at school. This however is not surprising because the SACMEQ III
country report indicates that there was a notable general increase in pupil’s behaviour
problems of all sorts during SACMEQ III relative to SACMEQ II.
5.2 Conclusion
A few general conclusions can be drawn from the above listed groups of indicators. The first
one is that out of the 28 indicators, 9 (32%) are associated with ‘pupil characteristic at home’,
clearly indicating how strongly pupil home background is related to learning achievements.
Secondly, school resources have been known to affect learning achievements, therefore, only
schools which had a good measure of resources would be associated with good pupil
performance. Thirdly, only schools with teachers that gave homework, asked parents to sign
homework and had more years of professional training could produce pupils who performed
better and finally, school location and type plays an important role on what kind of pupils they
admitted.

49
CHAPTER SIX: INDICATORS DESCRIMINATING BETWEEN MORE EFFECTIVE AND LESS EFFECTIVE SCHOOLS
This chapter attempts to paint a picture of more effective and less effective schools. The
concept of a “more effective” and “less effective” school was introduced in chapter one and
expanded in chapter four. Throughout this study, the usage of the these terms implies that one
should interpret the school mean scores in both reading and mathematics after considering the
home background of the grade 6 pupils that attended that particular school. This interpretation
is based on a well-known fact that schools serving privileged communities have higher mean
scores than those serving poor communities (Postlethwaite T. N and Ross K. N. 1992 P. 29).
It is therefore the schools that deviate from this general pattern by “adding value” to their
pupils that are termed most effective schools. Conversely, it is also the schools that serve
privileged communities, yet their mean scores are lower than would be expected of them that
are termed less effective schools.
It follows therefore that a low performing school could be described as more effective
because it’s mean score falls above what would be expected from the knowledge of the home
background of its pupils. In the same way, a high scoring school could be described as less
effective after considering the home background its pupils.
6.1 Identification of More Effective and Less Effective Schools
Note that this analysis does not attempt to quantify the exact measures of the size of the
effects of various indicators on school average scores in reading and mathematics nor does it
imply a causal relationship between the indicators and mean scores. The aim of the analysis is
to identify a summary list of indicators that would be of interest to educational planners and
policy makers because they seem to respond differently between more effective and less
effective schools. In this study, 157 schools were involved. Considering that the school mean
score is to be interpreted after taking into account the pupil home background, the first step in
identification of the two groups of schools was to choose a set of variables that could be
representative of a measure of ‘pupil home background’ or ‘pupil socio-economic’ status.
However, as described in chapter five above under section 5.1.1, a composite indicator called
ZPSESSCR which incorporates 18 different variables from five main pupil home socio-
economic status namely the level of education of parents, number of books at home, 11 home
possessions, structural quality of homes and main source of lighting had already been derived.

50
In order to prove its validity, SES composite indicator was correlated with pupils’ reading
scores in SACMEQ I and II and it was found that the correlation coefficients were +0.38 and
+0.42 respectively which are positive and considerably higher than the minimum threshold
required in education (+0.2). It was also used in SACMEQ II for mathematics and a high
correlation coefficient of +0.37 was obtained (Dolata, 2005). Therefore, this SES composite
indicator is not only representative of pupil socio-economic status but it has also been proved
to be highly reliable and valid. It is this composite indicator which was used in this study to
discriminate between more effective and less effective schools.
The independent variable (school mean score in mathematics and reading) was regressed on
pupil SES indicator to determine More Effective and Less Effective Schools in Reading and
Mathematics. Note that regression analysis estimates the expected condition of the
independent variable (school mean score) given the dependent variables (home background).
The schools placed above the regression line were interpreted as exhibiting reading or
mathematics scores that were higher than could be expected of them. In the same way,
schools below the regression line were interpreted as having lower results than what would be
expected of them.
6.2 Regression Analysis – Reading and Mathematics on SES
Figure 14 shows the regression graphs for both reading and mathematics where the composite
indicator (ZPSESSCR) for pupil home background or socio-economic status is on the Y-axis
(dependent variable) and the mean scores on the X-axis (independent variable).
Figure 10: School mean score in mathematics against Socio-economic Composite Indicator
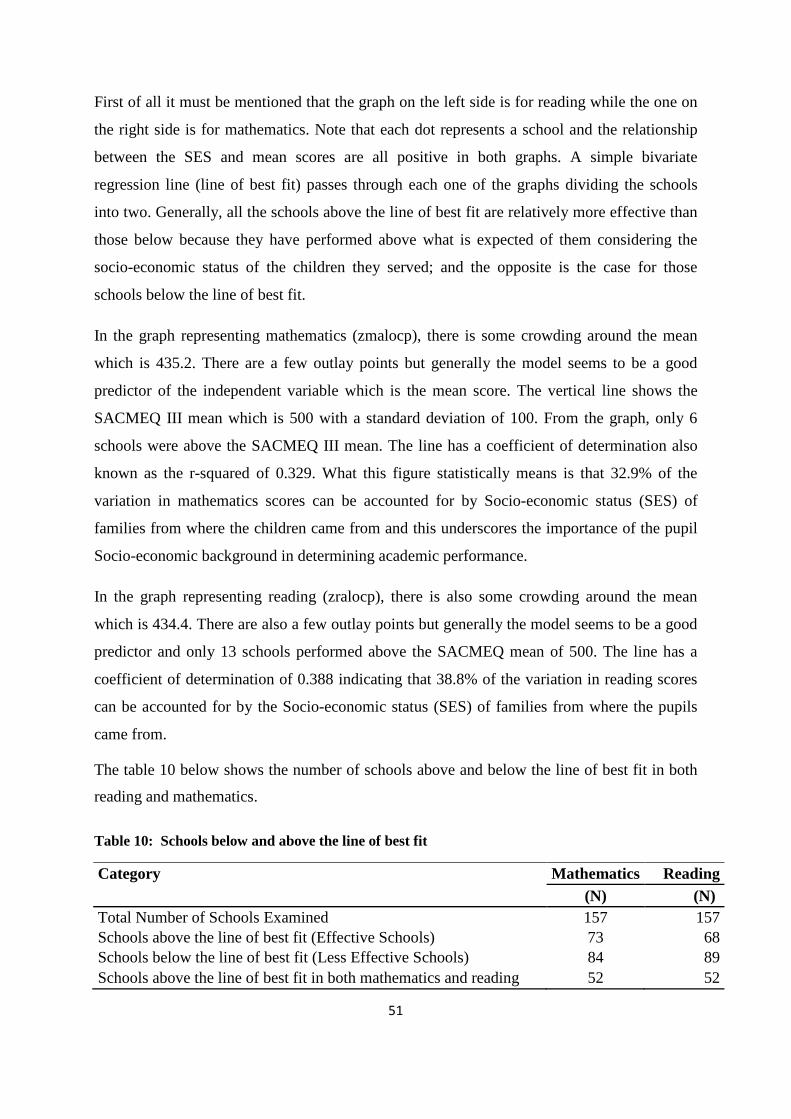
51
First of all it must be mentioned that the graph on the left side is for reading while the one on
the right side is for mathematics. Note that each dot represents a school and the relationship
between the SES and mean scores are all positive in both graphs. A simple bivariate
regression line (line of best fit) passes through each one of the graphs dividing the schools
into two. Generally, all the schools above the line of best fit are relatively more effective than
those below because they have performed above what is expected of them considering the
socio-economic status of the children they served; and the opposite is the case for those
schools below the line of best fit.
In the graph representing mathematics (zmalocp), there is some crowding around the mean
which is 435.2. There are a few outlay points but generally the model seems to be a good
predictor of the independent variable which is the mean score. The vertical line shows the
SACMEQ III mean which is 500 with a standard deviation of 100. From the graph, only 6
schools were above the SACMEQ III mean. The line has a coefficient of determination also
known as the r-squared of 0.329. What this figure statistically means is that 32.9% of the
variation in mathematics scores can be accounted for by Socio-economic status (SES) of
families from where the children came from and this underscores the importance of the pupil
Socio-economic background in determining academic performance.
In the graph representing reading (zralocp), there is also some crowding around the mean
which is 434.4. There are also a few outlay points but generally the model seems to be a good
predictor and only 13 schools performed above the SACMEQ mean of 500. The line has a
coefficient of determination of 0.388 indicating that 38.8% of the variation in reading scores
can be accounted for by the Socio-economic status (SES) of families from where the pupils
came from.
The table 10 below shows the number of schools above and below the line of best fit in both
reading and mathematics.
Table 10: Schools below and above the line of best fit
Category Mathematics Reading (N) (N) Total Number of Schools Examined 157 157 Schools above the line of best fit (Effective Schools) 73 68 Schools below the line of best fit (Less Effective Schools) 84 89 Schools above the line of best fit in both mathematics and reading 52 52

52
In order to find out by how much the school resources accounted for school mean scores, a
regression analysis was also done using school resources where school mean score were
regressed on school resources composite indicator described in chapter five for both subjects.
The regression analysis graphs are presented in Appendix B. The results showed that school
resources accounted for 17.4% of the reading and 9.3% of the mathematics scores
respectively. The SACMEQ III country report indicates a general decrease in the supplier of
education materials when compared to SACMEQ II. Table 11: Summary of Percentages Accounted for by SES and School Resource Index in Reading and Mathematics
Index Mathematics (%) Reading (%) Pupil SES Index 32.9 38.8 School Resource Index (SRI) 9.3 17.4
From table eleven above, both the Pupil SES and School Resource had more effect on reading scores than mathematics scores.
6.3 Determination of 20 Most Effective Schools and 20 Less Effective Schools
As pointed out above, 157 schools were involved in this study. The expected mean score for
each school in both mathematics and reading was calculated and subtracted from the actual
school mean score in both subjects yielding what is termed as ‘residuals’. These residuals
ranged from high positive values to high negative values. Positive residuals indicated that the
school had performed higher than would be expected of them and the opposite applied to
negative residuals. The schools were then arranged in the rank order based on residuals with
high positive values on top and high negative values at the bottom. A list all the schools
ranked from the most effective to the least effective in both subjects is in Appendix C. The
first 20 schools in each subject area were deemed ‘more effective’ and the last 20 schools as
‘less effective’
6.4 Twenty (20) Most Effective Schools in Reading and Mathematics
Table 12 below presents the actual and predicted school mean scores in reading and
mathematics and also the difference or ‘residual’ between the actual and predicted school
score for the twenty most effective schools in Zambia.

53
Table 12: Showing 20 Most effective Schools Ef
fect
iven
ess R
ank Reading Mathematics
School
SES Score
Actual Reading
Score Predicted
Score Residue School SES
Score
Actual Mathematics
Score Predicted
Score Residue
Mean Mean Mean Value Mean Mean Mean Value 1 2076 397.3 558.53 405.0 +154 2076 397.3 511.7 416.1 +95 2 9128 618.6 641.56 506.8 +135 4537 649.8 573.2 493.5 +80 3 4537 649.8 641.1 521.1 +120 5286 593.9 547.0 476.3 +71 4 6834 451.5 512.22 430.0 +82 9128 618.6 552.0 483.9 +68 5 5286 593.9 569.88 495.4 +74 7593 380.8 471.6 411.1 +61 6 2349 428.0 486.22 419.1 +67 3211 421.8 475.0 423.6 +51 7 2376 353.3 442.56 384.8 +58 1908 453.8 479.3 433.5 +46 8 3737 438.6 480.22 424.0 +56 3351 400.4 461.4 417.1 +44 9 4439 554.6 528.93 477.3 +52 2291 378.9 451.2 410.5 +41
10 3385 459.6 481.08 433.7 +47 3291 421.8 464.1 423.6 +40 11 3291 421.8 462.96 416.3 +47 3385 459.6 474.7 435.2 +39 12 972 561.0 527 480.3 +47 131 584.7 512.7 473.6 +39 13 4343 557.8 524.44 478.8 +46 972 561.0 503.7 466.3 +37 14 2291 378.9 436.37 396.6 +40 3737 438.6 465.0 428.8 +36 15 657 563.4 520.02 481.4 +39 2804 388.8 448.4 413.5 +35 16 7593 380.8 434.59 397.4 +37 2160 404.8 452.4 418.4 +34 17 3013 548.6 510.05 474.6 +35 656 440.4 462.7 429.3 +33 18 1981 396.4 439.82 404.6 +35 4180 471.0 471.3 438.7 +33 19 2160 404.8 441.94 408.4 +34 1981 396.4 448.1 415.9 +32 20 490 553.6 509.77 476.9 +33 4343 557.8 495.0 465.3 +30
Note that out of the 20 most effective schools, 13 are most effective in both reading and
mathematics. School 2076 is the most effective school in Zambia in both reading and
mathematics, because it ranks number 1. The school is +154 standard deviation points more
than it is expected (predicted) in reading and +96 standard deviation points more than
expected (predicted) in mathematics. The residuals of the 20 most effective are larger in
reading compared to mathematics and they range from +33 to +154 points in reading and +30
to +96 points in maths.
6.5 Twenty (20) Less Effective Schools in Reading and Mathematics
Table 13 below shows the last 20 least effective schools. Note that school 37 in reading and
school 482 in mathematics both have mean scores above the Zambia mean (mathematics –
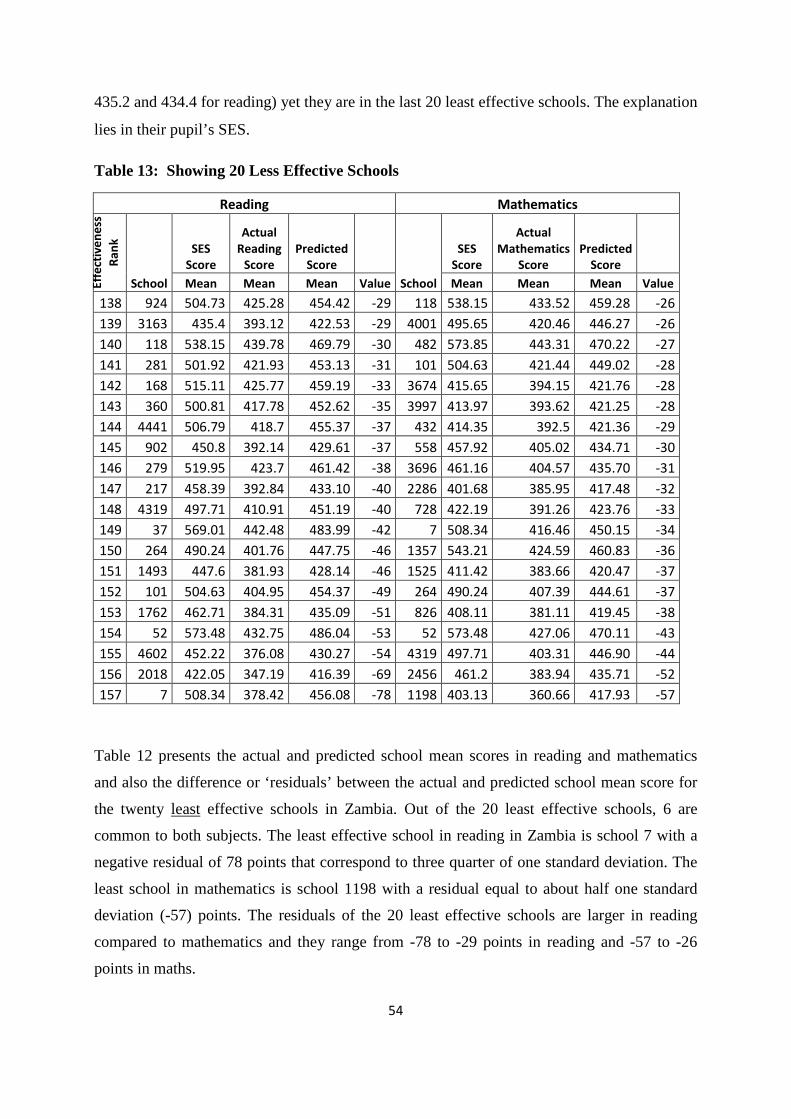
54
435.2 and 434.4 for reading) yet they are in the last 20 least effective schools. The explanation
lies in their pupil’s SES.
Table 13: Showing 20 Less Effective Schools
Reading Mathematics
Effe
ctiv
enes
s Ra
nk
School
SES Score
Actual Reading
Score Predicted
Score School
SES Score
Actual Mathematics
Score Predicted
Score Mean Mean Mean Value Mean Mean Mean Value
138 924 504.73 425.28 454.42 -29 118 538.15 433.52 459.28 -26 139 3163 435.4 393.12 422.53 -29 4001 495.65 420.46 446.27 -26 140 118 538.15 439.78 469.79 -30 482 573.85 443.31 470.22 -27 141 281 501.92 421.93 453.13 -31 101 504.63 421.44 449.02 -28 142 168 515.11 425.77 459.19 -33 3674 415.65 394.15 421.76 -28 143 360 500.81 417.78 452.62 -35 3997 413.97 393.62 421.25 -28 144 4441 506.79 418.7 455.37 -37 432 414.35 392.5 421.36 -29 145 902 450.8 392.14 429.61 -37 558 457.92 405.02 434.71 -30 146 279 519.95 423.7 461.42 -38 3696 461.16 404.57 435.70 -31 147 217 458.39 392.84 433.10 -40 2286 401.68 385.95 417.48 -32 148 4319 497.71 410.91 451.19 -40 728 422.19 391.26 423.76 -33 149 37 569.01 442.48 483.99 -42 7 508.34 416.46 450.15 -34 150 264 490.24 401.76 447.75 -46 1357 543.21 424.59 460.83 -36 151 1493 447.6 381.93 428.14 -46 1525 411.42 383.66 420.47 -37 152 101 504.63 404.95 454.37 -49 264 490.24 407.39 444.61 -37 153 1762 462.71 384.31 435.09 -51 826 408.11 381.11 419.45 -38 154 52 573.48 432.75 486.04 -53 52 573.48 427.06 470.11 -43 155 4602 452.22 376.08 430.27 -54 4319 497.71 403.31 446.90 -44 156 2018 422.05 347.19 416.39 -69 2456 461.2 383.94 435.71 -52 157 7 508.34 378.42 456.08 -78 1198 403.13 360.66 417.93 -57
Table 12 presents the actual and predicted school mean scores in reading and mathematics
and also the difference or ‘residuals’ between the actual and predicted school mean score for
the twenty least effective schools in Zambia. Out of the 20 least effective schools, 6 are
common to both subjects. The least effective school in reading in Zambia is school 7 with a
negative residual of 78 points that correspond to three quarter of one standard deviation. The
least school in mathematics is school 1198 with a residual equal to about half one standard
deviation (-57) points. The residuals of the 20 least effective schools are larger in reading
compared to mathematics and they range from -78 to -29 points in reading and -57 to -26
points in maths.

55
6.6 A Portrait of a More Effective School
This section compares the most effective schools and least effective schools based on the 28
indicators presented under section 5.1 in chapter in five. It also paints a picture of a more
effective school.
6.6.1 Pupil Characteristics at Home Table 14 below compares most effective and least effective schools with pupil characteristics at home.
Table 14: Comparing Least and Most Effective Schools with selected pupil characteristics at home
Indicators Reading Mathematics
Least Eff. Schools
Most Eff. Schools
Least Eff. Schools
Most Eff. Schools
Socio-economic Status (Mean) 429.6 485.6 469.8 471.0 Speak English at home (%) 79.2 74.6 71.3 73.2 Having attended Pre-school (%) 39.1 41.8 28.4 32.2 Meals per week (Mean) 10.5 10.5 10.5 10.6 Tuition in Mathematics (%) 12.9 7.7 3.7 12.5 Tuition in Science (%) 11.6 5.8 2.5 10.4 Tuition in Other subjects (%) 8.1 5.8 3.0 13.7 Used a Computer (%) 6.6 13.8 2.5 15.2 Shopping as a Task (%) 63.8 73.5 65.2 69 Comments:
Socio-economic Status (SES): First, in least effective schools in reading, the mean SES score
is below the overall mean score for Zambia of 464. On the other hand, the SES in most
effective schools is above the Zambian. The pupil profile in terms of SES in most effective
schools in reading is higher by 55 points compared to least effective schools. There isn’t
much difference in terms of SES in most effective schools in maths, though the SES in most
effective schools is slightly higher.
Speak English at home: Interestingly, there were slightly more schools with pupils speaking
English at home in less effective schools in both reading (79.2%) compared to more effective
schools (74.6%) in the same. The difference in the mathematics is quite minimal.
Tuition: Generally, the percentage of pupils attending tuition is very low in all the types of
schools in Zambia– less than 16%. The biggest difference between the most effective schools
and the least effective schools is in mathematics where there is around 10% more in most
effective schools. This means that despite low percentage of pupils taking tuition in Zambia,
there are more pupils doing so in most effective schools compared to least effective schools.

56
The SACMEQ III country report indicates a decline in extra-tuition from 55.2% to 12.7%
from SACMEQ II to III and recommends the burning of extra-tuition and enhancement of
remedial work in schools.
Computer: The same trend as tuition, there is a very low number of pupils using computers in
Zambia. The SACMEQ III country report indicates an increase in use of computers from
2.3% to 13.8% between SACMEQ II to III, which is still low. However, despite low
percentage of pupils using computers in Zambia, the percentage of pupils using computers in
most effective schools is higher by almost 10% compared to pupils in least effective school.
There were no significant differences between pupils attending most and least effective
schools in the other indicators.
6.6.2 School Resources and Characteristics Table 15 below presents the information on School Resources and Characteristics
Table 15: Comparing Least and Most Effective Schools with selected School Resources and Characteristics
Indicators Reading Mathematics
Least Eff. Schools
Most Eff. Schools
Least Eff. Schools
Most Eff. Schools
School resources index (mean) 440.6 449.7 429.6 438.3 At least “Comfortable” school resources level (%) 23,6 35,4 16,8 32,3 Nb. of pupils in shifts (max) 471 378 476 318 Number of Shifts (N) 3.2 1.4 2.9 2.3 Ratio of Girls (%) 0.49 0.48 0.50 0.48 School located in isolated/rural area (%) 45.0 60.0 50.0 75.0
School type - Government (%) 100.0 80.0 100.0 85.0 Comments:
School type: In terms of school type, all least effective schools are public while 20% and 15%
in reading and mathematics are not Government.
School located in isolated/rural area (%): The data in table 15 shows that there were slightly
more schools in located in isolated/rural areas in most effective schools (reading 60% and
mathematics 75%) as compared to less effective schools (45% for Reading and 50%
mathematics). The SACMEQ III country report indicates that the number of schools in rural

57
areas increased from 47.9 percent in SACMEQ II to 64.7 percent in SACMEQ III meaning
that there are more schools in rural areas.
School Resource Index: Zambia generally has a low resources index. Despite this fact, most
effective schools were more equipped as compared to the least effective schools.
Number of shifts and pupils in shifts: There were more shifts and more pupils in shifts in
least effective schools as compared to most effective schools. The presence of more than one
shift in some schools, especially urban schools are more to do with inadequate number of
classrooms and not the shortage of teachers because urban schools are sometimes over-
staffed, especially by female teachers.
There were no significant differences between pupils attending most and least effective schools in the other indicators.
6.6.3 Teacher Characteristics Table 16 below presents the information on Teacher Characteristics. Table 16: Comparing Least and Most Effective Schools with selected Teacher Characteristics
Indicators Reading Mathematics
Least Eff. Schools
Most Eff. Schools
Least Eff. Schools
Most Eff. Schools
Teacher professional training (mean) 2.0 yrs 2.2 yrs 2.0 yrs 2.2 yrs Teachers giving homework most of the days (%) 39.4 31.7 31.2 37.5 Teachers correcting Homework most times (%) 56 51.1 50.4 56.7 Teacher asking parents to sign homework (%) 68.6 66 65.8 54.2
Comments :
Teacher training: In general, the data shows that the level of teacher training in Zambian
schools is very low at 2 years. This issue has been debated by many major educational
stakeholders for some time in Zambia in which most have argued that the 2-year training (1-
year pedagogy and 1-year teaching practice) offered by the ZATEC (Zambia Teacher
Education Course) programme was inadequate to meet the demands of the primary sector.
The Zambia Teacher Education Strategy Report (MOE 2005 P. 13) attributed the
underperformance of teachers to “Short duration of training programmes” and “Poor quality
of training curriculum that does not provide an effective balance between content and
pedagogy of teaching”.
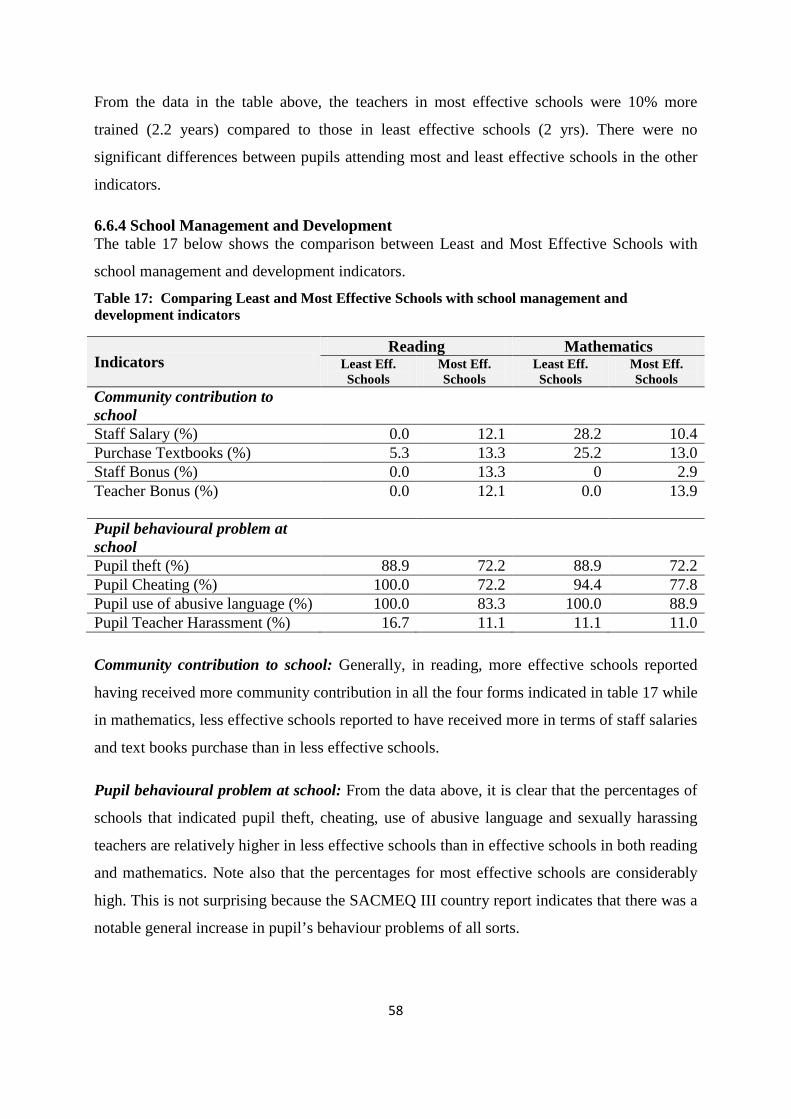
58
From the data in the table above, the teachers in most effective schools were 10% more
trained (2.2 years) compared to those in least effective schools (2 yrs). There were no
significant differences between pupils attending most and least effective schools in the other
indicators.
6.6.4 School Management and Development The table 17 below shows the comparison between Least and Most Effective Schools with
school management and development indicators.
Table 17: Comparing Least and Most Effective Schools with school management and development indicators
Indicators Reading Mathematics
Least Eff. Schools
Most Eff. Schools
Least Eff. Schools
Most Eff. Schools
Community contribution to school
Staff Salary (%) 0.0 12.1 28.2 10.4 Purchase Textbooks (%) 5.3 13.3 25.2 13.0 Staff Bonus (%) 0.0 13.3 0 2.9 Teacher Bonus (%)
0.0
12.1
0.0
13.9
Pupil behavioural problem at school
Pupil theft (%) 88.9 72.2 88.9 72.2 Pupil Cheating (%) 100.0 72.2 94.4 77.8 Pupil use of abusive language (%) 100.0 83.3 100.0 88.9 Pupil Teacher Harassment (%) 16.7 11.1 11.1 11.0
Community contribution to school: Generally, in reading, more effective schools reported
having received more community contribution in all the four forms indicated in table 17 while
in mathematics, less effective schools reported to have received more in terms of staff salaries
and text books purchase than in less effective schools. Pupil behavioural problem at school: From the data above, it is clear that the percentages of
schools that indicated pupil theft, cheating, use of abusive language and sexually harassing
teachers are relatively higher in less effective schools than in effective schools in both reading
and mathematics. Note also that the percentages for most effective schools are considerably
high. This is not surprising because the SACMEQ III country report indicates that there was a
notable general increase in pupil’s behaviour problems of all sorts.

59
6.7 What were the Characteristics of School Effectiveness?
Below is a summary of what distinguished more effective schools from less effective schools:
Pupils:
• They had relatively higher socio-economic status
• They had around 10% more access to tuition
• They had around 10% more in terms of computer usage
• They relatively behaved well compared to those in less effective schools
Teachers:
• They were professionally trained longer by 10%
Schools:
• They had more resources (high School Resource Index) relative to less effective
schools
• They had less number of shits and less pupils per shift relative to less effective schools
• 60% in reading and 75% in mathematics were located in isolated or rural areas
• 20% in reading and 15% in mathematics were not Government owned.
6.8 Conclusion
In conclusion, a more effective school was one which had pupils with relatively higher socio-
economic status; teachers trained slightly longer than the official 2-years, less shifts and had
some of their intakes with slightly more access to tuitions and computers. The schools also
had pupils who were relatively well – behaved. In terms of location, 60% of the most
effective schools in reading and 75% in mathematics were located in rural or isolated areas
while 20% in reading and 15% in mathematics were not Government owned.
6.9 Policy Suggestions for achieving School Effectiveness in Zambia.
What then would be the policy recommendations for planners and policy makers? The
planners and policy makers would be looking for areas within their power to change using
Government policy. Below is a list of policy suggestions:
60
• Strengthen remedial works in order to compensate for the loss of tuitions which have
been banned in schools.
• Scaling-up the planned programme of upgrading all the 2-year trained teachers to
diploma and first degree
• Restocking and equipping of schools with teaching and learning materials, furniture,
water, office equipment, electricity, school buildings and all other necessary school
resources including computers.
• Introduction of accountability in Government schools as is the case with private
schools where school principals are expected to show results.
• Ensuring that the schools have pupil discipline code of conduct which should be
enforced by School principals.
• Introduction of a system of fairly ranking schools according to performance as a way
of holding them accountable for pupil performance
• Construction of more classrooms and recruitment of more teachers in affected schools
in order to eliminate double or triple-shifts
• Need for a long term rural development plan which should include rural electrification
and adult education to address the issues contained in the ZPSESSCR indicator.

61
CHAPTER SEVEN: SUMMARY AND CONCLUSION
This study started first by correlating a total of 151 indicators with school mean scores in
order to determine those that had significant positive association with school mean scores.
Out of the 151 indicators correlated, only 28 satisfied the two criterion set namely having a
minimum correlation coefficient of +0.05 and also being common to both reading and
mathematics. The 28 indicators were then categorised into four groups namely pupil
characteristics at home, school resources and characteristics, Teacher characteristics and
school management and development.
The study then proceeded by identifying more effective and less effective schools based on
their mean scores and the socio-economic status of the pupils that they served. Out of all the
schools that performed above what was expected of them, only the first 20 were classified as
‘Most Effective’ schools. In the same way, out of all the schools that performed below what
was expected of them only the last 20 were classified as ‘Less Effective’ schools. Finally,
each category of the four indicators mentioned above was analysed with respect to more
effective and less effective schools in order to find out how they differed in each type of
schools (most and least effective). The differences differentiating most effective schools from
less effective schools based on the four categories of indicators are discussed and presented in
chapter six. A portrait of the most effective schools has been painted and recommendations
for achieving a more effective school have also been put forward.
In doing so, the fact still remains that all the 28 indicators have a positive relation with school
mean scores and that these are what planners may focus on when planning for improving
learning achievements. In conclusion, this section looks at the research questions set out in the
beginning of this study and see if they have all been satisfied.
7.1 Indicators with strongest association with pupil mean scores
It is the view of this study that all the 28 indicators categorised into the four groups namely
pupil characteristics at home, school resources and characteristics, Teacher characteristics and
school management and development must be taken into consideration when planning for
school effectiveness and improvement of learning achievements because they consistently
showed greater association with school mean score as compared to the other indicators.
However, the indicators relating to pupil discipline must be interpreted cautiously. The
SACMEQ III country report indicates that there was a notable general increase in pupil’s

62
behaviour problems of all sorts in all the schools. This means that this increase was common
to both more effective and less effective schools. Pupil’s behaviour problems can erode other
good measures that the school may have and therefore should be kept in check.
7.2 Indicators most differentiating between more effective and less effective schools
Out of the 28 indicators analysed, pupil SES, school resources, extra tuition, pupil use of a
computer, teacher number of years of professional training, number of pupils in a shift,
number of shifts, school type and location had a differentiating effect between more effective
and less effective schools.
7.3 The extent to which pupil home background account for School performance
As discussed in chapter six, the pupil SES accounted for 38.8% of the reading scores and
32.9% of the mathematics scores. The point of the pupil SES accounting for the biggest share
of the school average scores proves a very well-researched fact that pupil SES is a big
determinant in pupil performance. Considering that 64.7% of the schools are located in rural
areas where most parents are poor and less educated, this situation can be mitigated by
intensifying remedial works targeting pupils coming from under-privileged families.
7.4 The extent to which School Resources account for performance in schools
School mean scores were regressed on school resources and results showed that school
resources accounted for 17.4% of the reading and 9.3% of the mathematics (Appendix B)
scores respectively. The SACMEQ III country report indicates a general decrease in the
supplier of education materials relative to SACMEQ II. It is therefore important for
Government to consider increasing school teaching and learning materials in schools.
7.5 What indicators (changeable by government policy) should planners focus on most when planning for school effectiveness?
The study has found that all indicators are changeable by Government policy except those that
fall under ‘pupil characteristics at home’. The fact remains that it is not easy to have the
children coming from under privileged families learn. Considering that about around 64.7%
of the schools are located in rural areas where parents are less educated and poor, yet a large
percentage of their performance is accounted for by the SES, it is a big obstacle for Zambia in
achieving quality of education. However, as explained above, this problem can be mitigated
63
by Government policy through remedial works targeting slow learners and disadvantaged
pupils.
7.6 Conclusion
School effectiveness studies are aimed at improving school effectiveness which is measured
by pupil academic performance. In order to make schools perform their core purpose of
educating the future generation, they should be assessed and compared to each other from
time to time. Assessing and comparing schools based on raw school mean scores is not only
unfair but fails to bring out the realities surrounding them. This study has shown that actually,
it is not the schools with highest mean scores that are more effective but that it is those that
‘add value’ to their intakes. It has also detailed the factors that differentiate more effective
schools from less effective schools. The study has also shown key indicators that are
associated with higher school mean scores and which planners can use to improve school
effectiveness and consequently learning achievements. Furthermore, the study has shown how
much pupil socio-economic status and school resources account for pupil performance. It has
also established that most of the indicators having greater association with school mean scores
are changeable through Government policy. It is hoped that the study will contribute to
current initiatives that are being put in place by Government to improve the quality of
education in Zambia.
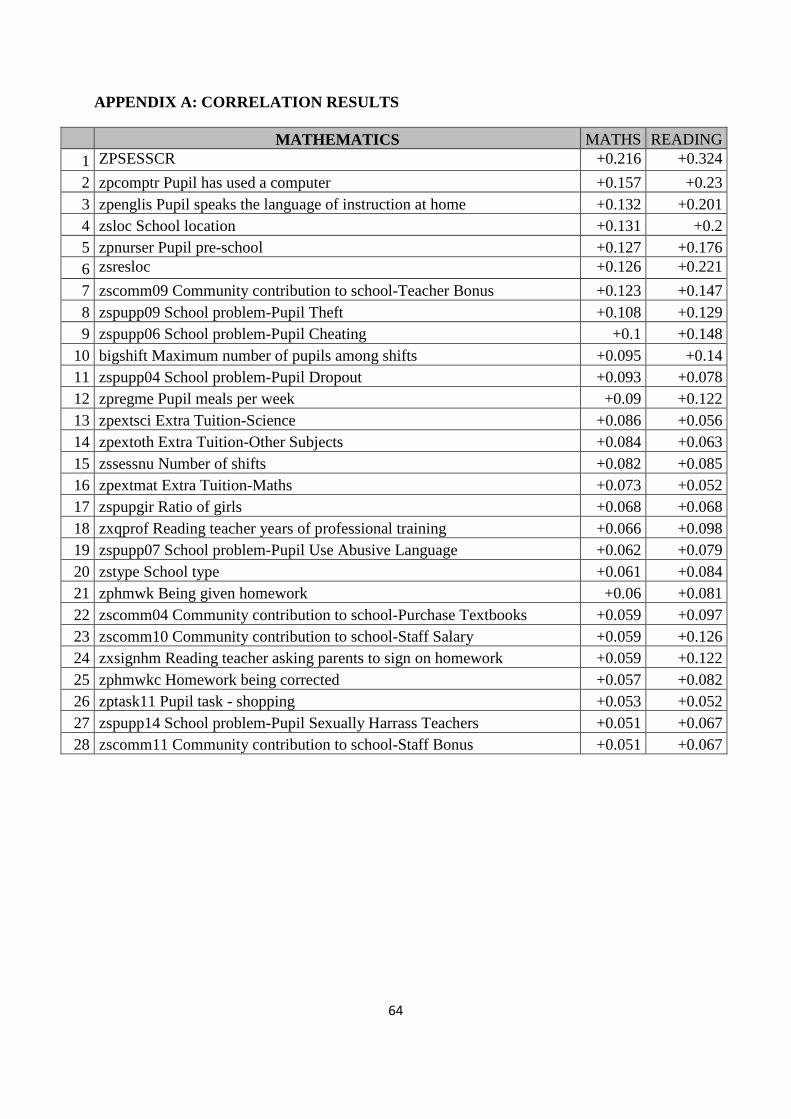
64
APPENDIX A: CORRELATION RESULTS
MATHEMATICS MATHS READING
1 ZPSESSCR +0.216 +0.324 2 zpcomptr Pupil has used a computer +0.157 +0.23 3 zpenglis Pupil speaks the language of instruction at home +0.132 +0.201 4 zsloc School location +0.131 +0.2 5 zpnurser Pupil pre-school +0.127 +0.176 6 zsresloc +0.126 +0.221 7 zscomm09 Community contribution to school-Teacher Bonus +0.123 +0.147 8 zspupp09 School problem-Pupil Theft +0.108 +0.129 9 zspupp06 School problem-Pupil Cheating +0.1 +0.148
10 bigshift Maximum number of pupils among shifts +0.095 +0.14 11 zspupp04 School problem-Pupil Dropout +0.093 +0.078 12 zpregme Pupil meals per week +0.09 +0.122 13 zpextsci Extra Tuition-Science +0.086 +0.056 14 zpextoth Extra Tuition-Other Subjects +0.084 +0.063 15 zssessnu Number of shifts +0.082 +0.085 16 zpextmat Extra Tuition-Maths +0.073 +0.052 17 zspupgir Ratio of girls +0.068 +0.068 18 zxqprof Reading teacher years of professional training +0.066 +0.098 19 zspupp07 School problem-Pupil Use Abusive Language +0.062 +0.079 20 zstype School type +0.061 +0.084 21 zphmwk Being given homework +0.06 +0.081 22 zscomm04 Community contribution to school-Purchase Textbooks +0.059 +0.097 23 zscomm10 Community contribution to school-Staff Salary +0.059 +0.126 24 zxsignhm Reading teacher asking parents to sign on homework +0.059 +0.122 25 zphmwkc Homework being corrected +0.057 +0.082 26 zptask11 Pupil task - shopping +0.053 +0.052 27 zspupp14 School problem-Pupil Sexually Harrass Teachers +0.051 +0.067 28 zscomm11 Community contribution to school-Staff Bonus +0.051 +0.067

65
APPENDIX B: REGRESSION ANALYSIS ON SCHOOL MEAN SCORES AND SCHOOLS RESOURCES
Regression Analysis – School Resource on Reading
The graph below shows regression analysis of school mean score (zralocp) on school mean
resources ZSRESLOC_mean2.
School mean score in Reading against School Resource Composite Indicator
From the graph above, the line has a coefficient of determination of 0.174. Statistically, it
means that 17.4% of the variation in reading scores is accounted for by School Resources.
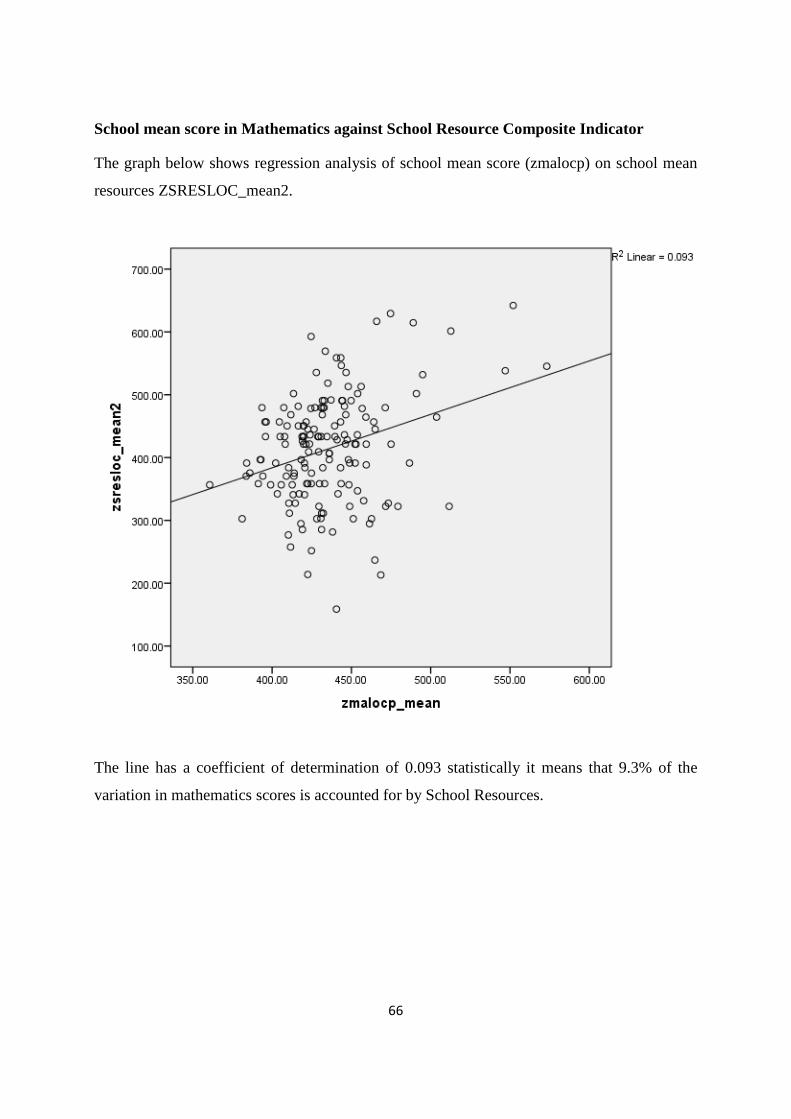
66
School mean score in Mathematics against School Resource Composite Indicator
The graph below shows regression analysis of school mean score (zmalocp) on school mean
resources ZSRESLOC_mean2.
The line has a coefficient of determination of 0.093 statistically it means that 9.3% of the
variation in mathematics scores is accounted for by School Resources.
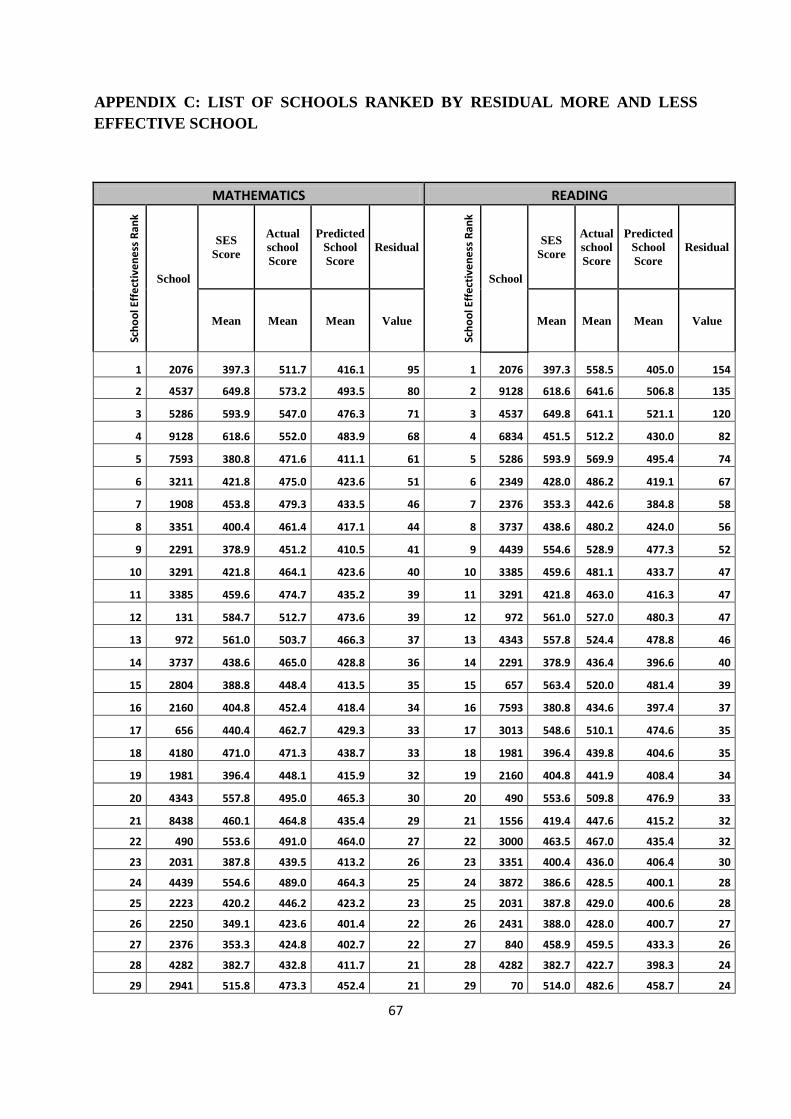
67
APPENDIX C: LIST OF SCHOOLS RANKED BY RESIDUAL MORE AND LESS EFFECTIVE SCHOOL
MATHEMATICS READING
Scho
ol E
ffec
tiven
ess R
ank
School
SES Score
Actual school Score
Predicted School Score
Residual
Scho
ol E
ffec
tiven
ess R
ank
School
SES Score
Actual school Score
Predicted School Score
Residual
Mean Mean Mean Value Mean Mean Mean Value
1 2076 397.3 511.7 416.1 95 1 2076 397.3 558.5 405.0 154
2 4537 649.8 573.2 493.5 80 2 9128 618.6 641.6 506.8 135
3 5286 593.9 547.0 476.3 71 3 4537 649.8 641.1 521.1 120
4 9128 618.6 552.0 483.9 68 4 6834 451.5 512.2 430.0 82
5 7593 380.8 471.6 411.1 61 5 5286 593.9 569.9 495.4 74
6 3211 421.8 475.0 423.6 51 6 2349 428.0 486.2 419.1 67
7 1908 453.8 479.3 433.5 46 7 2376 353.3 442.6 384.8 58
8 3351 400.4 461.4 417.1 44 8 3737 438.6 480.2 424.0 56
9 2291 378.9 451.2 410.5 41 9 4439 554.6 528.9 477.3 52
10 3291 421.8 464.1 423.6 40 10 3385 459.6 481.1 433.7 47
11 3385 459.6 474.7 435.2 39 11 3291 421.8 463.0 416.3 47
12 131 584.7 512.7 473.6 39 12 972 561.0 527.0 480.3 47
13 972 561.0 503.7 466.3 37 13 4343 557.8 524.4 478.8 46
14 3737 438.6 465.0 428.8 36 14 2291 378.9 436.4 396.6 40
15 2804 388.8 448.4 413.5 35 15 657 563.4 520.0 481.4 39
16 2160 404.8 452.4 418.4 34 16 7593 380.8 434.6 397.4 37
17 656 440.4 462.7 429.3 33 17 3013 548.6 510.1 474.6 35
18 4180 471.0 471.3 438.7 33 18 1981 396.4 439.8 404.6 35
19 1981 396.4 448.1 415.9 32 19 2160 404.8 441.9 408.4 34
20 4343 557.8 495.0 465.3 30 20 490 553.6 509.8 476.9 33
21 8438 460.1 464.8 435.4 29 21 1556 419.4 447.6 415.2 32
22 490 553.6 491.0 464.0 27 22 3000 463.5 467.0 435.4 32
23 2031 387.8 439.5 413.2 26 23 3351 400.4 436.0 406.4 30
24 4439 554.6 489.0 464.3 25 24 3872 386.6 428.5 400.1 28
25 2223 420.2 446.2 423.2 23 25 2031 387.8 429.0 400.6 28
26 2250 349.1 423.6 401.4 22 26 2431 388.0 428.0 400.7 27
27 2376 353.3 424.8 402.7 22 27 840 458.9 459.5 433.3 26
28 4282 382.7 432.8 411.7 21 28 4282 382.7 422.7 398.3 24
29 2941 515.8 473.3 452.4 21 29 70 514.0 482.6 458.7 24
68
30 1556 419.4 443.2 422.9 20 30 433 450.2 452.3 429.3 23
31 3872 386.6 432.9 412.9 20 31 6661 495.2 472.9 450.0 23
32 657 563.4 486.6 467.0 20 32 2804 388.8 423.7 401.1 23
33 1644 475.6 459.3 440.1 19 33 2223 420.2 437.8 415.6 22
34 807 458.6 453.7 434.9 19 34 8438 460.1 453.1 433.9 19
35 2776 388.4 428.2 413.4 15 35 966 561.1 499.2 480.3 19
36 3111 404.0 432.3 418.2 14 36 633 427.9 437.9 419.1 19
37 1735 425.9 438.1 424.9 13 37 1908 453.8 449.5 431.0 18
38 1830 464.9 448.9 436.8 12 38 4090 382.0 415.8 398.0 18
39 4090 382.0 423.0 411.4 12 39 1644 475.6 457.0 441.0 16
40 696 451.7 443.5 432.8 11 40 4180 471.0 454.0 438.9 15
41 3849 406.2 429.4 418.9 11 41 3997 414.0 427.0 412.7 14
42 2349 428.0 436.0 425.5 10 42 2250 349.1 397.0 382.9 14
43 3000 463.5 446.4 436.4 10 43 131 584.7 505.1 491.2 14
44 2829 425.8 434.6 424.9 10 44 1860 403.6 421.6 407.9 14
45 840 458.9 444.4 435.0 9 45 2829 425.8 431.7 418.1 14
46 4602 452.2 441.6 433.0 9 46 1735 425.9 431.6 418.2 13
47 2579 379.2 419.1 410.6 9 47 3593 385.7 412.0 399.7 12
48 3453 451.0 440.6 432.6 8 48 278 519.2 473.3 461.1 12
49 235 448.8 439.7 431.9 8 49 4172 432.0 432.9 421.0 12
50 1212 423.8 431.9 424.3 8 50 2121 426.5 428.4 418.4 10
51 1041 437.6 436.0 428.5 7 51 1075 474.5 450.1 440.5 10
52 1387 438.8 436.1 428.8 7 52 4208 426.9 428.0 418.6 9
53 938 514.3 459.1 452.0 7 53 3543 415.0 422.0 413.1 9
54 6661 495.2 452.9 446.1 7 54 1926 429.6 428.6 419.9 9
55 165 547.9 468.5 462.3 6 55 3909 428.1 426.8 419.2 8
56 995 512.9 457.7 451.5 6 56 2941 515.8 466.9 459.5 7
57 633 427.9 431.2 425.5 6 57 3211 421.8 423.0 416.3 7
58 2441 460.2 441.0 435.4 6 58 2579 379.2 401.7 396.7 5
59 3226 395.1 420.7 415.5 5 59 3226 395.1 408.4 404.0 4
60 1632 406.8 423.9 419.0 5 60 3849 406.2 413.2 409.1 4
61 433 450.2 437.2 432.3 5 61 4681 448.9 432.8 428.7 4
62 4172 432.0 431.6 426.8 5 62 128 543.5 476.0 472.2 4
63 1860 403.6 421.8 418.1 4 63 3339 393.3 406.7 403.1 4
64 2955 435.9 431.2 428.0 3 64 1418 455.6 435.2 431.8 3
65 271 478.4 443.2 441.0 2 65 1041 437.6 426.5 423.6 3
66 70 514.0 453.9 451.9 2 66 696 451.7 431.6 430.0 2
67 1819 523.7 456.8 454.9 2 67 3111 404.0 408.4 408.1 0
68 3604 436.0 429.5 428.0 2 68 1632 406.8 409.4 409.4 0
69 3493 435.7 429.3 427.9 1 69 656 440.4 424.7 424.8 0
70 4681 448.9 433.1 432.0 1 70 1323 411.3 410.9 411.4 -1
71 1540 415.9 422.5 421.8 1 71 3493 435.7 420.8 422.6 -2
72 279 520.0 454.0 453.7 0 72 3043 403.2 405.1 407.7 -3
73 188 514.9 452.2 452.1 0 73 1603 443.2 423.4 426.1 -3

69
74 179 507.4 449.8 449.9 0 74 2706 452.4 427.4 430.4 -3
75 1603 443.2 429.9 430.2 0 75 3596 409.6 406.6 410.7 -4
76 966 561.1 465.9 466.3 0 76 3604 436.0 418.4 422.8 -4
77 1926 429.6 424.7 426.0 -1 77 1830 464.9 431.5 436.1 -5
78 3596 409.6 418.1 419.9 -2 78 1357 543.2 466.7 472.1 -5
79 1282 413.1 418.3 421.0 -3 79 826 408.1 403.8 410.0 -6
80 2438 420.8 420.0 423.3 -3 80 2258 476.7 435.2 441.5 -6
81 1942 460.3 431.7 435.5 -4 81 391 426.4 412.0 418.4 -6
82 3075 457.9 431.0 434.7 -4 82 271 478.4 435.4 442.3 -7
83 921 516.6 448.9 452.7 -4 83 933 542.1 463.4 471.6 -8
84 3654 422.5 419.9 423.9 -4 84 3075 457.9 424.6 432.9 -8
85 3543 415.0 417.1 421.5 -4 85 415 427.5 410.2 418.9 -9
86 3941 440.6 424.4 429.4 -5 86 1819 523.7 454.2 463.1 -9
87 2431 388.0 408.3 413.3 -5 87 4552 549.5 465.8 475.0 -9
88 1493 447.6 426.5 431.5 -5 88 1387 438.8 414.8 424.1 -9
89 2121 426.5 419.8 425.1 -5 89 2776 388.4 390.9 400.9 -10
90 4024 515.9 446.6 452.5 -6 90 3654 422.5 405.8 416.6 -11
91 3909 428.1 419.7 425.6 -6 91 1942 460.3 422.8 434.0 -11
92 3013 548.6 456.2 462.5 -6 92 1978 472.5 428.1 439.6 -11
93 3043 403.2 410.9 418.0 -7 93 2955 435.9 411.1 422.8 -12
94 3897 513.8 444.0 451.8 -8 94 1237 421.1 403.9 416.0 -12
95 4088 395.9 407.9 415.7 -8 95 235 448.8 416.5 428.7 -12
96 4667 410.3 411.6 420.1 -8 96 807 458.6 420.2 433.2 -13
97 1075 474.5 430.8 439.8 -9 97 179 507.4 442.6 455.7 -13
98 278 519.2 443.7 453.5 -10 98 3941 440.6 411.0 424.9 -14
99 3658 438.3 418.9 428.7 -10 99 1198 403.1 393.3 407.7 -14
100 2018 422.1 413.3 423.7 -10 100 2438 420.8 401.3 415.8 -14
101 4208 426.9 414.6 425.2 -11 101 2916 450.2 414.8 429.3 -14
102 1318 400.1 405.8 417.0 -11 102 4088 395.9 389.8 404.3 -15
103 391 426.4 413.8 425.0 -11 103 3696 461.2 419.2 434.4 -15
104 1762 462.7 424.8 436.2 -11 104 2456 461.2 418.4 434.4 -16
105 945 535.5 445.6 458.5 -13 105 1212 423.8 400.9 417.2 -16
106 1094 430.5 412.7 426.3 -14 106 3442 498.6 435.2 451.6 -16
107 2733 463.0 422.6 436.3 -14 107 2286 401.7 389.6 407.0 -17
108 924 504.7 435.1 449.0 -14 108 1157 416.3 395.9 413.7 -18
109 1418 455.6 419.1 434.0 -15 109 1318 400.1 388.4 406.3 -18
110 217 458.4 419.8 434.9 -15 110 1803 438.4 405.8 423.9 -18
111 128 543.5 445.6 460.9 -15 111 165 547.9 455.9 474.3 -18
112 4552 549.5 447.3 462.8 -15 112 432 414.4 394.3 412.8 -19
113 3442 498.6 430.9 447.2 -16 113 1282 413.1 393.4 412.3 -19
114 3593 385.7 395.8 412.6 -17 114 945 535.5 448.8 468.6 -20
115 21 594.5 459.4 476.5 -17 115 4667 410.3 391.0 411.0 -20
116 3163 435.4 410.3 427.8 -18 116 938 514.3 438.7 458.8 -20
117 4441 506.8 432.0 449.7 -18 117 2733 463.0 414.3 435.2 -21
70
118 3769 474.6 421.3 439.8 -18 118 3453 451.0 408.6 429.7 -21
119 902 450.8 413.9 432.5 -19 119 21 594.5 474.4 495.7 -21
120 1803 438.4 409.5 428.7 -19 120 3897 513.8 436.9 458.6 -22
121 281 501.9 428.9 448.2 -19 121 3658 438.3 401.0 423.9 -23
122 933 542.1 440.5 460.5 -20 122 921 516.6 436.2 459.9 -24
123 2258 476.7 420.3 440.5 -20 123 995 512.9 434.3 458.2 -24
124 37 569.0 448.0 468.7 -21 124 728 422.2 392.0 416.5 -24
125 3943 446.7 410.4 431.3 -21 125 558 457.9 408.4 432.9 -24
126 2706 452.4 411.8 433.0 -21 126 3566 470.7 414.3 438.8 -25
127 3339 393.3 392.9 414.9 -22 127 188 514.9 433.9 459.1 -25
128 6834 451.5 410.6 432.8 -22 128 4024 515.9 434.2 459.6 -25
129 1978 472.5 416.5 439.2 -23 129 3769 474.6 414.5 440.5 -26
130 415 427.5 402.3 425.4 -23 130 482 573.9 460.1 486.2 -26
131 2916 450.2 409.0 432.3 -23 131 3674 415.7 387.4 413.4 -26
132 168 515.1 427.9 452.2 -24 132 1525 411.4 385.0 411.5 -26
133 1237 421.1 399.1 423.4 -24 133 1540 415.9 387.0 413.6 -27
134 1323 411.3 395.5 420.4 -25 134 2441 460.2 407.3 433.9 -27
135 3566 470.7 413.5 438.6 -25 135 3943 446.7 400.8 427.7 -27
136 360 500.8 422.5 447.8 -25 136 4001 495.7 422.4 450.2 -28
137 1157 416.3 396.3 421.9 -26 137 1094 430.5 391.9 420.3 -28
138 118 538.2 433.5 459.3 -26 138 924 504.7 425.3 454.4 -29
139 4001 495.7 420.5 446.3 -26 139 3163 435.4 393.1 422.5 -29
140 482 573.9 443.3 470.2 -27 140 118 538.2 439.8 469.8 -30
141 101 504.6 421.4 449.0 -28 141 281 501.9 421.9 453.1 -31
142 3674 415.7 394.2 421.8 -28 142 168 515.1 425.8 459.2 -33
143 3997 414.0 393.6 421.2 -28 143 360 500.8 417.8 452.6 -35
144 432 414.4 392.5 421.4 -29 144 4441 506.8 418.7 455.4 -37
145 558 457.9 405.0 434.7 -30 145 902 450.8 392.1 429.6 -37
146 3696 461.2 404.6 435.7 -31 146 279 520.0 423.7 461.4 -38
147 2286 401.7 386.0 417.5 -32 147 217 458.4 392.8 433.1 -40
148 728 422.2 391.3 423.8 -33 148 4319 497.7 410.9 451.2 -40
149 7 508.3 416.5 450.2 -34 149 37 569.0 442.5 484.0 -42
150 1357 543.2 424.6 460.8 -36 150 264 490.2 401.8 447.8 -46
151 1525 411.4 383.7 420.5 -37 151 1493 447.6 381.9 428.1 -46
152 264 490.2 407.4 444.6 -37 152 101 504.6 405.0 454.4 -49
153 826 408.1 381.1 419.5 -38 153 1762 462.7 384.3 435.1 -51
154 52 573.5 427.1 470.1 -43 154 52 573.5 432.8 486.0 -53
155 4319 497.7 403.3 446.9 -44 155 4602 452.2 376.1 430.3 -54
156 2456 461.2 383.9 435.7 -52 156 2018 422.1 347.2 416.4 -69
157 1198 403.1 360.7 417.9 -57 157 7 508.3 378.4 456.1 -78

71
REFFERENCES
Bartlett S. 2010. Improving Learning Achievement in Early Primary in Low-Income Countries: A Review of the Research. Aga Khan Foundation. Belgium.
Cheng, Y.C. 1993. Conceptualization and measurement of school effectiveness: and organizational perspective. Atlanta.AERA.
Dolata. S. .2005. Construction and Validation of Pupil Socioeconomic Status Index for SACMEQ Education Systems. IIEP. Paris
Eff E.A. 2004. A Flexible-Weights School Effectiveness Index. Department of Economics and Finance Working Paper Series. JEL category 120
Examinations Council of Zambia. 2000. Learning Achievement at the Middle Basic Level, 2008 Final report on Zambia’s National Assessment Report. Lusaka. Ministry of Education.
Fitz-Gibbon. C.T .1996.Monitoring School Effectiveness: Simplicity and complexity. In Research on school effectiveness and school improvement (pp74 – 92). London: Cassell.
Government of the Republic of Zambia, 2007. Fifth National Development Plan 2006-2010. Government of the Republic of Zambia
Government of the Republic of Zambia, Zambia. 2010. Sixth National Development Plan, 2011–2015. Lusaka. Government of the Republic of Zambia.
Government of the Republic of Zambia. 2011. 2010 Census of Population and housing. Lusaka. Government of the Republic of Zambia
Hanushek. E.A. 1995. Interpreting recent research on schooling in developing countries. In: The World Bank Research Observer, 10 pp.227 - 247
Hara S.R. and Burke D.J.1998. Parent involvement: Key to Improve student Achievement. In: School Community Journal. Vol. 8 no. 2 Fall/winter 1998
Hungi, Makuwa, Ross, Saito, Dolata, Van Cappelle, Paviot, & Vellien, 2010. Pupil
Achievement Results. SACMEQ Working document n°2.
IIEP 2010. In search of quality: what the data tell us. In: IIEP Newsletter.Vol. XXVIII, No. 3
September-December 2010.

72
IOB Evaluation Report. 2011. Unfinished business: Making a difference in basic education, The Hague. Ministry of Foreign Affairs of the Netherlands
Kennedy E.and Durland M. 1999. Validation of competing Statistical Formulation of School Effectiveness, A paper presented at a meeting American Educational Research Association, Montreal.
Makuwa, 2011. What are the levels and trends in reading and mathematics achievement?
SACMEQ Policy Issues Series.
Ministry of Education .2005. The SACMEQ II Project in Kenya: A study of the Conditions of Schooling and the Quality of Education. Ministry of Education. Nairobi
Ministry of Education, 2007, National Implementation Framework 2006-2010. Lusaka.Ministry of Education.
Ministry of Education, 2010. 2010 Educational Statistical Bulletin, Ministry of Education, Lusaka: Ministry of Education
Ministry of Education, Zambia. 1996. Educating Our Future. Lusaka. Republic of Zambia.
Ministry of Education, Zambia. 2010. National Implementation Framework 2010-2015. Lusaka. Government of the Republic of Zambia.
Ministry of Education. 2005. Zambia Teacher Education Strategy Final Report. Ministry of Education. Lusaka.
Ministry of Education.2005. Principles of Education Boards, Governance and Management Manual. Education Boards Services. Ministry of Education. Lusaka
Ministry of Finance and National Planning. 2011. Annual Economic Report, 2010. Lusaka. Ministry of Finance and National Planning
Ministry of Health. 2007. Zambia Health Demographic Survey Report. Lusaka. Ministry of Health.
Moloi and Chetty 2012 The conduct of the SACMEQ III project. Ch. 3 of SACMEQ South Africa report
Musonda B.and Kaba. A. The SACMEQ III project in Zambia, A Study of the conditions of
schooling and the quality of education, Lusaka,

73
New Economia, LLC 2010. Zambia 2010. New York.
Njora Hungi. 2011. Accounting for Variations in the Quality of Primary School Education. Working Paper7, SACMEQ. Paris.
Pamela Sammons .2007. School Effectiveness and Equity: Making Connections. CfBT Education Trust, Berkshire.
Postlethwaite T. N. and Ross K. N. 1992. Effective Schools in Reading –Implications for Educational Planners. German: The International Association for the Evaluation of Educational Achievement.
Riddle .A. 1997. Assessing designs for school effectiveness research and school improvement in developing countries. In: Comparative Education Review, 4 (2) pp.178 – 204.
Ross, Saito, Dolata, Ikeda, Zuze, Murimba, Postlethwaite & Griffin, 2005. The conduct of the
SACMEQ II project. Ch. 2 of SACMEQ Reports
Saito M. 2007. Construction and Application of SACMEQ School Resources: Portray of
School Systems based on the Rasch Scaling Technique. In: CICE, Hiroshima University Journal of International Cooperation in Education Vol. 10 No. 1
Scheerens, J. 2000. Improving School Effectiveness. Paris: UNESCO/International Institute for Educational Planning.
Uline C.L; Miller M.M; Tschannen-Moran M. (1998), School Effectiveness: The underlying Dimensions In: Educational Administration Quarterly, Vol.34 No.4 (462-483)
UNESCO (United Nations Educational Scientific and Cultural Organisation). 2000. The Darker Framework for Action : Education for All -Meeting our collective commitments. World Education Forum, Dakar, Senegal (April 26 – 28). Paris: UNESCO.
Africanews.com (14th July 2011). Zambia attains middle-income status. Retrieved 13th April
2012 from http://www.africanews.com/site/list_message/35060
Rowe K.J (n.d.) Assessment, Performance Indicators, 'League Tables', 'Value-added'
Measures and School Effectiveness? Consider the Issues and 'Let's Get Real'! Retrieved 17th
April, 2012 from http://www.aare.edu.au/99pap/row99656.htm