
SCHMOLZ + BICKENBACH€¦ · situations, for example. ... April 26, 2018 Annual General Meeting,...
21
SCHMOLZ + BICKENBACH Q3 2017 Results – Investors & Analysts Conference Call Lucerne, November 9, 2017
Transcript of SCHMOLZ + BICKENBACH€¦ · situations, for example. ... April 26, 2018 Annual General Meeting,...
SCHMOLZ + BICKENBACHQ3 2017 Results – Investors & Analysts Conference CallLucerne, November 9, 2017
Disclaimer
Forward-looking statements
This presentation contains forward-looking statements about developments, plans, intentions, assumptions, expectations, convictions, possible impacts or the description of future events, outlooks, revenues, results or situations, for example. These are based upon the company's current expectations, convictions and assumptions, but could materially differ from any future results, performance or achievements. We are providing this communication as of the date hereof and do not undertake to update any forward-looking statements contained herein as a result of new information, future events or otherwise.
2
Content
01 Business Review Q3 2017
02 Financial Performance Q3 2017
03 Outlook 2017
3
01 Business Review Q3 2017
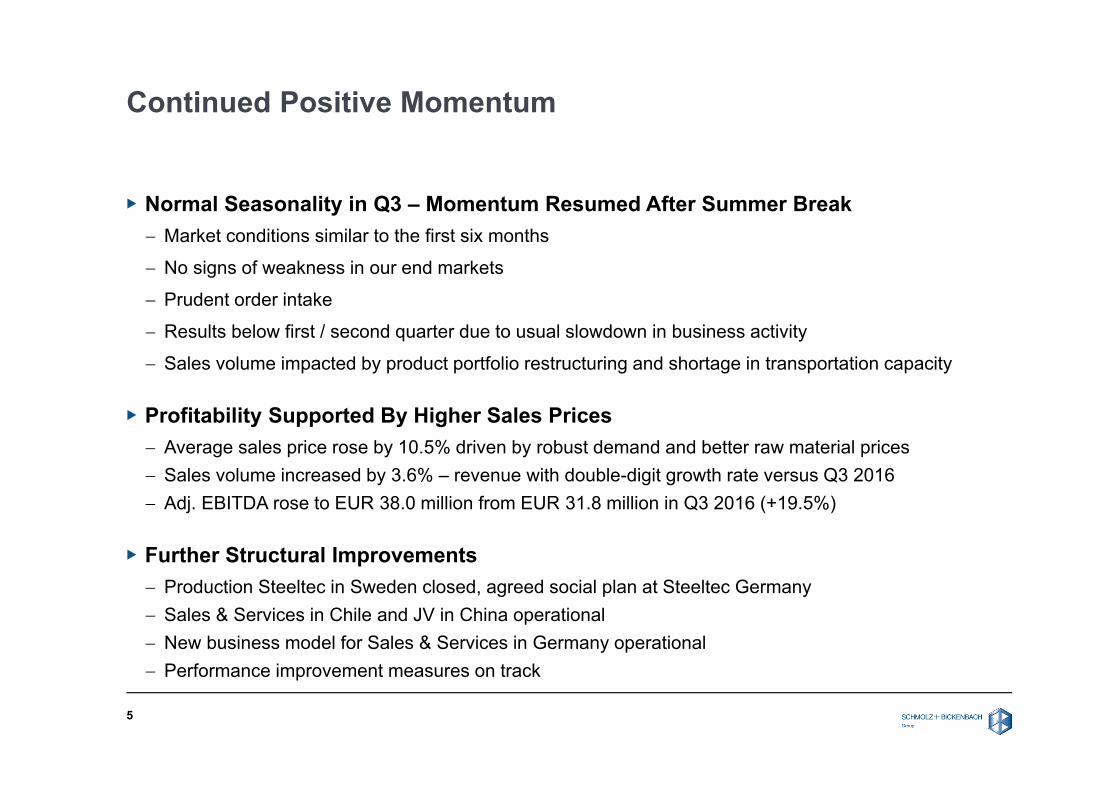
Continued Positive Momentum
▶ Normal Seasonality in Q3 – Momentum Resumed After Summer Break Market conditions similar to the first six months
No signs of weakness in our end markets
Prudent order intake
Results below first / second quarter due to usual slowdown in business activity
Sales volume impacted by product portfolio restructuring and shortage in transportation capacity
▶ Profitability Supported By Higher Sales Prices Average sales price rose by 10.5% driven by robust demand and better raw material prices Sales volume increased by 3.6% – revenue with double-digit growth rate versus Q3 2016 Adj. EBITDA rose to EUR 38.0 million from EUR 31.8 million in Q3 2016 (+19.5%)
▶ Further Structural Improvements Production Steeltec in Sweden closed, agreed social plan at Steeltec Germany Sales & Services in Chile and JV in China operational New business model for Sales & Services in Germany operational Performance improvement measures on track
5
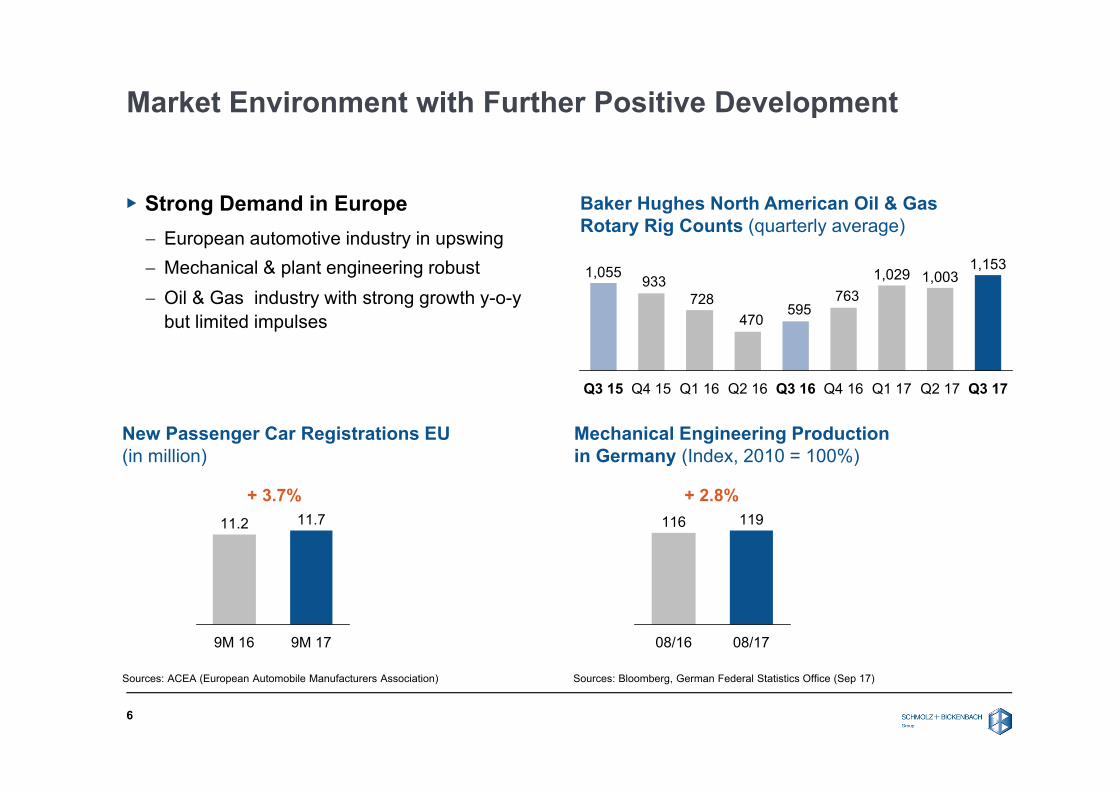
Market Environment with Further Positive Development
▶ Strong Demand in Europe European automotive industry in upswing Mechanical & plant engineering robust Oil & Gas industry with strong growth y-o-y
but limited impulses
6
Baker Hughes North American Oil & Gas Rotary Rig Counts (quarterly average)
763595
470728
933
Q3 15 Q2 17
1,003
Q3 17
1,1531,029
Q3 16 Q1 17
1,055
Q1 16Q4 15 Q2 16 Q4 16
New Passenger Car Registrations EU (in million)
Mechanical Engineering Productionin Germany (Index, 2010 = 100%)
Sources: ACEA (European Automobile Manufacturers Association) Sources: Bloomberg, German Federal Statistics Office (Sep 17)
9M 17
11.7
9M 16
11.2
+ 3.7%
08/17
119
08/16
116
+ 2.8%
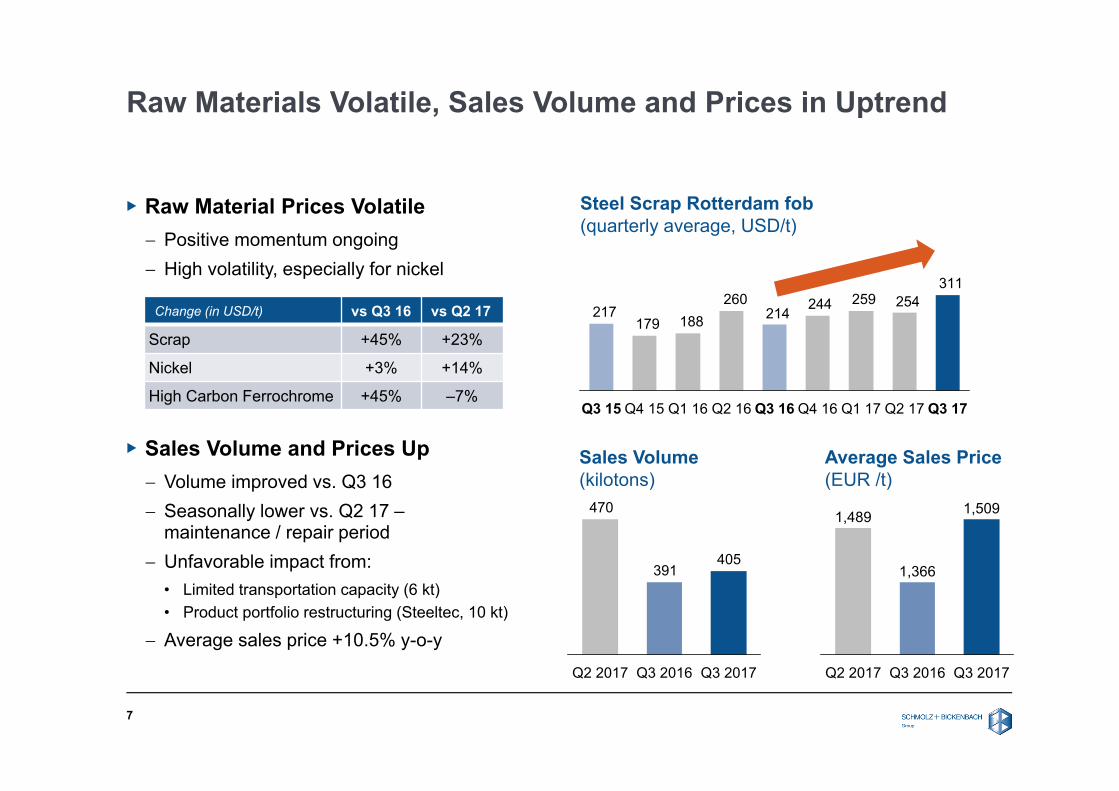
Raw Materials Volatile, Sales Volume and Prices in Uptrend
▶ Raw Material Prices Volatile Positive momentum ongoing High volatility, especially for nickel
▶ Sales Volume and Prices Up Volume improved vs. Q3 16 Seasonally lower vs. Q2 17 –
maintenance / repair period Unfavorable impact from:
• Limited transportation capacity (6 kt)• Product portfolio restructuring (Steeltec, 10 kt)
Average sales price +10.5% y-o-y
7
311254259244
214260
188179217
Q3 17Q4 16Q3 16 Q1 17Q2 16Q1 16Q4 15Q3 15 Q2 17
Steel Scrap Rotterdam fob(quarterly average, USD/t)
Sales Volume(kilotons)
470
405391
Q3 2016 Q3 2017Q2 2017 Q3 2017
1,366
Q2 2017
1,5091,489
Q3 2016
Average Sales Price(EUR /t)
Change (in USD/t) vs Q3 16 vs Q2 17
Scrap +45% +23%
Nickel +3% +14%
High Carbon Ferrochrome +45% –7%
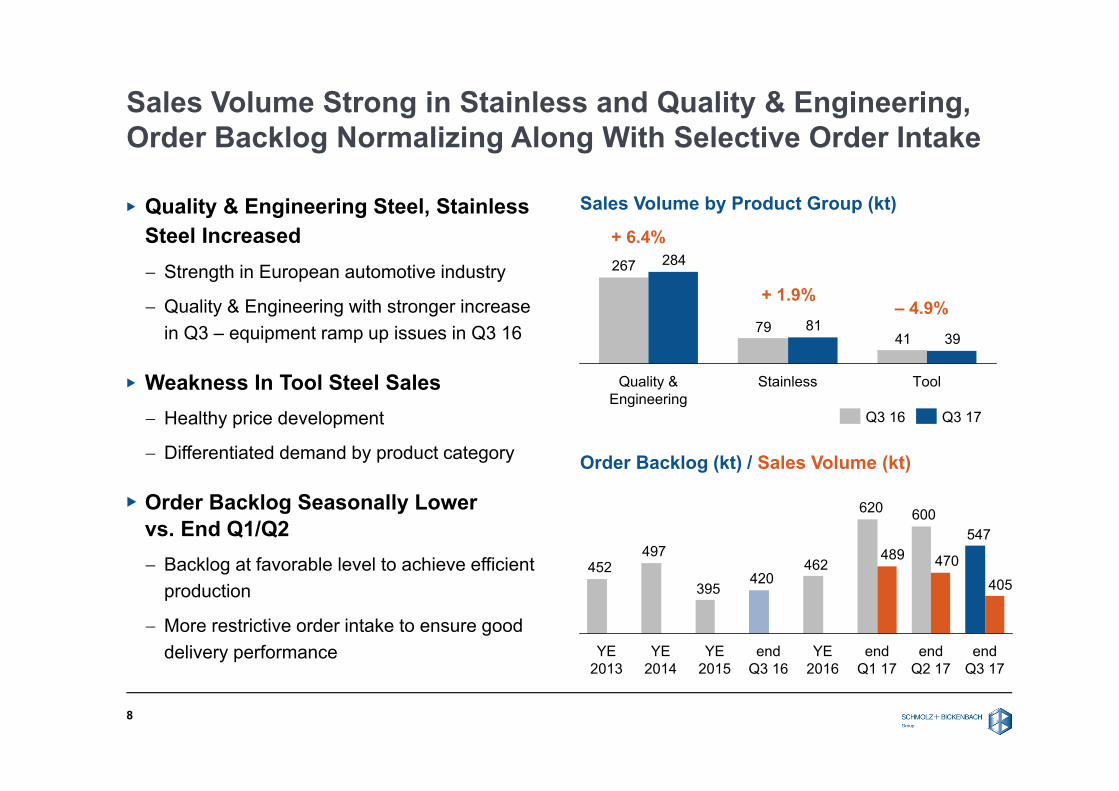
Sales Volume Strong in Stainless and Quality & Engineering, Order Backlog Normalizing Along With Selective Order Intake
▶ Quality & Engineering Steel, Stainless Steel Increased Strength in European automotive industry
Quality & Engineering with stronger increase in Q3 – equipment ramp up issues in Q3 16
▶ Weakness In Tool Steel Sales Healthy price development
Differentiated demand by product category
▶ Order Backlog Seasonally Lowervs. End Q1/Q2 Backlog at favorable level to achieve efficient
production
More restrictive order intake to ensure gooddelivery performance
8
Sales Volume by Product Group (kt)
4179
267
39
284
81
ToolStainlessQuality & Engineering
+ 6.4%
+ 1.9%
Q3 16 Q3 17
– 4.9%
547600620
462420
395
497452
405
470489
YE 2013
end Q3 17
end Q2 17
YE 2015
end Q1 17
YE 2014
YE 2016
end Q3 16
Order Backlog (kt) / Sales Volume (kt)
02 Financial Performance Q3 2017
Seasonality Mirrored in Production and Sales Volume
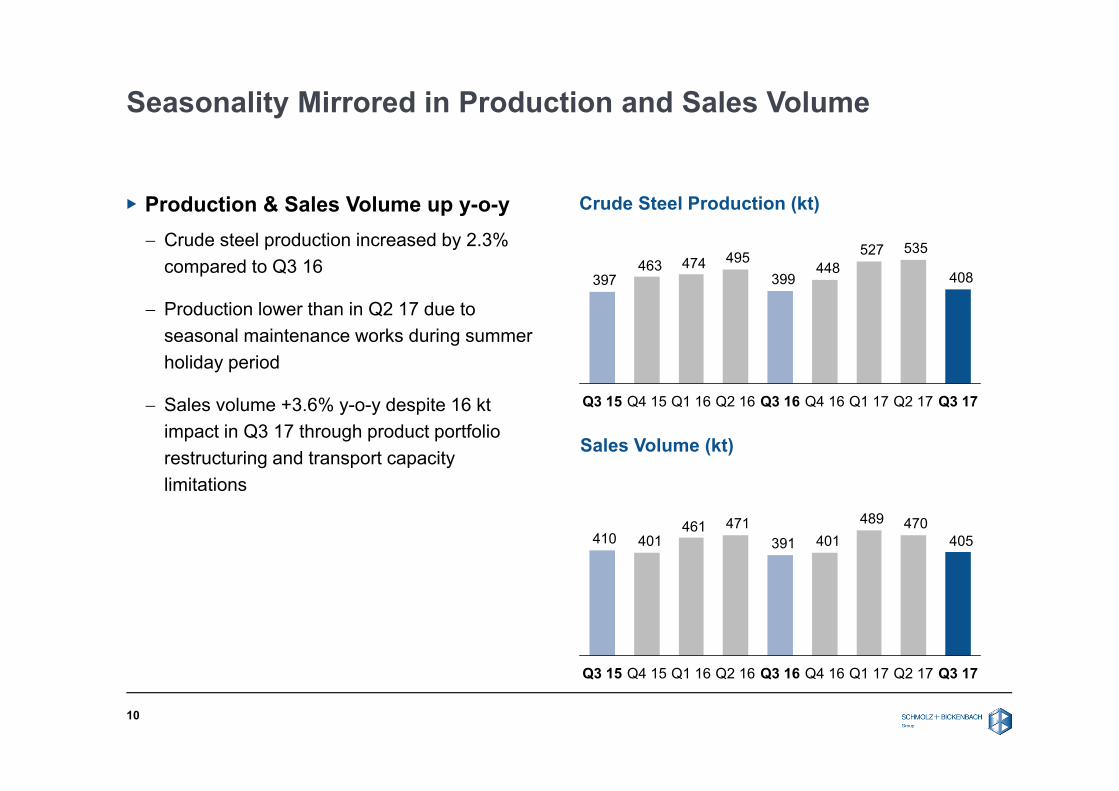
▶ Production & Sales Volume up y-o-y Crude steel production increased by 2.3%
compared to Q3 16
Production lower than in Q2 17 due toseasonal maintenance works during summerholiday period
Sales volume +3.6% y-o-y despite 16 ktimpact in Q3 17 through product portfoliorestructuring and transport capacitylimitations
10
Crude Steel Production (kt)
Sales Volume (kt)
408
535527448
399495474463
397
Q3 17Q3 15 Q4 15 Q1 16 Q1 17 Q2 17Q4 16Q3 16Q2 16
405470489
401391471461
401410
Q3 17Q2 17Q3 15 Q4 15 Q1 16 Q2 16 Q3 16 Q4 16 Q1 17
Revenue Growth Driven by Prices
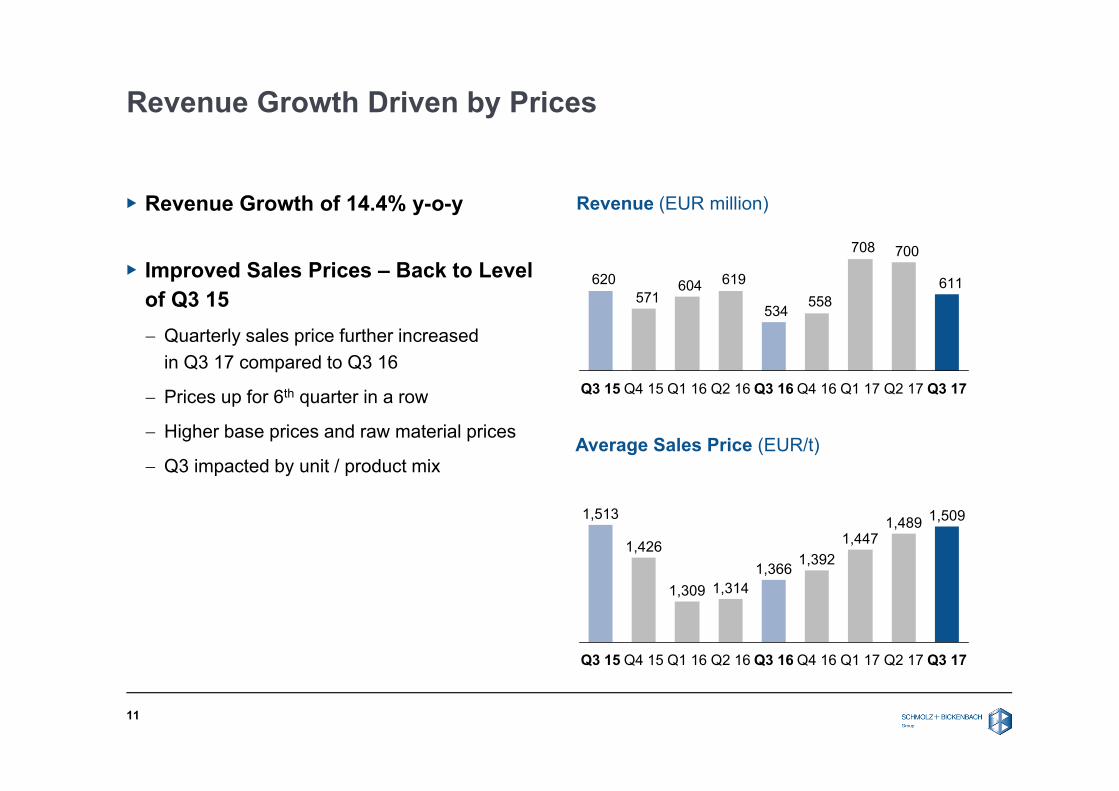
▶ Revenue Growth of 14.4% y-o-y
▶ Improved Sales Prices – Back to Level of Q3 15 Quarterly sales price further increased
in Q3 17 compared to Q3 16
Prices up for 6th quarter in a row
Higher base prices and raw material prices
Q3 impacted by unit / product mix
11
1,3661,314
Q3 15
1,309
Q4 15
1,426
Q1 16
1,513
Q2 17Q2 16
1,489
Q3 16
1,447
Q4 16
1,392
Q1 17 Q3 17
1,509
Average Sales Price (EUR/t)
Revenue (EUR million)
611
700708
558534
619604571
620
Q1 16 Q2 16Q3 15 Q4 15 Q1 17Q4 16Q3 16 Q3 17Q2 17
EBITDA Growth Supported by Continuing Performance Improvement Measures
12
Adj. EBITDA Q3 17 vs Q2 17 (EUR million)
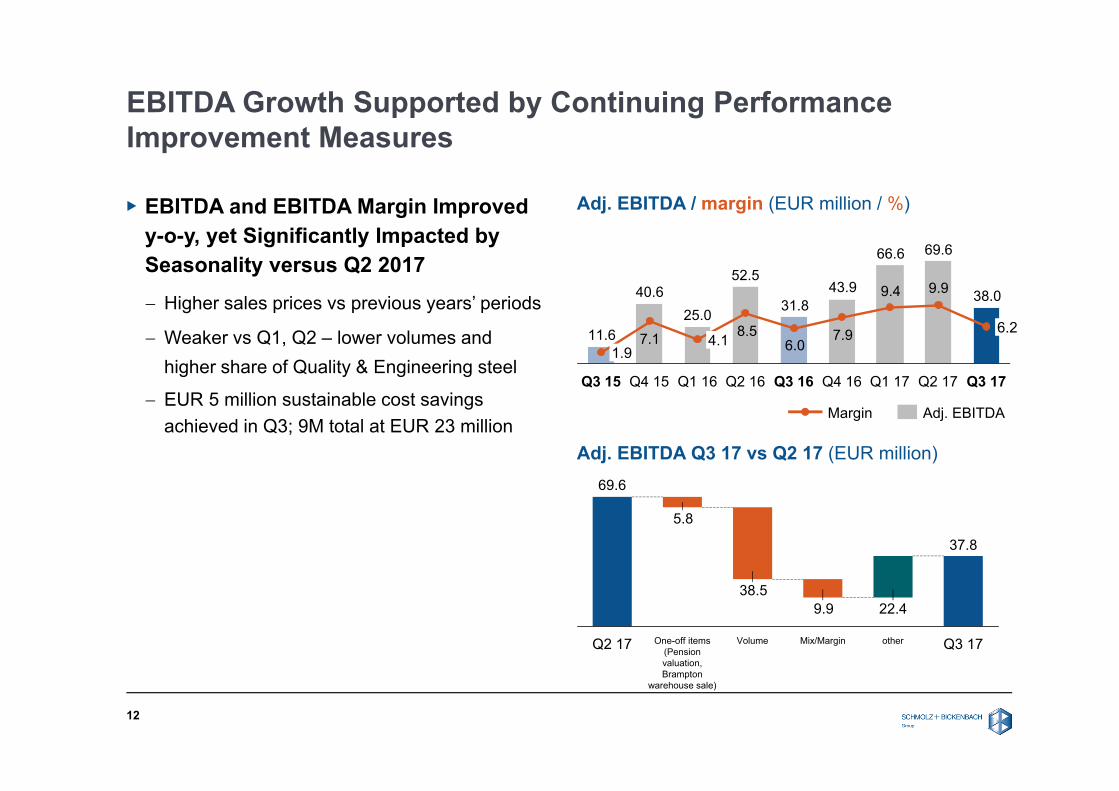
▶ EBITDA and EBITDA Margin Improvedy-o-y, yet Significantly Impacted bySeasonality versus Q2 2017
Higher sales prices vs previous years’ periods
Weaker vs Q1, Q2 – lower volumes andhigher share of Quality & Engineering steel
EUR 5 million sustainable cost savingsachieved in Q3; 9M total at EUR 23 million
37.8
22.49.938.5
5.8
69.6
VolumeQ2 17 One-off items (Pension valuation, Brampton
warehouse sale)
Q3 17otherMix/Margin
38.0
69.666.6
43.931.8
52.5
25.040.6
11.6
9.99.4
7.96.0
8.57.1
Q3 17
6.2
Q2 17Q1 17Q4 16Q2 16Q1 16 Q3 16Q3 15
1.9
Q4 15
4.1
Adj. EBITDA / margin (EUR million / %)
Adj. EBITDAMargin
Restructuring Progressing
13
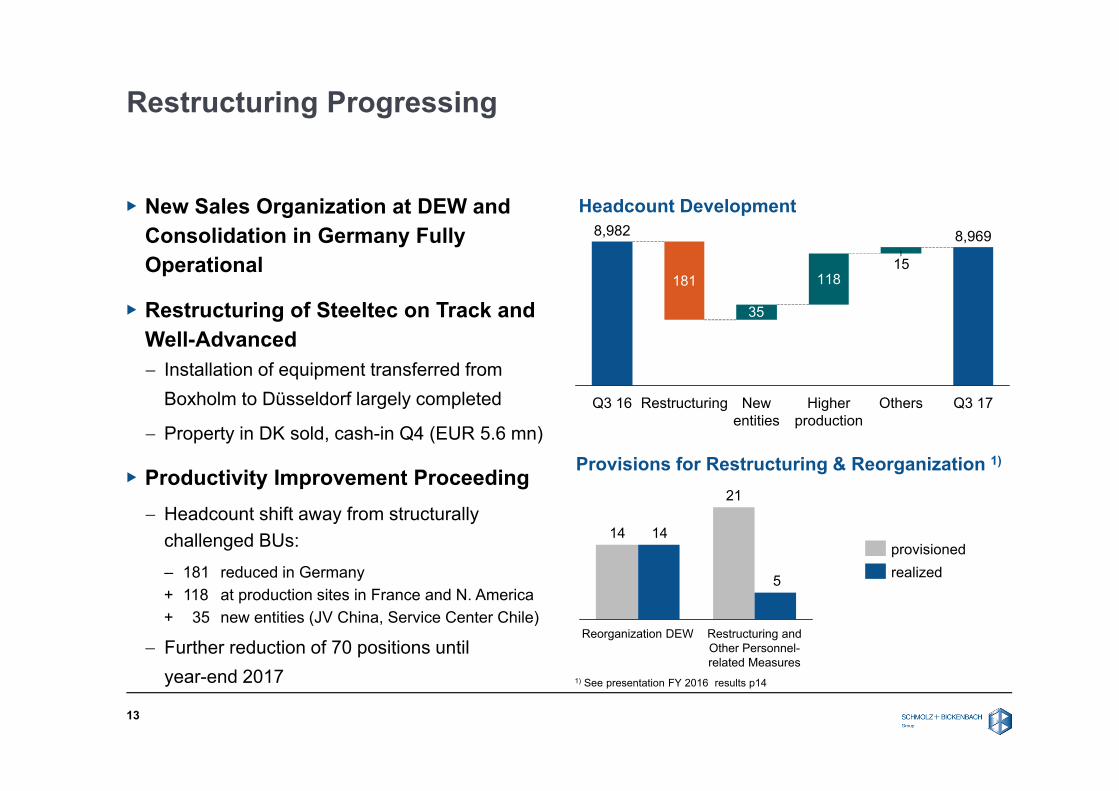
▶ New Sales Organization at DEW andConsolidation in Germany FullyOperational
▶ Restructuring of Steeltec on Track andWell-Advanced Installation of equipment transferred from
Boxholm to Düsseldorf largely completed
Property in DK sold, cash-in Q4 (EUR 5.6 mn)
▶ Productivity Improvement Proceeding Headcount shift away from structurally
challenged BUs: – 181 reduced in Germany+ 118 at production sites in France and N. America+ 35 new entities (JV China, Service Center Chile)
Further reduction of 70 positions untilyear-end 2017
Headcount Development
181
35
11815
8,969
OthersHigher production
New entities
RestructuringQ3 16
8,982
Q3 17
Provisions for Restructuring & Reorganization 1)
21
14
5
14
Restructuring and Other Personnel-related Measures
Reorganization DEW
realizedprovisioned
1) See presentation FY 2016 results p14
Improvement of Capital Structure on Track
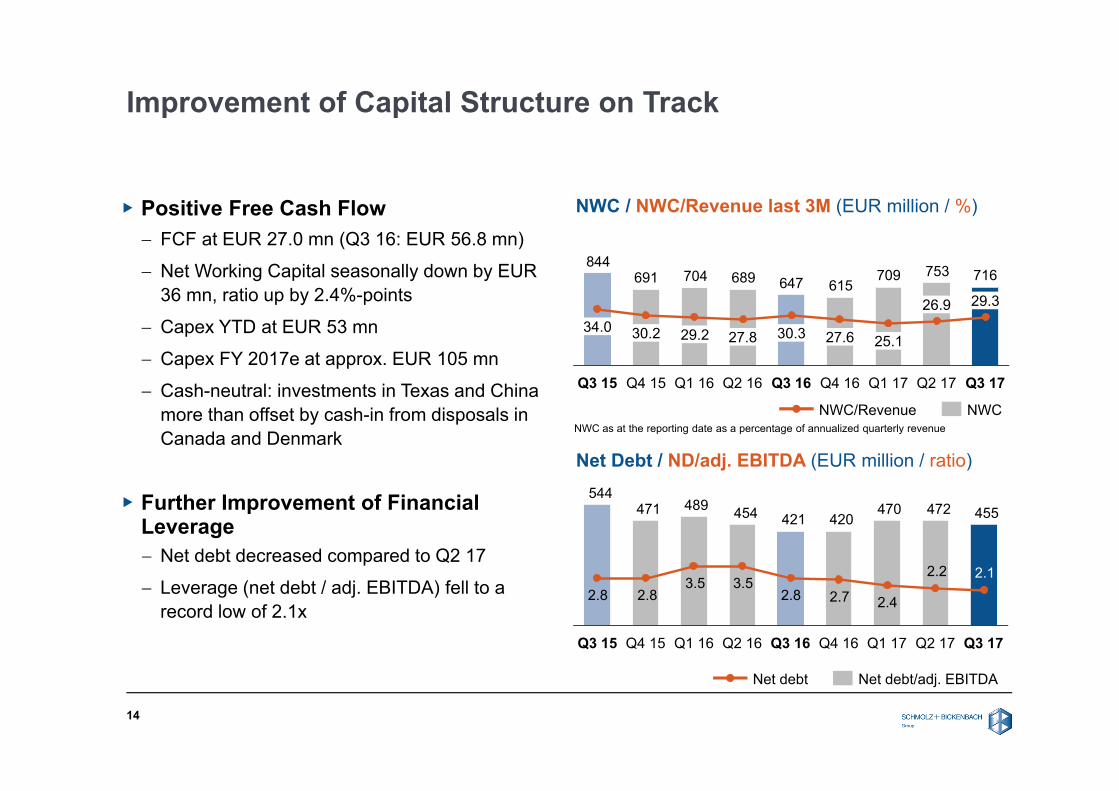
▶ Positive Free Cash Flow FCF at EUR 27.0 mn (Q3 16: EUR 56.8 mn)
Net Working Capital seasonally down by EUR 36 mn, ratio up by 2.4%-points
Capex YTD at EUR 53 mn
Capex FY 2017e at approx. EUR 105 mn
Cash-neutral: investments in Texas and China more than offset by cash-in from disposals in Canada and Denmark
▶ Further Improvement of Financial Leverage Net debt decreased compared to Q2 17
Leverage (net debt / adj. EBITDA) fell to a record low of 2.1x
NWC / NWC/Revenue last 3M (EUR million / %)
716753709615647689704691
844
26.9
25.127.630.3
Q3 15
27.8
Q1 17
29.2
Q2 17
30.234.0
Q2 16 Q3 16 Q4 16Q1 16Q4 15 Q3 17
29.3
Net Debt / ND/adj. EBITDA (EUR million / ratio)
455472470420421454489471
544
2.2
2.42.72.83.53.5
2.82.82.1
Q4 15 Q2 17Q1 16 Q3 16Q2 16 Q4 16 Q1 17Q3 15 Q3 17
NWC/Revenue NWC
Net debt Net debt/adj. EBITDA
NWC as at the reporting date as a percentage of annualized quarterly revenue
14
03 Outlook 2017
Outlook For Full-Year 2017 Confirmed
16
▶ Current Business Conditions Support Further Growth Synchronized global economic upswing is largely intact, no signs of weakness in customer industries
Still strong order backlog after first nine months Internal improvement / restructuring measures almost completed Political and macroeconomic risks remain high Raw material price volatility to remain high
▶ Significant Risks From Cost Inflation Rising costs for graphite electrodes and refractories
Outlook for Full-Year 2017
SCHMOLZ + BICKENBACH expects an adjusted EBITDA in a range between EUR 200 million and EUR 220 million
Q & A Session
Appendix
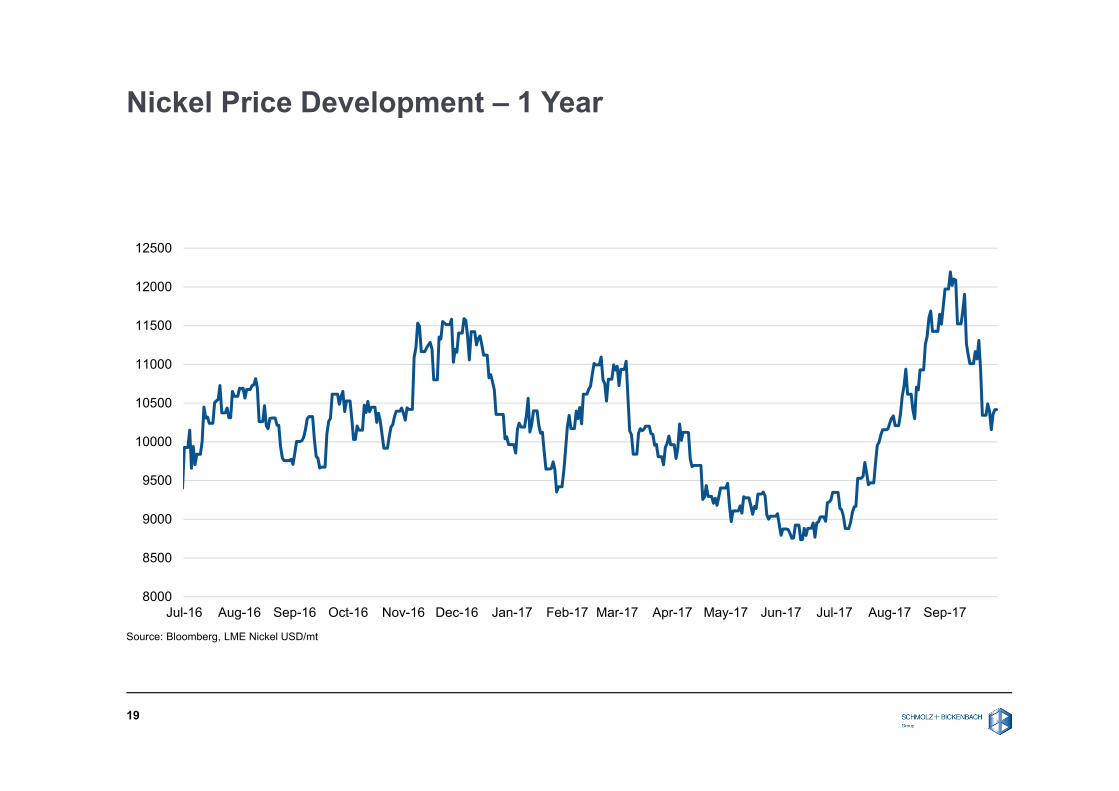
Nickel Price Development – 1 Year
8000
8500
9000
9500
10000
10500
11000
11500
12000
12500
Jul-16 Aug-16 Sep-16 Oct-16 Nov-16 Dec-16 Jan-17 Feb-17 Mar-17 Apr-17 May-17 Jun-17 Jul-17 Aug-17 Sep-17
19
Source: Bloomberg, LME Nickel USD/mt
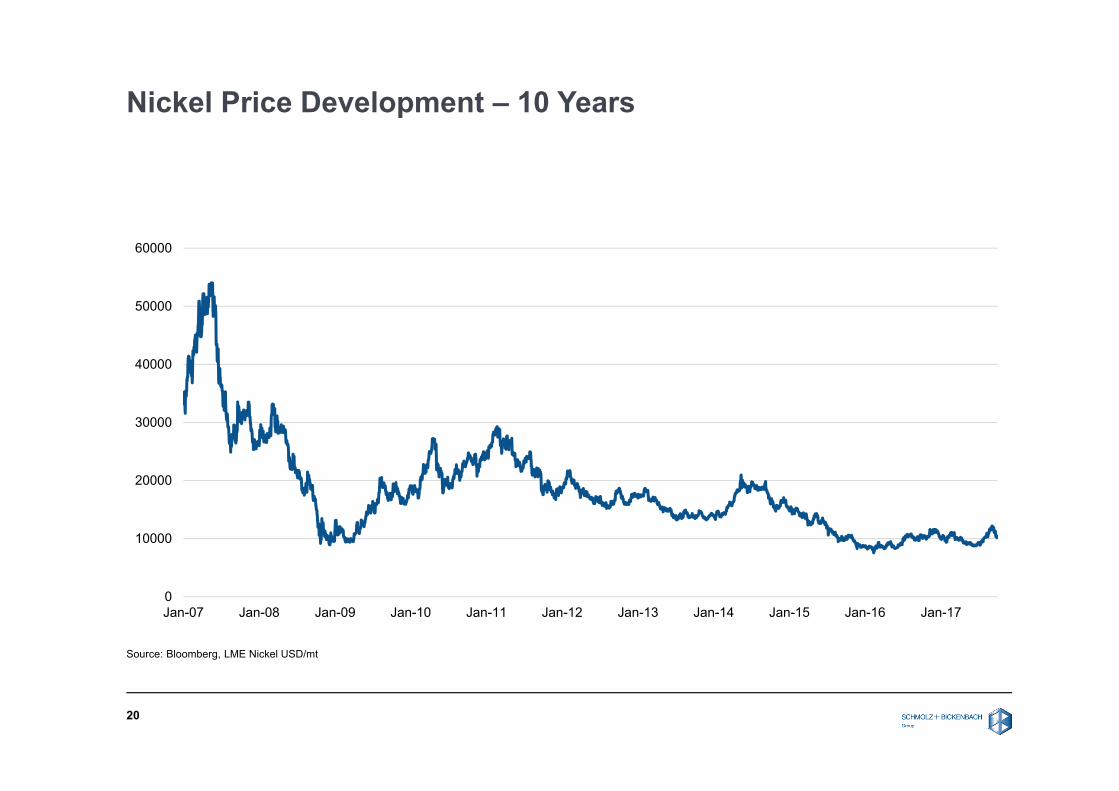
Nickel Price Development – 10 Years
0
10000
20000
30000
40000
50000
60000
Jan-07 Jan-08 Jan-09 Jan-10 Jan-11 Jan-12 Jan-13 Jan-14 Jan-15 Jan-16 Jan-17
20
Source: Bloomberg, LME Nickel USD/mt
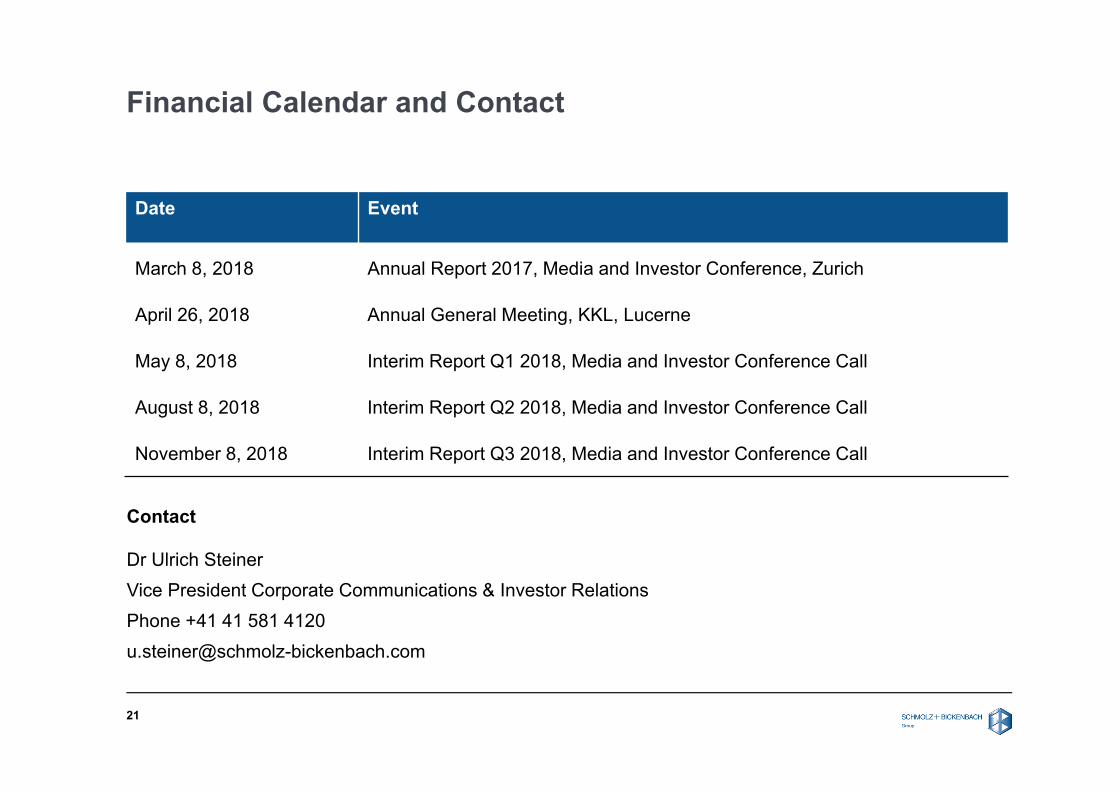
Financial Calendar and Contact
21
Date Event
March 8, 2018 Annual Report 2017, Media and Investor Conference, Zurich
April 26, 2018 Annual General Meeting, KKL, Lucerne
May 8, 2018 Interim Report Q1 2018, Media and Investor Conference Call
August 8, 2018 Interim Report Q2 2018, Media and Investor Conference Call
November 8, 2018 Interim Report Q3 2018, Media and Investor Conference Call
Contact
Dr Ulrich SteinerVice President Corporate Communications & Investor RelationsPhone +41 41 581 [email protected]


