Schemes for Transferring Income to the Poor
17
CHRISTOPHER GREEN AND ROBERT J. LAMPMAN’ Schemes for Transferring Income to the Poor THIS ARTICLE is about various schemes for transferring addi- tional income to poor people: the “negative income tax,” modification of public assistance and social insurance, family allowances, and tax credits. Nine particular methods are evaluated and a selection is made by the authors of the one which seems to them to be most hopeful of a good result per dollar of expenditure.l A Description of Negative Income Taxation Negative income taxation would use the individual income tax system as a vehicle for closing a portion of the poverty-income gap, i.e., the Werence between the actual income of poor families and the income they would need in order not to be poor. It would pay money from the federal treasury to families according to a schedule based on actual income received and family size. For example, a family of four persons with an income of $2,000 might be said to have a poverty-income gap of $1,000. That is, their income is $1,000 below a “poverty line” of $3,000. Similarly, it is $l,OOO below their total of personal exemptions and minimum standard deductions under the income tax law. Hence, the $1,000 is that family’s unused exemptions and deductions and it can be called their “negative taxable income.” To this negative base one could apply a tax rate to com- pute a “negative tax” or allowance. Thus, a 50 per cent tax rate would yield an allowance of $500 in the example given. The scheme described above is one variant of negative income taxation. In this paper it is later referred to as negative rates taxation. * kwistant Professor of Economics, North Carolina State University at Raleigh, and Visiting Professor of Economics, University of the Phili pines, respectively. 1 The work for this article was done whse the authors were members of the Institute for Research on Poverty at the University of Wisconsin. Their earlier writin s on the topic include Christopher Green, Transfer by Taxation: One Approach to Irnprooecf Income Maintenance (PbD. dissertation, University of Wisconsin, 1966), and Robert J. Lampman, “The American System of Transfers: How Does it Benefit the Poor?” in L. Goodman, editor, Sock1 Welfare and Economic Prograss (New York: Columbia University Press, 1966). 121
-
Upload
christopher-green -
Category
Documents
-
view
214 -
download
0
Transcript of Schemes for Transferring Income to the Poor
C H R I S T O P H E R G R E E N A N D R O B E R T J . L A M P M A N ’
Schemes for Transferring Income to the Poor
THIS ARTICLE is about various schemes for transferring addi- tional income to poor people: the “negative income tax,” modification of public assistance and social insurance, family allowances, and tax credits. Nine particular methods are evaluated and a selection is made by the authors of the one which seems to them to be most hopeful of a good result per dollar of expenditure.l
A Description of Negative Income Taxation Negative income taxation would use the individual income
tax system as a vehicle for closing a portion of the poverty-income gap, i.e., the Werence between the actual income of poor families and the income they would need in order not to be poor. It would pay money from the federal treasury to families according to a schedule based on actual income received and family size. For example, a family of four persons with an income of $2,000 might be said to have a poverty-income gap of $1,000. That is, their income is $1,000 below a “poverty line” of $3,000. Similarly, it is $l,OOO below their total of personal exemptions and minimum standard deductions under the income tax law. Hence, the $1,000 is that family’s unused exemptions and deductions and it can be called their “negative taxable income.” To this negative base one could apply a tax rate to com- pute a “negative tax” or allowance. Thus, a 50 per cent tax rate would yield an allowance of $500 in the example given. The scheme described above is one variant of negative income taxation. In this paper it is later referred to as negative rates taxation.
* kwistant Professor of Economics, North Carolina State University at Raleigh, and Visiting Professor of Economics, University of the Phili pines, respectively.
1 The work for this article was done whse the authors were members of the Institute for Research on Poverty at the University of Wisconsin. Their earlier writin s on the topic include Christopher Green, Transfer by Taxation: One Approach to Irnprooecf Income Maintenance (PbD. dissertation, University of Wisconsin, 1966), and Robert J. Lampman, “The American System of Transfers: How Does it Benefit the Poor?” in L. Goodman, editor, Sock1 Welfare and Economic Prograss (New York: Columbia University Press, 1966).
121

122 / CHRISTOPHER GREEN AND ROBERT J. LAMPMAN
One could achieve the same result by paying a standard allowance to all families and then taxing pre-allowance income in such a way that the tax is less than the allowance for poor families but more than the allow- ance for non-poor families. This is illustrative of the guaranteed minimum income2 or social dividend3 approach to negative income taxation.
The similarity between social dividend taxation and negative rates tax- ation can be understood by noting that each employs the same three basic variables. These basic variables are (I) an income guarantee; (2) a tax rate applied against a tax base; and (3) a break-even level of income where the tax liability equals the allowance guarantee. Any two of these three basic variables determine the third. In negative rates taxation, the income guar- antee is the level of negative tax allowances that is received when income other than the allowance or guarantee is zero. In social dividend taxation, the guarantee is the level of gross payments or entitlement for which a family or individual is eligible. The tax base in negative rates taxation is the gap between some standard, such as the value of exemptions and deductions allowed a family or the family’s poverty line, and the level of family income. In social dividend taxation the tax base is the family’s income before allowance.
TABLE 1 NET ALLOWANCE RECEIVED BY A FAMILY OF FOUR UNDER A NEGATIVE
RATES PLAN AND A SOCIAL DIVIDEND PLAN
Negative rates plan Social dividend plan
Family income before
allowance
$ 0 500
1,000 1,500 2,000 3,000
$3,000 2,500 2,000 1,500 1,000
0
I (3) (4) Basic allowance
Net allowance based on
50 per cent of poverty gap
$1,500 1,250 1,000 750 500 0
guarantee equal to $1,500 (equal to 50 per cent of
Doverty line)
$1,500 1,500 1,500 1,500 1,500 1.500
Tax liability with 50 per cent Net allowance
rate (50% X (1)) (4)-(5)
$ 0 $1,500 250 1,250 500 1.000 750 750 1,000 500 1.500 0
Table 1 indicates that a negative rates plan which fills 50 per cent of a family’s poverty gap would provide the same level of allowances as a social dividend plan which guarantees a minimum income equal to 50 per cent of a poverty line and, at the same time, taxes family income up to the
2 See Robert Theobald, Free Man a.nd Free Markets (New York: C. N. Potter, 1963), pp. 192-197, and Edward E. Schwartz, “A Way to End the Means Test,” Social Work, IX (July 9, 1964), 3-12.
3 See Lady Rhys-Williams, Something to Look Forward To (London: MacDonald, 1943). and Tmation and Incentiue (New York: Oxford University Press, 1953), pp. 121-137.

Symposium: The Negative Income Tax / 123
break-even line at a 50 per cent rate. Columns (3) and (6) show that for any given level of before-allowance income the net allowance (gross allow- ance minus tax liability) is the same under each type of plan. Therefore, it is useful to think of negative rates and social dividend taxation as two types of what might be called “transfer-by-taxation.”
Transfer-by-taxation differs from other modes of income maintenance in that income and family size are the leading factors which condition benefits. Most, if not all, the eligibility considerations which are used in public assistance or social insurance programs-assets, ability to work, relatives’ responsibility, age, retirement status, employment record, previous taxes paid, and so forth-are left to one side. Hence, all families with incomes below some specsed level-not just certain categories of families-would receive allowances. Moreover, every family would be assured a minimum (this may or may not be a “high minimum”) level of income.
Ideally, the administration of transfer-by-taxation would be, like social insurance, so impersonal as to avoid most of the stigma generally associated with being “on relief.” It could be administered in connection with the present income tax system and would require only that a beneficiary file tax forms at the beginning and end of a stated accounting period. The set of allowances or negative tax rates can be designed to induce work effort and thrift on the part of actual and prospective beneficiaries. In this regard, transfer-by-taxation may be more constructive than an extension of public assistance to the “working poor,” since the latter typically involves a dollar- for-dollar substitution of benefits for other income foregone and vice versa. In other words, public assistance uses a 100 per cent marginal tax rate, but transfer-by-taxation opens up the possibility of using lower tax rates and thereby supplementing low earned incomes without discouraging all work effort by recipients of such supplements.
A Comparison of Negative Income Tax Plans Transfer-by-taxation is a flexible technique. In designing a
plan, one may vary the level of the basic guarantee, the tax rate, and the break-even level of income. By changing the definitions of such key terms as “income” and “family” and by varying eligibility conditions one may alter the specific way in which a plan relates to the concepts and parameters of the present individual income tax system, as well as to public assistance and other social welfare systems.
Before designing and choosing among transfer-by-taxation plans, the following key questions need to be explored.

124 / CHRISTOPHER GREEN AND ROBERT J. LAMPMAN
1. What portion of the poverty-income gap is closed by the plan? 2. Would any of those presently poor be made worse off by adoption of the
plan? Are the poor and near-poor treated equitably in the sense that their rankings are the same before and after allowances are paid?
3. What e$ects will the plan have on work, saving and investment, family size, and family composition?
4. What is the budgetary cost of the plan and who will pay it? 5. How much of the total expenditure under the plan goes to poor families? 6. How would the plan relate to present provisions in taxation, public assist-
With these key questions in mind, we turn to an outline of five dif- ferent transfer-by-taxation plans: tax-equity negative rates, social dividend, welfare-oriented negative rates, child’s entitlement, and earned income sup- plement plans.
ance, and other social welfare programs?
The Tax-Equity Negative Rates Plan The simplest negative rates plan would refund to nontax-
able income tax Hers some percentage of their unused personal exemptions and minimum standard deductions (afterwards referred to as “unused EX + MSD”).4 Such a plan would produce greater equity in the income tax system. The taxpayer with unused EX + MSD i s not now getting the full use of these provisions, nor does he benefit from tax rate reductions or increases in personal exemptions and allowable deductions. This results in an inequity whereby families of different size and the same income pay the same tax, namely, a tax of zero dollars. Applying even a modest nega- tive tax rate, say 14 per cent (presently the lowest bracket rate), to un- used EX + MSD would allow the poor of differing family sizes to utilize the EX + MSD allowed them under the income tax system. A high tax rate, say 50 per cent, would meet a substantial portion of the needs of the poor.
The cost of the Tax-Equity Negative Rates Plan with a 14 per cent rate wodd have been about $2.8 billion in 1964; the cost with a 50 per cent rate would have been approximately $10 The appeal of the plan is its simplicity, i.e., the relative ease with which it could be administered alongside the existing (positive) income tax system. The present tax return
4 For simplicity the minimum standard deduction is used. It is a known amount varying with family size. An income tax filer receives a $200 MSD, and $100 for each dependent (in- cluding himself). Thus a family of four has $600 in MSD. Most low income families can be expected to use the MSD unless itemizing heavy medical expenses will increase their deductions.
5 The cost figures are rough guesses since the aggregate amount of unused EX + MSD, calculated by the tax system’s income concept of adjusted gross income, is not readily available. However, the Treasury has estimated that there was $22 billion in unused EX + MSD in 1961. By 1964 this figure can be supposed to have fallen slightly to about $20 billion. Part of this would be offset by savings on public assistance.
Symposium: The Negative Income Tax / 125
indicates whether the filer has unused EX + MSD and whether therefore he would be eligible for, and in what amounts he may receive, negative tax allowances. It would, of course, be necessary to make sure that persons not now Hing tax returns (because they are not presently required to do so), but who would be eligible to receive allowances if they did so file, are encouraged to file and are aided in filing an income tax return.
The simplicity of the plan is also its major shortcoming. I t ignores the fact that the present definition of income for positive income tax purposes excludes important fonns of income such as transfer income. Because of this, some non-poor people would get negative tax allowances. Moreover, it does not take account of the fact that the welfare unit is “the family,” whereas the tax unit is any income earner and his “dependents.” Some families might have several tax filers under present law.
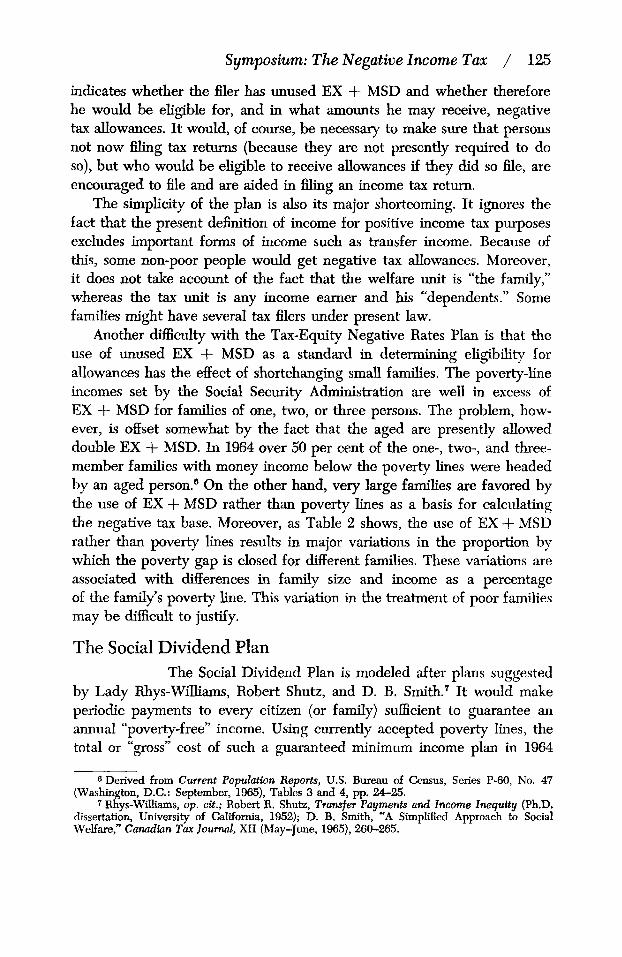
Another difficulty with the Tax-Equity Negative Rates Plan is that the use of unused EX + MSD as a standard in determining eligibility for allowances has the effect of shortchanging small families. The poverty-line incomes set by the Social Security Administration are well in excess of EX + MSD for families of one, two, or three persons. The problem, how- ever, is offset somewhat by the fact that the aged are presently allowed double EX + MSD. In 1964 over 50 per cent of the one-, two-, and three- member families with money income below the poverty lines were headed by an aged person.’ On the other hand, very large families are favored by the use of EX + MSD rather than poverty lines as a basis for calculating the negative tax base. Moreover, as Table 2 shows, the use of EX + MSD rather than poverty lines results in major variations in the proportion by which the poverty gap is closed for different families. These variations are associated with differences in family size and income as a percentage of the family’s poverty line. This variation in the treatment of poor families may be difficult to justify.
The Social Dividend Plan The Social Dividend Plan is modeled after plans suggested
by Lady Rhys-Williams, Robert Shutz, and D. B. Smith.7 It would make periodic payments to every citizen (or family) sufficient to guarantee an annual “poverty-free” income. Using currently accepted poverty lines, the total or ‘‘gross” cost of such a guaranteed minimum income plan in 1964
Derived from Current Population Reports, U.S. Bureau of Census, Series P-60, No. 47 (Washington, D.C.: September, 1965), Tables 3 and 4, pp. 24-25.
7 Rhys-WiUiams, op. cit.; Robert R. Shutz, Transfer Payments and lncome Inequity (Ph.D. dissertation, University of California, 1952); D. B. Smith, “A Simplified Approach to Social Welfare,” Canudiun Tux Journal, XI1 (May-June, 1965), 260-265.

126 / CHRISTOPHER GREEN AND ROBERT J. LAMPMAN
would have been $155 billion. This enormous cost would be financed by a special tax on each family’s money income before allowances. The level of the tax rate(s) will determine the plan’s “net cost,” or the amount of redistribution of income from families with before-allowance income above the break-even level to families with income below that level. In 1964 a single tax rate of 33% per cent applied against $465 billion of family money income would have raised $155 billion and would have redistributed out of that amount about $51 billion. Under such a plan a four-person family
TABLE 2
PERCENTAGE OF POVERTY-INCOME GAP FILLED FOR DIFFERENT SIZE FAMILIES WHEN 50 PER CENT NEGATIVE TAX Is APPLIED TO UNUSED EXEMPTIONS AND DEDUCTIONS
__-
lncome before allowance as
percentage of poverty-line
income
Size of family unit
Net allowance as percentage of poverty-income gap
1 2 3 4 5 6 7 -
0 30 40 46 50 53 55 57 10 28 39 45 50 53 55 57 20 25 37 45 50 54 56 58 30 21 36 44 50 54 57 59 40 17 33 43 50 55 58 61 50 10 30 42 50 56 60 63
0 25 40 50 57 62 67 a 37 50 59 67 72
60
0 30 50 64 75 83 70
10 50 79 100 116 80 90
17
11 No unused EX-IMSD. Will pay a positive tax if adjusted g r m income equals total money income.
with a $3,000 guarantee would have a $9,000 break-even income level. That is, this family would not begin to pay “net” for the cost of the plan until its income before allowances rose above $9,000.
The important cost figure is the plan’s net rather than its gross cost, because the former indicates the amount of income actually redistributed from those with above to those with below break-even incomes. For families with income above the break-even level of income, the guarantee would be a credit against the taxes they must pay to finance the plan. Families with expected income above the bred-even level might sensibly forego receiving “allowances” and paying “social dividend taxes” on that portion of their income which equals their break-even income levels.
Still, a net cost of $51 billion reduces the attractiveness of the plan-at least to those who have to pay for it. Moreover, many families obviously not in any real need for income maintenance would receive allowances. In 1964, 68 per cent of all families and unrelated individuals would have been eligible to receive net allowances under the plan just described. In that year, only 19 per cent were adjudged to have been poor. Of the $51 bil- lion paid out in net allowances, $28 billion would have gone to non-poor

Symposium: The Negative Income Tax / 127
families. (However, some of the $28 billion would be income in excess of poverty-line income received by families who were poor before allowances.)
An alternative set of tax rates could reduce the net cost of the Social Dividend Plan and the percentage of families eligible for net allowances. If the tax rate on income before allowance was 50 per cent rather than 33?6 per cent up to the break-even level of income-i.e., now twice the guarantee-the net cost of the plan in 1964 would have been about $30 bil- lion.8 This $30 billion “net cost” could have been financed by a 14 per cent tax on all income (not only presently taxable income) above the break-even levels. There is a major reduction in the tax rate on “net” taxpayers from 33?i per cent, when a single rate on all income is used, to 14 per cent, when a 50 per cent rate is applied to income below the break-even level. This is due to (1) limiting the number of families eligible for net allowances and hence increasing the income base out of which the net cost of the plan is financed, and (2) a more rapid reduction in net allowances for each dollar of pre-allowance income received by a family.
The advantage of the Social Dividend Plan is that it guarantees a poverty-free minimum income. In other words, it would completely fill the poverty-income gap. It would make possible the elimination of public assistance, except in unusual cases, and perhaps reductions in some other social welfare programs. Aside from the heavy cost of the plan and its “inefficiency” (in the sense that most of the net allowances go to non-poor families), the plan has another disadvantage in that it fails to fit neatly into the existing income tax framework. This failure is due to two factors: (1) break-even levels of income are far in excess of the value of EX-MSD presently allowed a taxpayer, and (2) the definition of “income” would need to differ from that for general tax purposes. High break-even levels mean that many “positive” taxpayers will be net allowance recipients.
Figure 1 illustrates the relationship between the different tax schedules. Schedule ABC is the social dividend tax schedule and DE is the present positive tax schedule. The “combined tax schedule shows the allowance received or tax paid when both tax schedules are taken into consideration. Note that the combined schedule assumes that similar definitions of in- come are used for positive and social dividend tax purposes. The heavy cost of the plan will necessitate a broad definition of income for social dividend purposes-a definition of taxable income quite different from the present “taxable income” tax base.
8 The $30 billion is based on no adjustment for under-reporting of income in the Census survey. It assumes that no social welfare programs are reduced in scale. If public assistance were cut, the $30 billion figure would rise by half the amount of the cut. It also assumes no one does any less work because of the tax.

128 / CHRISTOPHER GREEN AND ROBERT J. LAMPMAN
FIGURE 1 A SOCIAL DIVIDEND PLAN
(Family of four)
3000~ / x .-,.- I "Combined" tax schedule /
C
0 Income
/ I Social dividend finance tax schedule - -
Q
A
Welfare-Oriented Negative Rates Plan This plan is a rehement of the Tax-Equity Negative Rates
Plan discussed above. It would recognize the following:
1. A family's poverty-income gap is a better guide to eligibility for allow- ances than is unused EX-MSD. Therefore, poverty lines are substituted for the value of EX-MSD used in the Tax-Equity Negative Rates Plan.
2. The present income tax unit often is not the same as the family unit which pools its income in order to meet its major items of expense. Thus the Welfare- Oriented Plan adopts a "basic" family tax unit consisting of spouses, all children under 19 years of age, and students under 22 years of age. The present income tax rules establishing dependency status would apply to persons outside the basic family unit.
3. The present definition of income for income tax purposes is an inadequate guide to a family's welfare. Therefore, as a step in the direction of a more com- plete evaluation of a family's economic position, family money income would replace adjusted gross income in determining eligibility for allowances.
The Welfare-Oriented Negative Rates Plan presumes that social insur- ance programs are to be continued and that the money income from these programs is to be included in the definition of income for negative tax purposes. Thus the negative rates allowances are designed to supplement

Symposium: The Negative Income Tax / 129
the earnings and social insurance income of poor families. Public asistance would be treated otherwise. That is to say, public assistance (P.A.) would be excluded from the definition of income for the purposes of determining eligibility for and the level of negative rates allowances. There are two reasons for this differential treatment of public assistance. One is that P.A., d i k e social insurance benefits, is conditioned upon a family’s present re- sources-of which income is an important component. Thus the level of public assistance would depend, in part, upon the level of negative tax allowances a family received. But if P.A. were included in the definition of income, negative tax allowances would depend, in part, on the levcl of P.A. It would be very difficult for welfare officials to determine what P.A. payments to make if the level of negative tax allowances depended on the level of P.A., and vice versa.
There is a second reason for excluding P.A. from the definition of income for negative tax purposes. The objectives of transfer-by-taxation are to pro- vide an income floor for all, to pay allowances to families only according to the family’s income and size, to reduce the disincentives created by 100 per cent tax rates, and to eliminate the stigma presently associated with being on relief. The objectives would be enhanced if P.A. were reduced to supplemental payments after negative tax allowances have been cal- culated. This would maximize the negative allowances paid to a family on P.A. and minimize its P.A. receipts.
The cost to the federal government of the Welfare-Oriented Plan, using the defbitions stated above and a 50 per cent tax rate, would have been $6.3 billion in 1964. This figure is a combination of $8 billion in negative tax allowances and an estimated $1.7 billion reduction in federally financed public assistance payments.
This plan, like the others, has some shortcomings. It does not tie neatly into the existing individual income tax system because at several points the plan departs from concepts used by the positive system. For example, the use of poverty lines rather than EX-MSD as break-even levels of income means that some small families (less than four members) would be both taxable and eligible for allowances. Moreover, the broader defmition of income and the “basic” family tax unit utilized by the plan mean that there would be two different definitions of income and tax unit within the individual income tax system. These might create administrative problems.
One disappointing feature of the Welfare-Oriented Negative Rates Plan is that it would require some supplementation by public assistance if none of the present poor are to be made worse off. If the tax rates to be paid by the working poor are to be kept at low levels, then, given the low break-even

130 / CHRISTOPHER GREEN AND ROBERT J. LAMPMAN
level of income, the guaranteed minimum income would be lower than the benefits public assistance provides in some of the states.
The Incentives Question It will be apparent to the reader that the tax rate used in a
plan is critical to its outcome. Given a low break-even point, a tax rate lower than 50 per cent would not do much to fill the poverty-income gap. But why not apply a higher than 50 per cent rate to the pre-allowance incomes of the poor? Indeed, why not apply a 100 per cent rate? The basis for not doing so is that such a high rate would have undesirable side effects. It seems reasonable to assume that a 100 per cent tax rate would reduce the supply of work effort at given wage rates, although it must be admitted that there is not an overwhelming amount of empirical evidence leading to this conclusion. On the other hand, we are not aware of evidence to the contrary.
Today the only instance of a 100 per cent tax rate is found in relief programs. The retirement test in Old Age, Survivors, and Disability Insur- ance has effective rates of 50 per cent, followed by 100 per cent, over a short range of earnings. The rate at which unemployment compensation benefits are reduced is generally lower than 50 per cent of added wages. Reducing the rewards for extra work effort by more than 50 per cent of wages is relatively rare. A few very high income earners are currently earning enough to fall into a 50 per cent or higher tax bracket on part of their earnings. Studies of such earners have shown that high marginal rates appear to have a negligible effect on the amount of work effort sup- plieda9 However, what is true of highly paid executives and professionals may not be true of very low income, generally unskilled, workers. Status, power, and the demands of business associates and clients may be as im- portant as net compensation rates in determining the amount of work effort an executive or professional supplies. This is not so likely to be the case in occupations providing low pay.
High tax rates within a given income range might not be the only factor to dampen work incentives. Another factor could be the guaranteed mini- mum income itself.” Some of the poor might find that the guaranteed
9 Thomas Sanders, Effects of Taxation on Executiues (Boston: Graduate School of Business Administration, Harvard University, 1951); George F. Break, “Income Taxes and Incentives to Work: An Empirical Study,” American Economic Review, XLVII (September, 1957), 529-549; James N. Morgan, Robin Barlow, and Harvey E. Brazer, “A Survey of Investment Management and Working Behavior Among High Income Individuals,” American Economic Association, Papers and Proceedin s, LV (May, 1965), 252-264.
10 See the study fl y C. T. Brehm and T. R. Saving on “The Demand for General Assistance Payments,” American Economic Reuiew, LIV (December, 1964), 1017-18.

Symposium: The Negative Income Tax / 131
minimum is as high or higher than their present earnings. While it is not likely that many poor families are satisfied with their present income level, it is possible that some (probably only a few) families might be content to stop work and simply substitute the guarantee for present earnings. A similarly unknowable number of persons might, because of the guarantee, be less pressured to seek an end to unemployment or to undertake an arduous training or retraining program. Moreover, a negative tax rate would tend to reduce the dollar value of training allowances; a 100 per cent tax rate would, in many cases, reduce it to zero.
What about disincentives to work, save, and invest resulting from higher taxes on the non-poor, who would, of course, have to bear the net cost of the several plans reviewed above? Only the Social Dividend Plan would require a notable increase in tax rates for the non-poor. As Figure 1 sug- gests, a 14 per cent social dividend tax on all income above the break-even level combined with the present income tax rates would make for relatively high marginal rates on taxable income for upper income families. Under such a plan, 50 per cent tax rates would apply at the lowest and the upper income levels. Persons subject to such a rate would find not only wages but also property incomes, social security benefits, and private pensions sigdicantly altered.
Would transfer-by-taxation provide an inducement to have more chil- dren? An additional child in a poor family means a $500 increase in the poverty gap and a $700 increase in unused EX-MSD. With a 50 per cent negative tax rate an additional child could mean as much as $250 to $350 more in net allowance. A higher tax rate would, of course, mean higher allowances. The possible effect on the incentive to have children is even less clear than in the case of the incentive to work. Additional children in an already poor family only increase the family’s poverty. The negative tax allowances do not fully offset this increase in poverty if the tax rate is less than 100 per cent.
Some account must also be taken of the possible effects a transfer-by- taxation plan would have on marriage and separation rates. Simply for getting married to a person with no income, a single person who earned a break-even or lower level of income would receive a $250 increase in income if the tax rate were 50 per cent or $500 if the rate were 100 per cent. A more significant social problem might derive from the tax penalty which would be placed on a marriage between two single persons with disparate in- comes. In some cases their combined incomes and negative tax allowances after marriage would be much lower than before. Fathers with above break- even levels of income might find that a negative rates plan so well defends
132 / CHRISTOPHER GREEN AND ROBERT J. LAMPMAN
their families’ financial well-being that they are more likely because of the plan to desert their families.
All &ese possible incentive effects are no doubt enhanced by a higher tax rate. Moreover, there are a number of equity problems, e.g., the urban- rural comparison, which are intensified by a higher rate. The effects are hard to appraise, but they restrain us from going beyond a 50 per cent rate. In addition to provoking socially undesirable behavior, a 100 per cent rate would materially alter the cost estimates. We calculate that the Welfare- Oriented Negative Rates Plan would cost $6.3 billion with a 50 per cent rate and about $25 billion with a 100 per cent rate.
The three plans discussed so far are designed to cover all the popula- tion. However, it would be possible to restrict benefits to some selected parts of the population. Two such categorically limited plans are discussed below.
The Child’s Entitlement Plan Thk Welfare-Oriented Negative Rates Plan could be modi-
fied to confine eligibility for negative tax allowances to a specific demo- graphic group, namely, families with children. This approach could be rationalized on the basis that the present income maintenance system does less for children than other groups among the poor, that 60 per cent of the members of poor families are children,ll and that income channeled in the direction of children would represent an investment in the future. The cost of the child’s entitlement, using 50 per cent rates, would have been $3.5 billion in 1964.
This plan would have all the shortcomings of the welfare-oriented plan. In addition, a problem of equity between the poor with and without chil- dren would be created. Using the poverty lines and tax rates discussed above, a family’s maximum allowance would jump from zero with no chil- dren, to $1,250 with one child, to $1,500 with two children. Clearly, a new schedule of allowances would be called for, and it would, unfortunately, have to be one which filled less of the poverty-income gap for families with one or two children.
The Earned-Income Supplement Plan Public assistance, as presently designed and administered, is
generally not available to families headed by an able-bodied male. Why not, then, tailor transfer-by-taxation to cover only the “working poor,” who,
11 Mollie Orshansky, “Who’s Who Among the Poor: A Demographic View of Poverty,” Social Security BuUetin, XXVIII (July, 1965), 14. “Families” exclude unrelated individuals.

Symposium: The Negative Income Tax / 133
with their families, were 24 d o n of the nation’s 32 million poor persons in 19M and leave the “categorical poor” to public assistance? A plan for this group would, presumably, need to pay careful attention to the prob- lem of incentives and not so much attention to the level of the guarantee since the idea is to supplement earnings. Hence, the plan tailored for this group would provide a family of four with an allowance of $750 so long as its income was less than $1,500. In other words, a zero tax rate would apply for non-assistance income levels up to $1,500. Once the family’s pre-allow- ance income goes above $1,500, a 50 per cent rate would apply, i.e., the allowance would be reduced 50 cents for each extra dollar earned and would fall to zero net allowance when the family’s pre-allowance income reaches $3,000. Eligibility for earned-income supplements would be confined to those who are not receiving P.A. In 1964, the plan would have cost about $4 bJlion.
The shortcomings of this plan are associated with its categorical nature. Equally poor families may be treated differently by P.A. and by the earned- income supplement. Some of the present poor might be poorer after the plan is adopted if state and local P.A. policymakers modified their eligibility requirements because of the new plan.
Alternatives to Transf er-B y-Taxation What alternatives, short of negative taxation, are there that
would provide substantially improved income maintenance for the poor? On the one hand, there is expansion of and changes in the present public assist- ance and social insurance programs. On the other hand, new programs could be adopted, such as family allowances and a cash tax credit.
Public assistance. Public assistance programs are designed to meet par- tially the needs of certain categories of the poor.ia Although the number of families receiving P.A. has grown, only about a third of poor families and a quarter of poor persons received P.A. in 1965. Many of the poor do not receive P.A. because they fail to pass the means test (which compares a budget plan of expenditures with potential resources), fail to meet resi- dence qualifications, do not know of their possible eligibility, or are fright- ened off by the stigma they feel is attached to receipt of relief payments. But many more of the poor receive no P.A. simply because they do not fall into any one of the prescribed categories.
There are two general ways to increase payments to the poor by public
12 Old Age Assistance, Aid to the Permanently and Totally Disabled, Aid to the Blind, and Aid to Families with Dependent Children. In addition, there is the General Assistance program. At any one time about eight million persons are receiving P.A.

134 / CHRISTOPHER GREEN AND ROBERT J. LAMPMAN
assistance. One is to improve benefits for the established categories. The other is to open up new categories. It is not hard to imagine constructive use of $3 billion of federal funds to raise minimum benefits, make them uniform in all states, and get rid of residence requirements. It takes con- siderably more imagination to see how the opening of new categories would work, since one confronts the problem of what to do with the working poor. For reasons reviewed above, the reduction of benefits by an amount equal to each increment of earnings cannot lightly be extended to the working poor. Hence, it would be desirable to introduce a category of P.A. recipients for whom a lower than 100 per cent tax rate is applied. This would not produce equity in the sense that equally poor families be- fore assistance are equally poor after assistance. The equity problem can only be handled by putting all categories under one plan. Pursuit of an incentive system would lead to an earned-income supplement, and a search for equity would lead to the welfare-oriented negative rates plan.
If P.A. programs were reformed along the lines suggested above, it would be difEcult to distinguish the reformed P.A. program from transfer- by-taxation. True, the administration of the programs might differ some- what, but the fundamentals would be the same. Eligibility for payments would be income-conditioned and payments more or less standardized throughout the country. An income floor would be provided for the poor and additions to earnings would not be wholly offset by reduction in P.A. payments. This suggests that reform of P.A. may be one way of achieving the goals that a negative tax plan is designed to achieve. However, it may not be the best or shortest route and would necessitate a major break with P.A. traditions.
Social insurance. Although coverage by our social insurance programs is broad, eligibility for receiving benefits is restricted to those who are aged, disabled, survivors of insured workers, or unemployed. This means that only a fraction of the poor (and the non-poor) are eligible at any given time to receive income from the social insurance programs. This is not to under- estimate the importance of the social insurances, which in 1961 were re- sponsible for keeping nearly four million families out of poverty. But, like public assistance, the present social insurance approach is categorical in nature and thus of limited usefulness as a measure to reduce poverty further. It is, of course, possible to add new categories of insured. For example, society could insure children against the possibility of being born into a poor family. However, it is difficult to insure against all the eventuali- ties that may lead to poverty.
Some steps toward reducing the number of poor persons and families
Symposium: The Negative Income Tax / 135
could be taken without adding to the number of present social insurance programs. For example, the level of OASDI and unemployment compen- sation (U.C.) payments could be raised, all aged persons and survivors could be “blanketed in,” U.C. could be extended to all workers, and the period during which an unemployed person is eligible for benefits could be extended. These efforts could bring as many as seven million persons out of poverty.lS The difficulty with this approach is that it would be ex- tremely costly. The benefits paid could not be confined to the poor. Raising benefit levels would mean raising them for all or most OASDI and U.C. beneficiaries. It would have cost, in 1964, $11 billion in the form of a 50 per cent increase in OASDI benefits to get 2.5 million aged persons out of poverty. Only about $3 billion of that amount would have been received by the poor. Thus the social insurance approach must be termed rather in- efficient.
Family allowances. Some thirty nations, mostly European, have adopted systems of family allowances or payments to families with children, the purpose of which is to promote the welfare of dependent children. The rationale for family allowances is that the modem industrial system fails to accommodate for differences in family size.’* The difficulty with the family allowance as an antipoverty weapon is similar to the difficulty with the social insurance approach. It is inefficient because payments would be made to both the poor and non-poor. The poverty gap of families with children is estimated to have been $7 billion in 1964; the gap per poor child was $470.15 However, if all children under 18 (not just poor children) had received $235 a year, the cost of the family allowance plan would have been $16.1 billion, only $3.5 billion of which would have gone to those who were poor.le
Family allowances could be income-conditioned, as they are in Den- mark. That is, the level of family allowance payments could be varied both with number of children and with family income, reaching zero at some specified level of family income. If such an approach were adopted it is hard to see how it would differ in substance from the Child’s Entitle- ment Plan discussed above.
Tax credit. Suppose, instead of concentrating on transfers, we were to refund the taxes, direct and indirect, that the poor pay. Some analysts have
13 In 1963, there were 5.2 million aged poor and 1.9 million poor persons living in families
14 James Vadakin, Family Allowances (Miami: University of Miami Press, 1958), pp. 14. 16 $7 billion divided by 14.8 million poor children. This means filling the poverty gap of
16 In 1964 there were approximately 69 million children under 18 years of age.
headed by an unemployed worker. Orshansky, op. cit., pp. 12-13, 28.
the parents as well as that of the children.

136 / CHRISTOPHER GREEN AND ROBERT J. LAMPMAN
estimated that the poor pay nearly 30 per cent of their income in taxes of one form or another.17 If the poor, in 1961, received cash payments equal to 30 per cent of their incomes, 3.3 million families would have been lifted out of poverty at a total cost of $4.5 billion.ls
The difEculty with such a tax credit plan is that it is perverse in the sense that the level of payments varies directly rather than inversely with the level of the family’s pre-tax credit income. The tax credit does most for the “best-of€‘‘ poor and least for the “worst-off poor. This is so because the tax credit is a percentage of the family’s income. The cash tax credit also creates a “notch” problem. If only families with income below their poverty line are eligible to receive a credit, families with income just above the poverty line could increase their money income by reducing their before tax credit income to a level which made them eligible to receive a tax credit.
If the tax credit were revised to avoid perversity and to get away from the notch problem, it would be a negative rates tax plan.
Conclusion We have reviewed nine Werent schemes for adding to the
incomes of the poor. On close examination, the number shrinks to six which are really different from one another. The tax equity and tax credit plans are only crude variants of the welfare-oriented plan; and the family allow- ance, if it is income-conditioned, is similar to the child’s entitlement plan.
Which of the six would make “best” use of the nation’s resources depends on the priority one accords each of several questions. If one asks, Which scheme will close the poverty-income gap at the least cost? then the answer is, the social dividend plan at a cost of $30 billion. If, on the other hand, one asks, Which plan does the most to close the gap per dollar spent? then the answer is not the social dividend (which pays only $12 out of $30 billion to the poor), but an expanded, still categorical P.A. or any one of three negative rates plans. Note that social insurance falls out of the running on both counts.
If we give priority to the second question, the choice is cut down to one noncategorical plan-the welfare-oriented plan-and three categorical plans, namely, improvements iri P.A. which exclude the working poor, the
17Richard Musgrave, “The Incidence of the Tax Structure and Its Effects on Consump tion,” in Federal Tax Po2iy for Economic Growth and Stability, Joint Economic Committee, Subcommittee on Tax Policy, 84th Cong., 1st sess. (Washin ton, D.C.: 1956), Table 2, p. 98.
the Bureau of Labor Statistics’ Survey of Consumer Expunditure, 1960-61, made for the US. Treasury Department, Office of Tax Analysis.
1s The estimates are derived by the authors from Su % project B of a special tabulation of

Symposium: The Negative Income Tax / 137
earned-income supplement, and the child's entitlement. The non-categorical plan would cost about $6 billion and each of the others would cost be- tween $3 and $4 billion. The choice is not necessarily an exclusive one. For example, P.A. improvements could be combined with the earned-income supplement.
A way to make the choice as set out is to ask the question, Which of the four plans causes the least deviation from an equity standard? To that question the answer is clear; it is the welfare-oriented negative rates plan. Therefore, while there is a case to be made for each of the several plans reviewed, we conclude that the strongest case is that for the noncategorical plan which would fill half the remaining poverty-income gap. The adoption of this plan, along with evolutionary improvements in existing public and private transfer programs, would constitute one important aspect of a broad-ranging war on poverty.