Scenario Planning Model Report - Amazon Web … · scenario planning, which is a rapidly evolving...
31
APA-FEMA ComRes Study - Task 3 Technical Report - FINAL 8-18-16 r1 INNOVATIONS IN PLANNING AND PUBLIC ENGAGEMENT FOR COMMUNITY RESILIENCE TASK 3 – SCENARIO PLANNING MODEL REPORT Introduction Planners’ increased knowledge of post-disaster recovery processes, and the ongoing development of technological tools to facilitate analysis, visualization, and public engagement in the planning process, have made it clear that recovery and resilience planning is undergoing significant and positive changes that will continue well into the future. These changes can significantly improve the preparedness and resilience of communities that undertake this process; however, much will depend on the communities’ capacity to use the tools and processes that become available to them, and to apply the resulting information. Therefore, developing sound, knowledgeable, and forward-looking guidance for the planners and allied professionals most likely to employ such tools and processes in advancing the recovery process is essential to helping the Federal Emergency Management Agency (FEMA), states, and communities fulfill the whole community vision of resilience in the face of future disasters. The job of the planner is not merely to find out what the community wants in a rebuilt community after a natural disaster. It is more importantly the job of the planner to inform community members and leaders of the consequences and implications of the meaningful choices they will make, and to ensure that the best science and technical information are conveyed in ways that both raise the level of awareness of residents and develop a culture of informed decision making and preparedness. In addition, it is the job of the planner to ensure that these important planning considerations are brought forward not only after a disaster occurs, but perhaps more importantly that they are brought forward as community plans are updated prior to the occurrence of a natural disaster. Furthermore, behavioral scientists have long understood that this type of planning cannot be done simply through the release and presentation of technical information to the public; information must be conveyed in ways that create accurate mental images of the alternatives and implications for those participating in the process. Fortunately, modern visualization, scenario-building, and public participation tools are making that easier year by year. The prospect is that the conclusions people reach about desired alternatives to create a more resilient community will be better informed and lead to demonstrable improvements in outcomes. For this project, known as “Innovations in Planning and Public Engagement for Community Resilience”, APA formed a partnership with the University of California, San Diego (UCSD),
Transcript of Scenario Planning Model Report - Amazon Web … · scenario planning, which is a rapidly evolving...

APA-FEMA ComRes Study - Task 3 Technical Report - FINAL 8-18-16 r1
INNOVATIONS IN PLANNING AND PUBLIC ENGAGEMENT FOR COMMUNITY RESILIENCE
TASK 3 – SCENARIO PLANNING MODEL REPORT
Introduction
Planners’ increased knowledge of post-disaster recovery processes, and the ongoing development of technological tools to facilitate analysis, visualization, and public engagement in the planning process, have made it clear that recovery and resilience planning is undergoing significant and positive changes that will continue well into the future. These changes can significantly improve the preparedness and resilience of communities that undertake this process; however, much will depend on the communities’ capacity to use the tools and processes that become available to them, and to apply the resulting information. Therefore, developing sound, knowledgeable, and forward-looking guidance for the planners and allied professionals most likely to employ such tools and processes in advancing the recovery process is essential to helping the Federal Emergency Management Agency (FEMA), states, and communities fulfill the whole community vision of resilience in the face of future disasters. The job of the planner is not merely to find out what the community wants in a rebuilt community after a natural disaster. It is more importantly the job of the planner to inform community members and leaders of the consequences and implications of the meaningful choices they will make, and to ensure that the best science and technical information are conveyed in ways that both raise the level of awareness of residents and develop a culture of informed decision making and preparedness. In addition, it is the job of the planner to ensure that these important planning considerations are brought forward not only after a disaster occurs, but perhaps more importantly that they are brought forward as community plans are updated prior to the occurrence of a natural disaster. Furthermore, behavioral scientists have long understood that this type of planning cannot be done simply through the release and presentation of technical information to the public; information must be conveyed in ways that create accurate mental images of the alternatives and implications for those participating in the process. Fortunately, modern visualization, scenario-building, and public participation tools are making that easier year by year. The prospect is that the conclusions people reach about desired alternatives to create a more resilient community will be better informed and lead to demonstrable improvements in outcomes. For this project, known as “Innovations in Planning and Public Engagement for Community Resilience”, APA formed a partnership with the University of California, San Diego (UCSD),

Innovations in Planning & Public Engagement for Community Resilience Task 3 – Scenario Planning Model Report
2
Placeways LLC, the National Charrette Institute (NCI), and Orion Planning & Design to identify the best ways to use cutting-edge technological tools and participatory processes to engage citizens in the hazards planning process. In Task 1, APA staff conducted a literature search of this topic, and compiled an annotated bibliography, which is intended to identify the best resources with regard to visualization tools, scenario planning for resilience and recovery planning, and related topics. In Task 2, an advisory committee was assembled, bringing together leading experts from public agencies, universities, technology firms, and urban planning and design firms that are directly involved in technical analysis, geographic information systems, visualization tools, scenario planning tools, and other methods of helping communities conceptualize alternative futures, particularly as they apply to a post-disaster context. In Task 3 of this project, the UCSD Bioregional Center for Sustainability Science, Planning and Design (Bioregional Center) is working with Placeways and Orion Planning & Design to lay out an overall approach for constructing and using a community resilience scenario planning model (CRSPM) that will allow planners to map and analyze existing and projected future flooding hazards in urban neighborhoods, and to develop community resilience strategies that can mitigate these flooding and floodplain-related hazards. CRSPM and related approaches can help communities develop informed planning strategies to address the risk of inland flooding at neighborhood and site scales. This effort builds on modeling work being conducted by UCSD and Placeways on tools for water resource management and green infrastructure planning, such as the Water Quality Scenario Planning Model (WQSPM)1 and the Urban Agriculture Suitability Analysis Model (UASAM) 2 It should be noted that these models are the first components of the Bioregional Center’s overall plan for a comprehensive Spatial Analysis and Planning Toolbox, which will be a set of integrated GIS-based modeling tools for preparing, analyzing, and visualizing alternative land use/transportation scenarios. These tools will support expanded and innovative work in scenario planning, which is a rapidly evolving technique for evaluating alternative land use and transportation scenarios and their effects on key urban and environmental systems, producing analytical reports, and using visualization to help stakeholders understand the implications of different policy choices. Common planning practice has traditionally treated flood risk simply: The boundaries and associated regulatory constraints expressed in FEMA’s flood insurance rate map (FIRM) and largely state-derived floodplain regulations are taken as static and given. Local comprehensive plans and zoning regulations typically have addressed flooding hazards (if at all) with the straightforward mechanism of avoidance: permitted land uses and density allowances are either reduced or eliminated in flood-prone areas. As a result, these areas are typically
1 Spatial Analysis and Planning Toolbox Phase I: Water Quality Model. Documentation and User Manual. R. Leiter,
J.B. Hinds, C. Luna – UCSD Urban Studies and Planning Program and A. DeBay, Placeways LLC. November, 2015. 2 Model Documentation – UCSD Urban Ag Suitability Model by R. Leiter and C. Larsen - UCSD and A. DeBay and D.
Walker – Placeways. May, 2016.

Innovations in Planning & Public Engagement for Community Resilience Task 3 – Scenario Planning Model Report
3
restricted to “open space” land uses and are viewed has having significantly less economic value than adjoining properties that are outside the flood hazard areas. In some cases, it is possible for structural improvements such as concrete culverts and levees to be constructed, in order to reduce the areas that are subject to flood hazards. However, these solutions are often expensive and may lead to serious negative environmental consequences. By contrast, the planning process for flood prevention used by the US Army Corps of Engineers does use a probabilistic simulation process that employs a Monte Carlo simulation approach to flood damage reduction. The nature of flood hazards, and the methods available for forecasting both the extent and depth of flood inundation, are changing. Beyond the recognized issues of sea level rise for coastal communities and infrastructure, observations have shown changes in historic storm patterns and rainfall intensities in many U.S. regions3. Numerous studies including US EPA research4 indicate that in recent years, a larger percentage of precipitation has come in the form of intense single-day rain events. The extent and duration of drought also is changing, with both intense precipitation and extended dry periods anticipated to be experienced more often and in more parts of the US under climate change scenarios5. Both of these trends make static flood zone mapping less useful as a planning tool. Intense storms may lead to flooding in unexpected areas well beyond mapped flood zones – especially localized street flooding, when storm drainage systems become overwhelmed by intense precipitation volumes. Lengthy dry spells or drought conditions, conversely, create challenges not only for flood models, but for public engagement in resilience planning if dry extended conditions become the ‘norm’ and the potential danger of flooding recedes from the public mindset. In response to the changing nature of this hazard, FEMA’s Federal Mitigation Investment Strategy (FMIS)6 incorporates four concepts that reflect the dynamic nature of local hazards and the need for a more dynamic approach. The FMIS focuses on (1) Resilience and Sustainability, (2) Leadership and Locally Focused Implementation, (3) Engaged Partnerships and Inclusiveness, and (4) Risk-conscious Culture. Visualization tools, properly applied, can play an important role in all four of these focus areas. As planners and decision-makers have begun to recognize the value of integrating water resource planning with other aspects of planning for the natural environment and the built environment, an evolving concept of green infrastructure has emerged. The definition of green infrastructure planning means different things to different practitioners, and it can also apply differently at different scales. The original intent in using the word infrastructure with green was to elevate the societal value and functions of natural lands and systems to the same level of importance as conventional constructed or gray infrastructure. Often
3 Hossain, F. J. Arnold et al., “Local-to-Regional Landscape Drivers of Extreme Weather and Climate: Implications
for Water Infrastructure Resilience.” Journal of Hydrologic Engineering, 2015.20. 4 https://www3.epa.gov/climatechange/science/extreme-weather.html
5 California Department of Water Resources, “California Climate Science and Data for Water Resources
Management.” June 2015. 6 http://www.fema.gov/national-mitigation-framework/

Innovations in Planning & Public Engagement for Community Resilience Task 3 – Scenario Planning Model Report
4
the phrase green infrastructure refers specifically to systems and practices that use or mimic natural processes to improve water quality. However, a broader definition of green infrastructure planning can include restoration of the hydrologic function(s) of the region’s landscape, as well as managing stormwater. Many green infrastructure plans include open space planning, conservation of habitat and green spaces, urban forestry, and stewardship of land within urban park systems. While the role of green infrastructure stormwater management methods in reducing runoff volumes and flood impacts is a subject of great interest and an increasing body of research in stormwater engineering (as discussed later in this report), the role of natural and constructed green infrastructure features in promoting water quality, attenuating flood waters, and enhancing community resilience makes it an important feature in the context of scenario planning and visualization. The aim of CRSPM will be to improve common practice by providing a method to visualize and communicate more sophisticated—yet still accessible—understanding, analysis, and strategies, in the context not only of flood hazard mitigation planning but also in the context of green infrastructure planning and comprehensive planning for sustainability. In the tool we envision:
Risk to life and property from flooding can be estimated by taking into account both likelihood of inundation and impact scores. However, this model is not intended to replace FEMA’s HAZUS7 software or Risk MAP8 program. It will use more approximate methods designed for fast processing, broad area coverage, and the ability to make on-the-fly changes to test alternative assumptions and scenarios. This paper does, however, recommend methods of incorporating outputs from common flood engineering models into this model.
Neighborhoods or sub-areas can be evaluated or ranked according to different categories of risk including risk to property, infrastructure and natural resources, allowing a community to set priorities for its mitigation efforts
A variety of different green infrastructure strategies can be considered at the neighborhood scale in addition to simple avoidance, and the potential benefits of incorporating different types of green infrastructure into the community’s stormwater management system may be able to be evaluated in more detail if outputs from other engineering and modeling tools are incorporated.
Flood hazard area boundaries can be expanded and in some cases defined in different ways to reflect potential, approximated future changes under different climate change scenarios.
The tool that is described in this report would be constructed as a CommunityViz analysis model, which could be applied in an existing or planned urban area at a small-area (neighborhood) scale. CommunityViz9 works as an extension to ArcGIS for Desktop10 and is
7 See https://www.fema.gov/hazus/ 8 See https://www.fema.gov/risk-mapping-assessment-and-planning-risk-map
9 See http://placeways.com/communityviz

Innovations in Planning & Public Engagement for Community Resilience Task 3 – Scenario Planning Model Report
5
widely used by planners for all aspects of comprehensive planning. Creating this model in CommunityViz will make it easier for planners to include flood hazards as an integral part of comprehensive planning activities along with traditional topics like housing and transportation. This report will cover the following topics:
How would we define an overall planning framework that would allow us to understand the potential community impacts of flood hazards, including increased flood hazard risk resulting from climate change, both individually and in the context of other important environmental, economic and social factors that are typically considered in community- and neighborhood-scale planning processes? For example, one of the under-studied issues is the impact of flood hazard designations on property values and property tax revenues. Another concerns the social resilience of a neighborhood that has been subject to flooding, or where buyouts have begun to occur.
How would we design a community resilience scenario planning model (CRSPM) in CommunityViz that would allow us to make valid comparisons of costs and benefits of various flood hazard mitigation approaches at a neighborhood scale? How could the CRSPM be linked with other scenario planning models, such as “smart mobility” and public health impact models, to evaluate these costs and benefits in the context of other important environmental, economic, and social factors that must be considered in planning for sustainable outcomes?
What are the crucial technical issues related to making informed predictions of the effects of flood hazards in urban areas at a neighborhood scale? What additional issues come into play when we try to consider the possible effects of climate change on our predictions? As one example, there is a complex relationship between the capacity of soil and vegetation to capture stormwater runoff as a result of more extended dry periods, and then more intensive peaks or “rain bombs.” We may be able to model and illustrate the benefits of greater tree canopy coverage or vegetative changes in relation to these impacts, but doing so will require inputs from climate and engineering models and studies.
How could our scenario planning models and tools be used in conjunction with a public engagement process that would engage community stakeholders and the general public in authentic participation and decision-making around these complex issues?
A. Overall Planning Framework In the context of urban planning theory and practice, urban planning scholar Timothy Beatley suggests that “a true shift toward sustainability ultimately will require what I call green regions:
10
See http://www.esri.com/software/arcgis/arcgis-for-desktop/

Innovations in Planning & Public Engagement for Community Resilience Task 3 – Scenario Planning Model Report
6
spatial units that mix urban settlements with surrounding hinterlands and ecosystems and that together yield compact, sustainable cities and settlement patterns” [7, p. 140]. Beatley suggests that we take a holistic view of green regionalism, considering it from the perspectives of ecology, biodiversity, sustainable urban form, resilience, and “sustainable metabolism.” As a result, “part of the goal in regional sustainability planning will thus be to ensure that a region is able to satisfy a significant amount of its own biophysical needs, namely water, energy and food”11. One important yet challenging aspect of green regionalism is recognizing how green regions of the future will connect to other regions and the rest of the world, and how local plans and actions are connected to regional and global outcomes. Beatley suggests that in terms of setting realistic goals for green regions, we consider “self-reliance” as a way to measure our progress, and that we consider a concept of glocalism, which holds that regions have a duty both to shift to the local and regional and to recognize and accept their global duties and responsibilities that reflect the inherent interconnectedness of the planet”12. Integrated Planning Framework Stephen Wheeler has observed that “one of the paradoxes of planning is that many social and environmental problems are best approached at a regional scale, but this is usually the weakest level in terms of government institutions and public understanding” 13 This paradox is clearly one of the major challenges in looking at a “green region” or “bioregion” as the appropriate scale in which to develop plans and strategies that focus on human health and ecological health, while giving due consideration to the socio-ecological justice implications of our proposed solutions. Recognizing this paradox has led urban planners toward the use of an Integrated Planning Framework (IPF) for analyzing problems and identifying spatially-based solutions within a complex planning and regulatory environment. In its simplest form, an Integrated Planning Framework looks at plans and policies from two main perspectives:
Topical Areas – understanding the characteristics of plans and policies that are focused on particular topical areas of place-based planning ( e.g., land use, transportation, housing, economic development, environmental systems, demographics, infrastructure, and natural hazards) and
11 Beatley, T. Green Regions, Green Regionalism. In: Seltzer E, Carbonell A, editors. Regional Planning in America:
Practice and Prospect. Cambridge MA: Lincoln Institute of Land Policy; 2011: p. 164. 12 Beatley, T., p. 169-170. 13 Wheeler, SM. Planning for Sustainability: Creating Livable, Equitable and Ecological Communities. Abingdon Oxon:
Routledge, 2013: p.401.

Innovations in Planning & Public Engagement for Community Resilience Task 3 – Scenario Planning Model Report
7
Geographic Scale – understanding the characteristics of the various scales at which urban and environmental plans and policies are being developed (e.g., regions, cities, communities, and small areas such as neighborhoods, corridors, and activity centers).
The IPF concept is drawn from many years of urban and environmental planning research and practice. In 2004, Professor David Godschalk set forth the concept of an “integrated framework of plans” (also described as a “network of plans”) to illustrate how comprehensive plans could address the topics of land use, transportation, economic development, housing, and the natural environment in a systematic and integrated fashion, and could also be viewed in terms of their scalar integration: from Regional Level to City Level to Small-area Level14 . More recently, the concept has been further refined in the American Planning Association (APA) Planning Advisory Service Report, Sustaining Places: The Role of the Comprehensive Plan15. For example, this report includes an expanded discussion of the concept of vertical integration of comprehensive plans across geographic scales, including not just regional scale, city scale and small-area scale, but more specifically at the county, rural, community and “master plan” scales. The authors also assert that “the region is the most appropriate scale to comprehensively address sustainability because the resources to be sustained are, at a minimum, regional – whether related to the environment (air, water, and habitat), the economy (labor, jobs, infrastructure, and physical capacity), or social equity (fair housing and access to opportunities)”16. The report provides several examples of local and regional comprehensive plans that are designed to lead toward sustainable outcomes, and describes various ways in which horizontal integration (across topical areas) and vertical integration (across scales) of plans and policies can be achieved. Integrated Planning for Sustainability The APA Sustaining Places report addresses not only the importance of vertical and horizontal integration of plans, but also the need to include a clear definition and corresponding principles for sustainability itself. The report begins with a proposed definition of planning for “sustaining places” as follows:
“Planning for ‘sustaining places’ is a dynamic, democratic process through which communities plan to meet the needs of current and future generations without compromising the ecosystems upon which they depend by balancing social, economic,
14 Godschalk DR. Land Use Challenges: Coping with Conflicts in Visions of Sustainable Development and Livable
Communities, in J Am Plan Assoc. 2004 Winter; 70(1, p. 10. 15 Godschalk DR, Anderson WR, Sustaining Places: The Role of the Comprehensive Plan. Chicago: American
Planning Association; 2012: 97. 16 Godschalk and Anderson, p. 47.
Innovations in Planning & Public Engagement for Community Resilience Task 3 – Scenario Planning Model Report
8
and environmental resources, incorporating resilience and linking local actions to regional and global concerns”17.
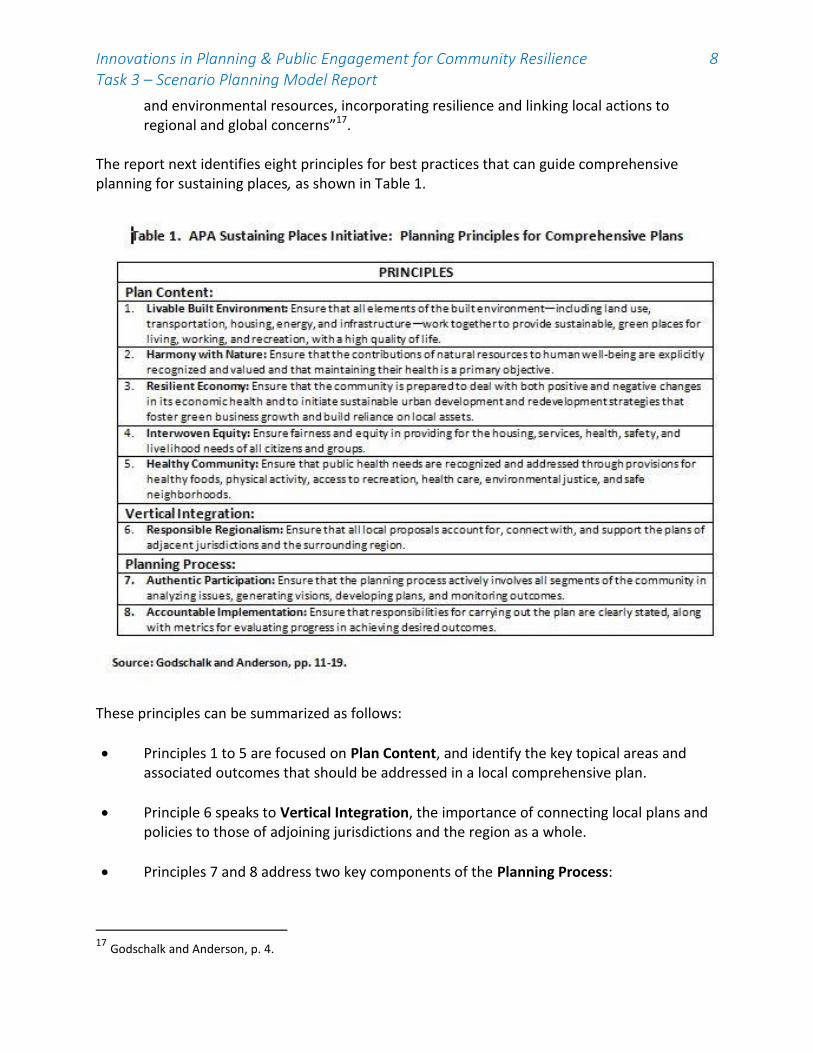
The report next identifies eight principles for best practices that can guide comprehensive planning for sustaining places, as shown in Table 1.
These principles can be summarized as follows:
Principles 1 to 5 are focused on Plan Content, and identify the key topical areas and associated outcomes that should be addressed in a local comprehensive plan.
Principle 6 speaks to Vertical Integration, the importance of connecting local plans and policies to those of adjoining jurisdictions and the region as a whole.
Principles 7 and 8 address two key components of the Planning Process:
17 Godschalk and Anderson, p. 4.

Innovations in Planning & Public Engagement for Community Resilience Task 3 – Scenario Planning Model Report
9
o Authentic Participation through active involvement by all segments of the community; and
o Accountable Implementation through clear delineation of implementation responsibilities and identification of metrics for measuring progress in achieving desired outcomes.
Authors of other recent publications from the American Planning Association have been using this evolving concept of an Integrated Planning Framework as a way to help planners who are focusing on sustainability to consider, among other things, the important interrelationships among key topical areas, while also understanding the important interrelationships between plans and policies at different scales. Green Infrastructure Planning As discussed previously, the concept of green infrastructure planning has evolved over the past several years to become one of the essential building blocks of integrated comprehensive planning. In 2013, APA published a PAS report titled Green Infrastructure: A Landscape Approach that among other things provides guidance as to how green infrastructure planning can be viewed from an integrated planning perspective. The report identifies six principles that inform the planning and design of green infrastructure across the different disciplines and scales of professional practice:
1. Multifunctionality 2. Connectivity 3. Habitability 4. Resiliency 5. Identity 6. Return on Investment.18
Specifically, the report discusses the principle of resiliency as follows:
Defined as the ability to recover from or adapt to disturbance and change, resiliency is particularly relevant in a time when natural and human ecosystems are experiencing accelerating change and instability, ranging from higher energy prices to economic shocks to the projected effects of climate change. Examples of how green infrastructure can increase community resiliency across scales include:
Trees and green roofs can counteract the urban heat island effect at the city scale and reduce the cooling needs of individual buildings.
18 Rouse, D and Bunster-Ossa, I, Green Infrastructure, A Landscape Approach. Chicago: American Planning
Association; 2013. p.18.

Innovations in Planning & Public Engagement for Community Resilience Task 3 – Scenario Planning Model Report
10
A community can reduce its vulnerability to storms and the cost of gray infrastructure by maintaining the natural flood absorption capacity of coastal or riparian wetlands and floodplain areas.
Tree plantings, green and "blue" roofs, permeable pavement, rain gardens, and other techniques that absorb rainfall on-site can reduce the impacts of urban runoff during storms (e.g., overburdened storm sewers, street flooding, and combined sanitary / storm sewer overflows into rivers and streams). '
Green infrastructure can increase community resiliency over short and long timeframes (e.g., reduced damage and faster recovery from natural disasters, increased ability to adapt to climate change).19
This PAS report also identifies several different geographic scales at which green infrastructure planning can be conducted, starting with the regional scale and carrying through to the local government scale (e.g., cities and communities), as well as the subarea scale (e.g., districts and neighborhoods) and finally the site level scale. The PAS report includes a chart (see Table 2) that illustrates how the six principles of green infrastructure planning can be viewed at these different scales for different kinds of planning documents (e.g., comprehensive plans, functional master plans, development regulations and codes, and capital improvement programs). The integrated planning framework and green infrastructure planning framework outlined in this section can be used to guide the design and use of the Community Resilience Scenario Planning Model that is discussed below. The model will not be designed for use in conducting the types of hydrology/hydraulic studies and other engineering analyses used to assess gray infrastructure capacity, watershed dynamics, and flood scenarios, but opportunities to use the outputs from these assessments (including inundation areas, water quality outcomes, or potential future scenarios) can help communities understand the planning implications of flood hazard characteristics and risks within a given study area. The principal use of the model is at the community and neighborhood scales. At this scale, importing outputs generated from flood hazard studies, assessments of storm sewer capacity, and other hydrology/hydraulic studies will allow for delineation of flood hazard areas at a level of accuracy sufficient to construct scenarios (or “sketch plans”) of various land use options for flood hazard areas. These options could range from simply leaving vacant open space to enhancing a hazard area’s ecological functions (i.e. installing constructed wetlands, restoring soil capacity and vegetative cover, or enhancing plantings and tree cover) and/or enabling recreational and agricultural uses that are suitable in flood hazard areas. Ideally, in the long run, the model would be designed to allow for calculation of land acquisition costs, construction costs, and long-term management costs of these different approaches, with costs adjusted to reflect the periodic need to deal with flood-related damage in flood hazard areas. Such a
19 Rouse, D and Bunster-Ossa, I, p. 20.

Innovations in Planning & Public Engagement for Community Resilience Task 3 – Scenario Planning Model Report
11

Innovations in Planning & Public Engagement for Community Resilience Task 3 – Scenario Planning Model Report
12
planning analysis also would support the development of a functional master plan for a community or neighborhood, such as a “linear park” or “greenway” master plan, or a multi-functional drainage master plan. In addition, the model should also be designed to provide the capability to look beyond the flood hazard areas within a community or neighborhood, and consider the relationship of flood hazard area uses with other urban land uses in a given geographic area. For example, it may be useful to identify land whose property use would be restricted, or whose homes would be bought out, as a result of flood hazard designation. Enabling communities to engage in this challenging conversation before a flood hits, and providing a structure for the discussion, would represent a very useful advance and output from the model. In addition to calculating the costs of direct compensation (through purchase of the land outright or through a conservation easement), there could also be consideration of development rights transfer to other developable properties within the same planning area. If these types of options are considered, it may also be important to think strategically about where density transfers should be accommodated before setting up and using the hazard-related information and functions in the model. For example, if a neighborhood planning area includes an existing or planned public transit station, it may be important to consider a scenario that transfers development rights to locations within close proximity to that station, in order to promote greater transit use within that neighborhood. In such a case, a comprehensive planning process may be the best way to consider these types of trade-offs. The model can then use those planning process decisions as parameters for assessing other important economic, environmental and social outcomes.

Innovations in Planning & Public Engagement for Community Resilience Task 3 – Scenario Planning Model Report
13
To summarize, the model should be designed to allow for small-area (community scale or neighborhood scale) evaluation and comparison of a range of different approaches to mitigating flood hazard risks, through either a functional master planning process or a comprehensive planning process.
B. Design of a Scenario Planning Model The tool to be developed—called the Community Resilience Scenario Planning Model (CRSPM)—will work as part of the Integrated Planning Framework, serving as both a scaffold for technical modeling and as a bridge between ordinary planners (and their constituents) and resiliency science. Its mission is to promote informed, collaborative decision-making by offering a platform for articulating the decisions to be made and presenting relevant science in ways that are easy to understand. User Experience This section provides a high-level view of the model’s intended functionality from a user perspective. The tool opens with a map view of the community’s study area, which is expected to be on the order of a few square miles or the equivalent of a small watershed, such as the tributary to a river (e.g., Lick Run in Cincinnati or Chollas Creek in San Diego). The map contains data on existing conditions of the built environment, detailed topography, structures, surface waters, wetlands, infrastructure features, water bodies, and flood hazard areas (as currently modeled) in addition to other helpful reference information. A flood level variation tool is available for use at any time. This changes the extent of the flood hazard area according to user-specified settings.20 For example, the user may choose to increase the 100-year flood level by 2 to 5 feet as a way of approximating a potential effect of climate change.21 The model will create a new, larger flood hazard area using a simple “bathtub” model that raises the water level by 2 to 5 vertical feet and fills in the local topography accordingly (this function may require the user to have the Spatial Analyst22
20 As noted earlier, only inland flood hazards will be addressed at this time. Coastal storm and inundation
modeling could be added at a later date. 21
Consistent with Executive Order 13690 – Establishing a Federal Flood Risk Management Standard (FFRMS) and a Process for Further Soliciting and Considering Stakeholder Input. Another approach would be to use the 500-year flood level instead. See https://www.whitehouse.gov/the-press-office/2015/01/30/executive-order-establishing-federal-flood-risk-management-standard-and- 22 See http://www.esri.com/software/arcgis/extensions/spatialanalyst
An example of a flood inundation map output from XPSWMM, a model commonly used in municipal flood and infrastructure engineering (XPsolutions.com)

Innovations in Planning & Public Engagement for Community Resilience Task 3 – Scenario Planning Model Report
14
extension to ArcGIS). Alternatively, if the user has access to alternative inundation profiles for the area developed in a flooding model, such as XP SWMM, or another locally-specific study of flooding and infrastructure systems, one or more static GIS layer outputs from these types of engineering studies can be incorporated into the tool. This can give users relatively easy options for choosing those layers to specify flood level variation.
A potential enhancement, should time and resources allow, is to use a surface water flow path model for the area developed in Esri’s ArcHydro set of data models and tools23 for other parts of the Spatial Analysis and Planning Toolbox. At left are illustrations showing how the flow path model depicts the routing of surface flows towards storm drains and overland pathways in the Chollas Creek watershed in Southeast San Diego. This enhancement might allow users to identify areas where rainwater tends to collect in low points (areas of a dense group of flow paths that show up as “blobs” in the photo at lower left), and also where rainwater does not naturally flow or collect (areas without green flow paths, showing high points of sites). This provides an important ‘reality check’ for green infrastructure siting, sizing and prioritization. The surface water flow path model also provides an important tool for helping planners and the public visualize how water travels through and collects in a neighborhood, which can help build consensus around open space, green infrastructure, and mitigation planning. A tool or set of tools for assessing neighborhood risk is provided. This capability is based on the CommunityViz Suitability wizard24 and follows a pattern similar to that of the Urban Agriculture Suitability Analysis Model (UASAM) already developed as part of the Spatial Analysis and Planning Toolbox. Each neighborhood is assigned a risk score (likelihood + impact) based on a combination of factors such as inundation likelihood, demographic profile and characteristics of residents, condition of building stock, etc. The user is presented with a panel of controls that allow weighting and/or including and excluding various factors. Based on the user’s settings, risk scores are
updated in real time and displayed visually on the map, making it easy to see where risks are highest across neighborhoods.
23
See http://resources.arcgis.com/en/communities/hydro/01vn0000000s000000.htm 24
See http://placeways.com/communityviz/s360webhelp/

Innovations in Planning & Public Engagement for Community Resilience Task 3 – Scenario Planning Model Report
15
The use of demographic factors to assess risk is a particularly important feature of the model. In the practice of resilience planning, conventional census data such as language isolation, number of single householders over age 85, availability of a vehicle, and age of structure are crucial to understanding the potential social, economic and public health and safety impacts of flooding. Guidance should be provided for model users on selecting and prioritizing these types of factors, drawing on resiliency planning work25 (such as the 2015 US Department of Housing and Urban Development National Disaster Resilience Competition and Academies). Once neighborhoods in need of the most attention have been identified, the user zooms in on a particular neighborhood of interest to work at the site or small-area scale. Here, users can experiment with applying various flood mitigation measures by sketching on the map or using other input controls. Mitigation measures will include both gray infrastructure and structural flood proofing measures (e.g., levees, freeboard, sealed foundations), flood storage measures (e.g. retention/detention facilities, increased storm sewer storage), and green infrastructure (e.g., swales) strategies, building on some of the green infrastructure modeling capabilities already developed for the UCSD Water Quality Scenario Planning Model (WQSPM). As discussed in the Technical Considerations section, the flood-management benefits of these strategies will be modeled only approximately, because the model will not be capable of hydrologic modeling or simulation. Similarly, costs and other impacts will be modeling at a level suitable for planning and discussion intended to lead to further, more detailed study in areas where they seem appropriate. All the above controls will be supported by the inherent ability of CommunityViz to compare scenarios. Thus the user will be able to evaluate strategies or combinations of strategies against other alternatives by looking at maps side-by-side, viewing charts that compare results, and reviewing detailed reports.
Sources of Data and Models The CRSPM will require geospatial data layers including particular attribute information, tabular reference information for modeling parameters such as costs and rates, and scientific modeling formulas and logic for predicting the outcomes of future scenarios. Where possible, the tool will be designed to use widely available public data sources so that it is portable to any location with reduced need for additional data gathering on the part of the local community. However, it is expected that local communities will still need to provide a number of local data sets. In the pilot, we anticipate working in Southeastern San Diego and relying heavily on the regional metropolitan planning organization (SANDAG) and its cloud-based GIS data repository, SanGIS, for local data. Details will need to be worked out as the tool is developed, but likely primary sources are given below. Sources of spatial data for the pilot are likely to include:

Innovations in Planning & Public Engagement for Community Resilience Task 3 – Scenario Planning Model Report
16
US Census Blocks: demographics
FEMA FIRM: flood hazard areas
USGS or OpenTopography: topography
SANDAG SanGIS: parcels, zoning, land use, existing buildings and infrastructure, watersheds and waterbodies, single householders over age 65.
Sources of cost and benefit data and models may include:
FEMA Environmental Benefits Calculator
FEMA Hazus
FEMA Risk MAP
Other published sources of project construction cost and operations cost data, such as budgets for capital improvement projects constructed by local governments.
C. Technical Issues in Flood Hazard Forecasting and Analysis As described throughout this paper, the intent of the model is to enable comparison between and among different flood hazard scenarios. The CommunityViz model itself is not intended to replicate or mimic the “hard engineering,” but provides an important means of translating engineering outputs into the community planning framework. In doing so, planners must take care to represent correctly the functions and applications of different types of infrastructure, whether gray or green, and investments in open space or natural areas enhancements. Inundating floods of the type reflected in the FIRM maps, and to be represented in this model, can be brought on by high volumes of water falling in a short time (i.e. high-intensity rainfalls or “rain bombs”), or by a period of rainfall in which soils become saturated and/or surface water flows are sustained at high levels. In the latter case, even a small storm can be the “straw that breaks the camel’s back” and results in flooding. Flood prevention in urbanized areas thus involves providing sufficient physical storage capacity for flood waters, whether on land or within the storm sewer system, to prevent the inundation of and damage to property, infrastructure, and public safety. To understand the focus and potential benefits of the proposed CommunityViz model with respect to flooding, and particularly the role of green infrastructure in mitigation and resilience, it is important to separate out and define two different objectives of engineering and water management: stormwater management and flood mitigation. These areas are distinct from floodplain management and engineering, which deals with issues of compensatory storage for incursions into the floodplain, identification of fluvial erosion hazard areas, and establishing standards for flood storage and floodproofing. Most urbanized (and developing) municipalities, at some point, will evaluate the potential for flooding and damage, the capacity of existing and planned drainage infrastructure, and the

Innovations in Planning & Public Engagement for Community Resilience Task 3 – Scenario Planning Model Report
17
performance of drainage and flooding structures under different rainfall and climate assumptions. This is a regular area of work for civil and municipal engineers. Typically labeled “Area Drainage Plans,” “Watershed Models” or “Stormwater Master Plans,” outputs from these studies tell municipalities, regulators, and land-holding entities such as flood control districts how much physical storage capacity is needed, and where, to accomplish a certain level of flood protection. In CSO areas, these studies also spell out how much storm drainage must be removed from the combined system, and/or how much storage is needed in the combined system, to reduce or eliminate CSOs. These studies also may provide the basis for establishing stormwater detention (i.e. flood storage and release) requirements for specific areas in a community. Historically, these studies have not focused on the role of surface stormwater management treatments in managing flooding, other than from conventional detention structures (i.e. stormwater or flood control basins and ponds). As water quality (as opposed to simple flood storage or detention, which does not remove pollutants from stormwater) has become a greater area of concern and as the US EPA implements the Phase II Municipal Separate Storm Sewer System (MS4) rule throughout urbanized portions of the US, stormwater engineering has shifted from a focus on drainage and flood mitigation to a more integrated approach to water quality, watershed function, and flood management. Models such as US EPA’s System for Urban Stormwater Treatment and Analysis Integration (SUSTAIN)26, the US EPA’s Storm Water Management Model (SWMM)27, the National Stormwater Calculator (which runs on a SWMM model)28, and the Source Loading and Management Model for Windows (WinSLAMM)29 provide tools for selecting and assessing the benefits of green infrastructure, including volume reduction (i.e. how much less stormwater runoff is generated by a site that includes green infrastructure practices, both and constructed and natural). Reducing runoff volumes from individual sites or portions of a watershed has an obvious benefit to flood management, since the overall amount of water entering a drainage system will be reduced. In addition, the ability of green infrastructure practices to absorb small storms may help forestall a flood event in areas where soils have become saturated from extended periods of rain. However, the focus and scale of flood management engineering and assessment remains substantially different from water quality and green infrastructure-oriented planning, and this distinction is important to the model. The primary application of green infrastructure approaches, as described in this paper and as intended to be expressed in the model, is for localized stormwater management (i.e. water quality enhancement and watershed restoration) and not for neighborhood or community-scale flood mitigation and or control (i.e. preventing inundation and damage from large storms).
26 https://www.epa.gov/water-research/system-urban-stormwater-treatment-and-analysis-integration-sustain 27
https://www.epa.gov/water-research/storm-water-management-model-swmmus 28
https://www.epa.gov/water-research/national-stormwater-calculator 29
https://www.winslamm.com

Innovations in Planning & Public Engagement for Community Resilience Task 3 – Scenario Planning Model Report
18
At a very fine scale, some approaches could be represented to reduce localized surface flooding, such as adding permeable surfacing the parking lane of a street with a chronically flooded low point. In the context of an urban system or urbanized area, green infrastructure measures do not manage the very high volumes of water that occur in flooding situations. As infiltrative or retention-based practices, green infrastructure stormwater practices are designed specifically to hold water on a site for a longer period of time – more akin to how the natural landscape functions, by taking up initial rainfall volumes and ultimately “overflowing” in larger storms or in extended wet periods. As such these practices require more land surface area or subsurface infiltration space than do detention (i.e. capture and release) measures such as ponds or dry basins. The design result is for sites and surfaces treated with green infrastructure to absorb quickly the smaller storm events, but not to provide flood control functions. Table 3 below outlines the different objectives of these practices:

Innovations in Planning & Public Engagement for Community Resilience Task 3 – Scenario Planning Model Report
19

Innovations in Planning & Public Engagement for Community Resilience Task 3 – Scenario Planning Model Report
20
US EPA has recently published an evaluation that may be useful to this project entitled “Flood Loss Avoidance Benefits of Green Infrastructure for Stormwater Management”30. This study did evaluate the relative impact on floodplain area (defined in the report as “the horizontal extent of inundated land resulting from…flood events”) from the implementation of green infrastructure on new development and redevelopment (excluding retrofits), which would ultimately be the objective of the model developed in this project. With engineering guidance and appropriate caveats, the outcomes of this study may be used to provide some estimation in the change in horizontal floodplain extent from implementation of green infrastructure stormwater management practices. If users wish to make some assumptions along these lines, it is strongly recommended that users work with a knowledgeable local engineering staff member or firm to make explicit assumptions about where, how, or by how much adding green infrastructure features in the model’s sketch function would lead to a corresponding movement in the “bathtub” line of the flood hazard area. The technical advisory committee also should weigh in on the approach and conclusions from the EPA analysis and their applicability to this study. The introduction to this study provides important guidance on the limitations of green infrastructure for flood mitigation within existing models and data sets:
Generating an estimate of the flood loss avoidance benefit from the use of small storm retention practices is problematic because data does not exist on damages from small, frequent storm events. For example, there is limited information on damages such as stream scouring that exposes buried utilities, bridges, and other assets to flood hazards. In addition, there are no national datasets of at- risk assets, flood control works, topography, and bathymetry detailed enough to generate accurate estimates, much less projections of national losses. Nevertheless, this study uses publicly available datasets and the Federal Emergency Management Agency’s (FEMA) flood loss estimation model Hazus on a limited number of watersheds to obtain a conceptual quantification of the effect of stormwater retention on reducing potential riverine flood losses (EPA 2015: ix).
The report provides another important guidance point for this project and the model:
The flood loss avoidance benefits estimated in this study should not be contrasted directly with GI implementation cost for a benefit-cost comparison because, as noted previously, flood loss avoidance is not the only, and certainly not the primary, benefit of GI. Comparisons of benefits to costs should be made using the full suite of benefits that include
30 US Environmental Protection Agency Office of Wetlands, Oceans and Watersheds, December 2015.

Innovations in Planning & Public Engagement for Community Resilience Task 3 – Scenario Planning Model Report
21
improved water quality, reduced stream erosion and scouring, healthier aquatic and benthic ecosystems, greener and cooler cities, more stable stream baseflow during droughts, groundwater recharge, reduced potable water use, and other benefits.
It is more difficult to model and predict the flood-related outcomes of restoring natural hydrologic function through enhanced open spaces or land conservation than to model the impacts of stormwater management green infrastructure practices. Protection and restoration of natural hydrologic functions (especially tree canopy, soil infiltration capacity, and healthy vegetative cover) will reduce flood risk by reducing runoff volumes from restored sites, providing more storage capacity within soils and plants (which reduces the likelihood that a small storm in an extended wet period will lead to a flood event), and particularly by providing space for flood waters to dissipate, rather than causing damage to streams, lakeshores, infrastructure and property. However, the interaction of groundwater hydrology, stream base flows, developed infrastructure and rainfall patterns makes modeling these relationships and predicting outcomes especially tricky. It is strongly recommended that the advisory committee members with strong technical knowledge of floodplain engineering weigh in on how engineering studies and principles could be used to establish proportionality between a restoration approach and a corresponding degree of risk reduction. In some cases, engineering and scientific modeling work done around climate change, flooding and green infrastructure can provide useful outputs for this model approach. For example, in some regions of the U.S., climate models incorporating temperature, soil, precipitation, tree cover and climate change variables have been “downscaled” to project changes in flood patterns and risk for specific watersheds;31 where this type of work has been done, the static outputs in terms of GIS maps of projected flood hazard areas can be incorporated into the model, providing a much greater level of accuracy about projected risks under climate change. In metropolitan Chicago, an innovative modeling approach has begun to model the potential benefits – including cost savings from preventing structure damage, and total costs to the community - of installing widespread, small-scale green infrastructure practices as a compliment to capacity expansion capacity in the gray storm sewer system32. This approach, in particular, is an important strategy for combining community resilience, watershed health and flood damage prevention. Another approach that may be of use, where specific investments are being considered, is to evaluate the non-flood related benefits, compare these to costs, and evaluate what level of hydrologic function restoration would be required to make an investment economically feasible.
31
Vermont Agency of Natural Resources Climate Change Adaptation Framework. Vermont Agency of Natural Resources, 2013 (http://anr.vermont.gov/sites/anr/files/specialtopics/climate/documents/Adaptation/2013.0610.vtanr_.NR_CC_Adaptation_Framework_Report.pdf). 32 Wickenkamp, Jeff , “Green Infrastructure: Climate, Design and Planning Tools.” Presentation at the American
Planning Association Planners Training Service Workshop, Chicago, IL, Nov. 4, 2013.

Innovations in Planning & Public Engagement for Community Resilience Task 3 – Scenario Planning Model Report
22
In conclusion, in the guidance for this model, planners should be encouraged to look for climate, hydrologic, and watershed models that have made projections of flood-related issues, and yielded geospatial outputs that can be used in the CommunityViz model to generate future scenarios. Engineering and flood control do not incorporate the dimensions of economic and social resilience, or the testing of community planning options, that planners can offer to inform vital decisions about investments and infrastructure. Some of the information planners should seek out, and the model should enable to be incorporated, includes:
Potential applications of the principles and approach in the recent EPA work on Flood Loss Avoidance Benefits of Green Infrastructure for Stormwater Management to adjusting the horizontal extent of floodplains under different green infrastructure scenarios.
GIS or geospatial outputs and maps showing projected inundation areas from local area drainage plans, hydrology/hydraulic studies, or stormwater master plans should be incorporated into the model as baselines for different scenarios related to growth, land use change, and investments in the storm drainage system. These studies also will provide an excellent source of information on the capital and operation & maintenance cost of alternatives, which feeds into the study’s cost evaluation function.
If a floodplain study has been completed with options for flood control or storage, and maps of corresponding risk to downstream areas, this information would be especially valuable.
State offices may have mapping or areas mapped as fluvial erosion hazard (FEH) areas or as historically flood-prone, but outside the FIRM mapped areas, which can be incorporated into a local model as priority land use areas for conservation, reducing the density of development and imperviousness, or installing green infrastructure practices.
Where downscaled climate models include projected future flood scenarios under climate change, these boundaries can and should be included in the model.
D. Use of Scenario Planning Models in the Public Engagement Process
Scenario planning models have become increasingly common in public engagement processes and their benefits are widely recognized and well-studied.33 However, models can vary considerably in their goals, function, operation, level of sophistication, and many other aspects. Here we highlight particular characteristics that any scenario planning model (including CRSPM) should possess to maximize its effectiveness in public engagement.
Even before addressing the model itself, it should be emphasized that any model needs to be used as part of a thoughtfully designed and carefully executed planning and public engagement process. In a public engagement setting, the model is serving the role of a decision-support tool: its job is to help people make informed, collaborative decisions. In other settings it may
33 See, for example, Prediction: Science, Decision Making, and the Future of Nature, edited by D. Sarewitz, R.A.
Pielke, Jr., and R. Byerly, Jr. Island Press, 2000. Also see the list of publications at http://placeways.com/PDFs/articles/PublicationList_2015.pdf

Innovations in Planning & Public Engagement for Community Resilience Task 3 – Scenario Planning Model Report
23
also provide predictions, detailed modeling results, and a sophisticated technical modeling framework, but in this setting its function is to work with people. Planning is both a technical and a political activity. Ideally the modeling tool supports both of these dimensions, but in no case does it completely replace the people and processes required. In the case of CRSPM, our intent will be to test the model in the context of a formal process such as that of the National Charrette Institute (NCI).34
The National Charrette Institute has developed a charrette planning system that is fully compatible with traditional planning processes for both comprehensive plans and functional master plans at various scales (see Appendix 1). The planning process involves three phases:
1. Research, Education and Charrette Preparation; 2. The actual Charrette event; and 3. Plan implementation.
The Charrette itself is a multiple-day, collaborative design workshop, which harnesses the energies and talents of all interested parties to create and support a feasible plan that represents transformative community change. It is in this workshop setting (with several feedback cycles over a minimum five day period) that the CommunityViz scenario planning software can be used productively to build and test alternative planning scenarios and to:
Give immediate feedback to participants regarding how these scenarios perform in relation to selected environmental, economic and social factors; and
Provide graphical illustrations of how these scenarios will actually appear on the ground.
Lessons Learned from Recent Post-Disaster Recovery Planning Efforts
Incorporating authentic participation from stakeholders, residents, and property owners from within a community creates a planning effort that is more likely to be supported. Creating trust between planners and community members is often a time-consuming but worthwhile task. When residents and property owners are a part of the conversation about resiliency planning, and are asked for ideas and guidance in identifying the most vulnerable areas of a community, the outcomes are specific to and applicable within the community. Appendix 2 of this report identifies literature relevant to pre and post flood disaster mitigation planning efforts, and identifies ways for planners to involve community stakeholders in the planning discussions from disasters in locations around the United States. Pre-disaster planning allows for clear identification of responsibilities, considers financial responsibilities, and allows communities to assess preparedness levels. Specific examples of engaging the community in planning efforts surrounding flood disaster mitigation can be found in Appendix 2. One example is within Vermont’s Department of Housing and Community Development report where a series of workshops with community members and the regional
34 See http://www.charretteinstitute.org/charrette.html

Innovations in Planning & Public Engagement for Community Resilience Task 3 – Scenario Planning Model Report
24
planning commission identified and prioritized potential projects for future flood mitigation. The post-Irene Vermont workshop example uncovered three main themes for moving forward that can guide pre-planning in other communities:
- Brainstorming with community stakeholders to identify and locate ways to build to reduce impacts from future disasters.
- Community wide understanding of watershed dynamics. - Mitigation measures for buildings and infrastructure within the floodplain.
The ideas developed and incorporated into community plans are aimed to increase interest, participation, awareness and communication surrounding flood hazard mitigation. Additionally, utilizing mapping tools to show flood extents, offering workshops regarding easy ways landowners can help mitigate runoff, as well as creating warning systems via text or phone call to alert residents to clear drainage infrastructure from debris before a storm hits are all ways to reach out to communities and get stakeholders involved, and require systems set in place before a disaster to accumulate the knowledge bank necessary to follow through once disaster strikes. Model Functionality in Relation to Community Engagement Goals Regarding the model itself, the following major goals apply: 1. Interactive. It should support interactive, two-way information exchange between the
model and the audience. In other words, it should be able to both talk to and hear from the user. The “talking” is through presentation of maps, data, options, constraints, modeling results, and so on. “Hearing” means accepting user-provided inputs or queries such as what-if sketches on the map, changes to modeling assumptions, or informational notes and data. Furthermore, the time lag between model input and output (hearing and talking) needs to be short enough to maintain a continuous line of thought—usually not more than 10 or 15 seconds at a time. Research on scenario modeling regularly confirms the importance of this kind of interaction regarding the effectiveness of these tools. For CRSPM, this means that it will not be enough to simply display flood hazards on a map or even flood hazards and mitigation scenarios. It will also be necessary to provide users with tools for experimenting, testing, and exploring various options on their own.
2. Accessible. It should be accessible to broad audiences with diverse expertise, backgrounds,
and perspectives. Overall this implies obvious accommodations such as plain English terminology, readily available explanations for technical terms or concepts, and an appropriate, not-too-deep level of detail. For most audiences, visual means of conveying information are best, implying the need for maps, charts, and diagrams. Similarly, public audiences tend to do better with summarized and simplified results. A segment of the audience, however, will likely prefer textual and tabular reports to visuals, and some individuals may seek out details regarding modeling techniques and disaggregated results. CRSPM therefore will need to offer several alternative or layered presentation modes that

Innovations in Planning & Public Engagement for Community Resilience Task 3 – Scenario Planning Model Report
25
provide both visual, high-level information and the ability to drill in more deeply and provide complete transparency regarding the logic, data, and assumptions used.
3. Accurate and Sufficiently Precise. Modeling results need to be accurate in the sense that
they reliably inform the decisions being made. For example, if there is a choice between A and B and the model says A performs better in some dimension than B does, that assertion by the model must be correct. However, no model is perfect and the level of precision required in a public engagement setting is often lower than that required in more technical or implementation-oriented contexts. In fact, to aid in understanding it is sometimes preferable to use purposely round figures and aggregated results when presenting modeling results, so long as those approximations do not compromise accuracy. For CRSPM, this means that simplified hazard models (such as the “bathtub” flood elevation technique mentioned above) are sufficient, particularly if they run faster on a computer and therefore support better real-time interaction.
4. Portable and Localizable. “All planning is local,” as the saying goes, and so must be the
model. It must be capable of specifically addressing local conditions wherever it is used. At the same time, the goal is to create a single tool that can be used anywhere in the U.S. Scenario planning practice regularly demonstrates that generic examples are not nearly as compelling or useful as modeling tailored to the actual location where plans are being made. From the perspective of software design this requirement is somewhat onerous because it means building in the ability to work with non-uniform data, making parameters variable, and adding additional options and flexibility to accommodate variations from place to place. Fortunately, the CommunityViz platform provides strong capabilities in this regard, so CRSPM will only need to be sure to take advantage of the features available.
E. Conclusions and Recommendations Today’s planners find themselves at a confluence of three major trends: growing urgency for improving community resilience in the face of an increasingly hazardous climate; increasing recognition of the importance and potential of meaningful public participation in resiliency planning; and the steadily improving utility of planning and visualization technology that can connect community members with relevant science and information. We are approaching a point in history when resiliency planning can and should be rising in the consciousness of communities, and when improved tools and processes for public participation can make that planning better informed, more collaborative, and more effective. In this paper we have suggested an integrated planning framework that can move the practice forward. It includes an interactive and visual planning model, an informed awareness of technical issues, and strong integration with an effective public engagement process. By building and field-testing this framework, we will discover more about what new innovations are possible, feasible, and effective in helping planners and communities find success in the increasingly important work of creating resilient communities for the hazards of the future.

Innovations in Planning & Public Engagement for Community Resilience Task 3 – Scenario Planning Model Report
26
In going forward, it will be important to give further attention to how the use of scenario planning tools can respond to community engagement goals and needs. For example, if attracting a broad and diverse audience is one of the goals of community engagement for a particular planning process, it will be important to identify at an early stage the technical capacities of scenario planning tools that will be used to respond to this goal. This evaluation can be best accomplished once the specific parameters of a particular planning process, such as scale and topical scope, have been determined.

Innovations in Planning & Public Engagement for Community Resilience Task 3 – Scenario Planning Model Report
27

Innovations in Planning & Public Engagement for Community Resilience Task 3 – Scenario Planning Model Report
28

Innovations in Planning & Public Engagement for Community Resilience Task 3 – Scenario Planning Model Report
29

Innovations in Planning & Public Engagement for Community Resilience Task 3 – Scenario Planning Model Report
30

Innovations in Planning & Public Engagement for Community Resilience Task 3 – Scenario Planning Model Report
31