SCENARIO-BASED TRANSPORTATION PLANNING WITH INVOLVEMENT … · FINAL CONTRACT REPORT SCENARIO-BASED...
66
SCENARIO-BASED TRANSPORTATION PLANNING WITH INVOLVEMENT OF METROPOLITAN PLANNING ORGANIZATIONS FINAL CONTRACT REPORT VTRC 09-CR5 http://www.virginiadot.org/vtrc/main/online_reports/pdf/09-cr5.pdf JAMES H. LAMBERT Center Associate Director Research Associate Professor of Systems and Information Engineering Center for Risk Management of Engineering Systems University of Virginia MATHEW J. SCHROEDER Graduate Research Assistant
Transcript of SCENARIO-BASED TRANSPORTATION PLANNING WITH INVOLVEMENT … · FINAL CONTRACT REPORT SCENARIO-BASED...

SCENARIO-BASED
TRANSPORTATION PLANNING
WITH INVOLVEMENT OF METROPOLITAN
PLANNING ORGANIZATIONS
FINALCONTRACT REPORT
VTRC 09-CR5
http://www.virginiadot.org/vtrc/main/online_reports/pdf/09-cr5.pdf
JAMES H. LAMBERTCenter Associate Director
Research Associate Professorof Systems and Information Engineering
Center for Risk Management of Engineering SystemsUniversity of Virginia
MATHEW J. SCHROEDERGraduate Research Assistant

Standard Title Page—Report on Federally Funded Project 1. Report No.: 2. Government Accession No.: 3. Recipient’s Catalog No.: FHWA/VTRC 09-CR5
4. Title and Subtitle: 5. Report Date: January 2009 6. Performing Organization Code:
Scenario-Based Transportation Planning with Involvement of Metropolitan Planning Organizations
7. Author(s): James H. Lambert and Matthew J. Schroeder
8. Performing Organization Report No.: VTRC 09-CR5 10. Work Unit No. (TRAIS): 11. Contract or Grant No.:
9. Performing Organization and Address: Virginia Transportation Research Council 530 Edgemont Road Charlottesville, VA 22903 87090 12. Sponsoring Agencies’ Name and Address: 13. Type of Report and Period Covered:
Final Contract 14. Sponsoring Agency Code:
Virginia Department of Transportation 1401 E. Broad Street Richmond, VA 23219
Federal Highway Administration 400 North 8th Street, Room 750 Richmond, VA 23219-4825
15. Supplementary Notes: 16. Abstract:
The Office of Virginia’s Secretary of Transportation identified 21 transportation policies and 42 performance criteria in Virginia’s long-range multimodal transportation plan, VTrans2025. A subsequent planning effort, VTrans2035, provided direction for the effort described in this report. Although there has been considerable discussion of the potential impact of the VTrans policies on the Commonwealth as a whole, there has been little effort to characterize the regional and local impact of the policies. Further, the sensitivity of the policies to a variety of assumptions about the future needs to be better understood at statewide, regional, and local levels. This research effort developed and tested a methodology for scenario-based assessments of the impacts of the VTrans polices for several regions of the Commonwealth of Virginia. The methodology is implemented in an MS Excel workbook that is available for download at www.virginia.edu/crmes/multimodal2. This report describes a typical application of the methodology for a locality or regional planning organization, e.g., a Metropolitan Planning Organization (MPO) or Planning District Commission (PDC), to assess the impact of statewide multimodal policies across several of its long-range planning scenarios. The report includes a review of scenario-based planning, documentation of future scenarios, preliminary results of a survey of MPOs in Virginia for their best practices in scenario-based planning, an application of the methodology to the Roanoke region of Virginia, and recommendations. A major recommendation is that the methodology be used in VTrans2035 to catalyze and benchmark Virginia MPOs and localities in their respective efforts involving scenario-based transportation planning. The effort provides a cost-effective analysis tool that enables VTrans and MPOs and PDCs to identify and collaborate on the regional impacts of statewide transportation planning. The tool can further be cost-effective for individual MPOs and localities to engage in scenario-based long-range planning as encouraged by the Federal Highway Administration, particularly to guide the assumptions that are input to regional travel demand models. Appendix A provides the survey and study of scenario-based planning best practices. Appendix B documents the design of the Microsoft Excel workbook developed in this effort. Appendix C provides the lists of statewide policies, scenarios, and performance criteria used in the deployment of the workbook. Appendix D describes a related input/output analysis of economic growth based on transportation investments that was requested by the Office of Intermodal Planning and Investment. The developed methodology is being adapted for long-range scenario-based analysis of the Afghanistan Sustainable Infrastructure Plan, with research support from the U.S. Army Corps of Engineers. 17 Key Words: 18. Distribution Statement: Long-range, multimodal, scenario-based transportation, involvement, MPO’s planning
No restrictions. This document is available to the public through NTIS, Springfield, VA 22161.
19. Security Classif. (of this report): 20. Security Classif. (of this page): 21. No. of Pages: 22. Price: Unclassified Unclassified 64
Form DOT F 1700.7 (8-72) Reproduction of completed page authorized
FINAL CONTRACT REPORT
SCENARIO-BASED TRANSPORTATION PLANNING WITH INVOLVEMENT OF METROPOLITAN PLANNING ORGANIZATIONS
James H. Lambert Center Associate Director
Research Associate Professor of Systems and Information Engineering
Matthew J. Schroeder Graduate Research Assistant
Center for Risk Management of Engineering Systems University of Virginia
Project Manager Wayne S. Ferguson, Virginia Transportation Research Council
Contract Research Sponsored by the Virginia Transportation Research Council
(A partnership of the Virginia Department of Transportation and the University of Virginia since 1948)
In Cooperation with the U.S. Department of Transportation
Federal Highway Administration
Charlottesville, Virginia
January 2009 VTRC 09-CR5
ii
DISCLAIMER
The project that is the subject of this report was done under contract for the Virginia Department of Transportation, Virginia Transportation Research Council. The contents of this report reflect the views of the authors, who are responsible for the facts and the accuracy of the data presented herein. The contents do not necessarily reflect the official views or policies of the Virginia Department of Transportation, the Commonwealth Transportation Board, or the Federal Highway Administration. This report does not constitute a standard, specification, or regulation. Any inclusion of manufacturer names, trade names, or trademarks is for identification purposes only and is not to be considered an endorsement.
Each contract report is peer reviewed and accepted for publication by Research Council staff with expertise in related technical areas. Final editing and proofreading of the report are performed by the contractor.
Copyright 2009 by the Commonwealth of Virginia. All rights reserved.

iii
PROJECT TEAM University of Virginia James Lambert Matthew Schroeder Megan Kersh Asad Saqib Ward Williams Steering Committee Mary Lynn Tischer, Director, Commonwealth of Virginia Multimodal Office Wayne Ferguson, Virginia Transportation Research Council Katherine Graham, Commonwealth of Virginia Multimodal Office Mark McCaskill, Roanoke Valley Area Metropolitan Planning Organization John Miller, Virginia Transportation Research Council Kimberly Pryor Spence, Virginia Department of Transportation Acknowledgments Ralph Davis, Virginia Deputy Secretary of Transportation Michael Garrett, Virginia Department of Transportation Matthew Grimes, Virginia Transportation Research Council Roger Howe, Virginia Transportation Research Council Ben Mannell, Virginia Department of Transportation Joost Santos, University of Virginia Chad Tucker, Virginia Department of Transportation Committee on VTrans2035, the Virginia Statewide Long-Range Multimodal Transportation Plan Virginia Department of Aviation Virginia Department of Rail and Public Transportation Virginia Port Authority Virginia Department of Motor Vehicles Virginia Department of Transportation

iv

v
ABSTRACT
The Office of Virginia’s Secretary of Transportation identified 21 transportation policies and 42 performance criteria in Virginia’s long-range multimodal transportation plan, VTrans2025. A subsequent planning effort, VTrans2035, provided direction for the effort described in this report. Although there has been considerable discussion of the potential impact of the VTrans policies on the Commonwealth as a whole, there has been little effort to characterize the regional and local impact of the policies. Further, the sensitivity of the policies to a variety of assumptions about the future needs to be better understood at statewide, regional, and local levels. This research effort developed and tested a methodology for scenario-based assessments of the impacts of the VTrans polices for several regions of the Commonwealth of Virginia. The methodology is implemented in an MS Excel workbook that is available for download at www.virginia.edu/crmes/multimodal2. This report describes a typical application of the methodology for a locality or regional planning organization, e.g., a Metropolitan Planning Organization (MPO) or Planning District Commission (PDC), to assess the impact of statewide multimodal policies across several of its long-range planning scenarios. The report includes a review of scenario-based planning, documentation of future scenarios, preliminary results of a survey of MPOs in Virginia for their best practices in scenario-based planning, an application of the methodology to the Roanoke region of Virginia, and recommendations. A major recommendation is that the methodology be used in VTrans2035 to catalyze and benchmark Virginia MPOs and localities in their respective efforts involving scenario-based transportation planning. The effort provides a cost-effective analysis tool that enables VTrans and MPOs and PDCs to identify and collaborate on the regional impacts of statewide transportation planning. The tool can further be cost-effective for individual MPOs and localities to engage in scenario-based long-range planning as encouraged by the Federal Highway Administration, particularly to guide the assumptions that are input to regional travel demand models. Appendix A provides the survey and study of scenario-based planning best practices. Appendix B documents the design of the Microsoft Excel workbook developed in this effort. Appendix C provides the lists of statewide policies, scenarios, and performance criteria used in the deployment of the workbook. Appendix D describes a related input/output analysis of economic growth based on transportation investments that was requested by the Office of Intermodal Planning and Investment. The developed methodology is being adapted for long-range scenario-based analysis of the Afghanistan Sustainable Infrastructure Plan, with research support from the U.S. Army Corps of Engineers.
FINAL CONTRACT REPORT
SCENARIO-BASED TRANSPORTATION PLANNING WITH INVOLVEMENT OF METROPOLITAN PLANNING ORGANIZATIONS
James H. Lambert
Center Associate Director Research Associate Professor of Systems and Information Engineering
Matthew J. Schroeder
Graduate Research Assistant
Center for Risk Management of Engineering Systems University of Virginia
INTRODUCTION Federal agencies are increasingly emphasizing that long-range transportation plans reflect appropriate consideration of future economic, social, demographic, environmental, and other conditions. The FHWA believes scenario-based planning could be useful for this purpose (e.g., FHWA 2007). However, cost-effective methodologies and tools to achieve the aims of scenario-based planning have yet to be developed.
Several issues motivated this research project:
• How can transportation planners consider the widest array of future events in modeling and forecasting?
• How can scenario-based methodologies and tools guide transportation planners in their modeling and forecasts?
• Can scenario-based planning help regions better coordinate transportation and land-use on statewide, regional, and local levels?
• How should regional differences in scenarios such as geography, demographics, and economy affect multimodal transportation planning?
• How can scenario-based planning help federal and state policy makers to address the varying needs of metropolitan planning organizations?
In Virginia VTrans2035 and the Office of Intermodal Planning and Investment are
employing twenty-one statewide policies and forty-two performance criteria in an evolving statewide long-range transportation plan. Examples of these policies include investing in public transit, planning multimodally, and improving travel mode connections. The criteria span the topics safety and security, preservation and management, efficient movement of people and goods, economic vitality, quality of life, and program delivery. We recognize an opportunity to integrate into methodology and tools: (a) statewide transportation policies, (b) performance criteria, and (c) relevant future scenarios. Such integration may meet a need to improve

2
investment planning and coordination among Virginia’s government and non-government transportation agencies and officials.
PURPOSE AND SCOPE
The purpose of this study was to develop a methodology using the guidelines of the Federal Highway Administration (2007) to study the impacts of statewide multimodal transportation policies on regions and localities under various future scenarios. A Microsoft Excel (MS Excel) workbook was developed to process the inputs from various regions and generate an assessment of the impacts of the policies. The research effort addresses some of the immediate needs of the Multimodal Office of the Commonwealth of Virginia and the Metropolitan Planning Organizations (MPOs) and Planning District Commissions (PDCs) of the Commonwealth, which are depicted in Figure 1.
Figure 1. PDCs and MPOs in the Commonwealth of Virginia [Rappahannock Rapidan Regional Commission, 2008]
METHODS The effort undertakes several tasks to study the efficacy of scenario-based planning in the region-based evaluation of statewide multimodal transportation policies.
1. Review relevant literature concerning scenario-based planning and its applications to transportation planning.
2. Develop a scenario-based planning approach, which is guided by other approaches
found in literature, for evaluating transportation policies.
3. Apply the scenario-based planning approach in the form of a workbook using Microsoft Excel.

3
4. Demonstrate the use of the workbook for the Roanoke, Virginia, region.
5. Survey the Metropolitan Planning Organizations of Virginia for inputs to be used in the model, and determine their relevant initial perspectives on statewide policies, future scenarios, and criteria weighting. (Appendix A provides the description of the survey effort.)
RESULTS
Review of Literature Relevant to Scenario-Based Planning
This section provides a review of selected literature relevant to scenario-based planning. The first subsection provides some background on scenario-based planning. The second subsection describes several applications of scenario-based planning in transportation. Overview of Scenario-Based Planning
Cole (2001) describes three major activities of planning: forecasting, envisioning, and polling. Scenario-based planning is a sub-category of envisioning. Transportation planners often use polling, especially for experts in the Trend-Delphi method (Zergas et al., 2004). Myers and Kituse (as cited in Zergas et al., 2004) define forecasts as an attempt to provide the most probable future given underlying assumptions (Zergas et al., 2004, p. 4). States often use economic impact forecasting tools including IMPLAN and Regional Economic Models Incorporated (REMI). Scenarios are stories about future conditions that contain a range of possible futures (Watts 2008). The terms scenario-based planning and scenario planning are often used interchangeably in the literature.
Cole (2001) attributes a slow acceptance of scenario-based transportation planning to policy makers preferring specific answers, as opposed to several different possibilities. Zergas et al. (2004) address criticisms of scenario planning and clears up misconceptions of its use and results. Zergas et al. state that, “Scenario planning is not a replacement for traditional planning techniques such as forecasting; instead it aims to help organizations better prepare for the unexpected. In short, scenario planning helps to make robust strategic choices” (2004, p. 8).
Jarke et al. (1998) describes concerns whether scenario-based planning can deal pragmatically with a changeable future and long time horizons. While conceding that the view has “some validity since the environment is constantly changing, and the technology base is always in flux,” Jarke et al. (1998) recommend continuous review and corrections in a scenario-based planning process. The act of analysis, revision, and modification allows for scenario-based planning to be conducted in an “efficient and responsive matter” (Jarke et al., 1998).
4
Applications of Scenario-Based Planning Overview
Zergas et al. (2004) apply scenario planning to transportation systems in the Houston metro area. Their study examines key issues for the area, defines the scope of the problem, and generates relevant scenarios. The scenarios generated are subsequently used to aid evaluation of transportation policies in the area. The results suggest that scenario planning provides key insights into transportation futures for planners. The Federal Highway Administration (2007) is suggesting scenario-based planning for issues associated with transportation and land use. Bartholomew (2005) describes an application of scenarios in planning for land-use issues in transportation. Bartholomew (2005) finds in a 2003-2004 survey of MPOs that of 152 recipients of the survey, 45% indicated that they had at least some activity involving a form of scenario planning. Scenario-based planning allows for increased community involvement in planning (FHWA, 2007; Bartholomew, 2005; Zergas, 2004). FHWA Methodology for Scenario-Based Planning
An archetypal FHWA scenario-based planning approach resembles the methodology presented by Zergas et al. (2004) in that it emphasizes “scenario planning as an enhancement of, not a replacement for, the traditional transportation planning process” (Zergas et al., 2004, p. 8). The FHWA regards the purpose of scenario planning as aiding in preparation for potential transportation issues instead of predicting the future. The FHWA approach involves six general steps. The first step is to identify driving forces. Driving forces are “the major sources of change that impact the future” (FHWA 2007, para. 12). Trends in local land use, levels of congestion, and local demographics are commonly used driving forces. The second step is to determine patterns of interactions. Determining patterns of interactions between driving sources can be done in a variety of ways. The FHWA recommends that transportation planners use a matrix and develop a metric related to positive or negative outcome. The third step involves creating scenarios from planners by fitting realistic situations to patterns between the driving forces. An example of a scenario is that jobs and urban population increase. The FHWA describes the goal of creating scenarios as bringing life to the scenarios in a way that community stakeholders can easily recognize and connect the various components (FHWA 2007, para. 16). The fourth step is to analyze the implications of the scenario. In this step, transportation planners and stakeholders develop potential transportation policies that mesh with the scenarios. Evaluating scenarios is the fifth step in the FHWA’s methodology. FHWA describes a variety of methods such as using various criteria and presenting the scenarios to the community stakeholders. The sixth and last step is monitoring relevant indicators of the scenario. According to the FHWA, scenario planning is a dynamic methodology, and transportation planners can generate new scenarios as events occur (FHWA 2007).

5
Metropolitan Washington Council of Governments Methodology for Scenario-Based Planning Scenario planning was recently used to predict relevant transportation futures in Northern Virginia. “What if…The Washington Region Grew Differently?” (MWCOG, 2006) is a regional mobility and accessibility scenario study by the Metropolitan Washington Council of Governments (MWCOG). The study identifies four key issues facing the Washington D.C. area, and matches scenarios to each issue. The issues are associated with the topics of population growth, economics, and demographics. MWCOG chooses job growth outpacing household growth as the first key issue. The second key issue is workers living farther away from their jobs. The third issue is the divide between the eastern and western part of the region in terms of demographics and economics. The fourth issue is that most growth areas are located outside the vicinities of transit stations. MWCOG’s (2006) uses a combination of the methods similar to that recommended by the Federal Highway Administration (FHWA, 2007, and Zergas et al., 2004). However, instead of using objectives and policies, MWCOG treats scenarios as potential policies that transportation planners can evaluate. MWCOG also develops each key issue on a large enough scale to match a scenario, whereas FHWA (2007) and Zergas et al. (2004) both consider key issue interactions to generate scenarios. The MWCOG approach yields more direct scenarios addressing the key issues; however, the approach may miss important scenarios that planners could discover by looking at the interactions between key issues. Scenario-Based Planning Multimodal Planning of Other States
The state of Vermont focuses on citizen involvement in scenario-based planning (Watts, 2008). Vermont relies on extensive citizen interviews and analytical methods to uniquely create future transportation scenarios. The purpose of scenario-based planning is to create scenarios in order to develop policy measures that would meet the Long Range Transportation Plan Process. The study found that there was an unexpected benefit of positive public response to the involvement of citizens in the planning process.
Envision Utah and the Sacramento Region Blueprint are two noteworthy scenario-based planning applications that the Federal Highway Administration (FHWA) features on its website. The applications focus on growth-based or environmental approaches to scenario-based planning. Both Envision Utah and the Sacramento Region Blueprint are examples of focuses on growth and land-use in scenario-based planning.
Envision Utah (http://www.envisionutah.org/process-scenario.phtml) guides the development of Utah growth patterns. The scenarios of Envision Utah include the environment, economic strength, and quality of life. Part of the process of Envision Utah is to develop scenarios that consider multiple modes of transportation. The Sacramento Region Blueprint (www.sacregionblueprint.org) is a transportation land-use study developed to aid growth in Sacramento, California. The project uses scenarios to evaluate transportation projects and land-use strategies. Although the Sacramento Region Blueprint uses scenarios as forecasting tools, which is atypical of scenario-planning approaches,

6
the project has been recognized with awards from the Environmental Protection Agency and the Federal Highway Administration.
Overview of a Methodology for Scenario-Based Planning
This section provides an overview of a methodology to study the impacts of statewide multimodal transportation policies on regions under various scenarios, as described in Figure 2. Our methodology will address the broadest spectrum of scenarios integrated to a multicriteria decision aid, and adopt as appropriate some elements of the approaches of Zergas et al. (2004), the FHWA (2007), and the MWCOG (2006).
Figure 2. Scenario-based planning methodology for evaluating regional impacts of statewide multimodal transportation policies
The first step of the methodology is to Select Regions to use scenario-based planning in assessing the impacts of statewide multimodal transportation policies. VTrans 2035 has an interest in understanding region-to-region (e.g., MPO and PDC) variation in scenarios and statewide policies.
The second step is to Select Scenarios that are relevant to the regions of interest. Selecting scenarios is performed iteratively in three steps: Identification of Key Issues that affect the region, Identification of Key Factors, and the Discussion and Combination of Issues and Key Factors. For example, two key issues for many regions in Virginia are (i) retirement and (ii) fuel prices. Two key factors that respectively drive these issues are (iii) the baby-boomer population reaching retirement age (demographics) and (iv) the economy. Thus, transportation planners and policy makers may choose to create two future scenarios based on the combination of the issues and factors: increased retirement and transit-oriented development.

7
The third step involves Scoring Transportation Policies Based on Evaluation Criteria. In the methodology, the scorings rely on whether the policy has a significant, moderate, or minimal/no impact on each of the evaluation criteria. For example, in the performance measure C.1.2.a - “How does the policy provide strategic and/or emergency transportation infrastructure/facilities/communications?” a transportation planner may score the policy P.2 – Support Transit as having a moderate impact considering that the policy will support choices among additional modes of transportation. Another example is that a transportation planner may justifiably score policy P.4 – Fund Rail as having no impact on performance measure C.1.2.b – “How does the policy provide significant improvement to the security of transportation facilities or the users of transportation services?” The policies, scenarios, and performance measures that are used in the above examples and throughout this report are selected from Appendix C.
The fourth step is to (Re) Weight the Evaluation Criteria with Scenarios. This step uses the scenarios developed in the second step and the evaluation criteria in the third step. Transportation planners and policy makers decide—given the future scenarios—whether the evaluation criteria will have anywhere from a major increase in importance to a major decrease in importance. The importance of the evaluation criteria affects the policy scoring in step three.
The fifth step is to Assess Policy Performance Sensitivity to the Region. Each future scenario generates a score for a transportation policy that was evaluated in the third step. The scenario generates the policy score by modifying the policy score for each evaluation criterion based on the importance of the criterion in the scenario as determined in step four. For example, a policy scores a ‘10’ for evaluation criterion one. Transportation planners determine that for Scenario A the evaluation criterion one will have a ‘major increase of importance’. Since the criterion is more important, it receives a weight that increases the policy score under the criterion to ‘15’. If Scenario A had evaluated the criterion as having a ‘major decrease of importance’ then the policy score from the criterion could be decreased to ‘5’.
The methodology generates scores for statewide multimodal transportation policies for each of several relevant regional future scenarios. The methodology is ultimately useful to understand what regions are concerned for what scenarios, what policies have the greatest region-by-region impacts to VTrans2025/2035 performance criteria, and what of these impacts are most sensitive to the various scenario assumptions about the economy, environment, demographics, etc.
Application of the Developed Workbook This section describes the application of a scenario-based planning methodology described in the previous section. The methodology is implemented in an MS Excel workbook and applied to the region of Roanoke, Virginia, with cooperation of the Roanoke Valley Area Metropolitan Planning Organization. This section describes the steps of implementing the methodology and displays the results generated by the workbook. The detailed design of the workbook and its individual worksheets is documented in Appendix B.

8
Step 1: Select Regions The region chosen for the case study is the Roanoke region. The region was chosen because of the MPO’s eagerness to develop its capabilities for scenario-based planning. Step 2: Select Scenarios
Working with planners of the Roanoke region, we selected five scenarios from the list of scenarios provided in Appendix C. Bartholomew (2007, p. 14) recommends choosing not too many scenarios which would confuse participants, but enough to allow for divergent thinking and coherent story telling (Godet, 2001; Ringland, 1998, 2002). First, the effort interpreted the scenario, S.2 - Urban sprawl. Urban sprawl is an issue that affects many places of growth in the region and the nation. As developers continue to plan future residential and commercial buildings around the region and as the number of sites to build in the city decreases, urban sprawl may increase.
Second, the effort analyzed the impacts of scenario, S.17 - Retirement. As the demographics of an area change, the transportation system must adapt to meet new demands. This is an important issue as the baby-boomer generation, a major cross-section of the population in the United States, is reaching the retirement age. An aging population “implies additional transit needs, changing housing needs, the need for heightened safety standards, and residents with inflexible financial situations” (Federal Highway Administration [FHWA], 2007). Businesses must change how they operate, by developing new products to target the current demographics and compensating for the expected labor shortages (MIT Center for Transportation & Logistics, 2007). The retirement scenario is particularly important for the region in the case study since the area is considered one of top places in the country to retire. In the Roanoke region, 40% of the population of the region is 45 or older (The Roanoker Magazine, 2007). People in this age group are concerned with maintaining their mobility within the limits of their physical and financial capabilities. An older population requires different forms of public transit, especially ones that link them with residential, retail, and health centers (The Roanoke Valley Area Metropolitan Planning Organization [RVAMPO], 2005).
Third, the effort studied scenario S.18 - Natural disasters relevant to the region. Areas across the country are subject to natural disasters that cost millions of dollars in damages. Through the study of past disasters and local environmental factors, the hazard analysis workgroup of the region identified flooding as one of the most likely natural disasters for the area. The streams running through the steep terrain of the region subject the area to periodic flash flooding. To highlight the importance of this scenario, flood related research and documentation from the past determined that there are an estimated 5,400 structures that could possibly be impacted by flooding in the region (RVAMPO, 2000).
Fourth, the effort considers the potential of scenario S.3 - IT amenities growing in the region. This high priority scenario is due to the large information technology and engineering base that has developed in several surrounding areas. Many companies have chosen to locate their worker facilities and headquarters throughout the surrounding areas due to a highly skilled

9
technology workforce, policies that encourage business growth, and advanced IT infrastructure (Commonwealth of Virginia, Office of the Governor, 2007).
Fifth, scenario S.19 - Decrease in air quality, is identified to be quite relevant to the region. Intermodal freight transfer facilities are needed to support a wider range of transportation solutions for public and commercial uses. Recently, ten areas that are in close proximity to the region were selected as possible locations for a new rail and truck intermodal transit station. However, there has been opposition from environmental groups to building transit stations in the region (Christopolus, 2007). Health hazards from higher levels of soot include a 30% increased risk of death for individuals with heart disease, lung disease, and diabetes. The current soot level of the region already approaches the EPA soot limit of PM 2.5 (Environmental Protection Agency, 2007). Thus, a new transit station could cause dangerous levels of soot for the local communities. Step 3: Score Policies Based on Evaluation Criteria
In preparation for the next step of the methodology, Score Policies Based on Evaluation Criteria, the effort identified multimodal transportation policies. The effort used the 21 policies established in the statewide long-range transportation plan (Secretary of Transportation 2004). The policies are in four main categories: (1) funding/ investment, (2) land use, (3) connectivity, and (4) setting priorities. Examples of the policies include improving connections between modes, considering state versus local rules, increasing rail funding, and starting a trust fund for transportation. The list of statewide policies is provided in Appendix C.
The effort identified several additional (non-statewide) policies that are special to the region. The additional policies relevant to the region include P.22 - Smart growth, P.23 - Bicycle and pedestrian facilities feeder system, P. 24 - Environmental focus, and P. 25 - Diesel and filter regulation.
Policy P.22 - Smart growth is a growth strategy that impacts multimodal transportation use. Smart growth focuses on building desirable communities for residents. In a public workshop, it was shown that the public rejected urban sprawl scenarios in favor of more “smart-growth” patterns. Smart growth patterns mainly refer to having denser town and urban centers. Proponents of smart growth claim that increasing density of population centers will decrease driving time, traffic congestion, and preserve farmland (Thomas Jefferson Planning District Commission, 2007). Implementation of smart growth would place more influence on multimodal transportation because with more dense population centers, there is potential to use different modes of transportation.
Next, the effort considers Policy P.23 - Bicycle and pedestrian facilities feeder system (RVAMPO, 2007). Effective mobility of the baby boomers can be maintained by providing better walking and biking facilities, as many areas lack safe or formal paths (RVAMPO, 2006). The implementation of 12-ft. lanes to the current infrastructure provides room for bicyclists, walkers, and users of any other personal ride-along type devices to travel. The lanes could connect shopping and residential districts, bus stops, and park and ride lots. Many bikes are publicly available and buses have been equipped with bike racks. Policy P.23 - Bicycle and

10
pedestrian facilities feeder system, will give the general and aging population more transportation options, while enabling them to maintain healthy lifestyles and to help the environment.
Policy P.24 - Environmental focus is another policy of unique interest for the Roanoke region. Some of the more recent natural disasters have been linked to global warming (Environmental Protection Agency, 2007). Scientists have suggested that the recent drought is linked to climate changes associated with global warming. The land being extremely dry increases the likelihood of wildfires. Many advocate that the region and the nation increase efforts to reduce carbon emissions (RVAMPO, 2007).
Last, the effort studied Policy P.25 - Mandate of ultra low sulfur diesel and filters for all new trucks (Christopulos, 2007). A Roanoke chapter of the Sierra Club passed a resolution stating that it would not support an intermodal freight facility in the region unless certain conditions were met. One of these conditions for allowing the intermodal truck and train transit station to be built in the region, is that all new trucks must use ultra low sulfur diesel with air filters. The filter rule would only apply to trucks of model year 2007 and beyond, and eventually to all trucks by the year 2030. The policy would reduce the sulfur emissions by 90% or more, particulate emissions up to 80%, and nitrogen oxide up to 20%. The reduction of emissions would help to maintain levels of soot under the EPA monitored levels of PM 2.5. Ultra low sulfur diesel mandates would also apply to all other diesel vehicles using the facility, such as off-road vehicles.
Next, the effort identified performance criteria from the statewide long-range transportation plan to measure the impact of individual policies and to weight different scenarios. The performance criteria consist of safety, efficiency, economic vitality, quality of life, and feasibility. Sub-criteria are used to more specifically define the different aspects of the performance criteria. For example, sub-criteria, C.1.1.a under safety asks if the policy will "improve safety for system users and operators within the system and at mode origins/destinations (e.g., improve safety at at-grade crossings, improve bicycle and pedestrian safety, correct sub-standard (safety) designs and other geometric/pathway (e.g., runway obstructions, channel depth, bridge clearance, etc. deficiencies)." The criteria and subcriteria are provided in Appendix C.
Within the sub-criteria are the performance measures. The performance measure under sub-criteria C.1.1.a is "Does the policy significantly reduce crashes and/or incidents?" There are 13 criteria and 34 sub-criteria and performance measures currently included in the tool. To determine the overall scores for policies, the effort evaluated the impact of each policy across each of the performance measures. The methodology uses a rating of 0 for a minimal or an unknown impact on the performance measure, 0.5 for a moderate impact, and 1 for a significant impact. Figure 3 shows how in step three of the methodology transportation planners score policies using high, medium and low/unsure.

11
Figure 3. Excerpt of Multimodal Transportation Policy Assessment Before Scenario Evaluation
Step 4: Weight Criteria with Scenarios
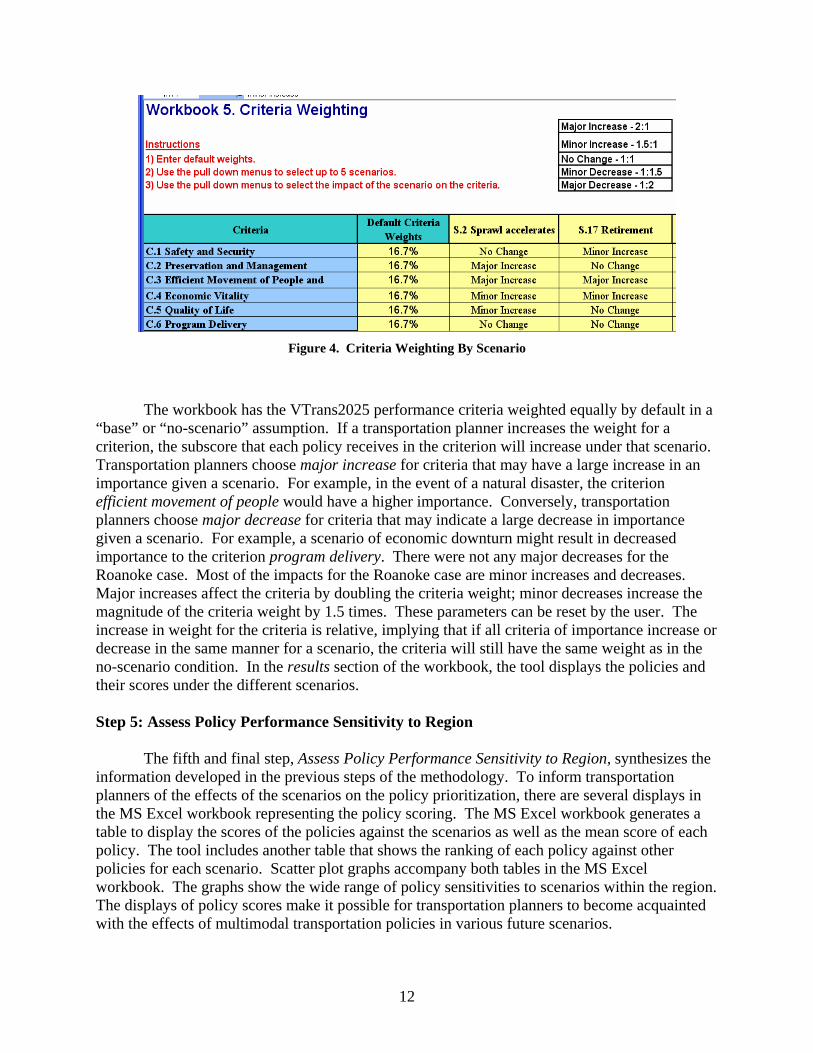
The fourth step of the applied methodology is to Weight Criteria with Scenarios. The review of scenarios by transportation planners is one of the most important steps of the methodology. VTrans provides high level criteria for regional transportation planners to evaluate against the scenarios. The criteria include safety, land preservation, efficient movement of people and goods, economic vitality, quality of life, and program delivery. For each scenario and criterion pairing, transportation planners rate the change in criterion importance from major increase to minor decrease in the case of a scenario as shown in Figure 4.
12
Figure 4. Criteria Weighting By Scenario
The workbook has the VTrans2025 performance criteria weighted equally by default in a “base” or “no-scenario” assumption. If a transportation planner increases the weight for a criterion, the subscore that each policy receives in the criterion will increase under that scenario. Transportation planners choose major increase for criteria that may have a large increase in an importance given a scenario. For example, in the event of a natural disaster, the criterion efficient movement of people would have a higher importance. Conversely, transportation planners choose major decrease for criteria that may indicate a large decrease in importance given a scenario. For example, a scenario of economic downturn might result in decreased importance to the criterion program delivery. There were not any major decreases for the Roanoke case. Most of the impacts for the Roanoke case are minor increases and decreases. Major increases affect the criteria by doubling the criteria weight; minor decreases increase the magnitude of the criteria weight by 1.5 times. These parameters can be reset by the user. The increase in weight for the criteria is relative, implying that if all criteria of importance increase or decrease in the same manner for a scenario, the criteria will still have the same weight as in the no-scenario condition. In the results section of the workbook, the tool displays the policies and their scores under the different scenarios. Step 5: Assess Policy Performance Sensitivity to Region
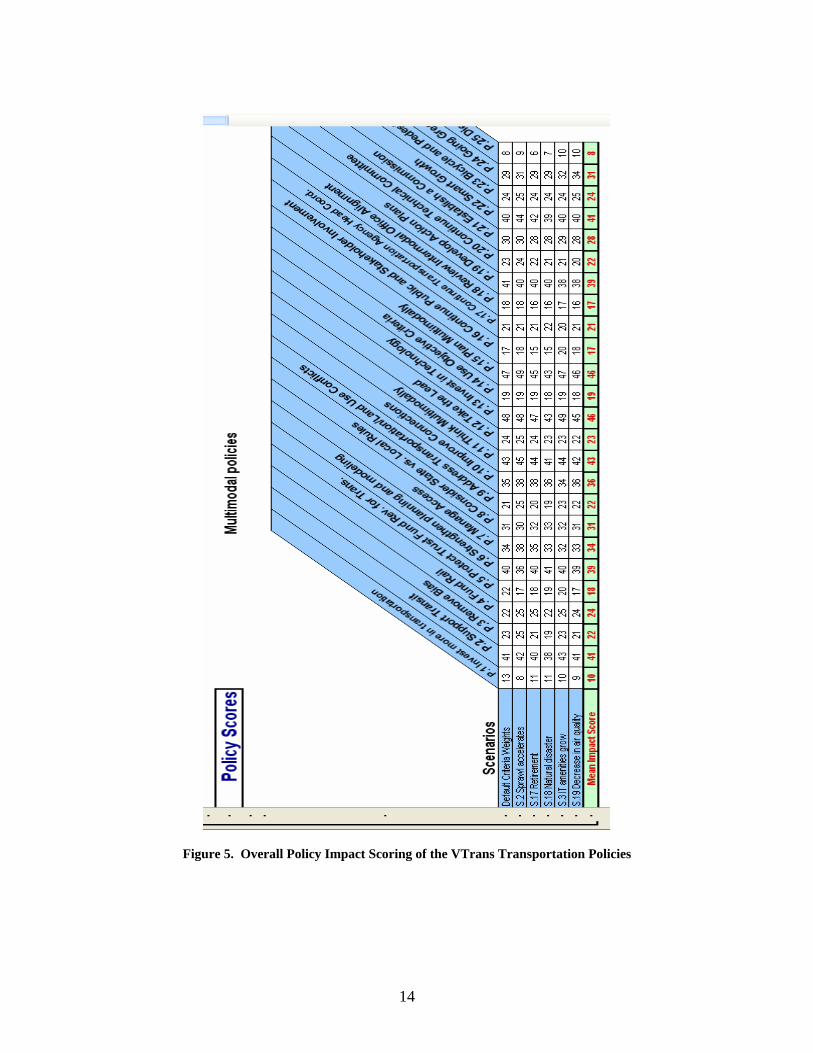
The fifth and final step, Assess Policy Performance Sensitivity to Region, synthesizes the information developed in the previous steps of the methodology. To inform transportation planners of the effects of the scenarios on the policy prioritization, there are several displays in the MS Excel workbook representing the policy scoring. The MS Excel workbook generates a table to display the scores of the policies against the scenarios as well as the mean score of each policy. The tool includes another table that shows the ranking of each policy against other policies for each scenario. Scatter plot graphs accompany both tables in the MS Excel workbook. The graphs show the wide range of policy sensitivities to scenarios within the region. The displays of policy scores make it possible for transportation planners to become acquainted with the effects of multimodal transportation policies in various future scenarios.

13
With the input of planners, the MS Excel workbook generates the scores for the policies. Transportation planners can select among different methods to compare the scores, including mean, maximum, minimum, range of scores, etc. Figure 5 shows the results of the policy scoring for the Roanoke region.
Figure 6 shows the range of scores for each policy, marking the highest score and lowest score and mean score across scenarios. The mean score is represented by the point icon and the sensitivity of the score to scenarios is represented by the lines extending right and left of the points. A wider bar suggests a relatively greater sensitivity of the policy impact to the scenarios. Many of the score ranges overlap, which indicates that transportation planners need to consider more than only the mean scores of the policies and the upside and downside potentials relative to the mean score.
Figures 7 and 8 show the relative ranking of policies based on the scores under each of the five scenarios and the no-scenario condition. The highest scoring policies are highlighted in green in Figure 8. Figure 8 shows that some scenarios have a high upside potential relative to their median ranking, while others have a high downside potential relative to their median ranking. Policies of high impact scored with considerable volatility of scores across scenarios may be of concern as sources of potential negative surprise in transportation planning. Policies with low score with high upside potential may be viewed as the dark horses or sources of potential positive surprise.
14
Figure 5. Overall Policy Impact Scoring of the VTrans Transportation Policies

15
Figure 6. Range of Policy Impact Scores with Top Scores Circled

16
Figure 7. Rankings of Policies Based on Scenario-Influenced Scores (entries in the table are the rank order of the policies 1 to 25)

17
Figure 8. Graph of Rankings of Policies with Sensitivities to Five Scenarios Represented by the Height of the
Bar

18
DISCUSSION
The exercise of the methodology introduced above can proceed iteratively in a negotiation with multiple viewpoints and stakeholders. A sample of resulting insights is provided below.
The top five policies based on the mean score are P.1 – invest in technology, P.2 - support transit, P.15 - think multimodally, P.13 - invest in technology, and P.22 - smart growth. The top rated policies, P.1 - invest in technology and P.15 - think multimodally, both have the same amount of first and second place rankings throughout the scenarios. Policies P.22 - smart growth and P - support transit also have the same score; however, they rank higher and lower in different scenarios. The workbook does not offer a dogmatic prioritization of policies; rather it calculates sensitivities across scenarios to provide insight to the viewpoints of different planners or perspectives. Planners are represented by their scenarios rather than by personality or agency, which can be an aid toward consensus.
Knowledge of what policies are highest ranked by their scores may be less important than the recognition of policies, performance criteria, and scenarios. With these foundations, regional transportation planners can use the methodology as a vehicle to coordinate with and recognize differences and similarities to other regions, and to the statewide agency VTrans2035. The workbook can be used by planners in different regions and MPOs as well as on the state level to initiate discussion in long-term multimodal transportation planning.
CONCLUSIONS • The effort has studied the uses of scenario-based planning throughout the U.S. and found that
some MPOs and states are beginning to use scenario-based planning in their long-range transportation plans.
• This effort has developed a scenario-based planning methodology and applied it to the region
of Roanoke. The scenario-based planning approach exposed transportation planners in Roanoke to a holistic approach of considering multiple futures and categories of events when evaluating long-term transportation policies on performance criteria.
• The use of existing documents and resources to inform the Roanoke effort suggested the
methodology could be cost-effective in support of scenario-based planning in other regions in Virginia and potentially in other states.
• Scenario-based planning is a relatively new technique and forecasting is used instead in
many areas of transportation planning. Our scenario-based planning methodology can be effective to narrow the scope of costly probabilistic and other forecasting processes.

19
• The Multimodal Office of Virginia has been receptive to the methodology and MSExcel tool and its potential to help understand state transportation policies and performance criteria with regions across the Commonwealth.
RECOMMENDATIONS 1. The Multimodal Office should continue to promote the use of scenario-based planning
among MPOs and PDCs in Virginia. 2. The MPOs and PDCs of Virginia should plan to use the MS Excel workbook developed in
this effort to illuminate the scenarios, criteria, and policy options most relevant to their respective regions.
3. The MPOs and PDCs of Virginia should communicate their results of testing the
methodology with the Multimodal Office. 4. The MPOs and PDCs of Virginia, in their annual meetings, should share their experiences
with this methodology with one another. 5. The methodology and tool should be focused by Virginia agencies and/or MPOs on
particular classes of scenarios such as climate change and/or economic downturn. 6. The methodology and tool should be focused on the scenario-based comparison of large
projects and/or multimodal corridors of statewide significance in order to complement the analysis of policies that was performed in the current research effort.
COSTS AND BENEFITS ASSESSMENT
This report described initial steps and associated lessons for the use of scenario-based planning in multimodal long-range transportation planning in Virginia. The potential benefits of the effort include:
• Improved coordination of regional long-term planning with other regions and Commonwealth.
• Characterization of the future scenarios that are most relevant to improved statewide, regional, and local multimodal transportation plans.
• Facilitation of resource sharing among state, regional, and local transportation planners.
• Identification of MPO and PDC regional needs for attention and involvement of the Multimodal Office.
The costs of implementing the results of the effort include:

20
• Resources needed to survey and hold workshops for regions and localities, e.g., at annual conferences of Virginia MPOs and PDCs.
• Resources to accommodate shift in planning approach. • Resources needed to coordinate scenario-based planning efforts regionally and locally
and with the Multimodal Office. • Maintaining and supporting the MS Excel workbook at a University of Virginia
website.
The methodology and tool will be cost-effective for MPOs and PDCs to realize savings in studying the broadest possible range of future scenarios with existing resources, to narrow the scope of forecasts and assumptions that are used in costly travel demand modeling, and to satisfy the increasing regulatory requirements to perform some form of scenario-based planning to secure federal funds for transportation.
REFERENCES Bartholomew, K. (2005). Integrating Land Use Issues Into Transportation Planning: Scenario
Planning. Retrieved June 3, 2008, from http://nepa.fhwa.dot.gov/. Cervero, R., & Aschauer, D. (1998). Economic impact analysis of transit investments:
Guidebook for practitioners. Retrieved October 30, 2007, from http://trb.org/news/blurb_detail.asp?id=2582
Christopulos, D. (2007). Sierra Club Opposes Intermodal Transfer Station in Roanoke Region.
Retrieved December 3, 2007, from http://virginia.sierraclub.org/roanoke/intermodal.pdf Cole, Sam (2001). Dare to Dream: Bringing Futures into Planning. Journal of the American
Planning Association, 67(4), 372 – 383. Commonwealth of Virginia, Office of the Governor. (2007). Governor Kaine Announces New
Jobs for Arlington County-GridPoint, Inc. to Invest $5 Million and Move Headquarters to Virginia. Retrieved November 24, 2007, from http://www.yesvirginia.org/About_Us/NewsArticle.aspx?newsid=900.
Delaware Valley Regional Planning Commission. (2005). Regional Analysis of What-If
Transportation Scenarios. Retrieved October 31, 2007 from http://www.dvrpc.org/LongRangePlan/2030/WhatIfFinal.pdf.
Environmental Protection Agency. (n.d.). Climate Change – Health and Environmental Issues.
Environmental Protection Agency. Retrieved December 12, 2007, from http://www.epa.gov/climatechange/effects/extreme.html

21
Federal Highway Administration. (2007). FHWA Scenario Planning Initiatives. Retrieved June 4, 2008, from http://transportation.ky.gov/planning/Scenario/1%20McCullough%20FHWA.pdf
Federal Highway Administration. (2004). Scenario Planning Peer Workshop – Binghamton,
NY. Retrieved October 18, 2007, from http://www.fhwa.dot.gov/planning/scenplan/nyscenplanrpt.htm
Federal Highway Administration. (n.d., retrieved 2007). About scenario planning. Retrieved
October 24, 2007, from http://www.fhwa.dot.gov/planning/scenplan/about.htm Flyvbjerg, B, Holm M. K., Buhl, S. (2005). How (In) accurate Are Demand Forecasts in
Public Works Projects? Journal of American Planning Association, 71(2), 131-146. Haimes, Y.Y. (2009) (in press). Risk Modeling Assessment and Management. 3rd Edition. New
York: Wiley. 900 pp. ICF International. (2007). The Potential Impacts of Global Sea Level Rise on Transportation
Infrastructure. Retrieved June 6, 2008, from http://climate.dot.gov/publications/potential_impacts_of_global_sea_level_rise
Jarke, M., Bui, X.T. and Carroll, J.M. (1998). Scenario management: an interdisciplinary
approach. Requirements Engineering Journal. v3 i3-4. 155-173. Lambert, J.H., N.N. Joshi, K.D. Peterson, and S.M. Wadie 2007. Coordination and
diversification of investments in multimodal transportation. Public Works Management and Policy. 11: 250-265.
MIT Center for Transportation & Logistics and The Zaragoza Center at the ZLC. (2006).
Proceedings of the Supply Chain 2020 Project’s European Advisory Council Spring 2006 Meeting. Retrieved October 18, 2007, from http://ctl.mit.edu/public/spring_2006_sc2020_eac.pdf
National Capital Region Transportation Planning Board. (2007). Financially Constrained Long-
Range Transportation Plan. Retrieved June 6, 2008 from http://www. Mwcog.org/clrp National Capital Region Transportation Planning Board and the Metropolitan Washington
Council of Governments. (2004). What If The Washington Region Grew Differently?: The TPB Regional Mobility and Accessibility Scenario study. Retrieved October 4, 2007, from http://www.mwcog.org/transportation/activities/regional/documents/Generic%2 0for%20Web%207-07.pdf
Richmond Area Metropolitan Planning Organization. (2007). 2031 Long-Range Transportation
Plan. Retrieved July 5, 2008, from http://www.richmondregional.org/Urban%20Transp-MPO/MPO_Div_Cats/toc.htm

22
Roanoke Valley Area Regional Commission. (2006). Pedestrian Access to Commercial Centers: Connecting residential and commercial Land uses. Retrieved December 1, 2007, from http://www.rvarc.org/work/access06final.pdf
Roanoke Valley Area Regional Commission. (2006). Roanoke Valley-Alleghany Regional
Commission Pre-Disaster Mitigation Planning. Retrieved October 17, 2007 from http://www.rvarc.org/disaster/index.htm
Roanoke Valley Area Metropolitan Planning Organization. (2005). Planning for Elderly and
Disabled Mobility. Retrieved October 18, 2007, from http://www.rvarc.org/work/mobilityfinal.pdf
Roanoke Valley Area Metropolitan Planning Organization. (n.d.). What happens when the
‘baby boom’ generation retires? Retrieved November 3, 2007, from http://www.rvarc.org/temp/retirement.pdf
The Roanoker Magazine. (2007) Where to Retire. Retrieved November 1, 2007, from
http://www.theroanoker.com/visitorguide/wheretoretire/index.cfm. Rovner, N. (2008). Governor’s Commission on Climate Change. Presentation to the Hampton
Roads Planning District Commission. Thomas Jefferson Planning District Commission. (n.d.). Jefferson Area Eastern Planning
Initiative. Retrieved December 3 2007, from http://www.tjpdc.org/community/epi.asp TransAction2030. (2006). Transaction 2030: Transportation for Today and Tomorrow.
Northern Virginia Transportation Authority. Transportation Accountability Commission. (2007). Final Report of the Transportation
Accountability Commission to the Governor and General Assembly of Virginia. Retrieved November 3, 2007, from http://www.transportation.virginia.gov/Initiatives/TransportationAccountability/Final_draft%20_%20full_report_9_5_07.pdf
Tsang, J.L., J.H. Lambert, and R.C. Patev 2002. Extreme event scenarios for planning of
infrastructure projects. Journal of Infrastructure Systems. 8(2): 42-48. Wachs, M. (2001). Forecasting versus Envisioning: A New Window on the Future. Journal
of the American Planning Association, 67(4), 367 – 372. Watts, R. A., Poitras, C., Chamberlin, R. (2008). Citizen Participation and Frame Analysis in
the Development of Scenarios for the VTrans Long Range Transportation Business Plan. Washington, DC: Transportation Research Board.
23
VTrans2025. (2004). Virginia’s Statewide Multimodal Long-Range Transportation Plan: Phase 3 and Final Report to the General Assembly. Retrieved December 3, 2007, from http://www.virginiadot.org/projects/vtrans/resources/revisedPhase3Reportforctb.pdf
Zergas, C., Sussman, J., Conklin, C. (2004). Scenario Planning for Strategic Regional
Transportation Planning. J. Urban Planning and Development, 130(1), 2-13.

24

25
APPENDIX A
SURVEY AND ANALYSIS OF SCENARIO-BASED PLANNING BEST PRACTICES The effort described in this report contributed to the following survey of Virginia MPOs, particularly in the several questions addressing current best practices in scenario-based planning. Example of Survey Sent to Metropolitan Planning Organizations
To MPO Directors: VA Code §2.2-229 and §33.1-23.03 require the Office of Intermodal Planning and Investment to work with regional transportation agencies to develop regional multimodal performance measures and prepare an annual performance report on state and regional efforts. The Multimodal Planning Office has been working with representatives from the Virginia Association of Planning District Commissions (VAPDC) and transportation agencies to determine appropriate measures for the report, which will be produced as a web-based report by December 2008. The list of measures is included. Efforts were made to identify measures that are consistent with those identified in the code and for which data are readily available in all regions. As the report is refined and expanded, other measures may be added. In 2006, the Multimodal Planning Office requested information on the goals and performance measures used in your planning process; this information was used to identify measures for the 2006 Performance Report. So that we can reflect current regional planning efforts, the Multimodal Planning Office is again requesting information on your region’s goals and performance measures. Additional information is also requested to support other efforts associated with the VTrans Update. Please complete the attached following questionnaire and e-mail your response to Katherine Graham at [email protected] or fax to 804-225-4785 by July 14th. The responses will be compiled and used to facilitate discussion led by Dr. Mary Lynn Tischer at the Transportation Committee Meeting during the VAPDC Summer Conference in July. Thank you for your participation. Deputy Secretary Ralph Davis Intermodal Office of Planning and Investment
26
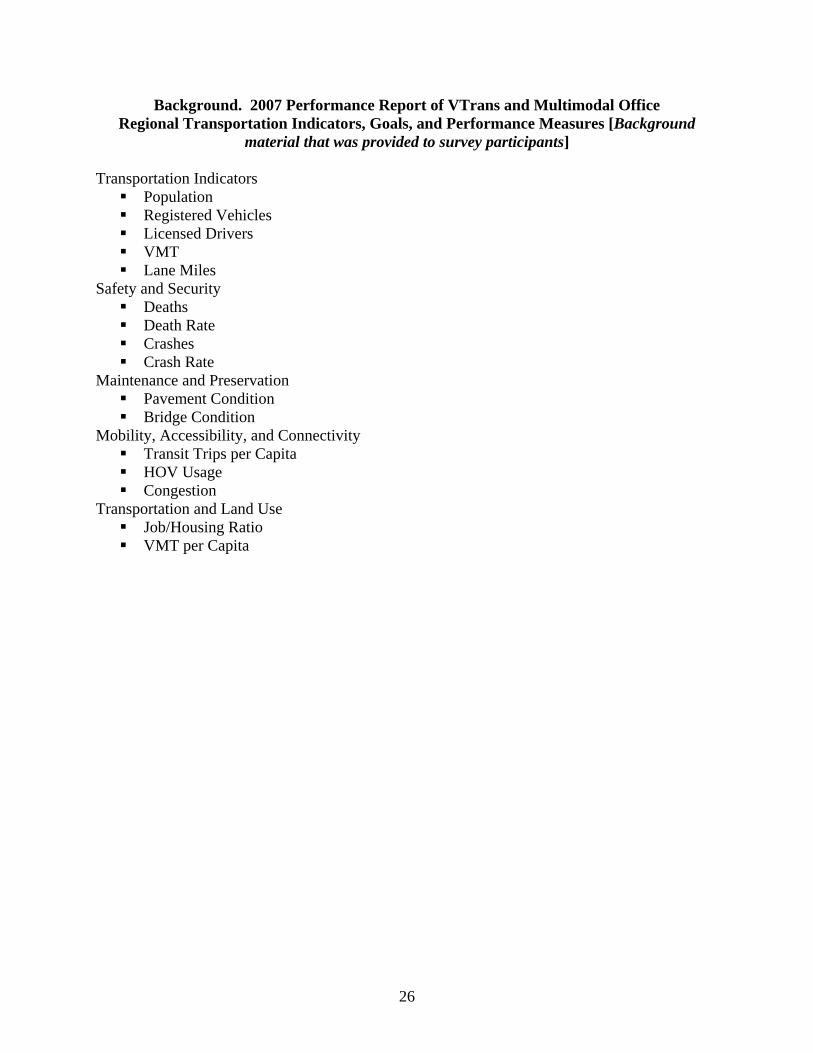
Background. 2007 Performance Report of VTrans and Multimodal Office Regional Transportation Indicators, Goals, and Performance Measures [Background
material that was provided to survey participants] Transportation Indicators
Population Registered Vehicles Licensed Drivers VMT Lane Miles
Safety and Security Deaths Death Rate Crashes Crash Rate
Maintenance and Preservation Pavement Condition Bridge Condition
Mobility, Accessibility, and Connectivity Transit Trips per Capita HOV Usage Congestion
Transportation and Land Use Job/Housing Ratio VMT per Capita
27
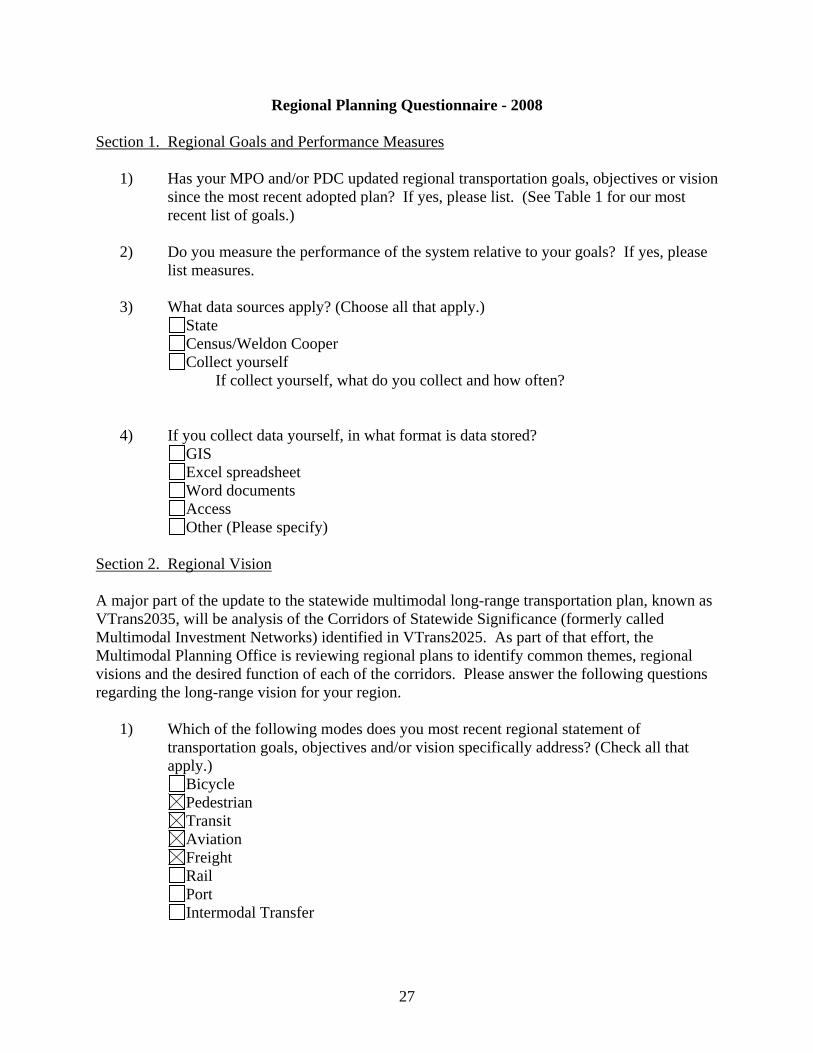
Regional Planning Questionnaire - 2008 Section 1. Regional Goals and Performance Measures
1) Has your MPO and/or PDC updated regional transportation goals, objectives or vision since the most recent adopted plan? If yes, please list. (See Table 1 for our most recent list of goals.)
2) Do you measure the performance of the system relative to your goals? If yes, please
list measures.
3) What data sources apply? (Choose all that apply.) State Census/Weldon Cooper Collect yourself
If collect yourself, what do you collect and how often?
4) If you collect data yourself, in what format is data stored?
GIS Excel spreadsheet Word documents Access Other (Please specify)
Section 2. Regional Vision A major part of the update to the statewide multimodal long-range transportation plan, known as VTrans2035, will be analysis of the Corridors of Statewide Significance (formerly called Multimodal Investment Networks) identified in VTrans2025. As part of that effort, the Multimodal Planning Office is reviewing regional plans to identify common themes, regional visions and the desired function of each of the corridors. Please answer the following questions regarding the long-range vision for your region.
1) Which of the following modes does you most recent regional statement of transportation goals, objectives and/or vision specifically address? (Check all that apply.)
Bicycle Pedestrian Transit Aviation Freight Rail Port Intermodal Transfer

28
2) In what way does your regional transportation plan address Corridors of Statewide Significance identified in VTrans2025? For more information on these corridors, look at the VTrans2025 Phase 3 Report at www.vtrans.org. (Check all that apply.)
Vision Goals Objectives Strategies Policies Performance Measures Funded Transportation Improvement Projects Non-funded Transportation Improvement Projects
3) Please provide any web links or contact information that would facilitate
documenting the above responses Section 3. Scenario Planning The University of Virginia is also assisting the Multimodal Planning Office with scenario planning related to the six long-range goals and 21 policy recommendations identified in VTrans2025. The following questions support that effort. Describe any experience with scenario-based long-range transportation planning in your region, including any coordination with local, regional, federal agencies or the private sector. [area for response of survey participant, some sample x’s entries follow to demonstrate a typical response, results are not for attribution]
1. Check up to five (5) of the following scenarios that are relevant for scenario-based long-range multimodal transportation planning for your region:
Increased urban population Sprawl acceleration IT amenities growth Jobs and households shift regionally Transit oriented development Regional economy grows Global trade grows Energy costs rise Infrastructure investment grows Increased overall population and automobile usage
Population decrease Decrease in automobile use and increase in transit use
Increase in overall public transit usage
Energy usage constraints Natural disaster Increased retirement Other (Please explain)
29
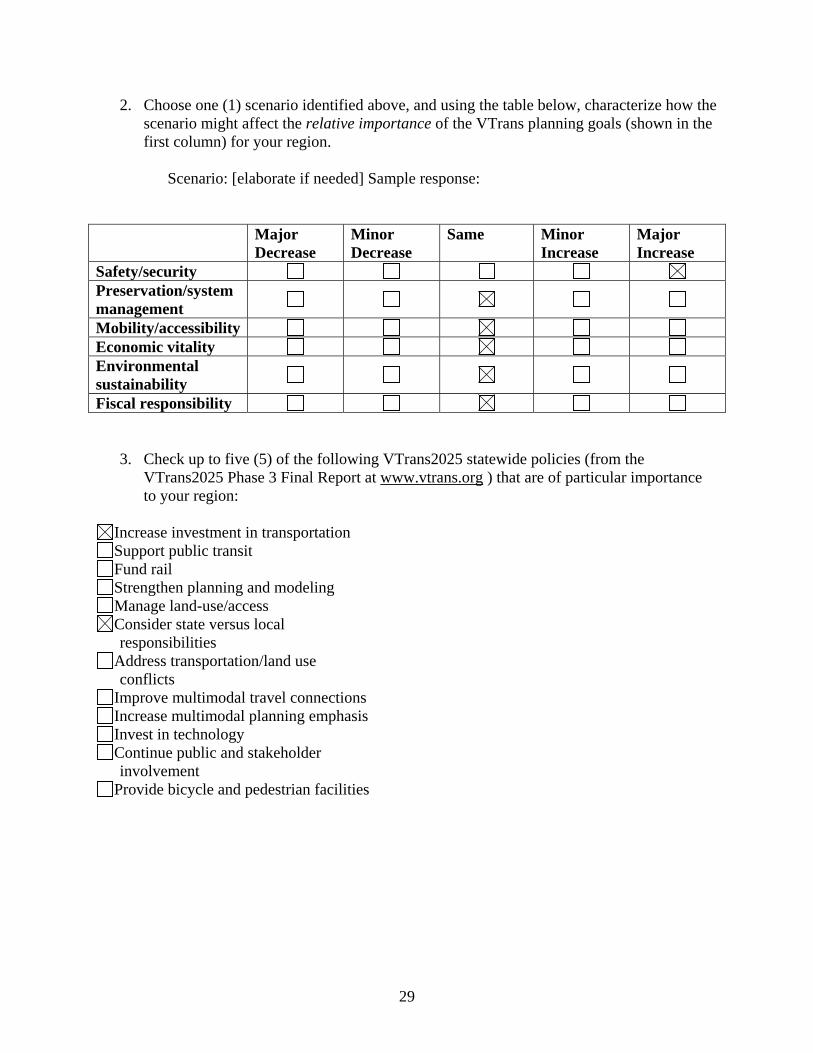
2. Choose one (1) scenario identified above, and using the table below, characterize how the scenario might affect the relative importance of the VTrans planning goals (shown in the first column) for your region.
Scenario: [elaborate if needed] Sample response:
Major
Decrease Minor Decrease
Same Minor Increase
Major Increase
Safety/security Preservation/system management
Mobility/accessibility Economic vitality Environmental sustainability
Fiscal responsibility
3. Check up to five (5) of the following VTrans2025 statewide policies (from the VTrans2025 Phase 3 Final Report at www.vtrans.org ) that are of particular importance to your region:
Increase investment in transportation Support public transit Fund rail Strengthen planning and modeling Manage land-use/access Consider state versus local responsibilities
Address transportation/land use conflicts
Improve multimodal travel connections Increase multimodal planning emphasis Invest in technology Continue public and stakeholder involvement
Provide bicycle and pedestrian facilities

30
Section 4. Contact Information Name Organization Phone E-mail
Thank you for your participation. Preliminary Analysis of the MPO Survey for the Scenario-Based Portions The following section characterizes particular features of the survey response that pertain to the effort described in this report. The following PDCs and MPOs responded: update list to include all respondents
• George Washington Regional Commission • Hampton Roads PDC • National Capital Region • Region 2000 • Blacksburg, Christiansburg, Montgomery Area MPO • Roanoke Valley-Alleghany Regional Commission • Northern Shenandoah Valley Regional Commission • Crater Planning District Commission • Lenowisco Planning District Commission • Richmond Regional Planning District Commission
Figures A.1 and A.2 show the raw results of the policy and scenario survey. The results
indicate the Virginia region is diverse and has many varying interests relative to policies and scenarios.
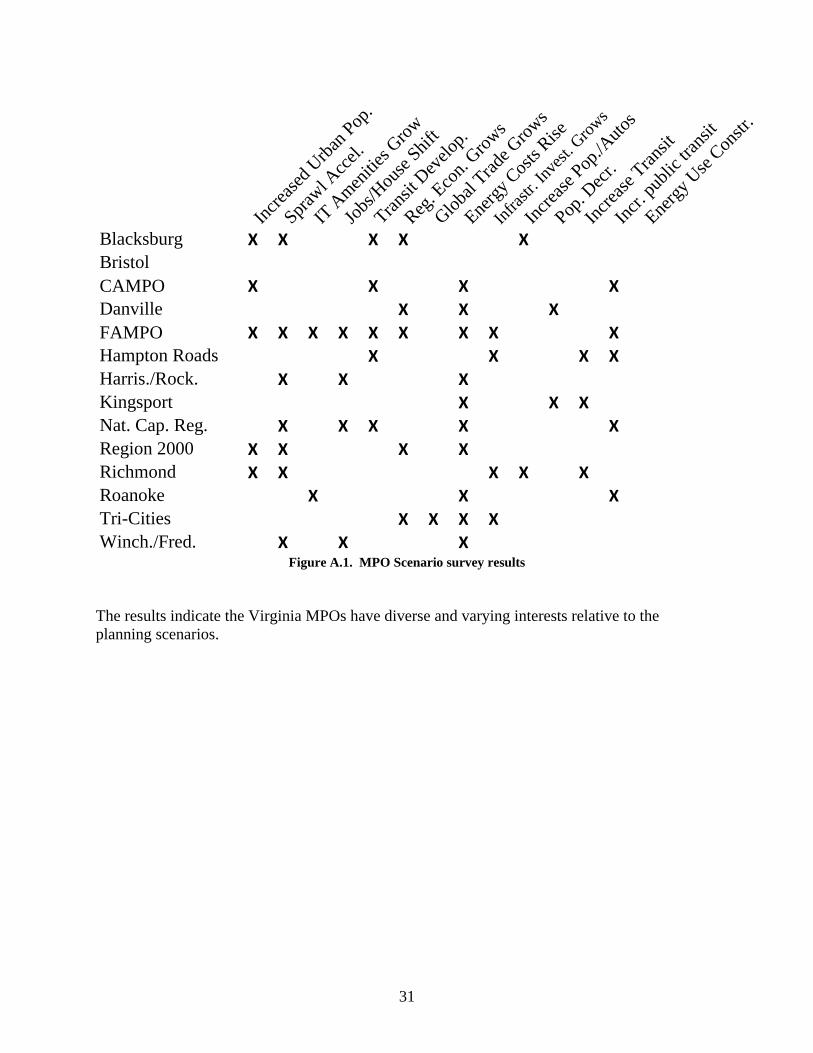
31
Figure A.1. MPO Scenario survey results The results indicate the Virginia MPOs have diverse and varying interests relative to the planning scenarios.
Increa
sed U
rban P
op.
Sprawl A
ccel.
IT A
menitie
s Grow
Jobs/H
ouse
Shift
Transit
Dev
elop.
Reg. E
con.
Grows
Global
Trade G
rows
Energy
Costs R
ise
Infras
tr. Inv
est. G
rows
Increa
se Pop
./Auto
s
Pop. D
ecr.
Increa
se Tran
sit
Incr. p
ublic
transi
t
Energy
Use
Constr
.
Blacksburg X X X X X BristolCAMPO X X X X Danville X X X FAMPO X X X X X X X X X Hampton Roads X X X X Harris./Rock. X X X Kingsport X X X Nat. Cap. Reg. X X X X X Region 2000 X X X X Richmond X X X X X Roanoke X X X Tri-Cities X X X X Winch./Fred. X X X
32
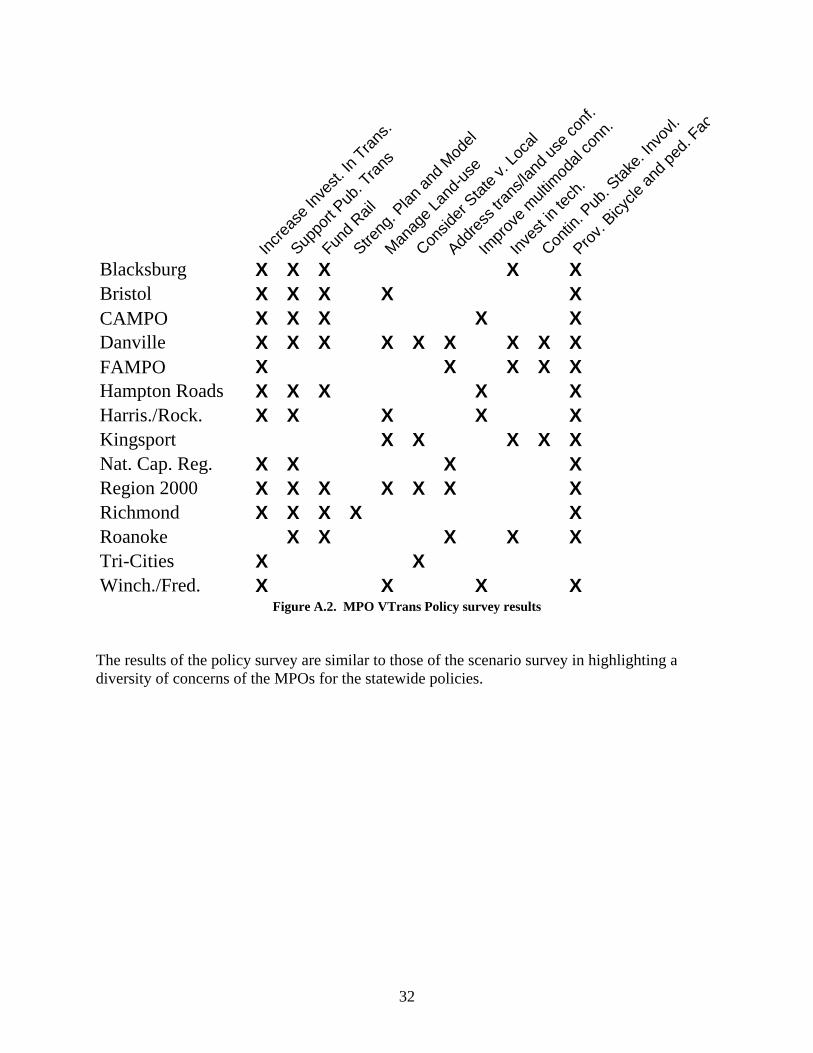
Figure A.2. MPO VTrans Policy survey results
The results of the policy survey are similar to those of the scenario survey in highlighting a diversity of concerns of the MPOs for the statewide policies.
Increa
se In
vest.
In Tran
s.
Suppo
rt Pub
. Tran
s
Fund R
ail
Streng
. Plan
and M
odel
Manag
e Lan
d-use
Consid
er Stat
e v. L
ocal
Addres
s tran
s/lan
d use
conf.
Impro
ve m
ultim
odal
conn
.
Inves
t in te
ch.
Contin
. Pub
. Stak
e. Inv
ovl.
Prov. B
icycle
and p
ed. F
ac
Blacksburg X X X X X Bristol X X X X XCAMPO X X X X X Danville X X X X X X X X X FAMPO X X X X X Hampton Roads X X X X X Harris./Rock. X X X X X Kingsport X X X X X Nat. Cap. Reg. X X X X Region 2000 X X X X X X X Richmond X X X X X Roanoke X X X X X Tri-Cities X X Winch./Fred. X X X X

33
Figures A.3 and A.4 show the overall percent relevance of scenarios and policies to the PDCs/MPOs.
0.00%
20.00%
40.00%
60.00%
80.00%
100.00%
Prov. Bicycle and ped. Fac.
Increase Invest. In Trans.
Support Pub. Trans
Fund Rail
Consider State v. Local
Address trans/land use conf.
Manage Land-use
Invest in tech.
Improve multimodal conn.
Contin. Pub. Stake. Invovl.
Streng. Plan and Model
Perc
ent U
se
Figure A.3. Overall Relevant Policy Percentage

34
0%10%20%30%40%50%60%70%80%
Energy Costs Rise
Sprawl Accel.
Increased Urban Pop.
Transit Develop.
Reg. Econ. Grows
Infrastr. Invest. Grows
Incr. overall public transit
Jobs/House Shift
Decr. Use of Autos/Increase Tra...
Natural Disaster
Increased Retirement
IT Amenities Grow
Increase Pop./Autos
Global Trade Grows
Pop. Decr.
Energy Use Constraints
Figure A.4. Overall Relevant Scenario Percentage
The policies P.23 - Bicycle and Pedestrian Facilities Feeder System, P.1 - Invest more in transportation, and P.2 - Support Transit stand out in the survey as being overall important policies in the Commonwealth of Virginia. The scenarios of S.8 - Energy cost rises and S.2 - Sprawl accelerates were found to be important in Virginia with a 70% and 60% use in the PDCs/MPOs surveyed. Figures A.5 and A.6 illustrate the importance of statewide policies for the east and the west regions. The west PDCs/MPOs include: Region 2000, Northern Shenandoah Valley Regional Commission, Blacksburg/Christiansburg/Montgomery Area MPO, Roanoke Valley-Alleghany Regional Commission, and Lenowisco Planning District Commission. The east PDCs/MPOs include: Hampton Roads PDC, National Capital Region, Crater Planning District Commission, George Washington Regional Commission, and Richmond Regional Planning District Commission.

35
0.00%
20.00%
40.00%
60.00%
80.00%
100.00%
Increase Invest. In Trans.
Prov. Bicycle and ped. Fac.
Support Pub. Trans
Fund Rail
Consider State v. Local
Address trans/land use conf.
Streng. Plan and Model
Improve multimodal conn.
Contin. Pub. Stake. Invovl.
Manage Land-use
Invest in tech.
Perc
ent U
se
Figure A.5. Eastern PDCs/MPOs Policy Importance
0.00%20.00%40.00%
60.00%80.00%
100.00%
Prov. Bicycle and ped. Fac
Support Pub. Trans
Increase Invest. In Trans
Fund Rail
Manage Land-use
Invest in tech.
Consider S tate v. Local
Address trans/land use c...
Im prove multimodal conn
Contin. Pub. S take. Invov
S treng. P lan and M odel
Perc
ent U
se
Figure A.6. Western PDCs/MPOs Policy Importance
For the eastern PDCs/MPOs, P.1 - Invest more in transportation and P.23 - Bicycle and
Pedestrian Facilities Feeder System are considered to be important, being selected 100% and 80% respectively. For the western PDCs/MPOs, P.23 - Bicycle and Pedestrian Facilities Feeder System and P.2 - Support Transit are the most important, with 100% and 80% selection. In comparing the two areas, the policy P.7 - Manage Access and P.13 - Invest in Technology are

36
considered to be more important by the west regions, whereas increase investment in transit and strengthen planning and modeling are considered to be more important to the east regions.
Figures A.7 and A.8 show the importance of relevant scenarios for the east and west regions.
0.00%20.00%40.00%60.00%80.00%
100.00%
Infrastr. Invest. Grows
Energy Costs Rise
Sprawl Accel.
Transit Develop.
Incr. overall public transit
Increased Urban Pop.
Reg. Econ. Grows
Jobs/House Shift
Decr. Use of Autos/In...
Natural Disaster
IT Amenities Grow
Increase Pop./Autos
Global Trade Grows
Increased Retirement
Pop. Decr.
Energy Use Constraints
Figure A.7. Eastern PDCs/MPOs Scenario Importance
0.00%20.00%40.00%60.00%80.00%
100.00%
Energy Costs Rise
Sprawl Accel.
Increased Retirement
Increased Urban Pop.
Reg. Econ. Grows
Transit Develop.
Incr. overall public tra...
Jobs/House Shift
Decr. Use of Autos/I...
Natural Disaster
IT Amenities Grow
Increase Pop./Autos
Pop. Decr.
Infrastr. Invest. Grows
Global Trade Grows
Energy Use Constraints
Figure A.8. Western PDCs/MPOs Scenario Importance
For the eastern PDCs/MPOs the relevant scenarios are S.9 - Infrastructure investment expands, S.8 - Energy cost rises, S.2 - Sprawl accelerates, S.5 - Transit oriented development,

37
and increased overall public transit. In the west, the scenarios of S.8 - Energy cost rises, S.2 - Sprawl accelerates, and S.17 - Retirement are relevant to the PDCs/MPOs. The scenario S.9 - Infrastructure investment expands is significantly more important in the east than in the west (80% importance vs. 0% importance). The scenario S.17 - Retirement is considered to be more important by the west than by the east (60% importance vs. 0% importance).

38

39
APPENDIX B
Microsoft Excel Workbook for Scenario-Based Assessment of Multimodal Policies
This appendix provides a description of the main design features Microsoft Excel Workbook that was developed in this effort to implement scenario-based planning. Screen captures from the workbook are in some cases truncated to preserve the legibility of a few entries. The complete workbook is available on request to the authors or the Virginia Transportation Research Council. The description of the workbook is structured as follows: The section briefly describes the policy evaluation approach, and then the section details the purpose and design of the eight worksheets in the workbook.
The purpose of the workbook is to aid regional transportation planners in the assessment of the sensitivity of statewide multimodal transportation policies to regional future scenarios. The workbook implements VTrans2035 policy performance criteria and transportation policies and additionally allows a user to evaluate region-specific policies. Scoring inputs: The workbook uses a multi-attribute value approach for evaluation each policy. Each policy is first evaluated, or scored, over a set of multimodal transportation policy evaluation criteria that was established by VTrans2025. Evaluation of a policy for a given scenario:
sP = policy score for scenario s
ix = policy utility score for criteria i
isw = weight of criteria i given scenario s
isi
is wxP ⋅= ∑
Overall score of a policy:
pS = Policy overall score for a policy p
sP = Policy score for scenario s N = number of scenarios
N
PS s
s
p
∑=
There are several worksheets of the Excel workbook, as follows.
40
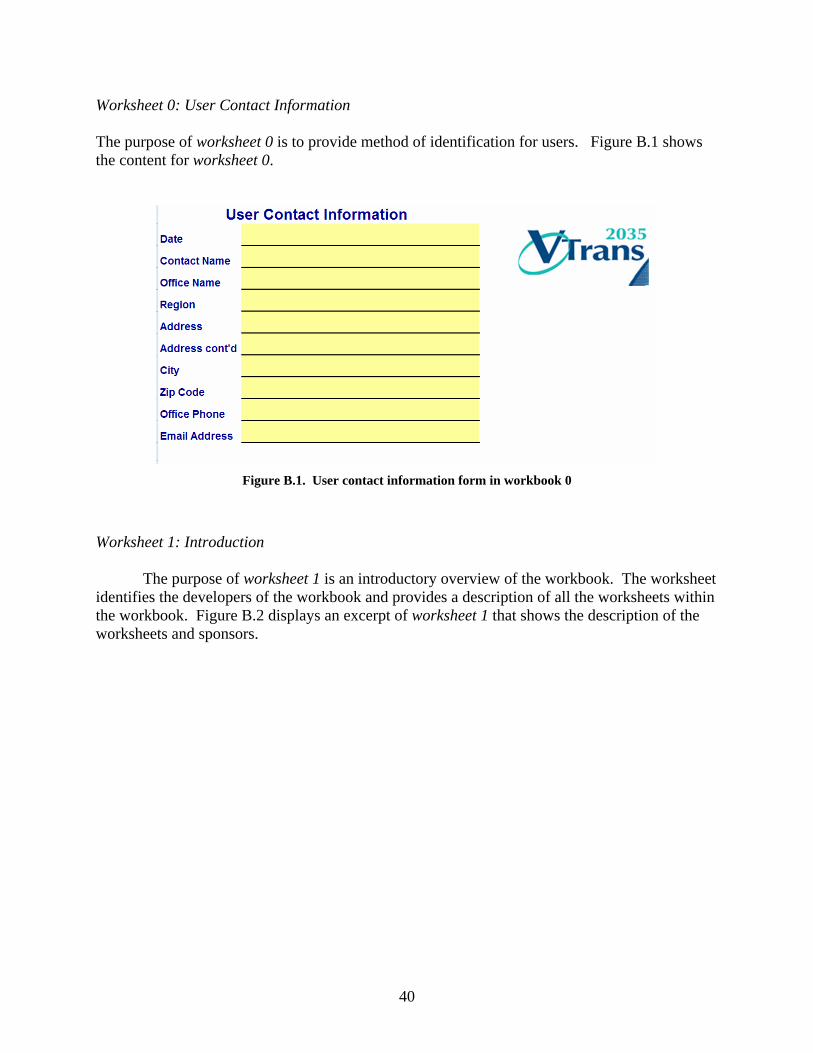
Worksheet 0: User Contact Information The purpose of worksheet 0 is to provide method of identification for users. Figure B.1 shows the content for worksheet 0.
Figure B.1. User contact information form in workbook 0
Worksheet 1: Introduction
The purpose of worksheet 1 is an introductory overview of the workbook. The worksheet identifies the developers of the workbook and provides a description of all the worksheets within the workbook. Figure B.2 displays an excerpt of worksheet 1 that shows the description of the worksheets and sponsors.

41
Figure B.2. Sponsors and description of the other worksheets in worksheet 1
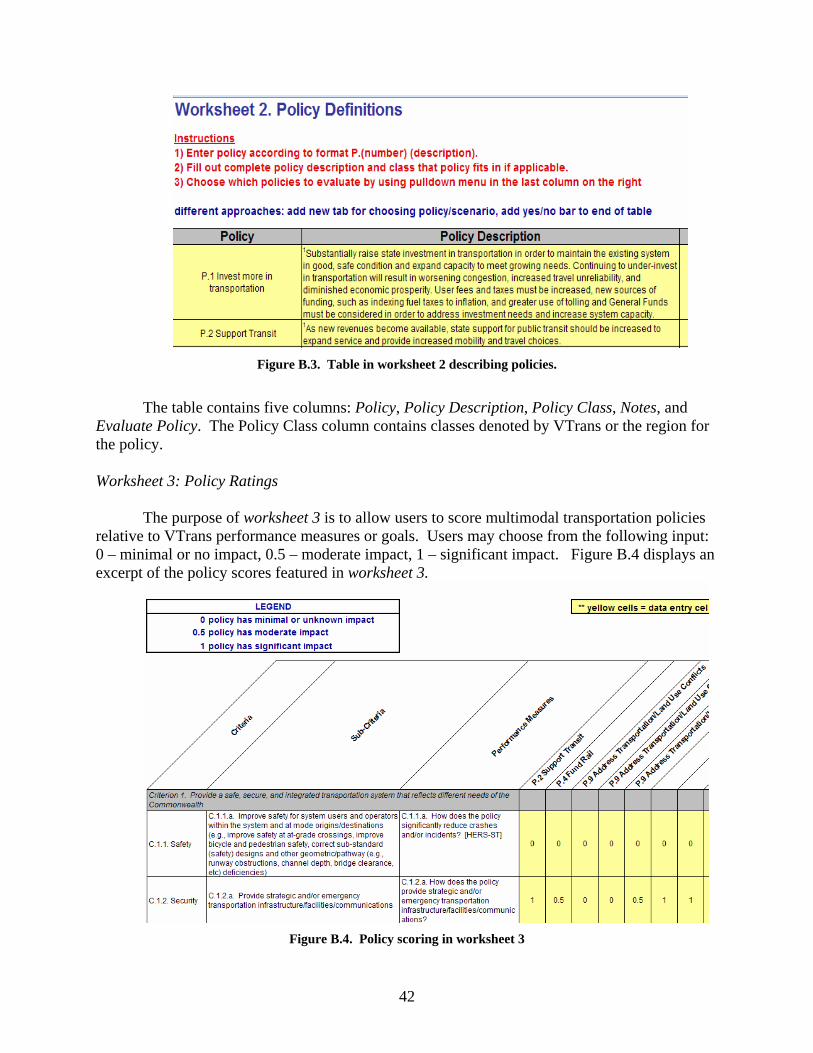
Worksheet 2: Policy Definitions
The purpose of worksheet 2 is to define multimodal transportation policies that are of interest for a Metropolitan Planning Organization (MPO) or planning region. Users can add or remove policies. Users may also choose to keep policies in this worksheet but not evaluate them. Each policy follows a prescribed format: “P. (number) (description)”. Figure B.3 provides an excerpt of the table that appears in worksheet 2.
42
Figure B.3. Table in worksheet 2 describing policies.
The table contains five columns: Policy, Policy Description, Policy Class, Notes, and
Evaluate Policy. The Policy Class column contains classes denoted by VTrans or the region for the policy. Worksheet 3: Policy Ratings
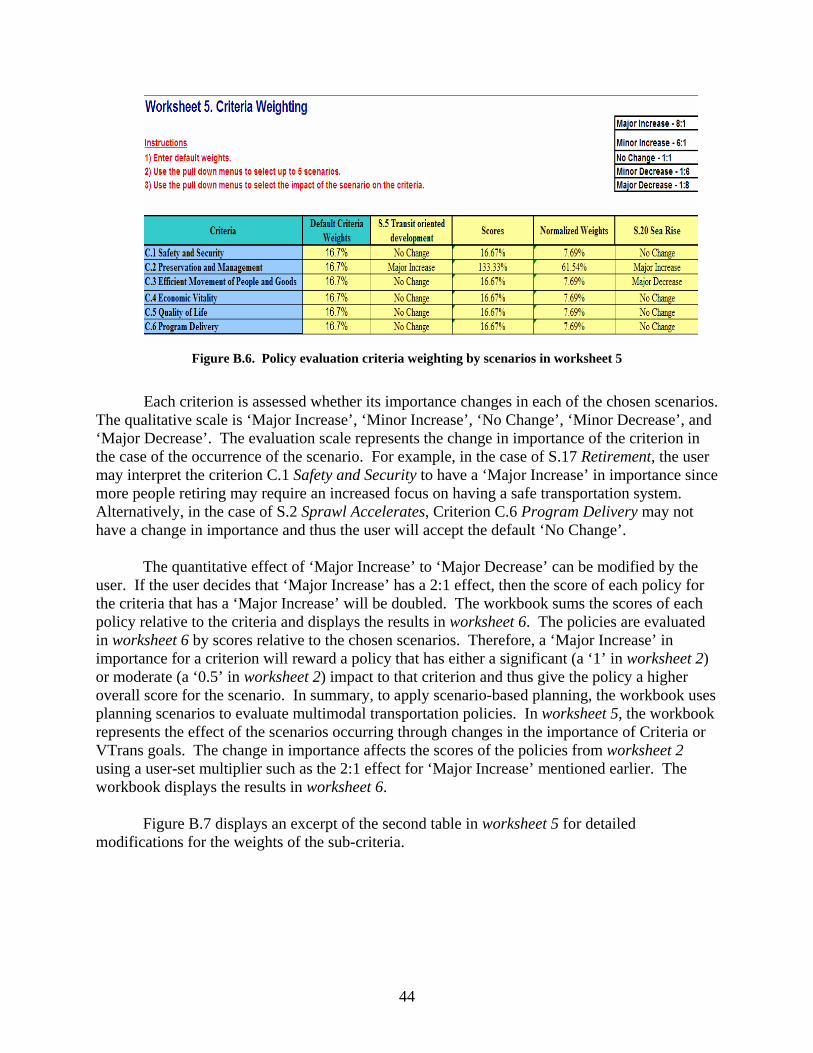
The purpose of worksheet 3 is to allow users to score multimodal transportation policies relative to VTrans performance measures or goals. Users may choose from the following input: 0 – minimal or no impact, 0.5 – moderate impact, 1 – significant impact. Figure B.4 displays an excerpt of the policy scores featured in worksheet 3.
Figure B.4. Policy scoring in worksheet 3

43
For example, performance measure C.1.2.a states “How does the policy provide strategic and/or emergency transportation infrastructure/facilities/communications?” The user must score each policy for its impacts to emergency transportation. The user may evaluate Policy P.6 Strengthen Planning and Modeling as having a significant impact and input a 1, since strengthened planning will allow for improved emergency transportation. Similarly, the user may score Policy P.10 Improve connections as having a moderate impact and a policy such as P.9 Address Transportation/Land Use Conflicts as having a minimal impact.
The policy ratings are summed for each policy and the scores are separated into six scores for the six high level criteria. For example, if Policy P.1 scores a 0 for C.1.1.a, a 1 for C.1.2.a, and a 0.5 for C.1.2.b, then P.1 will have a score of 1.5 for Criteria C.1. These scores are reweighted by scenario influences in worksheet 5. Worksheet 4: Scenario Definitions
The purpose of worksheet 4 is to provide definitions for the relevant planning scenarios for the region. Figure B.5 displays an excerpt of the table of scenarios in worksheet 4.
Figure B.5. Excerpt of the scenarios that are entered in worksheet 4 [a complete list of scenarios is
provided in an accompanying appendix of this report]
There are three columns in the scenario definition table: Scenario, Scenario Description, and Region Affected. Region Affected is optional and indicates if a scenario is specific to a part of the region. Currently, up to five scenarios listed in this worksheet can be chosen to evaluate the policies listed in worksheet 2. Worksheet 5: Criteria Weighting
The purpose of worksheet 5 is to incorporate the scenarios into the evaluation of the multimodal transportation policies. Figure B.6 displays an excerpt of the first table which contains the high level criteria (VTrans goals) in the rows and the scenarios chosen by the user in the columns.
44
Figure B.6. Policy evaluation criteria weighting by scenarios in worksheet 5
Each criterion is assessed whether its importance changes in each of the chosen scenarios.
The qualitative scale is ‘Major Increase’, ‘Minor Increase’, ‘No Change’, ‘Minor Decrease’, and ‘Major Decrease’. The evaluation scale represents the change in importance of the criterion in the case of the occurrence of the scenario. For example, in the case of S.17 Retirement, the user may interpret the criterion C.1 Safety and Security to have a ‘Major Increase’ in importance since more people retiring may require an increased focus on having a safe transportation system. Alternatively, in the case of S.2 Sprawl Accelerates, Criterion C.6 Program Delivery may not have a change in importance and thus the user will accept the default ‘No Change’.
The quantitative effect of ‘Major Increase’ to ‘Major Decrease’ can be modified by the user. If the user decides that ‘Major Increase’ has a 2:1 effect, then the score of each policy for the criteria that has a ‘Major Increase’ will be doubled. The workbook sums the scores of each policy relative to the criteria and displays the results in worksheet 6. The policies are evaluated in worksheet 6 by scores relative to the chosen scenarios. Therefore, a ‘Major Increase’ in importance for a criterion will reward a policy that has either a significant (a ‘1’ in worksheet 2) or moderate (a ‘0.5’ in worksheet 2) impact to that criterion and thus give the policy a higher overall score for the scenario. In summary, to apply scenario-based planning, the workbook uses planning scenarios to evaluate multimodal transportation policies. In worksheet 5, the workbook represents the effect of the scenarios occurring through changes in the importance of Criteria or VTrans goals. The change in importance affects the scores of the policies from worksheet 2 using a user-set multiplier such as the 2:1 effect for ‘Major Increase’ mentioned earlier. The workbook displays the results in worksheet 6.
Figure B.7 displays an excerpt of the second table in worksheet 5 for detailed modifications for the weights of the sub-criteria.
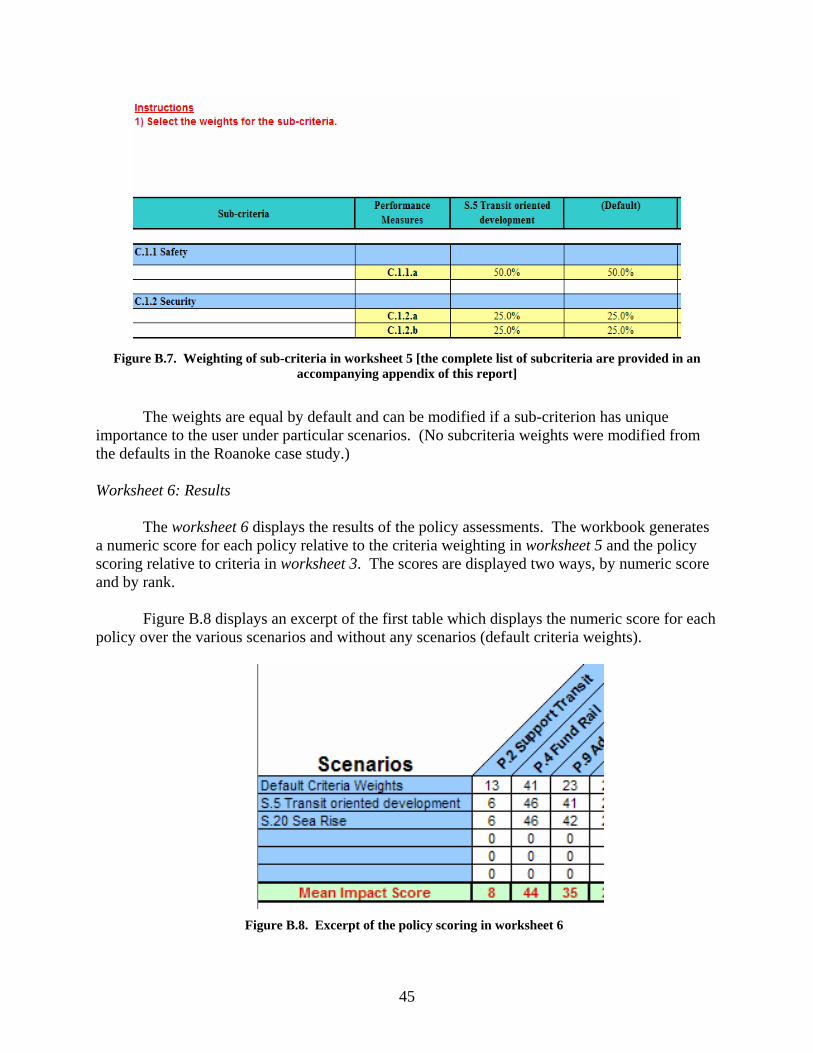
45
Figure B.7. Weighting of sub-criteria in worksheet 5 [the complete list of subcriteria are provided in an
accompanying appendix of this report]
The weights are equal by default and can be modified if a sub-criterion has unique
importance to the user under particular scenarios. (No subcriteria weights were modified from the defaults in the Roanoke case study.) Worksheet 6: Results
The worksheet 6 displays the results of the policy assessments. The workbook generates a numeric score for each policy relative to the criteria weighting in worksheet 5 and the policy scoring relative to criteria in worksheet 3. The scores are displayed two ways, by numeric score and by rank.
Figure B.8 displays an excerpt of the first table which displays the numeric score for each policy over the various scenarios and without any scenarios (default criteria weights).
Figure B.8. Excerpt of the policy scoring in worksheet 6

46
The workbook averages the score to create a mean impact score for each policy. Users can interpret the score as representing the policies that may have the greatest impacts in the future given relevant planning scenarios. The policy impact score functions as a concept that users can consider when prioritizing multimodal transportation policies. Several users can fill out the workbook and compare mean impact scores for policies. Figure B.9 displays an excerpt of the graph which portrays the policy scores as well as the minimum and maximum score for each policy.
Figure B.9. Excerpt of the policy evaluation score and sensitivities in worksheet 6
The user can study the sensitivity of the policy to various scenarios by considering the
minimum and maximum scores shown on the graph. For example, a planner may prefer a policy

47
with a lower mean score but less sensitivity to a policy that has a higher mean score but scores low in some scenarios.
Figure B.10 displays an excerpt of a table which shows the rank of the policies based on the score and relative to the other policies.
Figure B.10. Excerpt of the ranking of the policies in worksheet 6
Figure B.11 shows the graph below the table which lists the median rank along with the
minimum and maximum rank the policy received over the scenarios.

48
Figure B.11. Excerpt of the graph of policy rankings and sensitivities in worksheet 6
The policy rankings allow users to identify a top policy or top-five policies and their sensitivities of rank to the scenarios, etc. Worksheet 7: Calculations The purpose of Worksheet 7 is to calculate intermediate values for worksheet 6. This worksheet does not require user input and is hidden from users.
49
APPENDIX C
LIST OF POLICIES, SCENARIOS, AND PERFORMANCE CRITERIA USED IN THE WORKBOOK DEVELOPMENT
This appendix documents the statewide polices, scenarios, and performance criteria that are used in the Excel workbook. VTrans 2025 Statewide Transportation Policies (Virginia Secretary of Transportation 2004): P.1 Invest more in transportation P.2 Support Transit P.3 Remove Bias P.4 Fund Rail P.5 Protect Trust Fund Rev. for Trans. P.6 Strengthen planning and modeling P.7 Manage Access P.8 Consider State vs. Local Rules P.9 Address Transportation/Land Use Conflicts P.10 Improve Connections P.11 Think Multimodally P.12 Take the Lead P.13 Invest in Technology P.14 Use Objective Criteria P.15 Plan Multimodally P.16 Continue Public and Stakeholder Involvement P.17 Continue Transportation Agency Head Coord. P.18 Review Intermodal Office Alignment P.19 Develop Action Plans P.20 Continue Technical Committee P.21 Establish a Commission P.22 Smart Growth P.23 Bicycle and Pedestrian Facilities Feeder System P.24 Going Green P.25 Diesel and Filter Regulation Scenarios: S.1 Urban core repopulates S.2 Sprawl accelerates S.3 IT amenities grow S.4 Region undivided S.5 Transit oriented development S.6 Regional economy strengthens S.7 Global trade intensifies
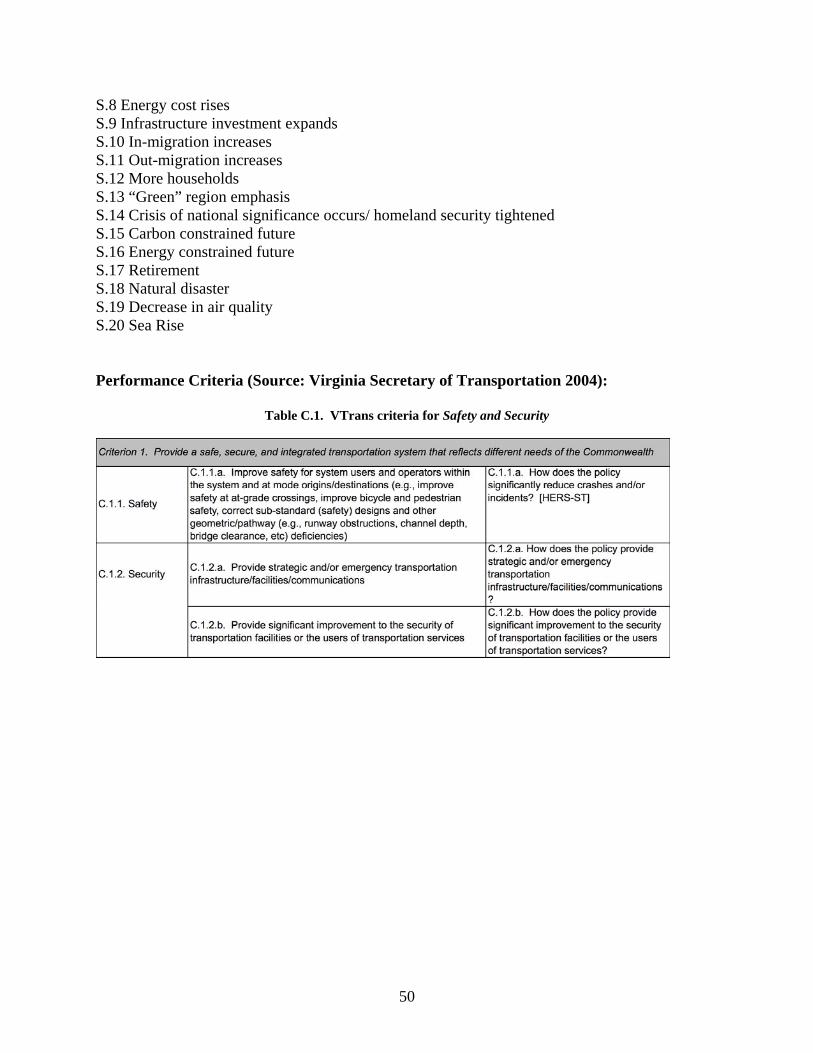
50
S.8 Energy cost rises S.9 Infrastructure investment expands S.10 In-migration increases S.11 Out-migration increases S.12 More households S.13 “Green” region emphasis S.14 Crisis of national significance occurs/ homeland security tightened S.15 Carbon constrained future S.16 Energy constrained future S.17 Retirement S.18 Natural disaster S.19 Decrease in air quality S.20 Sea Rise Performance Criteria (Source: Virginia Secretary of Transportation 2004):
Table C.1. VTrans criteria for Safety and Security

51
Table C.2. VTrans criteria for Preservation and Management
Table C.3. VTrans criteria for Efficient Movement of People and Goods

52
Table C.4. VTrans criteria for Economic Vitality
Table C.5. VTrans criteria for Quality of Life
Table C.6. VTrans criteria for Program Delivery

53
APPENDIX D
RELATED STUDY OF ECONOMIC IMPACTS OF TRANSPORTATION INVESTMENT
This appendix documents a related preliminary study of economic impacts of transportation investment that was performed under the same contract as the effort described in the main body of this report. Prof. Joost Santos of the University of Virginia was consulted in the preparation of this appendix, though any remaining errors are those of the authors. TO: Dr. Mary Lynn Tischer, Multimodal Office FROM: Megan Kersh Asad Saqib Matthew Schroeder Ward Williams Professor James Lambert University of Virginia Center for Risk Management of Engineering Systems DATE: January 28, 2008 SUBJECT: The impacts of increasing output in transportation on final demand/GDP in Virginia Overview We analyzed the impacts of transportation investment in Virginia and to overall output and final demand in sixty sectors of the economy. For this study, we purchased data from the Bureau of Economic Analysis (http://www.bea.gov/regional/rims/index.cfm). The data set was released in 2005 and is the most recent data available. Our observations from Bureau of Economic Analysis data are as follows:
⇒ The seven transportation sectors are interconnected with the sixty sectors through the expression x = Ax + c (expressed per year).
o x - total output per year (million dollars) o A - input output matrix for output recycled to each sector [60 x 60] o Ax – recycled output into other sectors per year (dollars) o c - "final demand" output of the economy per year or GDP(dollars)

54
GDP = consumption + investment + (government spending) + (exports − imports)
⇒ Output in Virginia is broken down into 60 sectors for this problem. ⇒ Of the sixty sectors the total output is $226B ⇒ Of the sixty sectors, the final demand is $128B ⇒ The seven transportation sectors are
o Air transportation o Rail transportation o Water transportation o Truck transportation o Transit and ground passenger transportation o Pipeline transportation o Other transportation and support activities
⇒ Output for the seven transportation sectors is $7.2B ⇒ The seven transportation sectors constitute 2.5% of total output ⇒ Final demand for the seven transportation sectors is $3.2B ⇒ The seven transportation sectors constitute 3.2% of the final demand ⇒ This database does not distinguish between public and private investment or between
services and construction. We found the following in complementary analysis:
⇒ Stimulating total output: A 1% increase to transportation output, x, results in a $37M increase to final demand, c, across all sectors
o The 1% increase in transportation output also resulted in over a 1% increase in final demand for all transportation sectors
⇒ Stimulating final demand: (say something about graph results) o Mention difference between stimulating demand and increasing output
Results of Increasing Transportation Output We analyzed the results of increasing transportation output by raising transportation output in all the transportation sectors by 1%. Table D.1 provides the sectors and increased output in millions of dollars.
Table D.1. Transportation Sector Increase in Output
Sector Sector output ($
millions) Increase in sector
output ($ millions) Air transportation 1801.7 18.0 Rail transportation 699.3 7.0 Water transportation 292.0 2.9 Truck transportation 2538.1 25.4 Transit and ground passenger transportation* 344.1 3.4 Pipeline transportation 80.0 0.8 Other transportation and support activities* 1443.3 14.4

55
Using the formula x= Ax + c, new c values (output or final demand) values were calculated. Figure D.1 displays the increased output for the respective transportations sectors.
0
5
10
15
20
25
30
Truc
k AirOthe
rRail
Tran
sit &
pass
enge
r
Wate
r
Pipelin
e
millions
Figure D.1. Increase in output for transportation sectors given 1% increase in output
The total output increase for all transportation sectors is 64 millions dollars. The total output increase for all sectors in Virginia is 37 million dollars. The difference between the transportation sector gains and overall gains is due to increased transportation output absorbing output from other sectors. It is important to note that there is still a strong overall increase in output overall when increasing output for transportation by 1%. Results from Stimulating Final Demand We use the formula x = Ax + c to exchange the desired unknown c value with x. After manipulating the formula we obtain c (I-A)-1 = x. When stimulating demand, we found that output for all sectors increases, in contrast to the first approach, which was increasing output for specific sectors. Figure D.2 shows the ten sectors with greatest percentage increase in output based on a 1% increase in final demand in the transportation sectors.
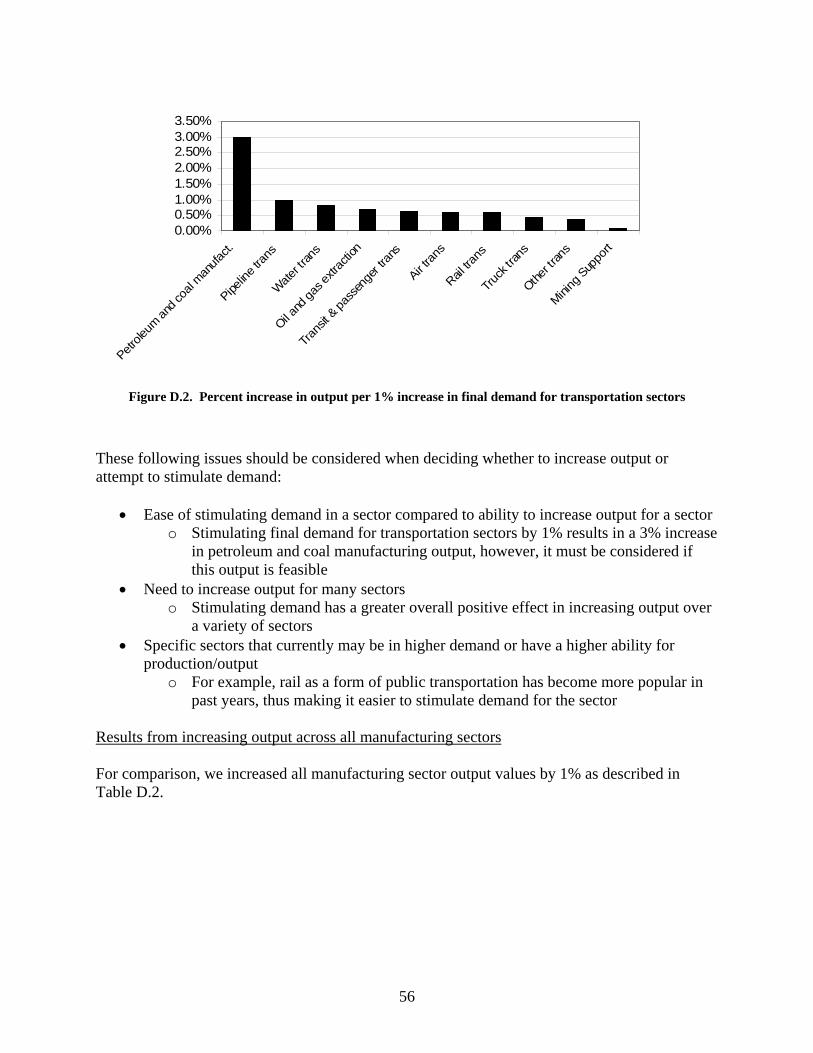
56
0.00%0.50%1.00%1.50%2.00%2.50%3.00%3.50%
Petrole
um an
d coa
l man
ufact.
Pipelin
e tran
s
Water tr
ans
Oil and
gas e
xtrac
tion
Trans
it & pa
ssen
ger tr
ans
Air tran
s
Rail tra
ns
Truck
trans
Other tr
ans
Mining
Sup
port
Figure D.2. Percent increase in output per 1% increase in final demand for transportation sectors
These following issues should be considered when deciding whether to increase output or attempt to stimulate demand:
• Ease of stimulating demand in a sector compared to ability to increase output for a sector o Stimulating final demand for transportation sectors by 1% results in a 3% increase
in petroleum and coal manufacturing output, however, it must be considered if this output is feasible
• Need to increase output for many sectors o Stimulating demand has a greater overall positive effect in increasing output over
a variety of sectors • Specific sectors that currently may be in higher demand or have a higher ability for
production/output o For example, rail as a form of public transportation has become more popular in
past years, thus making it easier to stimulate demand for the sector Results from increasing output across all manufacturing sectors For comparison, we increased all manufacturing sector output values by 1% as described in Table D.2.
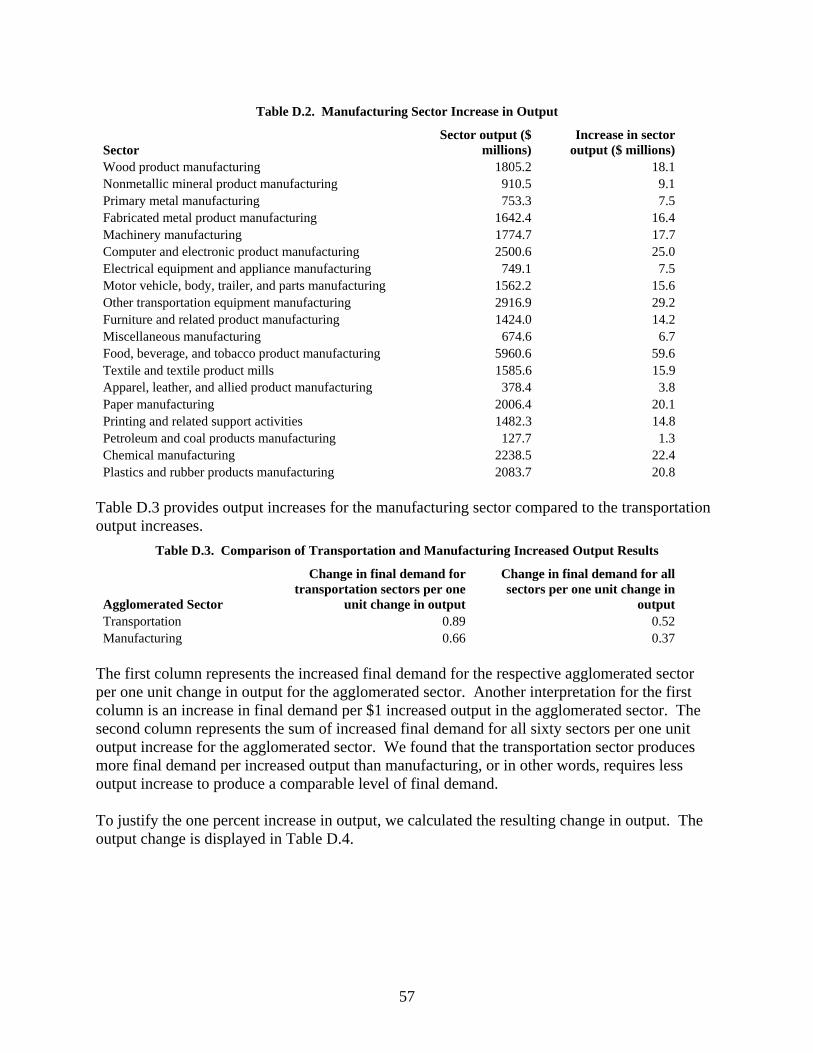
57
Table D.2. Manufacturing Sector Increase in Output
Sector Sector output ($
millions) Increase in sector
output ($ millions) Wood product manufacturing 1805.2 18.1 Nonmetallic mineral product manufacturing 910.5 9.1 Primary metal manufacturing 753.3 7.5 Fabricated metal product manufacturing 1642.4 16.4 Machinery manufacturing 1774.7 17.7 Computer and electronic product manufacturing 2500.6 25.0 Electrical equipment and appliance manufacturing 749.1 7.5 Motor vehicle, body, trailer, and parts manufacturing 1562.2 15.6 Other transportation equipment manufacturing 2916.9 29.2 Furniture and related product manufacturing 1424.0 14.2 Miscellaneous manufacturing 674.6 6.7 Food, beverage, and tobacco product manufacturing 5960.6 59.6 Textile and textile product mills 1585.6 15.9 Apparel, leather, and allied product manufacturing 378.4 3.8 Paper manufacturing 2006.4 20.1 Printing and related support activities 1482.3 14.8 Petroleum and coal products manufacturing 127.7 1.3 Chemical manufacturing 2238.5 22.4 Plastics and rubber products manufacturing 2083.7 20.8
Table D.3 provides output increases for the manufacturing sector compared to the transportation output increases.
Table D.3. Comparison of Transportation and Manufacturing Increased Output Results
Agglomerated Sector
Change in final demand for transportation sectors per one
unit change in output
Change in final demand for all sectors per one unit change in
output Transportation 0.89 0.52 Manufacturing 0.66 0.37
The first column represents the increased final demand for the respective agglomerated sector per one unit change in output for the agglomerated sector. Another interpretation for the first column is an increase in final demand per $1 increased output in the agglomerated sector. The second column represents the sum of increased final demand for all sixty sectors per one unit output increase for the agglomerated sector. We found that the transportation sector produces more final demand per increased output than manufacturing, or in other words, requires less output increase to produce a comparable level of final demand. To justify the one percent increase in output, we calculated the resulting change in output. The output change is displayed in Table D.4.
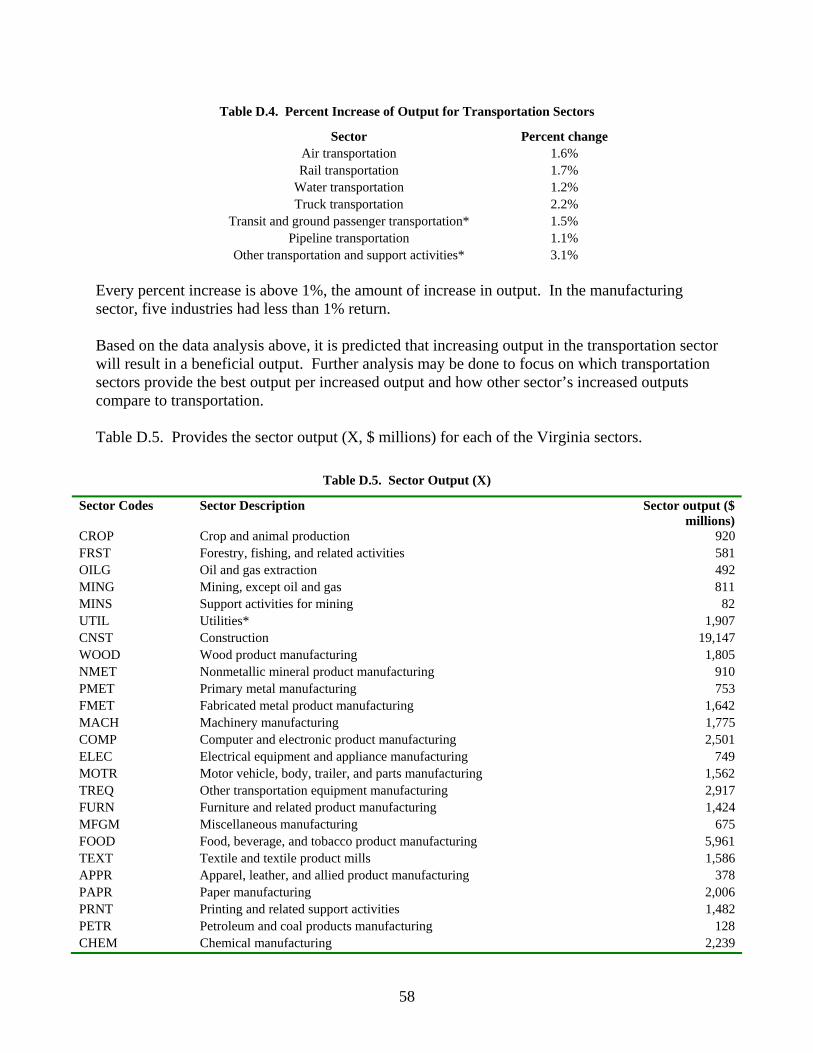
58
Table D.4. Percent Increase of Output for Transportation Sectors
Sector Percent change Air transportation 1.6% Rail transportation 1.7%
Water transportation 1.2% Truck transportation 2.2%
Transit and ground passenger transportation* 1.5% Pipeline transportation 1.1%
Other transportation and support activities* 3.1% Every percent increase is above 1%, the amount of increase in output. In the manufacturing sector, five industries had less than 1% return. Based on the data analysis above, it is predicted that increasing output in the transportation sector will result in a beneficial output. Further analysis may be done to focus on which transportation sectors provide the best output per increased output and how other sector’s increased outputs compare to transportation. Table D.5. Provides the sector output (X, $ millions) for each of the Virginia sectors.
Table D.5. Sector Output (X)
Sector Codes Sector Description Sector output ($ millions)
CROP Crop and animal production 920 FRST Forestry, fishing, and related activities 581 OILG Oil and gas extraction 492 MING Mining, except oil and gas 811 MINS Support activities for mining 82 UTIL Utilities* 1,907 CNST Construction 19,147 WOOD Wood product manufacturing 1,805 NMET Nonmetallic mineral product manufacturing 910 PMET Primary metal manufacturing 753 FMET Fabricated metal product manufacturing 1,642 MACH Machinery manufacturing 1,775 COMP Computer and electronic product manufacturing 2,501 ELEC Electrical equipment and appliance manufacturing 749 MOTR Motor vehicle, body, trailer, and parts manufacturing 1,562 TREQ Other transportation equipment manufacturing 2,917 FURN Furniture and related product manufacturing 1,424 MFGM Miscellaneous manufacturing 675 FOOD Food, beverage, and tobacco product manufacturing 5,961 TEXT Textile and textile product mills 1,586 APPR Apparel, leather, and allied product manufacturing 378 PAPR Paper manufacturing 2,006 PRNT Printing and related support activities 1,482 PETR Petroleum and coal products manufacturing 128 CHEM Chemical manufacturing 2,239
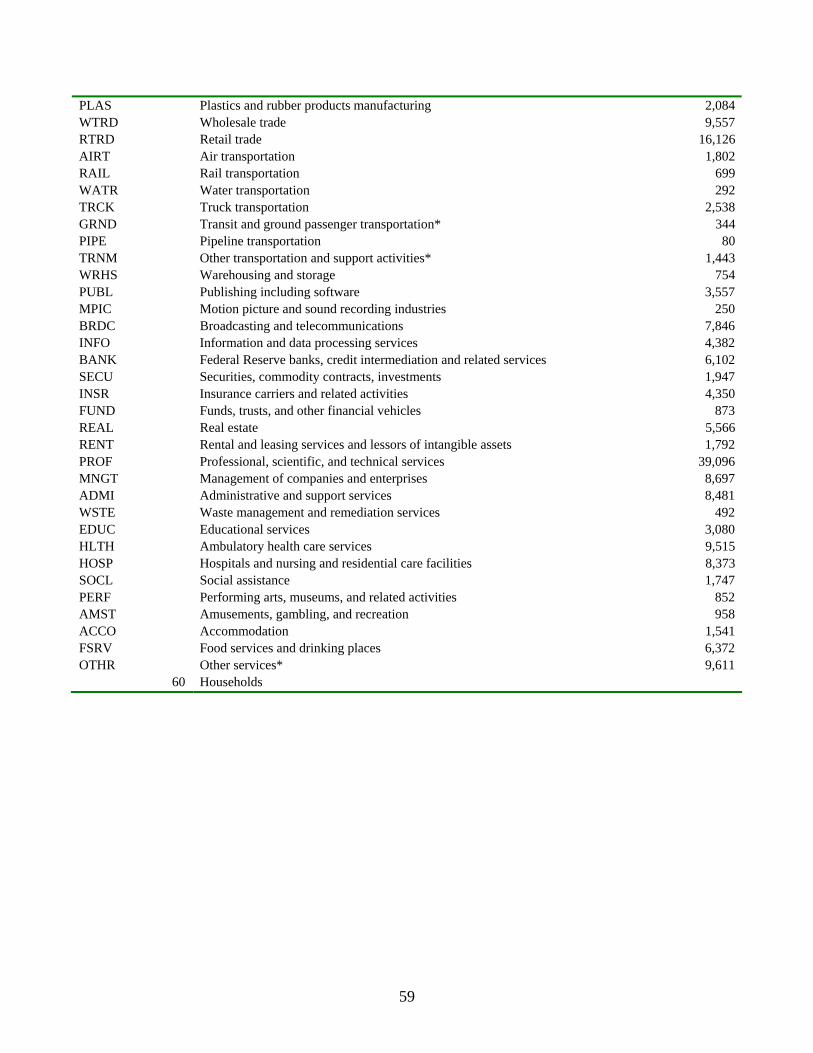
59
PLAS Plastics and rubber products manufacturing 2,084 WTRD Wholesale trade 9,557 RTRD Retail trade 16,126 AIRT Air transportation 1,802 RAIL Rail transportation 699 WATR Water transportation 292 TRCK Truck transportation 2,538 GRND Transit and ground passenger transportation* 344 PIPE Pipeline transportation 80 TRNM Other transportation and support activities* 1,443 WRHS Warehousing and storage 754 PUBL Publishing including software 3,557 MPIC Motion picture and sound recording industries 250 BRDC Broadcasting and telecommunications 7,846 INFO Information and data processing services 4,382 BANK Federal Reserve banks, credit intermediation and related services 6,102 SECU Securities, commodity contracts, investments 1,947 INSR Insurance carriers and related activities 4,350 FUND Funds, trusts, and other financial vehicles 873 REAL Real estate 5,566 RENT Rental and leasing services and lessors of intangible assets 1,792 PROF Professional, scientific, and technical services 39,096 MNGT Management of companies and enterprises 8,697 ADMI Administrative and support services 8,481 WSTE Waste management and remediation services 492 EDUC Educational services 3,080 HLTH Ambulatory health care services 9,515 HOSP Hospitals and nursing and residential care facilities 8,373 SOCL Social assistance 1,747 PERF Performing arts, museums, and related activities 852 AMST Amusements, gambling, and recreation 958 ACCO Accommodation 1,541 FSRV Food services and drinking places 6,372 OTHR Other services* 9,611
60 Households