SCE CSI4 Laboratory Integration Test Procedures & Results...
37
SCE CSI4 Laboratory Integration Test Procedures & Results for Smart Inverter Communications Prepared by: Steven Robles Joshua McDonald Justin Foulk Manuel Garcia Advanced Technology March 28, 2016
Transcript of SCE CSI4 Laboratory Integration Test Procedures & Results...

SCE CSI4 Laboratory Integration
Test Procedures & Results
for Smart Inverter Communications
Prepared by: Steven Robles Joshua McDonald Justin Foulk Manuel Garcia Advanced Technology March 28, 2016
Page 2 of 37
SCE DISCLAIMER OF WARRANTIES AND LIMITATION OF LIABILITIES
This report was created as a result of work sponsored by the California Solar Initiative (CSI) Research, Development, Demonstration, and Deployment (RD&D) Program, solicitation 4, and led by EPRI to investigate a standard communication interface and advanced functionality for solar PV inverters. This report has not been approved or disapproved by SCE nor has SCE verified the accuracy, adequacy, and safety of the information in this report.
Neither Advanced Technology, SCE, Edison International, nor any person working for or on behalf of any of these entities, makes any warranty or representation, express or implied, related to this report. Without limiting the foregoing, SCE expressly disclaims any liability associated with the following: (i) information, products, processes or procedures discussed in this report, including the merchantability and fitness for a particular purpose of these, (ii) use of the test procedure or that this use does not infringe upon or interfere with rights of others, including another’s intellectual property, and (iii) that this report is suitable to any particular user’s circumstance.
SCE follows OSHA and internal safety procedures to protect its personnel and encourages its partners and contractors to these safety practices as well.
Page 3 of 37
Contents 1.0 EXECUTIVE SUMMARY ..................................................................................................................... 4
1.1 Background ................................................................................................................................... 4
1.2 Objective ....................................................................................................................................... 4
1.3 Results Summary ........................................................................................................................... 5
2.0 LABORATORY TEST ENVIRONMENT ................................................................................................. 7
2.1 Autogrid System ............................................................................................................................ 7
2.2 Communication System Architecture ........................................................................................... 7
2.3 Power Equipment ......................................................................................................................... 7
2.4 Electrical Test Setup ...................................................................................................................... 8
2.5 Inverter Measurements .............................................................................................................. 10
2.6 Personnel Safety ......................................................................................................................... 10
3.0 TEST CASES AND PROCEDURES ...................................................................................................... 11
3.1 Registration ................................................................................................................................. 11
3.2 Volt-VAR Mode with Watt Priority ............................................................................................. 13
3.3 Fixed Power Factor ..................................................................................................................... 15
3.4 Limit Maximum Real Power ........................................................................................................ 16
3.5 Voltage-Watt Mode .................................................................................................................... 17
3.6 Frequency-Watt Mode ................................................................................................................ 19
3.7 Connect/Disconnect .................................................................................................................... 21
3.8 Monitor DER Status and Output ................................................................................................. 22
4.0 LABORATORY TEST RESULTS .......................................................................................................... 24
4.1 Registration ................................................................................................................................. 24
4.2 Volt-VAR Mode with Watt Priority ............................................................................................. 25
4.3 Fixed Power Factor ..................................................................................................................... 27
4.4 Limit Maximum Real Power ........................................................................................................ 30
4.5 Voltage-Watt Mode .................................................................................................................... 32
4.6 Frequency-Watt Mode ................................................................................................................ 34
4.7 Connect/Disconnect .................................................................................................................... 35
4.8 Monitor DER Status and Output ................................................................................................. 36
Page 4 of 37
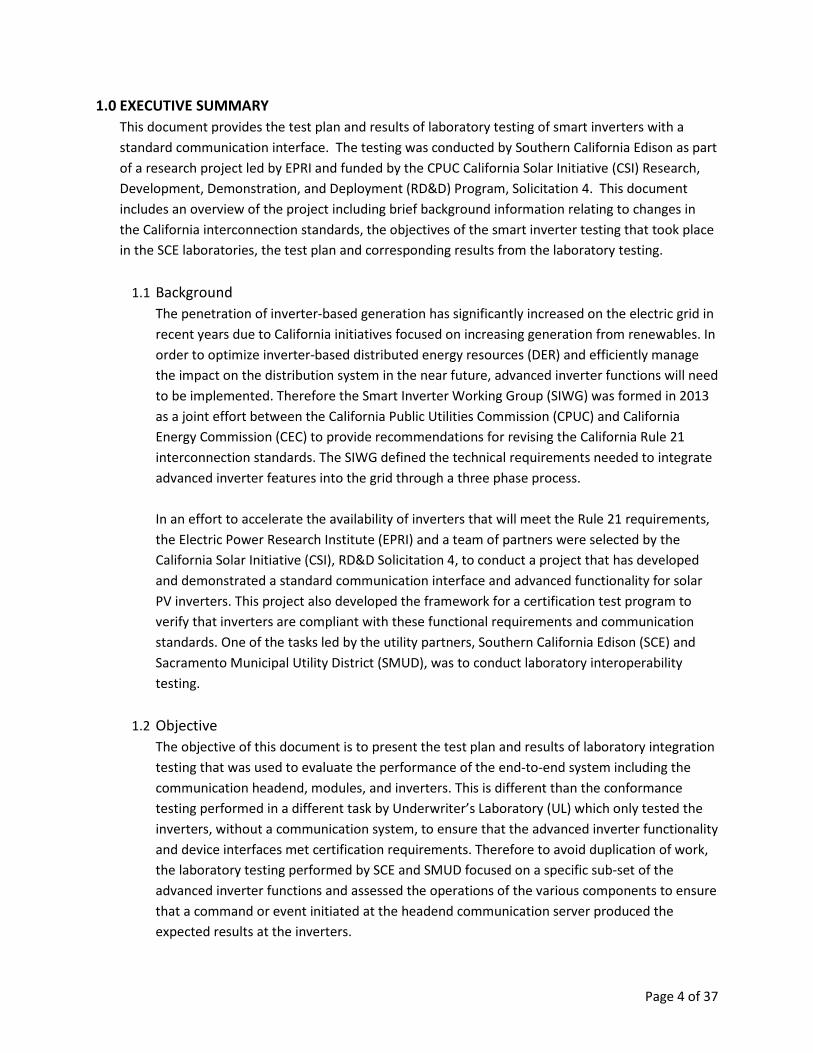
1.0 EXECUTIVE SUMMARY This document provides the test plan and results of laboratory testing of smart inverters with a standard communication interface. The testing was conducted by Southern California Edison as part of a research project led by EPRI and funded by the CPUC California Solar Initiative (CSI) Research, Development, Demonstration, and Deployment (RD&D) Program, Solicitation 4. This document includes an overview of the project including brief background information relating to changes in the California interconnection standards, the objectives of the smart inverter testing that took place in the SCE laboratories, the test plan and corresponding results from the laboratory testing.
1.1 Background The penetration of inverter-based generation has significantly increased on the electric grid in recent years due to California initiatives focused on increasing generation from renewables. In order to optimize inverter-based distributed energy resources (DER) and efficiently manage the impact on the distribution system in the near future, advanced inverter functions will need to be implemented. Therefore the Smart Inverter Working Group (SIWG) was formed in 2013 as a joint effort between the California Public Utilities Commission (CPUC) and California Energy Commission (CEC) to provide recommendations for revising the California Rule 21 interconnection standards. The SIWG defined the technical requirements needed to integrate advanced inverter features into the grid through a three phase process. In an effort to accelerate the availability of inverters that will meet the Rule 21 requirements, the Electric Power Research Institute (EPRI) and a team of partners were selected by the California Solar Initiative (CSI), RD&D Solicitation 4, to conduct a project that has developed and demonstrated a standard communication interface and advanced functionality for solar PV inverters. This project also developed the framework for a certification test program to verify that inverters are compliant with these functional requirements and communication standards. One of the tasks led by the utility partners, Southern California Edison (SCE) and Sacramento Municipal Utility District (SMUD), was to conduct laboratory interoperability testing.
1.2 Objective The objective of this document is to present the test plan and results of laboratory integration testing that was used to evaluate the performance of the end-to-end system including the communication headend, modules, and inverters. This is different than the conformance testing performed in a different task by Underwriter’s Laboratory (UL) which only tested the inverters, without a communication system, to ensure that the advanced inverter functionality and device interfaces met certification requirements. Therefore to avoid duplication of work, the laboratory testing performed by SCE and SMUD focused on a specific sub-set of the advanced inverter functions and assessed the operations of the various components to ensure that a command or event initiated at the headend communication server produced the expected results at the inverters.
Page 5 of 37
Many of the inverter use cases and requirements demonstrated during testing were taken from the proposed SIWG recommendations and California Rule 21 proceedings. These activities were on-going during the project and final SIWG recommendations for several of the features had not been finalized when the product designs and test plans for this project were frozen. Therefore the settings proposed for the inverter advanced functions in this test procedure may not be the final settings implemented in the field and simply served as an example to evaluate the end-to-end communication system. It was within the scope of the interoperability testing to demonstrate several advanced inverter functions including volt-var, fixed power factor, limiting maximum real power, etc. It was also the intent of this testing to ensure the compatibility of components with one another. Therefore a single utility communication system and communication module was expected to be compatible with multiple inverters provided from different manufacturers. Additionally, a single inverter design was expected to be compatible with the different types of communication systems.
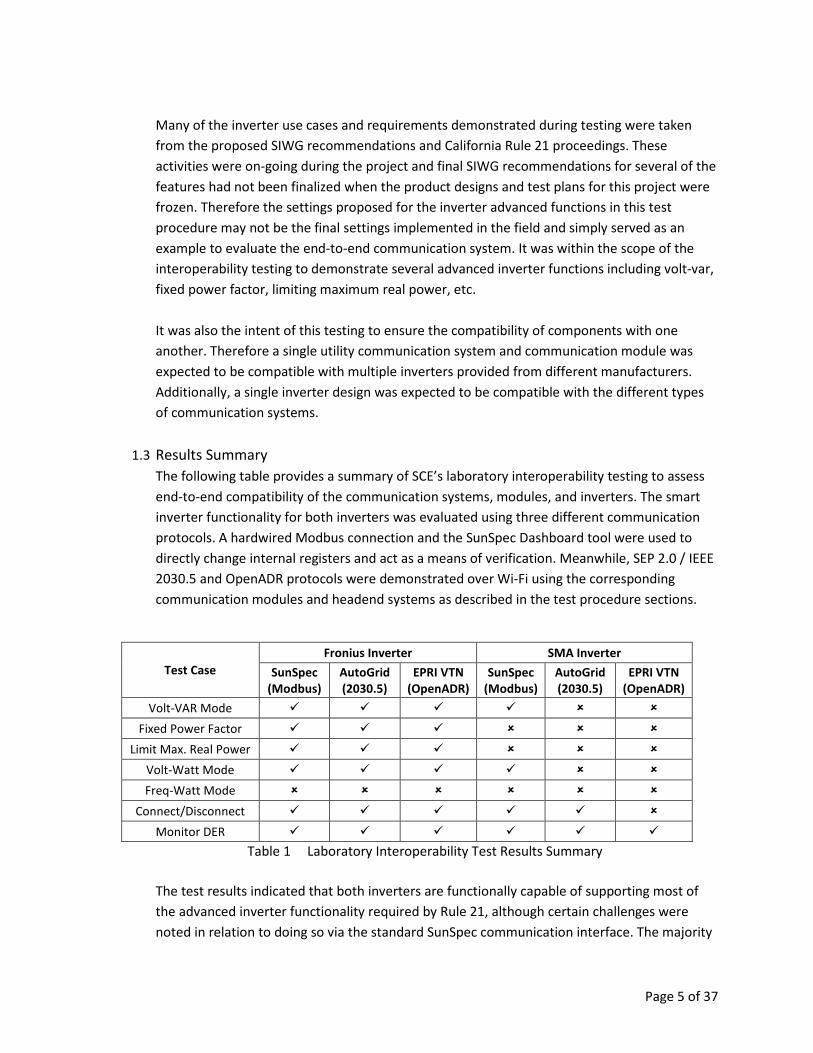
1.3 Results Summary The following table provides a summary of SCE’s laboratory interoperability testing to assess end-to-end compatibility of the communication systems, modules, and inverters. The smart inverter functionality for both inverters was evaluated using three different communication protocols. A hardwired Modbus connection and the SunSpec Dashboard tool were used to directly change internal registers and act as a means of verification. Meanwhile, SEP 2.0 / IEEE 2030.5 and OpenADR protocols were demonstrated over Wi-Fi using the corresponding communication modules and headend systems as described in the test procedure sections.
Test Case Fronius Inverter SMA Inverter
SunSpec (Modbus)
AutoGrid (2030.5)
EPRI VTN (OpenADR)
SunSpec (Modbus)
AutoGrid (2030.5)
EPRI VTN (OpenADR)
Volt-VAR Mode
Fixed Power Factor
Limit Max. Real Power
Volt-Watt Mode
Freq-Watt Mode
Connect/Disconnect
Monitor DER
Table 1 Laboratory Interoperability Test Results Summary The test results indicated that both inverters are functionally capable of supporting most of the advanced inverter functionality required by Rule 21, although certain challenges were noted in relation to doing so via the standard SunSpec communication interface. The majority

Page 6 of 37
of the functions were successfully implemented by changing the standard Modbus registers directly, with the exception of frequency-watt mode for both inverters and the fixed power factor and max power limit settings for a single inverter. Direct settings (i.e. fixed power factor and limit maximum power) behaved exceptionally well, remaining within 1.5% of the intended value. Autonomous curve functions (i.e. volt-var and volt-watt) remained within 1.5% as well with the exception of one inverter’s volt-watt mode which displayed a 5% error between the programmed curve and measured parameters. As for the end-to-end system testing with the two internet-based protocols, the results varied for the different inverter and module combinations. One inverter successfully demonstrated nearly all of the smart inverter functions using both SEP 2.0 / IEEE 2030.5 and OpenADR protocols. However, some of these functions did not always behave exactly as expected. For example, one inverter restarted each time the volt-watt mode was reconfigured. The second inverter demonstrated a limited number of test cases, mostly due to the issues associated with the internal mapping of the SunSpec Modbus Protocol which led to Modbus error messages observed and no change to the inverter settings during testing. Therefore, several inverter limitations were observed and documented in this report regarding the interoperability with the two communication systems.
Page 7 of 37
2.0 LABORATORY TEST ENVIRONMENT This section describes the details of the laboratory test environment including the communication system architecture demonstrated as well as the electrical setup of the smart inverter test bed.
2.1 Autogrid System The Autogrid Demand Response Optimization and Management System (DROMS) is a cloud-based demand response (DR) and distributed energy resources (DER) management system. It provides a browser based portal for an operator to schedule DR and DER events and view and download data. Additionally, it is used to register the OpenADR 2.0 and IEEE 2030.5 clients.
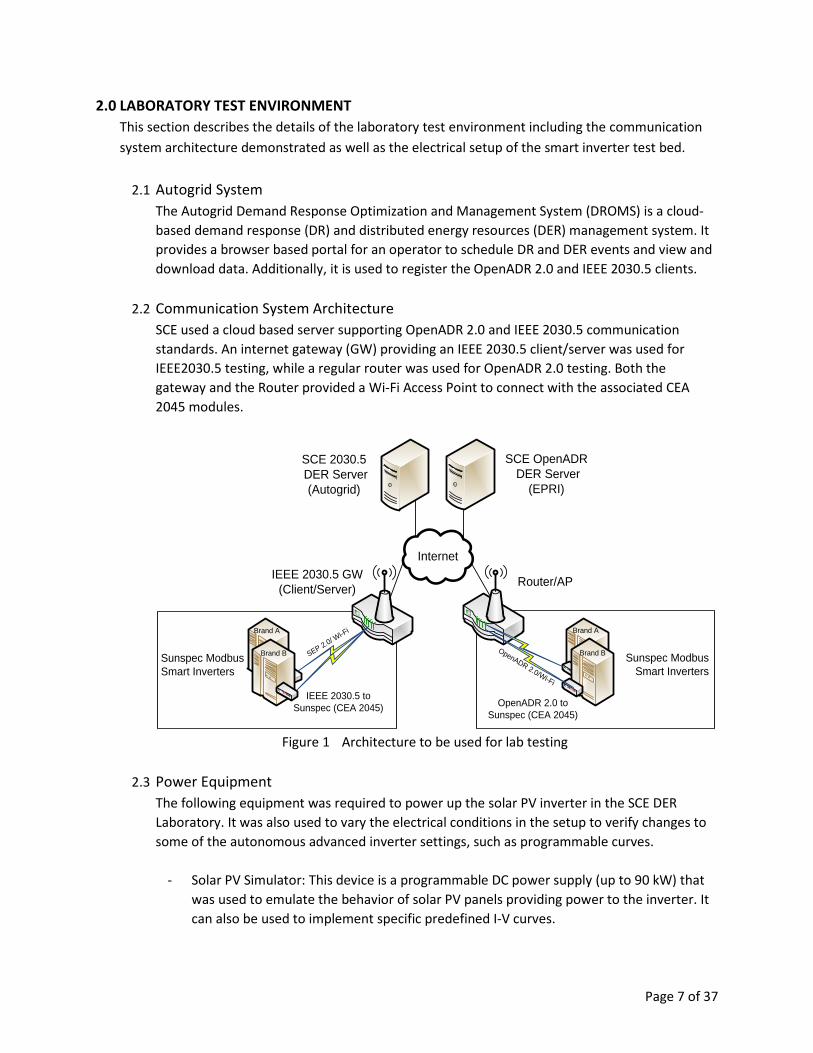
2.2 Communication System Architecture SCE used a cloud based server supporting OpenADR 2.0 and IEEE 2030.5 communication standards. An internet gateway (GW) providing an IEEE 2030.5 client/server was used for IEEE2030.5 testing, while a regular router was used for OpenADR 2.0 testing. Both the gateway and the Router provided a Wi-Fi Access Point to connect with the associated CEA 2045 modules.
Figure 1 Architecture to be used for lab testing
2.3 Power Equipment
The following equipment was required to power up the solar PV inverter in the SCE DER Laboratory. It was also used to vary the electrical conditions in the setup to verify changes to some of the autonomous advanced inverter settings, such as programmable curves.
- Solar PV Simulator: This device is a programmable DC power supply (up to 90 kW) that
was used to emulate the behavior of solar PV panels providing power to the inverter. It can also be used to implement specific predefined I-V curves.
Sunspec ModbusSmart Inverters
SCE OpenADR DER Server
(EPRI)
IEEE 2030.5 GW(Client/Server)
SCE 2030.5 DER Server
(Autogrid)
Internet
IEEE 2030.5 to Sunspec (CEA 2045)
SEP 2.0/ Wi-FiBrand A
Brand B Sunspec ModbusSmart Inverters
OpenADR 2.0 to Sunspec (CEA 2045)
Brand A
Brand B
Router/AP
OpenADR 2.0/Wi-Fi
Page 8 of 37
- Grid Simulator: This device is a programmable AC power supply (up to 90 kVA) that provided the nominal grid voltage (240 V) and frequency (60 Hz) at the inverter output terminals. This voltage and frequency can be modified to assess the inverter programmable curves.
- Load Bank: This is an adjustable load that can be modified using a series of multiple resistive and inductive impedances.
- Digital Oscilloscope: This device was used along with multiple voltage probes and current transformers (CT) to record raw electrical data at a high sampling rate.
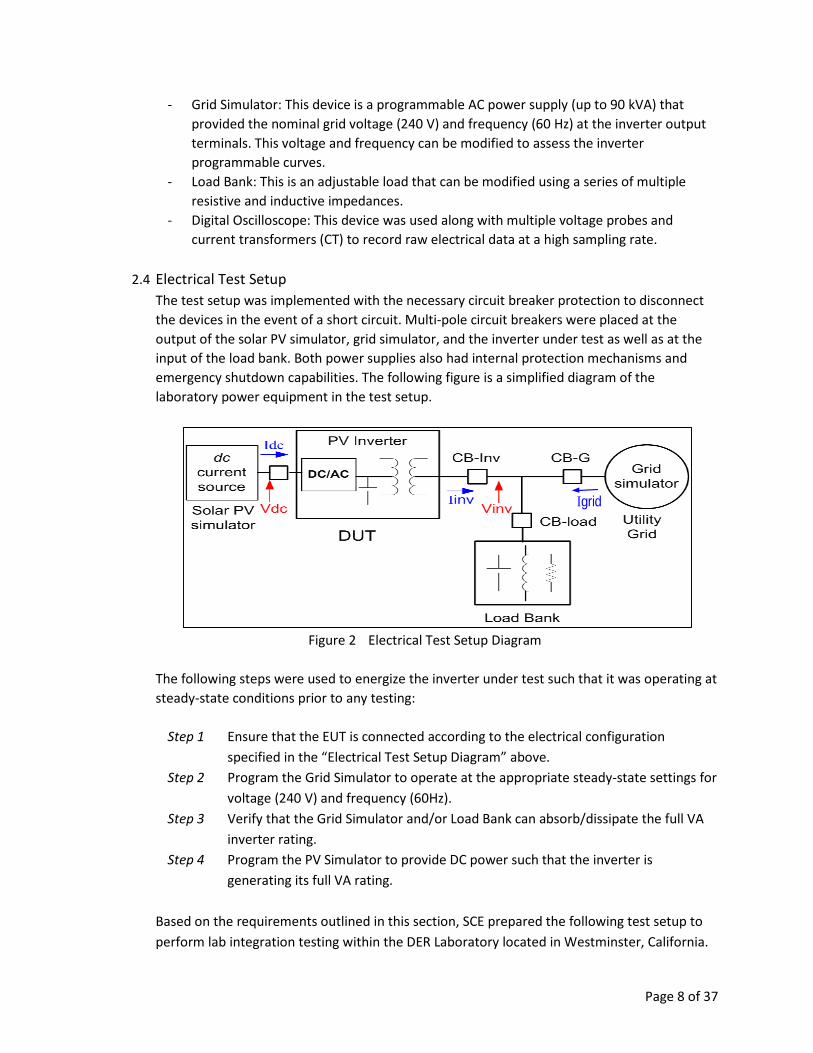
2.4 Electrical Test Setup The test setup was implemented with the necessary circuit breaker protection to disconnect the devices in the event of a short circuit. Multi-pole circuit breakers were placed at the output of the solar PV simulator, grid simulator, and the inverter under test as well as at the input of the load bank. Both power supplies also had internal protection mechanisms and emergency shutdown capabilities. The following figure is a simplified diagram of the laboratory power equipment in the test setup.
Figure 2 Electrical Test Setup Diagram
The following steps were used to energize the inverter under test such that it was operating at steady-state conditions prior to any testing:
Step 1 Ensure that the EUT is connected according to the electrical configuration specified in the “Electrical Test Setup Diagram” above.
Step 2 Program the Grid Simulator to operate at the appropriate steady-state settings for voltage (240 V) and frequency (60Hz).
Step 3 Verify that the Grid Simulator and/or Load Bank can absorb/dissipate the full VA inverter rating.
Step 4 Program the PV Simulator to provide DC power such that the inverter is generating its full VA rating.
Based on the requirements outlined in this section, SCE prepared the following test setup to perform lab integration testing within the DER Laboratory located in Westminster, California.
Igrid

Page 9 of 37
Figure 3 SCE DER Laboratory Setup – Inverters & Communication Modules
Figure 4 SCE DER Laboratory Setup – Power Supplies & Loads
PV Simulator Connection Grid Simulator / Load
Connection
SMA Inverter
Fronius Inverter
CEA 2045 Modules & Interface Boxes
Grid Simulator
PV Simulator
Load Bank Controls

Page 10 of 37
2.5 Inverter Measurements
While performing lab testing, voltages and currents were measured at several locations in the setup to verify that the inverter behaved as expected. The assigned channels of the digital oscilloscope captured the electrical data shown in the following table. All synchronized measurements may be recorded for post-processing and analysis. Post-processing included calculating real power, reactive power, power factor, frequency, and any other values required to evaluate the performance of the advanced inverters.
Tag ID Description Scope Ch. V1 VINV-L1 Inverter AC Voltage – Line 1 1 I1 IINV-L1 Inverter AC Current – Line 1 2 V2 VINV-L2 Inverter AC Voltage – Line 2 3 I2 IINV-L2 Inverter AC Current – Line 2 4 V3 VDC Inverter DC Voltage 7 I3 IDC Inverter DC Current 8 V4 VGRID-L1 Grid Simulator Voltage – Line 1 9 I4 IGRID-L1 Grid Simulator Current – Line 1 10 V5 VGRID-L2 Grid Simulator Voltage – Line 2 11 I5 IGRID-L2 Grid Simulator Current – Line 2 12
Table 2 Measurements for Split-Phase Inverter Setup
2.6 Personnel Safety All personnel (SCE and contractors) testing the inverter were required to use personal protection equipment (PPE) at all times including, but not limited to eye protection. All personnel were required to adhere to California Occupational Safety and Health Administration (OSHA) regulations. Additionally, SCE employees were required to review and understand all safety documentation that applies to this testing including the Equipment Safety Operating Procedure documentation, the Distributed Energy Resource Lab’s safety manual, and SCE’s Accident Prevent Manual before starting this work.

Page 11 of 37
3.0 TEST CASES AND PROCEDURES The following sections describe the plan for the laboratory testing to be performed at SCE’s Advanced Technology Labs to support this project. The smart inverter functionality that will be demonstrated during lab testing and the procedures that will be used to perform this testing are outlined in the following sections. Information such as the inverter model, firmware version, communication module model (if applicable), etc. shall be captured prior to implementing any of the following test procedures. Many of the inverter use cases described have been taken from the SIWG recommendations detailed in the Recommendations for Updating the Technical Requirements for Inverters in Distributed Energy Resources document1 submitted to CPUC. Additionally several of the inverter features described in the functional requirements sections are referenced from EPRI’s Common Functions for Smart Inverters report2.
3.1 Registration Summary: Registration encompasses all communications set up procedures and is a pre-condition for the remainder of the test cases. Registration comprises the registration of devices on servers, automated server and resource discovery processes, network commissioning, and provisioning of server information on clients (IP Addresses, URLs, program information, etc.). The purpose of this test case is to ensure interoperability of various technologies, architectures, and standards, and is fundamental to meeting the objectives of the CSI4 project. Requirements: Autogrid DROMS- The DROMS shall support a standardized IEEE 2030.5 server and OpenADR 2.0b Virtual Top Node (VTN) that includes required security by each. Autogrid shall also provide a portal with the following operator3 capabilities:
- Registration of OpenADR 2.0b Virtual End Nodes (VENs) via VEN IDs and IEEE 2030.5 Clients (GW or Module SFDI or LFDI)
- Creation of OpenADR 2.0b and IEEE 2030.5 programs - Assignment of VENs and Clients to programs - Collection and dissemination of power measurement data
1 Recommendations for Updating the Technical Requirements for Inverters in Distributed Energy Resources. Smart Inverter Working Group, January 2014. 2 Common Functions for Smart Inverter, Version 3. EPRI, Palo Alto, CA: 2013. 3002002233 3 Much of the Autogrid server setup functions are not accessible to users and need to be completed by Autogrid. Instructions on the use of these capabilities will be provided by Autogrid and verification/acceptance testing of interoperability are not in scope of this test plan. A separate report will be provided.

Page 12 of 37
- Ability to schedule OpenADR 2.0b and IEEE 2030.5 events with the appropriate parameters detailed the remaining test cases
IEEE 2030.5 Gateway- The gateway shall be a 2030.5 client for WAN (Ethernet/internet) communications and an IEEE 2030.5 Server for LAN (Wi-Fi) communications. It shall have the following capabilities:
- Web Server that at a minimum includes typical router interface for network management, input of IEEE 2030.5 server IPv4 address, and input of IEEE 2030.5 client SFDI (client registration) or other registration details
- IEEE 2030.5 IPv6 xmDNS discovery capabilities for IEEEE 2030.5 clients - Broadcast of IEEE 2030.5 Autogrid (based on poll) events to all registered clients and
posting of power measurement data to server - Standard IEEE2030.5 security
IEEE 2030.5 CEA Module- The module shall be either a standard IEEE 2030.5 DER client or OpenADR 2.0b VEN. It shall have the following capabilities:
- Support for IEEE 2030.5 IPv6 xmDNS discovery, registration, and security - Be able to join GW or Router based Wi-Fi network - Ability to convert from IEEE 2030.5 or OpenADR 2.0b messages to Sunspec ModBus - Conform to CEA 2045 AC module requirements - Interface to allow input of VTN URL and Market Context
Procedure: Pre-Conditions
- Electrical Test Set-Up - Programs
Server Set-up
Step 1 Access the IEEE 2030.5 Server and DROMS and enroll desired participants by completing the Autogrid defined enrollment process for devices (e.g., enter VEN ID, SFDI, LFDI, Function Set Assignment, etc.).
Step 2 Create the desired program, or choose it if already created, and enroll the desired participants via the Autogrid defined process.
IEEE2030.5 Gateway Set-up
Step 3 Plug in WAN Ethernet port to router’s LAN port using standard CAT-5e or above cable. Ensure GW internet availability (this could be done on router or GW).
Step 4 Access GW web interface and enter device LFDI or SFDI. Step 5 On web interface, enter IEEE 2030.5 server URL or IPv4 address and other desired
information (e.g., security settings, polling rate, etc.).

Page 13 of 37
CEA Module Set-Up4 Step 6 Plug in module into port on Inverter communications box. Access module
interface and join correct Wi-Fi network (either GW network for IEEE 2030.5 module or Router Wi-Fi network for OpenADR 2.0 module).
a. If IEEE 2030.5 module, check GW interface to ensure device is joined both Wi-Fi and IEEE 2030.5 network (should be completed automatically).
b. If OpenADR 2.0 module, check router to ensure device is joined Wi-Fi network.
Step 7 For OpenADR 2.0 module, enter in DROMS URL and Market Context and set polling frequency.
3.2 Volt-VAR Mode with Watt Priority Use Case Summary: Dynamic volt-var operations allow DER systems to counteract voltage deviations from the nominal voltage level (but still within normal operating ranges) by consuming or producing reactive power. Dynamic volt-var curves can specify the changes in vars in response to changes in the local voltage measured at the inverter terminals. The amount of reactive power can be established by a curve defining voltage versus percentage of reactive power. Percentage of reactive power can be calculated as
- Percentage of available reactive power. This indicates the consumption or production of reactive power that does not affect the real power output. (Volt-Var with Watt Priority)
- Percentage of maximum reactive power. This is where the consumption or production of reactive power may affect the real power output. (Volt-Var with Var Priority)
The purpose of volt-var operations is to use DER systems to help maintain voltage levels within their normal ranges. This capability can be particularly important for DER systems (and aggregations of DER systems) that may impact the normal voltage range on a feeder, such as those at the end of long, electrically “weak” circuits. However, dynamic volt-var operations could be used for other purposes such as helping to maintain conservation voltage reduction (CVR) levels. Functional Requirements: The inverters tested shall support curves using percentage of available reactive power (Volt-Var with Watt Priority). The custom curves shall be programmable from the headend system and the inverters shall be able to accept and act on an array of points set per the Sunspec standard. The inverters shall support volt-var curves with a minimum of 4 points. It is assumed
4 This process assumes modules provide interfaces to enter in network and server credentials and are not hard encoded with them
Page 14 of 37
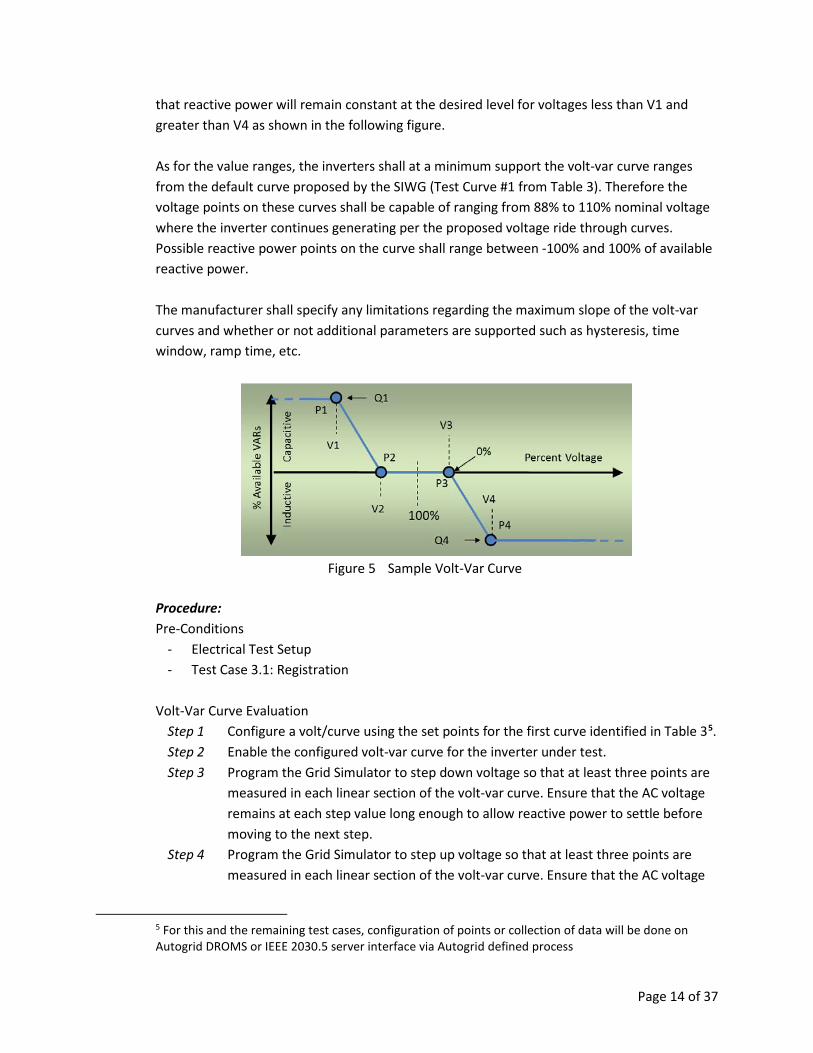
that reactive power will remain constant at the desired level for voltages less than V1 and greater than V4 as shown in the following figure. As for the value ranges, the inverters shall at a minimum support the volt-var curve ranges from the default curve proposed by the SIWG (Test Curve #1 from Table 3). Therefore the voltage points on these curves shall be capable of ranging from 88% to 110% nominal voltage where the inverter continues generating per the proposed voltage ride through curves. Possible reactive power points on the curve shall range between -100% and 100% of available reactive power. The manufacturer shall specify any limitations regarding the maximum slope of the volt-var curves and whether or not additional parameters are supported such as hysteresis, time window, ramp time, etc.
Figure 5 Sample Volt-Var Curve
Procedure: Pre-Conditions
- Electrical Test Setup - Test Case 3.1: Registration
Volt-Var Curve Evaluation Step 1 Configure a volt/curve using the set points for the first curve identified in Table 35. Step 2 Enable the configured volt-var curve for the inverter under test. Step 3 Program the Grid Simulator to step down voltage so that at least three points are
measured in each linear section of the volt-var curve. Ensure that the AC voltage remains at each step value long enough to allow reactive power to settle before moving to the next step.
Step 4 Program the Grid Simulator to step up voltage so that at least three points are measured in each linear section of the volt-var curve. Ensure that the AC voltage
5 For this and the remaining test cases, configuration of points or collection of data will be done on Autogrid DROMS or IEEE 2030.5 server interface via Autogrid defined process
Page 15 of 37
remains at each step value long enough to allow reactive power to settle before moving to the next step.
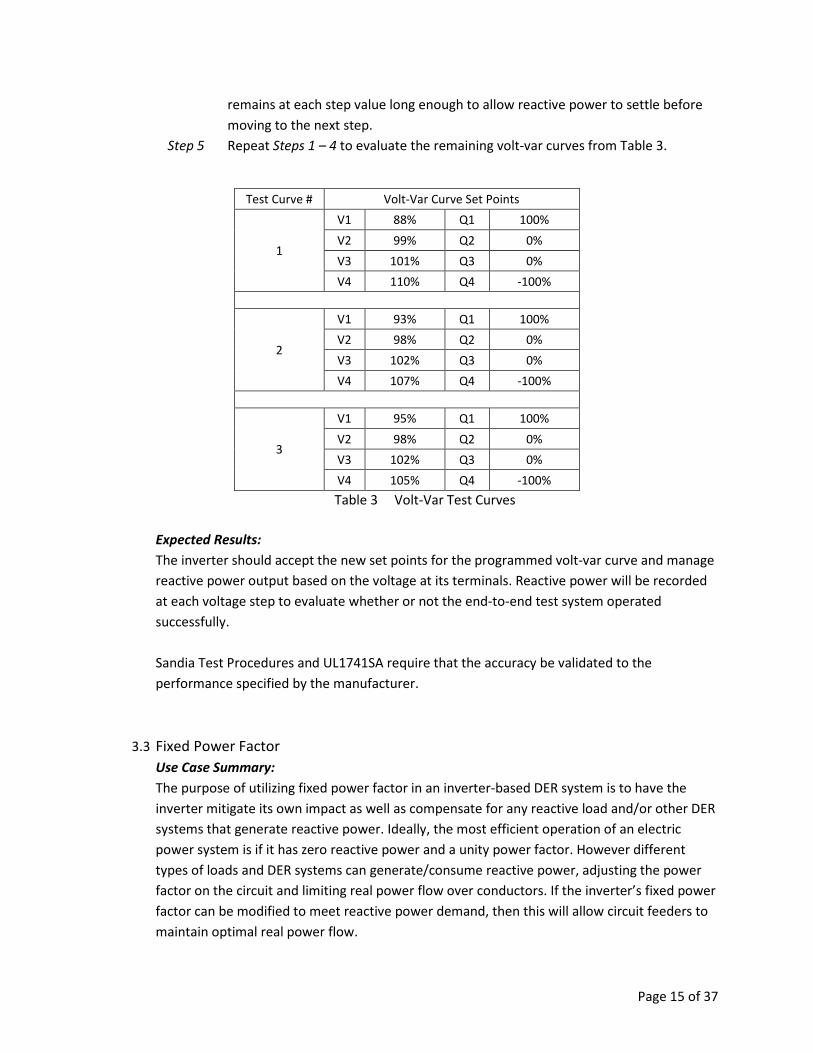
Step 5 Repeat Steps 1 – 4 to evaluate the remaining volt-var curves from Table 3.
Test Curve # Volt-Var Curve Set Points
1
V1 88% Q1 100% V2 99% Q2 0% V3 101% Q3 0% V4 110% Q4 -100%
2
V1 93% Q1 100% V2 98% Q2 0% V3 102% Q3 0% V4 107% Q4 -100%
3
V1 95% Q1 100% V2 98% Q2 0% V3 102% Q3 0% V4 105% Q4 -100% Table 3 Volt-Var Test Curves
Expected Results: The inverter should accept the new set points for the programmed volt-var curve and manage reactive power output based on the voltage at its terminals. Reactive power will be recorded at each voltage step to evaluate whether or not the end-to-end test system operated successfully. Sandia Test Procedures and UL1741SA require that the accuracy be validated to the performance specified by the manufacturer.
3.3 Fixed Power Factor Use Case Summary: The purpose of utilizing fixed power factor in an inverter-based DER system is to have the inverter mitigate its own impact as well as compensate for any reactive load and/or other DER systems that generate reactive power. Ideally, the most efficient operation of an electric power system is if it has zero reactive power and a unity power factor. However different types of loads and DER systems can generate/consume reactive power, adjusting the power factor on the circuit and limiting real power flow over conductors. If the inverter’s fixed power factor can be modified to meet reactive power demand, then this will allow circuit feeders to maintain optimal real power flow.
Page 16 of 37
Functional Requirements: Fixed power factor values shall be programmable from the headend system and the inverters shall be able to accept and act on this programmed setting while operating at 20% to 100% of its rated power output. The inverters shall support any fixed power factor values in the range of + 0.9 PF. Procedure: Pre-Conditions
- Electrical Test Setup - Test Case 3.1: Registration
Fixed Power Factor Evaluation
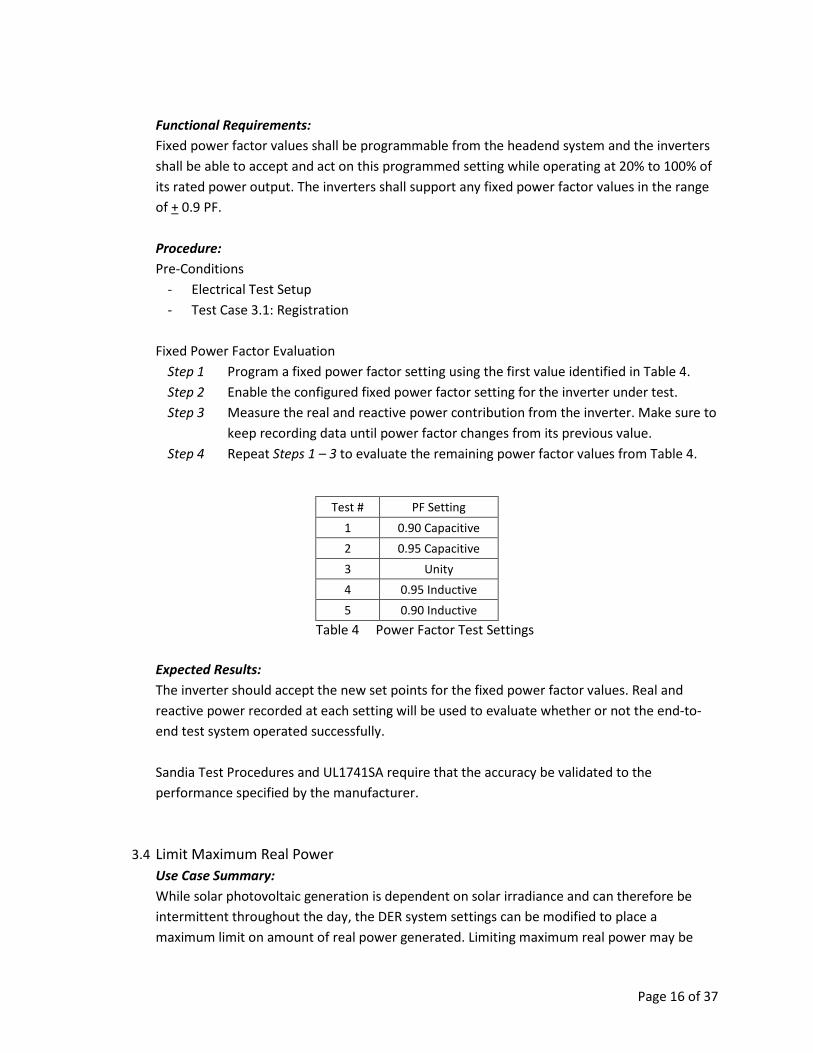
Step 1 Program a fixed power factor setting using the first value identified in Table 4. Step 2 Enable the configured fixed power factor setting for the inverter under test. Step 3 Measure the real and reactive power contribution from the inverter. Make sure to
keep recording data until power factor changes from its previous value. Step 4 Repeat Steps 1 – 3 to evaluate the remaining power factor values from Table 4.
Test # PF Setting 1 0.90 Capacitive 2 0.95 Capacitive 3 Unity 4 0.95 Inductive 5 0.90 Inductive
Table 4 Power Factor Test Settings
Expected Results: The inverter should accept the new set points for the fixed power factor values. Real and reactive power recorded at each setting will be used to evaluate whether or not the end-to-end test system operated successfully. Sandia Test Procedures and UL1741SA require that the accuracy be validated to the performance specified by the manufacturer.
3.4 Limit Maximum Real Power Use Case Summary: While solar photovoltaic generation is dependent on solar irradiance and can therefore be intermittent throughout the day, the DER system settings can be modified to place a maximum limit on amount of real power generated. Limiting maximum real power may be

Page 17 of 37
necessary in response to unusual or emergency conditions that are causing reverse flow into the feeder’s substation or because the total DER real power output on the feeder is greater than some percentage of total load, which can potentially result in higher voltages on the distribution feeder. Functional Requirements: Maximum real power output limits shall be programmable from the headend system and the inverters shall be able to accept and act on this programmed setting. The inverters shall support values from full power (100%) down to the near shutdown level (e.g. 10%). Procedure: Pre-Conditions
- Electrical Test Setup - Test Case 3.1: Registration
Limited Maximum Real Power Evaluation Step 1 Program a maximum real power limit using the first value identified in Table 5. Step 2 Enable the configured maximum real power limit for the inverter under test. Step 3 Measure the real power contribution from the inverter. Make sure to keep
recording data until maximum limit value changes from its previous value. Step 4 Repeat Steps 1 – 3 to evaluate the remaining limit settings from Table 5.
Test # Maximum Real Power Limit 1 100% 2 80% 3 60% 4 40% 5 20%
Table 5 Maximum Real Power Test Settings
Expected Results: The inverter should accept the new settings for the maximum real power limit. Real power recorded during each setting will be used to evaluate whether or not the end-to-end test system operated successfully. Sandia Test Procedures and UL1741SA require that the accuracy be validated to the performance specified by the manufacturer.
3.5 Voltage-Watt Mode Use Case Summary:

Page 18 of 37
The DER system autonomously limits real power output as a function of voltage at the inverter output. Whereas the previous function provided the inverter with only a single % power limit value (determined by the remote host), this function allows the inverter to curtail its own output as local voltage rises. The purpose of voltage-watt operations is to use DER systems to help maintain voltage levels within their normal ranges as an alternative to emergency tripping in cases where an abundance of generation is resulting in higher voltages on the feeder. These higher voltages could be the result of reverse power flow on small conductors. The inverter would follow a voltage-watt curve that would specify the maximum real power output in response to the measured voltage at the inverter terminals. Functional Requirements: Custom volt-watt curves shall be programmable from the headend system and the inverters shall be able to accept and act on an array of points set per the Sunspec standard. The inverters shall support volt-watt curves with a minimum of 4 points. The real power limit is assumed to remain constant at the desired level for voltages less than V1 and greater than V4 as shown in the following figure. The voltage points on these curves shall be capable of ranging from 88% to 120% nominal voltage where the inverter continues generating or trips over a specified period of time per the proposed voltage ride through curves. Real power points on the curve shall range between 0% and 100% of the maximum watt output. The manufacturer shall specify any limitations regarding the maximum slope of the volt-watt curve and whether or not additional parameters are supported such as hysteresis, time window, ramp time, etc.
Figure 6 Sample Volt-Watt Curve
Procedure: Pre-Conditions
- Electrical Test Setup - Test Case 3.1: Registration

Page 19 of 37
Volt-Watt Curve Evaluation Step 1 Configure a volt-watt curve using the set points for the first curve in Table 6. Step 2 Enable the configured volt-watt curve for the inverter under test. Step 3 Program the Grid Simulator to step up voltage so that at least three points are
measured in each linear section of the volt-watt curve. Ensure that the real power settles before moving to the next voltage step.
Step 4 Repeat Steps 1 – 3 to evaluate the next volt-watt curve from Table 6.
Curve # Volt-Watt Curve Set Points
1
V1 90% P1 100% V2 106% P2 100% V3 110% P3 0% V4 120% P4 0%
2
V1 90% P1 100% V2 108% P2 100% V3 110% P3 0% V4 120% P4 0% Table 6 Volt-Watt Test Curves
Expected Results: The inverter should accept the new set points for the programmed volt-watt curve and reduce real power output based on the voltage at its terminals. Real power will be recorded at each voltage step to evaluate whether or not the end-to-end test system operated successfully. Sandia Test Procedures and UL1741SA require that the accuracy be validated to the performance specified by the manufacturer.
3.6 Frequency-Watt Mode Use Case Summary: The DER system autonomously modifies real power output to counter frequency deviations. This action may be taken during emergency conditions or during normal operations to smooth minor frequency variations. The inverter’s maximum output (ceiling) would be limited by a frequency-watt curve that would specify the maximum real power output in response to the measured frequency at the inverter terminals. Functional Requirements: Custom frequency-watt curves shall be programmable from the headend system and the inverters shall be able to accept and act on an array of points set per the Sunspec standard. The inverters shall support frequency-watt curves with a minimum of 4 points. The real power
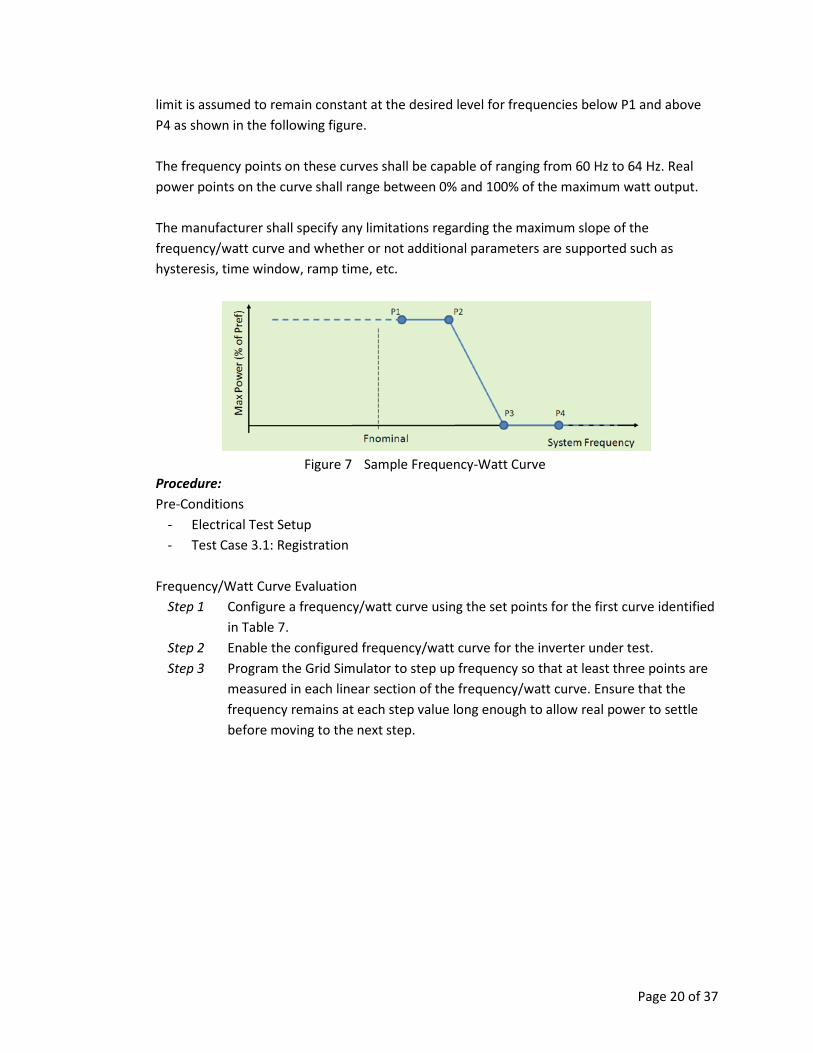
Page 20 of 37
limit is assumed to remain constant at the desired level for frequencies below P1 and above P4 as shown in the following figure. The frequency points on these curves shall be capable of ranging from 60 Hz to 64 Hz. Real power points on the curve shall range between 0% and 100% of the maximum watt output. The manufacturer shall specify any limitations regarding the maximum slope of the frequency/watt curve and whether or not additional parameters are supported such as hysteresis, time window, ramp time, etc.
Figure 7 Sample Frequency-Watt Curve
Procedure: Pre-Conditions
- Electrical Test Setup - Test Case 3.1: Registration
Frequency/Watt Curve Evaluation
Step 1 Configure a frequency/watt curve using the set points for the first curve identified in Table 7.
Step 2 Enable the configured frequency/watt curve for the inverter under test. Step 3 Program the Grid Simulator to step up frequency so that at least three points are
measured in each linear section of the frequency/watt curve. Ensure that the frequency remains at each step value long enough to allow real power to settle before moving to the next step.
Page 21 of 37
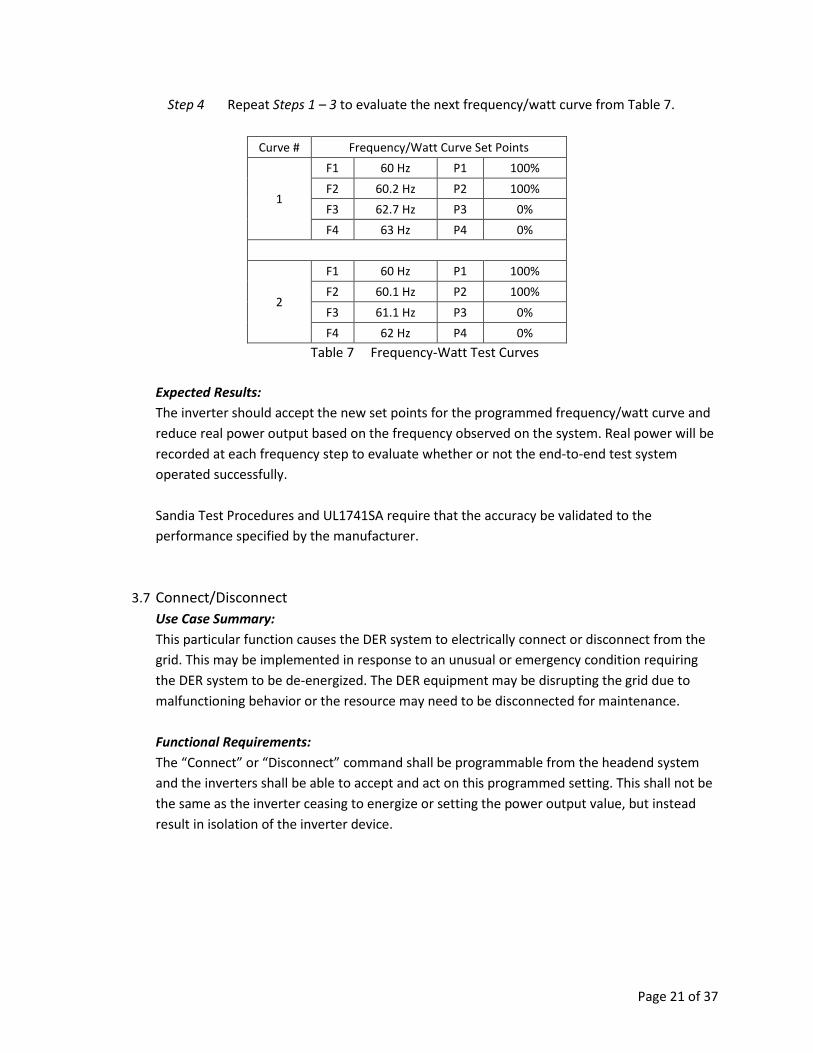
Step 4 Repeat Steps 1 – 3 to evaluate the next frequency/watt curve from Table 7.
Curve # Frequency/Watt Curve Set Points
1
F1 60 Hz P1 100% F2 60.2 Hz P2 100% F3 62.7 Hz P3 0% F4 63 Hz P4 0%
2
F1 60 Hz P1 100% F2 60.1 Hz P2 100% F3 61.1 Hz P3 0% F4 62 Hz P4 0%
Table 7 Frequency-Watt Test Curves Expected Results: The inverter should accept the new set points for the programmed frequency/watt curve and reduce real power output based on the frequency observed on the system. Real power will be recorded at each frequency step to evaluate whether or not the end-to-end test system operated successfully. Sandia Test Procedures and UL1741SA require that the accuracy be validated to the performance specified by the manufacturer.
3.7 Connect/Disconnect Use Case Summary: This particular function causes the DER system to electrically connect or disconnect from the grid. This may be implemented in response to an unusual or emergency condition requiring the DER system to be de-energized. The DER equipment may be disrupting the grid due to malfunctioning behavior or the resource may need to be disconnected for maintenance. Functional Requirements: The “Connect” or “Disconnect” command shall be programmable from the headend system and the inverters shall be able to accept and act on this programmed setting. This shall not be the same as the inverter ceasing to energize or setting the power output value, but instead result in isolation of the inverter device.

Page 22 of 37
Procedure: Pre-Conditions
- Electrical Test Setup - Test Case 3.1: Registration
Connect/Disconnect Evaluation
Step 1 Enable the “Disconnect” command from the headend system Step 2 Continue measuring the output of the inverter until it receives the command and
stops generating. Step 3 Wait at least 5 minutes to ensure that the inverter remains disconnected. Step 4 Repeat Steps 1 – 2 but instead using the “Connect” command and verifying that
the inverter begins generating again. The inverter should return to the same operating mode from before upon reconnecting to the test setup.
Expected Results: The inverter should accept the “Disconnect” command and respond accordingly by isolating from the test setup and shutting down. Likewise, the inverter should accept the “Connect” command and respond accordingly by reconnecting to the test setup and begin generating once again. Sandia Test Procedures and UL1741SA require that the accuracy be validated to the performance specified by the manufacturer.
3.8 Monitor DER Status and Output Use Case Summary: DER systems connected to the utility distribution system will be required to have monitoring capabilities that provide operational state data. This may include the system status (i.e. connected/disconnected) as well as various power system measurements (watts, vars, voltage, etc.). Functional Requirements: The IEEE 2030.5 and OpenADR 2.0 devices and servers shall be able to collect, communicate, and provide output information, including Hz, A, V, W, VA, Var, and PF at 2 minute intervals. Procedure: Pre-Conditions
- Electrical Test Setup - Test Case 3.1: Registration

Page 23 of 37
Collect DER Status Step 1 Access the IEEE 2030.5 Server or OpenADR 2.0 server and choose the correct
program. Step 2 Choose the date(s) desired and download or view data. Step 3 Compare to data collected via local instrumentation.
Expected Results: The collected data should match the data collected locally.

Page 24 of 37
4.0 LABORATORY TEST RESULTS The following sections describe the results of the laboratory testing performed at SCE’s Advanced Technology Labs demonstrating two separate headend communication systems and using inverters from two different manufacturers. Information such as the inverter model, firmware version, communication module model, etc. is shown in the table below. As a precursor to the SCE lab testing, Kitu Systems performed communications testing without an energized inverter setup to verify the performance of their SEP 2.0 / IEEE 2030.5 communication modules. The results from Kitu Systems’ testing informed lab testing at SCE.
Fronius Inverter SMA Inverter Hardware Version IG+V6.0U SB5000TL-US-22 Software Version 6.2.28 40050949
Option 2.1.21 9201 Device Address 1 126
SEP 2.0 Comm Module KITU CEA-7010
SFDI: 624-739-873-047
KITU CEA-7010 SFDI: 624-739-873-
047
OpenADR Comm Module EPRI
HW: PiZ16.01.26 FW: PiZ16.02.03
EPRI HW: PiZ16.01.26
FW: TBD Table 8 Inverter & Communication Module Specifications
Test Case Fronius Inverter SMA Inverter
SunSpec (Modbus)
AutoGrid (2030.5)
EPRI VTN (OpenADR)
SunSpec (Modbus)
AutoGrid (2030.5)
EPRI VTN (OpenADR)
Volt-VAR Mode
Fixed Power Factor
Limit Max. Real Power
Volt-Watt Mode
Freq-Watt Mode
Connect/Disconnect
Monitor DER
Table 9 Laboratory Interoperability Test Results Summary
4.1 Registration Summary: OpenADR and SEP 2.0 / IEEE 2030.5 systems, including communications modules, DER servers, routers, and gateways, were pre-provisioned by Kitu and EPRI prior to delivery to SCE. Thus, registration, including discovery and enrollment using specific protocol-defined processes, was not evaluated in detail during lab testing procedures. One issue observed during testing was

Page 25 of 37
the connectivity between the communication module and EPRI VTN which was later corrected by changing the default inverter baud rate to 19200.
4.2 Volt-VAR Mode with Watt Priority Summary: Although the intention was to test volt-var curves with watt priority (using percentage of available reactive power), neither inverter supported this particular volt-var mode. Instead the inverters acted in a var priority mode (using the maximum amount of vars possible). The following table summarizes the results of the various volt-var tests:
Volt-VAR Fronius Inverter SMA Inverter
SunSpec (Modbus)
AutoGrid (2030.5)
EPRI VTN (OpenADR)
SunSpec (Modbus)
AutoGrid (2030.5)
EPRI VTN (OpenADR)
Curve #1
Curve #2
Curve #3
Table 10 Volt-VAR Communication Results Summary SunSpec Dashboard (Modbus): The Modbus register to enable this curve function (ModEna) as well as the array of volt-var points were proven to be writeable for both inverters using a direct connection to the SunSpec Dashboard tool. Autonomous volt-var functionality was therefore demonstrated after changing the registers by varying the grid simulator voltage as noted in the test procedure section of the report. Autogrid (2030.5 / SEP 2.0):
- Fronius inverter successfully demonstrated autonomous volt-var functionality with var priority after scheduling the DER event using the IEEE 2030.5 communication system.
- SMA inverter acknowledges the write of the volt-var curve values, but only updates the first voltage parameter. Therefore, the autonomous functionality was not enabled successfully.

Page 26 of 37
Figure 8 Sample Volt-VAR Under-Voltage Test (Fronius Inverter using Curve #1)
Figure 9 Sample Volt-VAR Over-Voltage Test (Fronius Inverter Curve #1)
EPRI VTN (OpenADR):
- Fronius inverter successfully demonstrated autonomous volt-var functionality with var priority after scheduling the DER event using the OpenADR test application.
- SMA inverter does not indicate that the scheduled DER event takes effect, and there is no change to the inverter’s Modbus registers.
Autonomous Functionality:

Page 27 of 37
Based on the electrical measurements captured during lab testing, both inverters demonstrated autonomous volt-var functionality that closely matched the programmed curve settings. However, there was a slight voltage offset between the measured and ideal values within 1.5% nominal voltage, likely due to the accuracy of the inverter’s internal metering. While the Fronius inverter references the maximum var parameter as the base for the reactive power percentage, the SMA inverter uses the maximum watt (Pmax) value instead resulting in the plateaus observed at 50% in one of the figures below.
Figure 10 Volt-VAR Accuracy (Fronius Inverter using Curve #1)
Figure 11 Volt-VAR Accuracy (SMA Inverter using Curve #1)
4.3 Fixed Power Factor Function
Page 28 of 37
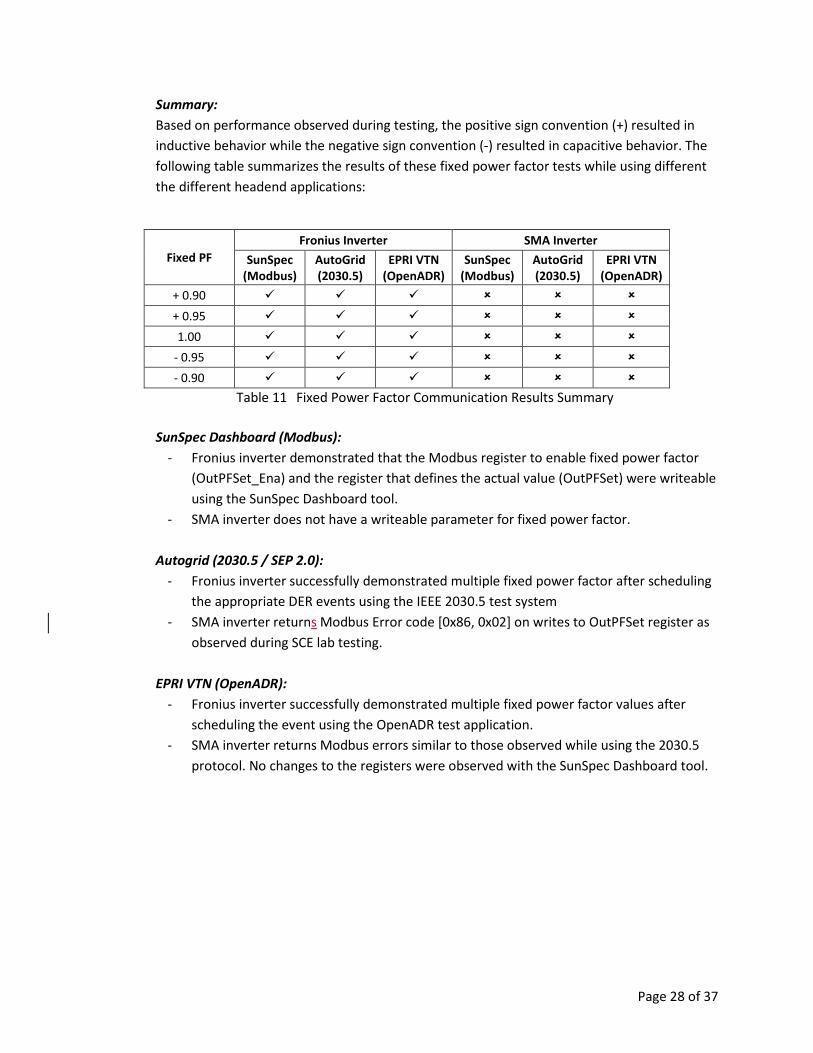
Summary: Based on performance observed during testing, the positive sign convention (+) resulted in inductive behavior while the negative sign convention (-) resulted in capacitive behavior. The following table summarizes the results of these fixed power factor tests while using different the different headend applications:
Fixed PF Fronius Inverter SMA Inverter
SunSpec (Modbus)
AutoGrid (2030.5)
EPRI VTN (OpenADR)
SunSpec (Modbus)
AutoGrid (2030.5)
EPRI VTN (OpenADR)
+ 0.90
+ 0.95
1.00
- 0.95
- 0.90
Table 11 Fixed Power Factor Communication Results Summary SunSpec Dashboard (Modbus):
- Fronius inverter demonstrated that the Modbus register to enable fixed power factor (OutPFSet_Ena) and the register that defines the actual value (OutPFSet) were writeable using the SunSpec Dashboard tool.
- SMA inverter does not have a writeable parameter for fixed power factor. Autogrid (2030.5 / SEP 2.0):
- Fronius inverter successfully demonstrated multiple fixed power factor after scheduling the appropriate DER events using the IEEE 2030.5 test system
- SMA inverter returns Modbus Error code [0x86, 0x02] on writes to OutPFSet register as observed during SCE lab testing.
EPRI VTN (OpenADR):
- Fronius inverter successfully demonstrated multiple fixed power factor values after scheduling the event using the OpenADR test application.
- SMA inverter returns Modbus errors similar to those observed while using the 2030.5 protocol. No changes to the registers were observed with the SunSpec Dashboard tool.

Page 29 of 37
Figure 12 Sample Fixed PF Test (Fronius Inverter at +0.95)
Figure 13 Sample Fixed PF Test (Fronius Inverter at -0.95)
Functionality: The successful fixed power factor tests reverted back to their original setting (unity power factor) after the scheduled DER event had been completed. The measured fixed power factor values for the Fronius inverter were within 1% of the programmed settings as shown in the following table. Measured values for the SMA inverter at different power factor levels were not available.

Page 30 of 37
Fixed PF Setting Fronius PF Measured Values SMA Measured PF Values + 0.90 + 0.892 N/A + 0.95 + 0.945 N/A + 1.00 + 1.000 N/A - 0.95 - 0.955 N/A - 0.90 - 0.905 N/A
Table 12 Fixed Power Factor Functionality Results Summary
4.4 Limit Maximum Real Power Function Summary: The Maximum Power Limit function is based on the WMaxLimPct(%) register. This is a writeable register as a percentage, 0-100% of the inverters nameplate rating Wmax. It was noted during testing of one product that power output could also be affected by changing the nameplate value itself, but this is not the intended use of this register. The following table summarizes whether or not the limiting maximum real power was achieved using the function properly:
Limit Max. Real Power
Fronius Inverter SMA Inverter SunSpec
(Modbus) AutoGrid (2030.5)
EPRI VTN (OpenADR)
SunSpec (Modbus)
AutoGrid (2030.5)
EPRI VTN (OpenADR)
100%
80%
60%
40%
20%
Table 13 Limit Maximum Power Communication Results Summary SunSpec Dashboard (Modbus):
- SMA inverter is unable to write to the WMaxLim_Ena and the the WMaxLimPct is write only. Since the appropriate method of limiting maximum power is not available, this test was considered unsuccessful. However, it was noted that the nameplate WMax register could be changed to achieve similar functionality.
- Fronius’ inverter limited maximum real power using the appropriate Modbus registers. Autogrid (2030.5 / SEP 2.0):
- Fronius inverter did not limit maximum power when scheduling an event using the IEEE 2030.5 object opModFixedFlow. However the existing opModFixedW object was used to successfully implement this function for each of the proposed test values.

Page 31 of 37
- SMA inverter demonstrated limiting maximum real power output per the test procedure using either opModFixedFlow or opModFixedW IEEE 2030.5 object. However, this was achieved by changing the nameplate (Wmax) of the inverter in the SunSpec model.
EPRI VTN (OpenADR):
- Fronius inverter successfully demonstrated limiting maximum power output after scheduling the DER event using the OpenADR test application.
- SMA inverter did not respond to the scheduled event based on the power output measurements as well as the Modbus registers when using OpenADR.
Figure 14 Sample Limit Maximum Real Power Test (Fronius Inverter at 40%)
Functionality: The successful tests reverted back to their original setting (100% maximum power) after the scheduled DER event had been completed. Several tests revealed an immediate dip and recovery in power either at the beginning of an event or shortly afterwards as shown in the previous figure. This was observed to be the result of the coordination between the PV simulator and inverter maximum power point tracking. The measured maximum real power values were within 1.3% of the programmed settings when the tests were performed successfully as shown in the table below.

Page 32 of 37
Limit Maximum Power Setting
Fronius Measured Power Values (% Wmax)
SMA Measured Power Values (% Wmax)
achieved via changing Nameplate Wmax
100% 99.3% 98.9% 80% 79.5% 78.7% 60% 59.3% 59.1% 40% 39.8% 39.5% 20% 19.9% 19.8%
Table 14 Limit Maximum Power Functionality Results Summary
4.5 Volt-Watt Function Summary: The following table summarizes whether or not the autonomous volt-watt functionality could be enabled and updated using the different communication protocols and corresponding headend applications:
Volt-Watt Fronius Inverter SMA Inverter
SunSpec (Modbus)
AutoGrid (2030.5)
EPRI VTN (OpenADR)
SunSpec (Modbus)
AutoGrid (2030.5)
EPRI VTN (OpenADR)
Curve #1
Curve #2
Table 15 Volt-Watt Communication Results Summary SunSpec Dashboard (Modbus): The Modbus register to enable this function (ModEna) as well as the array of volt-watt points were proven to be writeable for both inverters using a direct connection to the inverters with the SunSpec Dashboard tool. Autonomous volt-watt functionality was therefore demonstrated for both inverters by varying the grid simulator voltage in the test setup. Autogrid (2030.5 / SEP 2.0):
- Fronius inverter only supported 3-point Volt-Watt curves as opposed to 4-point curves. After receiving the appropriate commands from the IEEE 2030.5 application, the inverter went into a “Sync” mode where it ceases to generate until the grid side conditions are appropriate for 5 minutes. However once it returns to normal operation, the inverter demonstrated autonomous volt-watt functionality.
- SMA inverter acknowledges the write of the volt-watt curve values, but only updates the first voltage parameter. Therefore, the autonomous volt-watt functionality test failed.
EPRI VTN (OpenADR):
Page 33 of 37
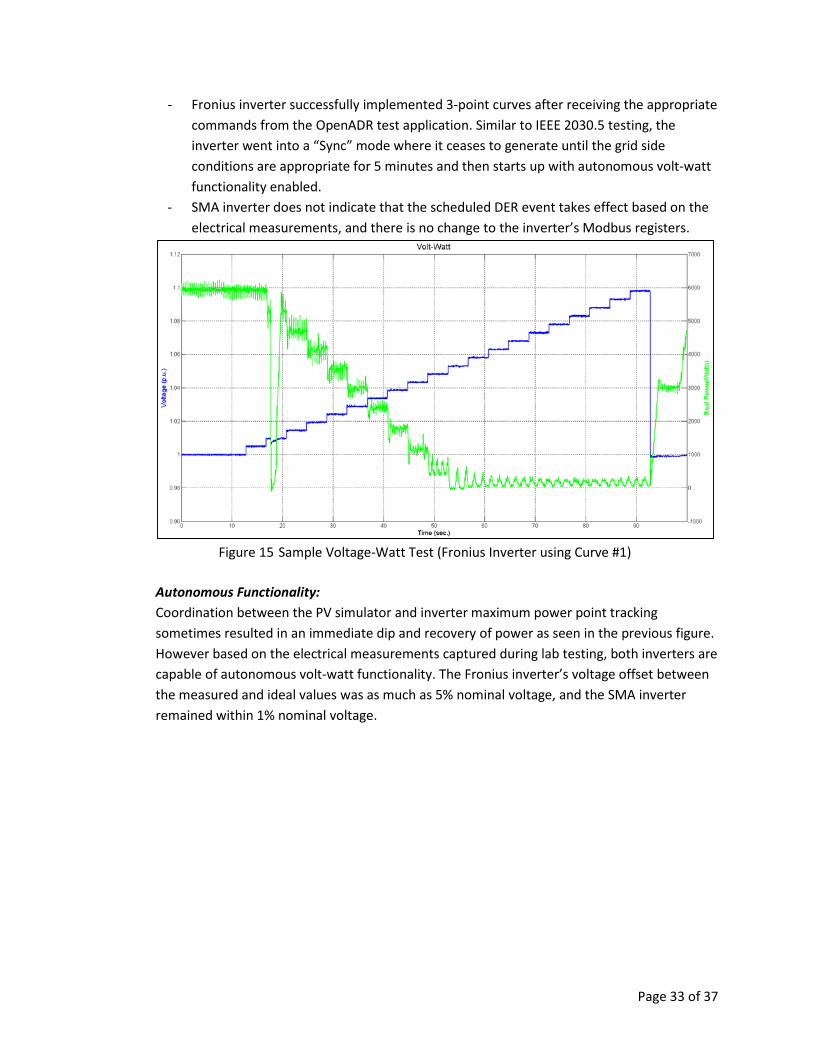
- Fronius inverter successfully implemented 3-point curves after receiving the appropriate commands from the OpenADR test application. Similar to IEEE 2030.5 testing, the inverter went into a “Sync” mode where it ceases to generate until the grid side conditions are appropriate for 5 minutes and then starts up with autonomous volt-watt functionality enabled.
- SMA inverter does not indicate that the scheduled DER event takes effect based on the electrical measurements, and there is no change to the inverter’s Modbus registers.
Figure 15 Sample Voltage-Watt Test (Fronius Inverter using Curve #1)
Autonomous Functionality: Coordination between the PV simulator and inverter maximum power point tracking sometimes resulted in an immediate dip and recovery of power as seen in the previous figure. However based on the electrical measurements captured during lab testing, both inverters are capable of autonomous volt-watt functionality. The Fronius inverter’s voltage offset between the measured and ideal values was as much as 5% nominal voltage, and the SMA inverter remained within 1% nominal voltage.

Page 34 of 37
Figure 16 Volt-Watt Accuracy (Fronius Inverter using Curve #1)
Figure 17 Volt-Watt Accuracy (SMA Inverter using Curve #1)
4.6 Frequency-Watt Function Summary: The frequency-watt functionality was ultimately not supported by either inverter manufacturer using open protocols and therefore could not be tested accordingly in the lab.

Page 35 of 37
Freq-Watt Fronius Inverter SMA Inverter
SunSpec (Modbus)
AutoGrid (2030.5)
EPRI VTN (OpenADR)
SunSpec (Modbus)
AutoGrid (2030.5)
EPRI VTN (OpenADR)
Curve #1
Curve #2
Table 16 Frequency-Watt Communication Results Summary
4.7 Connect/Disconnect Function Summary: Although originally thought to have created physical disconnection from the electric grid, the inverters tested merely used existing functionality to reduce power output. Therefore the real power output was reduced to near zero, demonstrating something similar to a cease generation capability.
Disconnect Fronius Inverter SMA Inverter
SunSpec (Modbus)
AutoGrid (2030.5)
EPRI VTN (OpenADR)
SunSpec (Modbus)
AutoGrid (2030.5)
EPRI VTN (OpenADR)
0%
Table 17 Connect-Disconnect Communication Results Summary SunSpec Dashboard (Modbus): Both inverters successfully demonstrated some form of cease generation by utilizing the registers from limit maximum real power and setting them to zero. It should be noted that this is not the same functionality as a physical disconnect of the inverter from the electric grid. Autogrid (2030.5 / SEP 2.0):
- Fronius inverter used the existing opModFixedW object was used to limit maximum real power by setting the watts to zero. The inverter entered a “Forced-Standby” mode upon using this command. Reconnecting would take approximately 5 minutes after the command was received due to the inverter’s “Sync” mode.
- SMA inverter successfully demonstrated limiting maximum real power to near zero using the opModFixedW function in IEEE 2030.5 as well. This did not appear to be a physical disconnection as previously mentioned.
Page 36 of 37
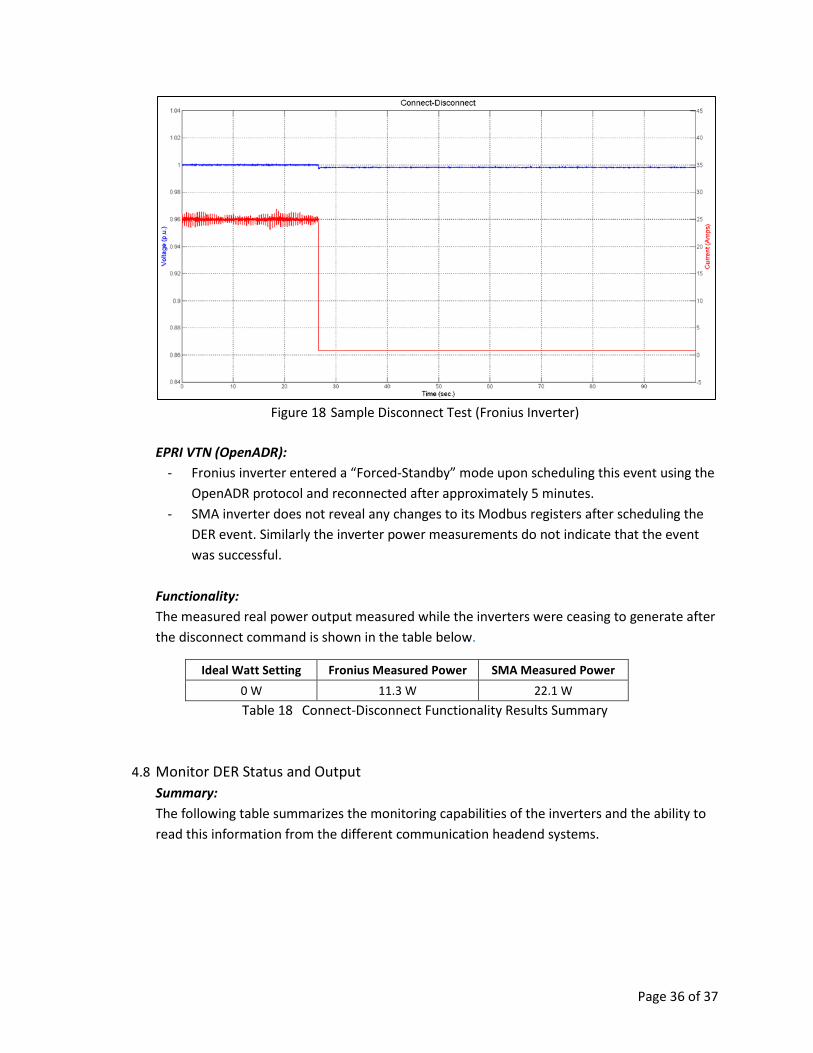
Figure 18 Sample Disconnect Test (Fronius Inverter)
EPRI VTN (OpenADR):
- Fronius inverter entered a “Forced-Standby” mode upon scheduling this event using the OpenADR protocol and reconnected after approximately 5 minutes.
- SMA inverter does not reveal any changes to its Modbus registers after scheduling the DER event. Similarly the inverter power measurements do not indicate that the event was successful.
Functionality: The measured real power output measured while the inverters were ceasing to generate after the disconnect command is shown in the table below.
Ideal Watt Setting Fronius Measured Power SMA Measured Power 0 W 11.3 W 22.1 W Table 18 Connect-Disconnect Functionality Results Summary
4.8 Monitor DER Status and Output Summary: The following table summarizes the monitoring capabilities of the inverters and the ability to read this information from the different communication headend systems.

Page 37 of 37
Monitoring Fronius Inverter SMA Inverter
SunSpec (Modbus)
AutoGrid (2030.5)
EPRI VTN (OpenADR)
SunSpec (Modbus)
AutoGrid (2030.5)
EPRI VTN (OpenADR)
V, A, W, etc. * *
Table 19 Monitoring Communication Results Summary SunSpec Dashboard (Modbus): The monitoring parameters/registers were viewed by directly interfacing with the inverters via the SunSpec Dashboard Tool. The registers would successfully updated upon using the “Read” button. Autogrid (2030.5 / SEP 2.0): Though the Autogrid SEP 2.0 / IEEE 2030.5 server did not provide an interface to view or download data, Wireshark traces confirmed the capability of the IEEE 2030.5 systems to post all 7 data points collected by both the Fronius and the SMA inverters. The accuracy of this data was not evaluated during lab testing. EPRI VTN (OpenADR): The EPRI OpenADR VTN provided an interface to view and download the data points provided by each of the inverters.