Scatterplots AP Statistics CH. 7 EQ: How do we graph bivariate data?
17
Scatterplots AP Statistics CH. 7 EQ: How do we graph bivariate data?
-
Upload
sabrina-morgan -
Category
Documents
-
view
214 -
download
0
Transcript of Scatterplots AP Statistics CH. 7 EQ: How do we graph bivariate data?

ScatterplotsAP StatisticsCH. 7EQ: How do we graph bivariate data?

Scatterplots• Help to observe relationships between two
quantitative variables(we call this describing bivariate data)• Should have title, labels, units• Can see patterns, trends, relationships,
extraordinary values
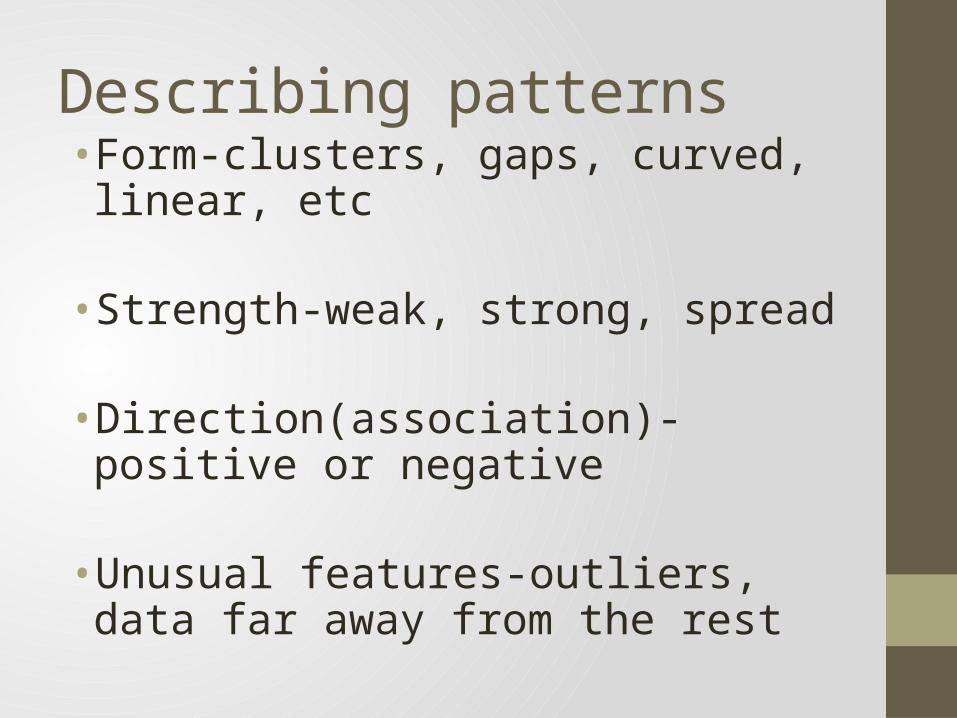
Describing patterns• Form-clusters, gaps, curved, linear, etc
• Strength-weak, strong, spread
• Direction(association)-positive or negative
• Unusual features-outliers, data far away from the rest

• Response Variable (Dependent)•Measures an outcome of a study• In a scatterplot it goes on the y axis
• Explanatory/Predictor Variable (Independent)-Attempts to explain the observed outcome-In a scatterplot it goes on the x axis

If there is a relationship, tell which is the explanatory and response variables.1. The amount of time spent studying and the
grade on the exam
2. The weight and height of a person.
3. The amount of yearly rainfall and the yield of a crop.
4. Maximum daily temperature and average monthly heating bills.
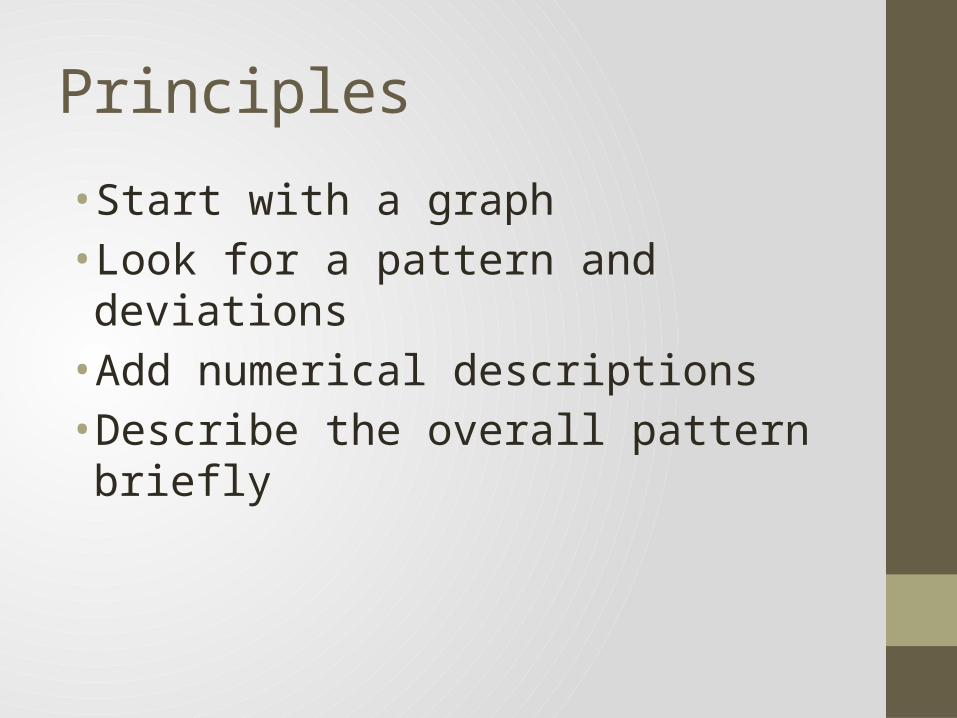
Principles
• Start with a graph• Look for a pattern and deviations• Add numerical descriptions• Describe the overall pattern briefly

The high temperature in degree Fahrenheit and coffee sales (in hundreds of dollars) for a coffee shop for
eight randomly selected days.
Temperature Coffee Sales
32 26.239 24.851 19.760 2065 13.372 13.978 11.481 11.2

A. Tell which variable is explanatory and which is response.
B. Graph the scatterplot. Describe it.
C. Explain in a sentence what this says about high temperatures and coffee sales.


Book P. 164 # 2Suppose you want to collect data for each pair ofvariables. You want to make a scatterplot. Whichvariable would be the explanatory variable and whichwould be the response variable? Discuss the likelydirection, form, and strength.
A. T-shirts at a store: price each, number soldB. Skin diving: depth, water pressureC. Skin diving: depth, visibilityD. All elementary-school students: weight, score on a
reading test

p.164 #2A B C D
V E: PriceR: # Sold
E: DepthR: Water pressure
E: DepthR: Visibility
E: WeightR: Reading
D Negative Positive Negative Positive
U None None None None
F Linear Linear Linear (?) Possibly Linear
S Moderate Strong Weak to Moderate
Moderate
A B C D
V E: R:
E: R:
E: R:
E: R:
D
U
F
S

Book P. 164 # 6
Which scatterplot hasa. Little or no associationb. A negative associationc. A linear associationd. A moderately strong associatione. A very strong association

HWP. 164 # 3, 5, 9, 11