Scarcity, Opportunity Cost andProduction...
4
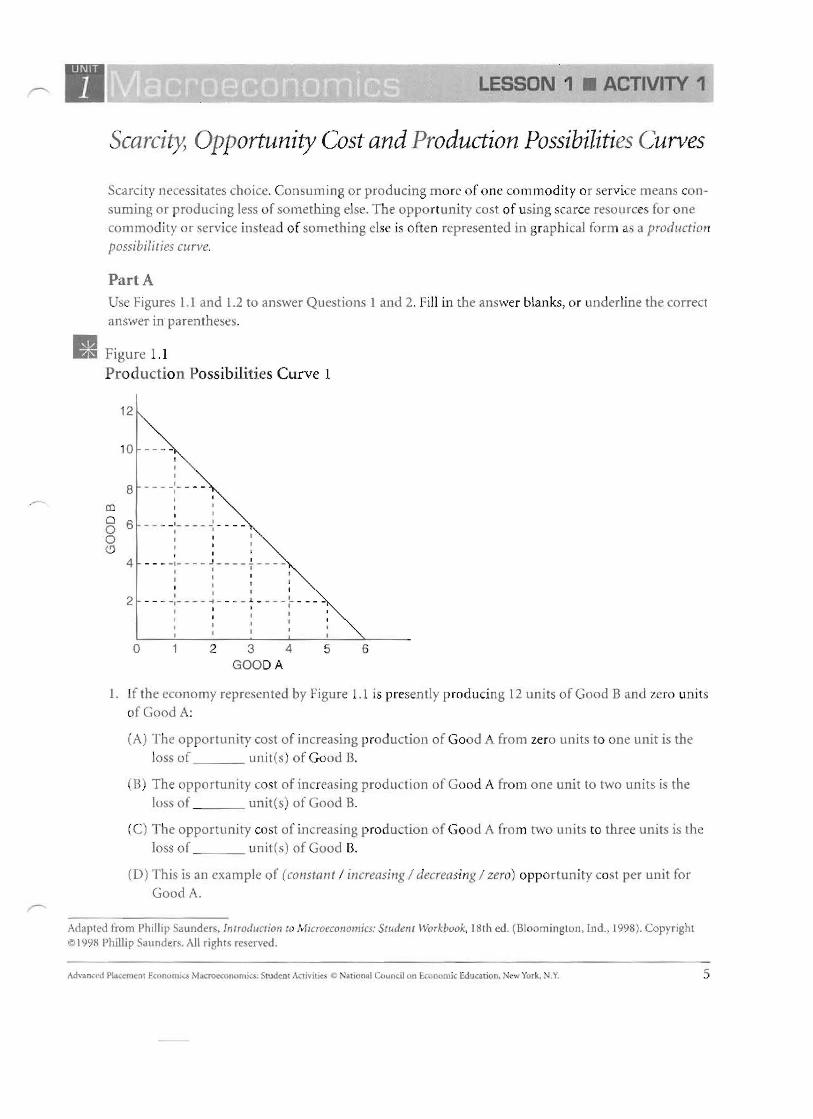
LESSON 1 • ACTIVITY 1 Sca r ci ty, Opportunity Cost and Production Possibilities Curves Scarcity necessitates choice. Consuming or producin g more of one commodity or service means con- sumin g or producing less of something else.The o ppo rtun ity cost of using scarce resources for one commo dity or serv ice instead of something else is of ten represented in graphical form as a production possibilities wr ve. Part A Use Figures 1.1 and 1.2 to answer Questions 1 and 2. Fill in the answer blanks, or underline the correct answer in parentheses. Figure 1. 1 Production Possibilities Curve 1 12 10 8 en 8 6 - - - -:- - - - ---- I I I - - - -:- - - - I I I I o I ' (!J : : I 4 ----,---- J - - - - - - - - I I : t I I I : t 1 : 2 ----,---- ... - - - - , - - - - - - - - - f l . I I I ' : I I I I I I I o 2 3 4 5 6 GOOD A 1. If the economy represented by Figure 1.1 is presently producing 12 un its of Good Band zero units of Good A: (A) The opportun ity cost of increasing production of Good A from zero un its to one unit is the loss of un itfs) of Good B. (0 ) Th e opp ortunity cost of increasing p roduct ion of Good A from one unit to two units is the loss of unitts) of Good B. (C ) Th e opportunity cost of increasing production of Go od A fro m two uni ts to three units is the loss of unitfs) of Good O. (D) Thi s is an example of (constant I increasing I decreasing I zero) opp ortunity cost per unit for Go od A. Adapted from Ph illip Saun de rs. Introduction /() M icroeconom ics: Stu dent Workbook, I8th ed. (Bloomington. lnd., 1998). Co pyr ight 1998 Phillip Saunders. All rights reserved . Advanced Placement Fconormcs MJcroecnnl)mjcs: Stu dent Activities e Nat io nal Co unci l on Economic Edu cati on . Ne .... · Yo rk. /. .Y, 5
Transcript of Scarcity, Opportunity Cost andProduction...
LESSON 1 • ACTIVITY 1
Scarcity, Opportunity Cost and Production Possibilities Curves
Scarcity necessitates choice. Co nsum ing or producing mo re of o ne com modity or service means con
suming or prod ucing less of someth ing else. The oppo rtun ity cost of using scarce resources for o ne commo dity or serv ice instead of so methi ng else is often represented in graphical form as a production possibilitieswrve.
Part A Use Figures 1.1 and 1.2 to ans wer Questions 1 and 2. Fill in th e ans wer blanks, or und erli ne the correct
answer in parentheses.
~ Figure 1.1
Produ ction Possibilitie s Curve 1
12
10
8
en 8 6 - - - - :- - - - ~ - - -
I I
I
- - - -:- - - -I
I I I
o I ' (!J : : I
4 - - - -,- - - - J - - - - ~ - - - I I : t I I I
: t 1 :
2 - - - -,- - - - ... - - - - , - - - - - - - - f l . I
I I ' : I I I I I I I
o 2 3 4 5 6 GOOD A
1. If the eco nomy represented by Figure 1.1 is pre sen tly produci ng 12 un its of Good B an d zero units of Good A:
(A) The opportun ity cost of increasing production of Good A from zero un its to o ne unit is the loss of un itfs ) of Good B.
(0 ) Th e opportunity cost of inc reasing product ion of Good A fro m one un it to two units is the
loss of unitts ) of Good B.
(C) Th e opportunity cost of increasing produ ction of Go od A from two uni ts to three units is the loss of unitfs) of Good O.
(D) This is an exam ple of (constant I increasing I decreasing I zero) oppo rtunity cost per unit for
Good A.
Adapted from Ph illip Saun de rs. Introduction /()Microeconomics: Stu dent Workbook, I8th ed . (Bloom ington. lnd., 1998). Copyr ight i~ 1998 Phillip Saunders. All rights reserved .
Advanced Placement Fconormcs MJcroecnnl)mjcs: Stu dent Activities e Nat ional Co unci l on Economic Educati on . Ne....· York. /. .Y, 5
LESSON 1 • ACTIVITY 1 (continued)
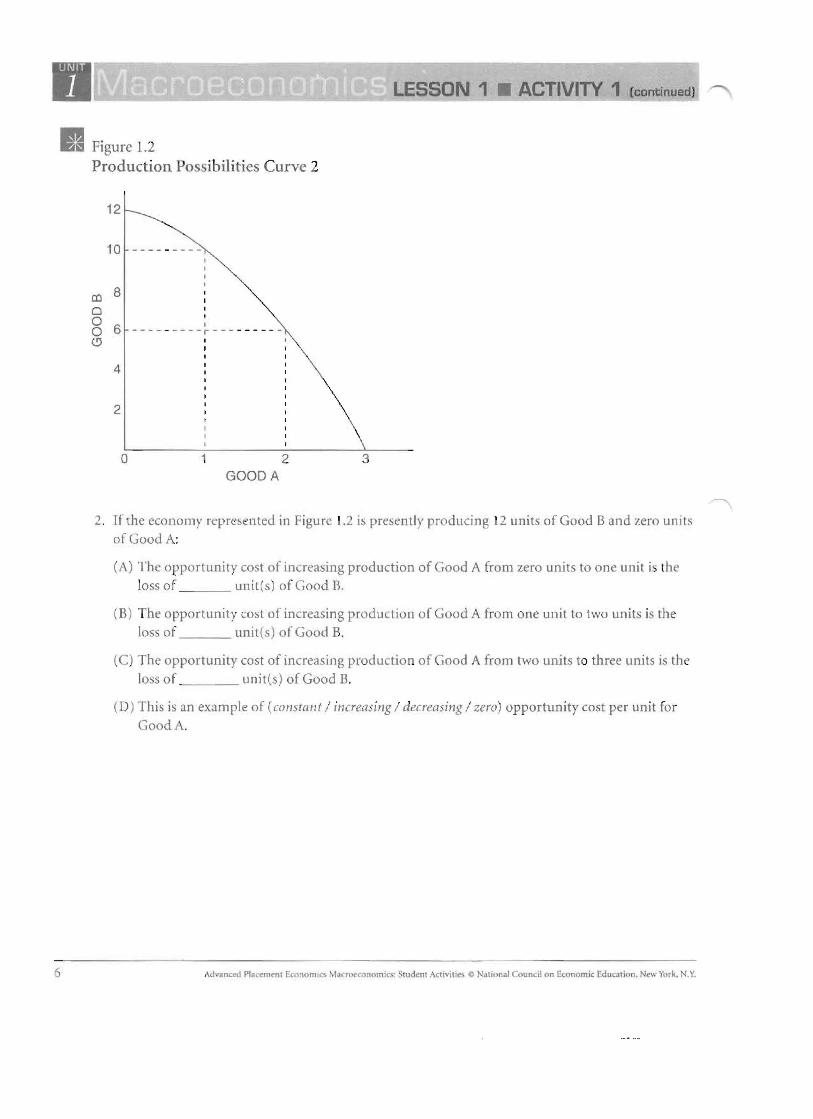
Figur e 1.2 Production Possib ilities Curve 2
12
10 -- - - - - -I I I
III 8
I
I I
o8 6
: - --- -- - - -~ - -- - - - - --
(!) : I
4 I I I
I
I
2 I, t
I I I
o 1 2 3 GOOD A
2. If the economy represented in Figure 1.2 is presently producing 12 units of Good 13 and zero units of Good A:
(A) The oppo rtunity cost of increasing production of Good A from zero units to one unit is the loss of uni t(s) of Good B.
(B) The opportunity cost of increasing production of Good A from on e un it to two units is the loss o f unit ts) of Good B.
(C) Th e opportu nity cost of increasing productio n of Good A from two units to three un its is the Joss of unit(s) of Good B.
(D ) This is an example of i constant / increasing / decreasing / zero) opportunity cost per uni t for
GoodA.
Advanced Placement Econo mics Macroecon om ic : Student A<II\·;li., Nat ion al Council On Economi c Education. New York. N.Y.
LESSON 1 ACTIVITY 1 (continued)
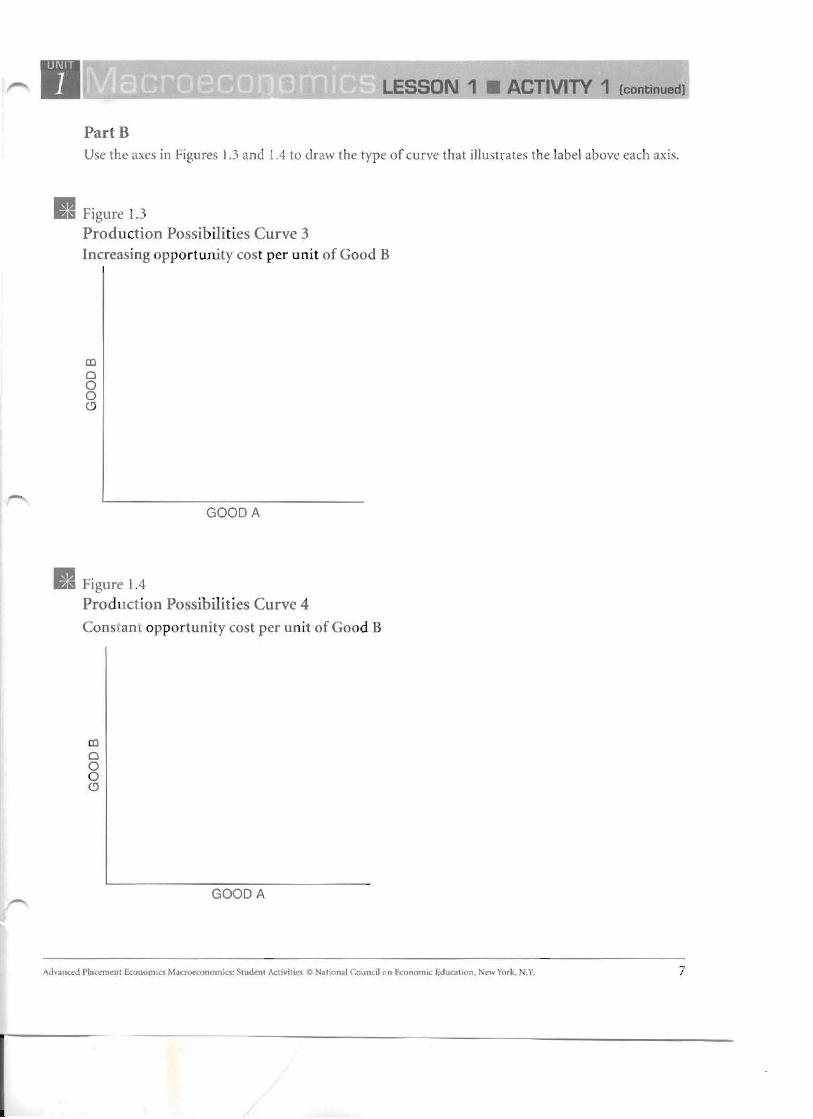
Part B Use the axes in Figures 1.3 and 1.4 to d raw th e type o f urve that illustrate s the label above each axis .
III Figure 1.3 Productio n Possib ilities Curve 3 Increasing opportunity cost per unit of Good B
CD o o o o
GOOD A
Figure 1.4
Pro duct ion Possib ilities Curve 4
Cons ant opp or tunity cost pe r unit of Good 3
CD o o o (.!)
GOOD A
Adva nced Placement Economics MaCTO<"coll om; cs: Student Activiti es 0 Nationnl Co uncil o n Ecnnu nu c Education, New York . KY. 7
LESSON 1 ACTIVITY 1 (conti nued) ,
Part e Use Figure 1.5 to answer the next five question. . Each question star ts w ith Curve BB' as a country's
production possibilities curve.
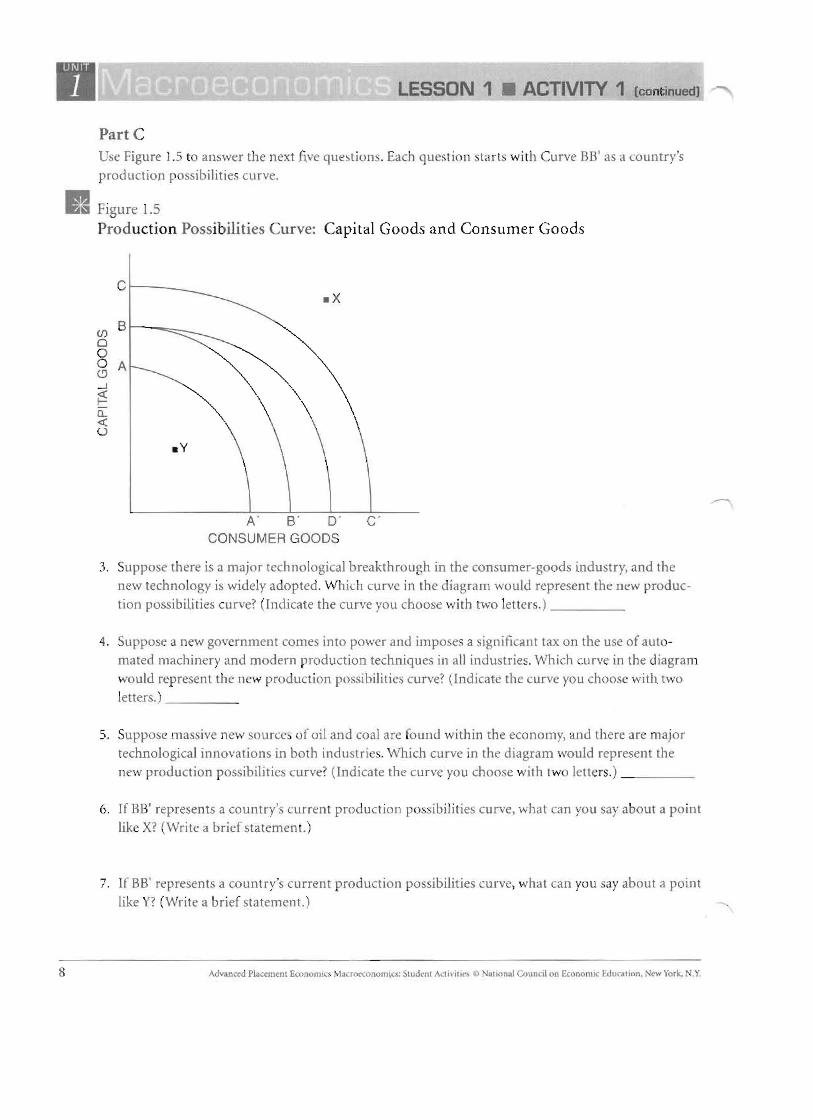
fi gure 1.5
Production Possibilit ies Curve: Capital Goods and Consumer Goods
C . x
B(j)
0 a a A<9 ....J;:; a, < u
.v
A' B ' 0 ' C ' CONSUMER GOOOS
3. Suppose there is a major technologica l breakthrough in the consum er-good s industry, and the
new technology is widely adop ted. Which curve in th e diagram would represent the new pro d uc tio n possibili ties cur ve? (Indicate the curve you choose wi th two let ters.) _
4. Suppose a new govern m en t comes into power and imposes a sign ificant tax on the use of auto
mated machinery and modern prod uct.ion techniques in all industries. Which curve in the d iagram
would represent the new pro duct ion po ssibilities cu rve? (Indicate the curve you choose with two letters.) _
5. Suppose massive new sources o f oil and coal are fo und with in t.he economy, and there arc majo r
technological innovations in both industries. Which curve in the diagram wo uld represen t the new pro duction possibilities curve? (Indicate the curve you choose with two lett ers.) _
6. If BB' represents a country's curren t produ ction possib ilities curve, wh at can you sayabout a poin t
like X? (Write a brief staternen t. )
7. If BB' represents a country's current production possibilit ies curve, what can you say about a point
like Y? (Write a b rief statement .)
Advanced Placement Economics !..tacroeco nomics: Studen t "cth'il il~ e Nal io nal Co unci l on Economic Education , few York. N.Y. 8