SCaN MOBIS Proposal
115
UC Berkeley Recent Work Title The Potential Societal Barriers of Urban Air Mobility (UAM) Permalink https://escholarship.org/uc/item/7p69d2bg Authors Shaheen, Susan, PhD Cohen, Adam Farrar, Emily Publication Date 2018-11-21 DOI 10.7922/G28C9TFR eScholarship.org Powered by the California Digital Library University of California
Transcript of SCaN MOBIS Proposal
UC BerkeleyRecent Work
TitleThe Potential Societal Barriers of Urban Air Mobility (UAM)
Permalinkhttps://escholarship.org/uc/item/7p69d2bg
AuthorsShaheen, Susan, PhDCohen, AdamFarrar, Emily
Publication Date2018-11-21
DOI10.7922/G28C9TFR
eScholarship.org Powered by the California Digital LibraryUniversity of California

The Potential Societal Barriers of Urban Air Mobility (UAM)
Susan Shaheen, Ph.D. Adam Cohen Emily Farrar SUBMISSION DATE: November 21, 2018 SUBMITTED TO: National Aeronautics and Space Administration Attn: Nancy Mendonca Jonnelle Goff SUBMITTED BY: Booz Allen Hamilton 8283 Greensboro Drive McLean, VA 22102 Contract Number: BPA No. NNH13CH54Z TIN: 36-2513626 DUNS: 00-692-8857 CAGE: 17038 doi:10.7922/G28C9TFR

Aeronautical Systems Services in Support of NASA Headquarters, Aeronautics Research Mission Directorate (ARMD)
i
TABLE OF CONTENTS
1.0 INTRODUCTION ......................................................................................................................... 4
2.0 SOCIETAL BARRIERS ............................................................................................................. 4
2.1 Literature Review ................................................................................................................................. 5 2.1.1 Trust and Automation ................................................................................................................................... 5 2.1.2 UAM as an Innovative Transportation Mode ........................................................................................ 6 2.1.3 Piloted vs Automated Flight ........................................................................................................................ 7
2.2 Focus Groups ........................................................................................................................................ 8 2.2.1 Methodology .................................................................................................................................................... 8 2.2.2 Pre-Focus Group Questionnaire and Participant Demographics ................................................... 9 2.2.3 Familiarity with Air Taxi and Urban Air Mobility.................................................................................. 11 2.2.4 Thoughts and Impressions about Urban Air Mobility ....................................................................... 12 2.2.5 Automation and Electrification ................................................................................................................. 13 2.2.6 Ownership Versus Sharing ....................................................................................................................... 13 2.2.7 Security and Safety ..................................................................................................................................... 14 2.2.8 Privacy ............................................................................................................................................................. 14 2.2.9 Concerns as a Non-User ........................................................................................................................... 15
2.3 General Population Survey ............................................................................................................ 15 2.3.1 Methodology .................................................................................................................................................. 15 2.3.2 Respondent Demographics ...................................................................................................................... 19 2.3.3 Familiarity with UAM ................................................................................................................................... 21 2.3.4 Travel Behavior ............................................................................................................................................ 21 2.3.5 Familiarity with Aviation and Existing Preferences ........................................................................... 25 2.3.6 UAM Perceptions ......................................................................................................................................... 29 2.3.7 Perceptions Toward Technology and UAM ......................................................................................... 33 2.3.8 Stated Preference & Willingness to Pay .............................................................................................. 35 2.3.9 Weather Considerations ............................................................................................................................ 38 2.3.10 Market Preferences ..................................................................................................................................... 40 2.3.11 Perceptions from Non-User Perspective .............................................................................................. 48
3.0 SUMMARY AND KEY FINDINGS ....................................................................................... 50
4.0 APPENDIX .................................................................................................................................. 52 4.1.1 NASA Societal Barriers Focus Group Protocol .................................................................................. 52 4.1.2 NASA Societal Barriers Survey Instrument ......................................................................................... 55
Aeronautical Systems Services in Support of NASA Headquarters, Aeronautics Research Mission Directorate (ARMD)
ii
LIST OF FIGURES
Figure 1: Research Process for Societal Barrier Studies .................................................................... 4
Figure 2: Survey responses to UAM familiarity ................................................................................... 21
Figure 3: Recent Trip Purpose ............................................................................................................... 22
Figure 4: Most Recent Trip Distance ..................................................................................................... 23
Figure 5: Most Recent Trip Mode .......................................................................................................... 24
Figure 6: Commute Mode ....................................................................................................................... 24
Figure 7: Aircraft Exposure ..................................................................................................................... 26
Figure 8: Flight Frequency ...................................................................................................................... 27
Figure 9: Factors affecting Decision to Fly ........................................................................................... 28
Figure 10: Factors Affecting Flight Experience .................................................................................... 28
Figure 11: On-Board Experience ........................................................................................................... 29
Figure 12: Willingness to Fly Among Age Groups .............................................................................. 31
Figure 13: Perceptions of willingness and comfort ............................................................................. 34
Figure 14: Perceptions of safety and security ...................................................................................... 35
Figure 15: Perceptions of Weather ........................................................................................................ 39
Figure 16: Willingness to pay a premium fare to fly alone ................................................................. 40
Figure 17: Willingness to pay a premium fare by age demographics .............................................. 41
Figure 18: Security Screenings .............................................................................................................. 41
Figure 19: Responses to UAM trip purpose ......................................................................................... 42
Figure 20: Likely Travel Partners ........................................................................................................... 42
Figure 21: AV vs. UAM Travel ................................................................................................................ 44
Figure 22: SAV vs. UAM Travel ............................................................................................................. 45
Figure 23: Willingness to Use Vertiport ................................................................................................ 46
Figure 24: Time to Access Vertiport ...................................................................................................... 46
Figure 25: Cost to Access Vertiport ....................................................................................................... 47
Figure 26: Perceptions from a non-user perspective .......................................................................... 49
Aeronautical Systems Services in Support of NASA Headquarters, Aeronautics Research Mission Directorate (ARMD)
iii
LIST OF TABLES
Table 1: Focus Group Participant Demographics ................................................................................. 9
Table 2: Five U.S. Metropolitan Regions Surveyed ............................................................................ 17
Table 3: Willingness-to-Fly Scale .......................................................................................................... 18
Table 4: Demographic Data .................................................................................................................... 20
Table 5: Initial Reactions ......................................................................................................................... 30
Table 6: Crosstabs on Socio-Demographic Variables ........................................................................ 32
Table 7: Ordinal Regression Model ....................................................................................................... 33
Table 8: Stated Preference Attributes ................................................................................................... 35
Table 9: Stated Preference and Willingness to Pay ........................................................................... 37
Table 10: Preferred Modes for Vertiport Access ................................................................................. 47
NASA UAM Market Study – The Potential Societal Barriers of Urban Air Mobility
4 | P a g e
1.0 INTRODUCTION
Urban Air Mobility (UAM) is an emerging concept of air transportation where small package delivery drones to passenger-carrying air taxis operate over populated areas, from small towns to the largest cities are being considered. This could revolutionize the way people move within and around cities by shortening commute times, bypassing ground congestion, and enabling point-to-point flights across cities. In recent years, several companies have designed and tested enabling elements of this concept, including; prototypes of Vertical Take-Off Landing (VTOL) capable vehicles, operational concepts, and potential business models. While UAM may be enabled by the convergence of several factors, several challenges could prevent its mainstreaming, such as societal acceptance.
2.0 SOCIETAL BARRIERS
Research on the potential societal barriers of an emerging technology is important to understanding the potential viability of the technology from a societal perspective, opportunities and challenges associated with markets, use cases, business models, and partnerships. Research on societal barriers can also provide insight on the potential impacts of deployment. Additionally, research on societal barriers can help identify early technological, market, or consumer challenges to address, such as how UAM can be used to improve airport access or reduce commute times. Societal barriers research can also help provide a predictive understanding of supply and demand patterns, such as willingness to use a technology or service and under what conditions. Finally, societal barriers research can be employed to help inform public policy to help maximize the potential benefits and minimize potential adverse effects of a technology.
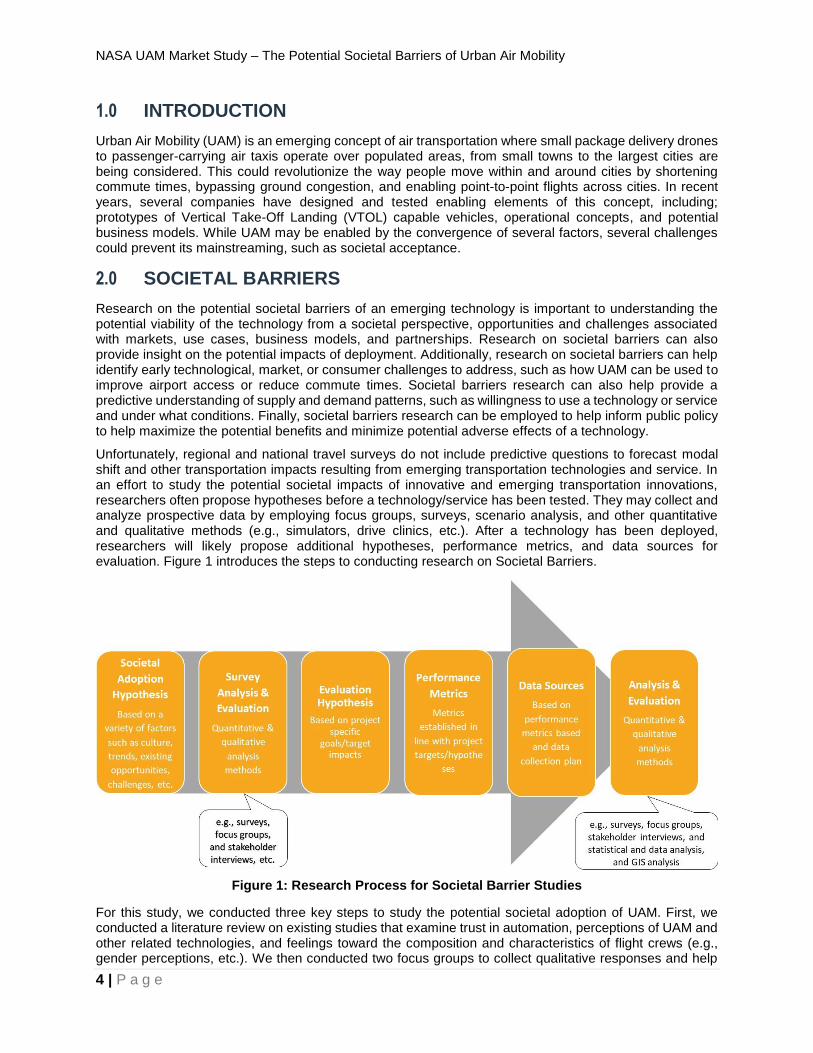
Unfortunately, regional and national travel surveys do not include predictive questions to forecast modal shift and other transportation impacts resulting from emerging transportation technologies and service. In an effort to study the potential societal impacts of innovative and emerging transportation innovations, researchers often propose hypotheses before a technology/service has been tested. They may collect and analyze prospective data by employing focus groups, surveys, scenario analysis, and other quantitative and qualitative methods (e.g., simulators, drive clinics, etc.). After a technology has been deployed, researchers will likely propose additional hypotheses, performance metrics, and data sources for evaluation. Figure 1 introduces the steps to conducting research on Societal Barriers.
Figure 1: Research Process for Societal Barrier Studies
For this study, we conducted three key steps to study the potential societal adoption of UAM. First, we conducted a literature review on existing studies that examine trust in automation, perceptions of UAM and other related technologies, and feelings toward the composition and characteristics of flight crews (e.g., gender perceptions, etc.). We then conducted two focus groups to collect qualitative responses and help
NASA UAM Market Study – The Potential Societal Barriers of Urban Air Mobility
5 | P a g e
inform the development of a general population survey regarding UAM across five U.S. cities. Two focus groups were completed in June 2018 in Washington, D.C. and Los Angeles. The participants of the focus groups were engaged on topics such as: familiarity with UAM; their thoughts and impressions of UAM; and views regarding ownership, automation, and safety. In August 2018, we completed an exploratory general population survey consisting of approximately 1,700 respondents in Houston, Los Angeles, New York, San Francisco, and Washington, D.C. (approximately 350 respondents per city). The survey expanded on the topics covered in the focus groups and included additional questions about willingness-to-fly, weather, and noise concerns. The literature review, focus group, and survey findings are each reviewed in the following sections.
2.1 Literature Review
Increased urban congestion, airborne technology innovation, and autonomous technology advancements have prompted research into UAM as a possibility for future transportation. Our study aimed to identify societal barriers facing UAM through questions targeting several themes: 1) preferences for piloted, re-motely piloted, or automated UAM; 2) technological preferences for UAM aircraft, such as fixed wing vs. vertical takeoff and landing aircraft or electric vs. gasoline aircraft; 3) noise and aesthetics of aircraft; 4) the use of UAM aircraft over certain land uses, such as residential neighborhoods; and 5) perceptions of UAM sharing and ownership. This literature review provides background on existing literature, much of which covers the topics of trust in automation; initial perceptions of automated and unmanned flight; and prefer-ences for cockpit configurations. First, we briefly review the concept of trust before diving into several stud-ies that examine trust in automated systems (i.e., automated medical systems, automated vehicles, auton-omous aircraft). The literature review also details several studies examining the introduction of UAM as a new mode of travel and perceptions of automated vs. piloted flight.
2.1.1 Trust and Automation
Trust is a necessary component of gaining public support for an emerging technology. Care should be taken to understand the implications of trust on UAM public acceptance. In a study of organizational trust, Mayer, Davis, and Schoorman (1995) made the case that trust is a “psychological construct” associated with relinquishing control of a situation to another person or object under the assumption that the situation
will be executed safely and well.1 For UAM deployment to succeed, the industry will need to gain the pub-lic’s trust and convince them that travel using UAM aircraft will be safe and reliable. However, trust is fragile,
and can be lost and never regained after a bad experience (Slovic, 1993).2
UAM confronts many similar challenges to automated vehicles in building public trust. Automated vehicle (AV) success largely hinges on public support and adoption. A study by Anania et al. (2018a) found that
associating AVs with positive or negative information strongly impacts consumer support.3 When partici-pants in the study were presented with media headlines that contained negative information about AVs, they were less willing to ride in driverless vehicles. Likewise, when participants were presented with positive information, they were more willing to ride in driverless vehicles than before they had been exposed to the headlines.
For this study, the willingness-to-fly scale developed by Winter et al. (2015) was adapted to measure will-
ingness to ride in AVs.4 This is the same scale that we adapted for our study to measure willingness to use UAM. In addition to the different automated technology studied (AVs vs UAM), the study by Anania et al.
1 Mayer, R. C., Davis, J. H., & Schoorman, F. D. (1995). An integrative model of organizational trust. Academy of
management review, 20(3), 709-734.
2 Slovic, P. (1993). Perceived risk, trust, and democracy. Risk analysis, 13(6), 675-682.
3 Anania, E. C., Rice, S., Walters, N. W., Pierce, M., Winter, S. R., & Milner, M. N. (2018a). The effects of positive and
negative information on consumers’ willingness to ride in a driverless vehicle. Transport Policy.
4 Winter, S. R., Rice, S., Mehta, R., Cremer, I., Reid, K. M., Rosser, T. G., & Moore, J. C. (2015). Indian and Ameri-
can consumer perceptions of cockpit configuration policy. Journal of air transport management, 42, 226-231.

NASA UAM Market Study – The Potential Societal Barriers of Urban Air Mobility
6 | P a g e
(2018a) measures responses to full automation3, while our study aimed to measure willingness for varying
degrees of automation. In addition to positive and negative information exposure, the reliability of automated systems factors highly in consumer trust. Drops in reliability tend to degrade trust in automated systems, in turn leading to negative performance assessments and decreased adoption. Support for robot systems relies mainly on six factors: reliability, predictability, trust in the engineering, technical capabilities, system
failures, and risk (Desai et al. 2012).5 Our study assessed the public’s perceptions of comfort and safety in regard to UAM aircraft; future research efforts could examine the effects of simulated drops in performance on the public’s willingness to use UAM. Carlson et al. (2014) investigated commonalities and dissimilarities in a survey of public perception of automation in vehicles and medical systems, finding that an up-to-date
system with available statistics of past performance was important in both forms of automation6. Respond-ents wanted greater levels of control and understanding of the system in the automotive domain than in the medical realm. Brand recognition was also important to respondents, as they were more likely to embrace automation from companies, such as Google and IBM, than from lesser-known or startup companies. In our study, we did not examine brand recognition but we did examine the impact of familiarity with the UAM concept on a person’s willingness to use the technology.
2.1.2 UAM as an Innovative Transportation Mode
The public hesitation toward accepting AVs is reflected in studies that examine the public’s perceptions of UAVs. Of note, a few authors used the term “UAVs” to refer to pilotless aircraft, even though the aircraft, per the authors’ definitions may have been intended to carry passengers. Tam (2011) investigated public risk perceptions of “UAVs” to transport cargo and passengers, and found that the largest perceptions of risk
involved technological reliability and higher perceived safety with a human pilot onboard.7 The study only examined fully automated flight, but with different levels of monitoring (i.e., pilot on board, controlled from the ground, or no pilot on board). Our study examined different levels of automation, from human-piloted flight to fully automated flight. Seventy-seven percent of passengers supported automated aircraft, if a pilot was onboard to actively monitor the operation. However, 60% of surveyed passengers had little to no fa-miliarity with UAVs (pilotless aircraft). A limitation to note with the study by TAM (2011) is approximately 53% of the 158 respondents were between the ages of 50-64; the study results might be biased towards
the perceptions of particular age groups7. In a study by Ragbir et al. (2018), survey participants noted potential benefits of automated flight such as: decreases in pilot fatigue, human error, and lower costs for
automated aircraft.8 However, the benefits were generally outweighed by concerns over reliability; system security; lack of a human pilot; and operation under extreme conditions, such as rain, snow, and ice. Simi-larly, our study examines the effect of different weather conditions on user perceptions.
A variety of factors work together to influence public opinion of automated and/or unmanned flight. MacSween-George (2003) conducted a survey gaging participant interest in pilotless, automated aircraft,
both for passenger transportation and goods movement.9 While people were generally unenthusiastic about automated, unmanned aircraft, there was greater support for cargo transportation. Furthermore, ed-ucating survey participants about automated, unmanned flight led to greater support for the technology.
5 Desai, M., Medvedev, M., Vázquez, M., McSheehy, S., Gadea-Omelchenko, S., Bruggeman, C., ... & Yanco, H.
(2012, March). Effects of changing reliability on trust of robot systems. In Proceedings of the seventh annual
ACM/IEEE international conference on Human-Robot Interaction (pp. 73-80). ACM.
6 Carlson, M. S., Desai, M., Drury, J. L., Kwak, H., & Yanco, H. A. (2014). Identifying factors that influence trust. In
2014 AAAI Spring Symposium Series.
7 Tam, A. (2011). Public perception of unmanned aerial vehicles.
8 Ragbir, N. K., Baugh, B. S., Rice, S., & Winter, S. R. (2018). How Nationality, Weather, Wind, and Distance Affect
Consumer Willingness to Fly in Autonomous Airplanes. Journal of Aviation Technology and Engineering, 8(1), 1.
9 MacSween-George, S. L. (2003, March). Will the public accept UAVs for cargo and passenger transportation?. In
Aerospace Conference, 2003. Proceedings. 2003 IEEE (Vol. 1, pp. 1-367). IEEE.

NASA UAM Market Study – The Potential Societal Barriers of Urban Air Mobility
7 | P a g e
While this survey is somewhat dated in that people associated unmanned flight and forms of UAV trans-portation with drones in the Afghanistan and Iraq wars, it still shows the potential power of education.
Anania et al. (2018b) found that UAV support also varies with racial bias and political leanings.10 Partici-pants in the study were more supportive of UAVs flying over primarily African American neighborhoods than they were of Caucasian neighborhoods. Politically conservative survey respondents were much more willing to accept UAVs than were liberal respondents. While these perceptions will likely change over time, understanding such consumer attitudes toward UAVs can better inform developers and policy makers.
A number of studies also investigated differences in perceptions on automated flight based on nationality. Ragbir et al. (2018) found that Indian survey participants were generally more accepting of automated,
pilotless commercial flight than were American participants.8 While Indian respondents supported UAV usage in all but the most extreme flight conditions, Americans only positively viewed automated, pilotless flight under near perfect conditions. While our study does not compare perceptions of UAM based on dif-ferent nationalities, we will have a large sample size (~1700) of American respondents.
2.1.3 Piloted vs Automated Flight
Passengers are less willing to fly on board a solely automated aircraft than a hybrid cockpit or traditional
two-pilot cockpit (Rice et al. 2014; Winter et al. 2015; Mehta et al. 2017).11 4 12 Hughes et al. (2009) found that acceptance for automated flight depended mainly on trust, which in turn was largely influenced by
feelings.13 They saw that in general, though, people had a more negative view of automated cockpits and preferred a human pilot, even in cases where monetary discounts would be offered to fly in auto-pilot sys-tems. In fact, their confidence in the automated pilot went down for cheaper flights. The participants may have assumed cost-cutting or cheaper flights would be less reliable. While our study did not examine the difference in pricing between automated and human-piloted flight, we did collect data on the effects of pricing on the willingness-to-fly in UAM.
Mehta et al. (2017) found that, given the option of flying in piloted aircraft of various configurations (male-male pilots, male-female pilots, or female-female pilots) or flying in an automated aircraft (with no human
pilot in the cockpit), survey respondents were least willing to fly on automated airplanes.12 Similar to the findings of the study by Ragbir et al. (2018), U.S. participants were less willing to fly on automated planes
than were Indian participants.8 Rice et al. (2014) saw similar results, with Americans having a more positive reaction to human pilots and a more negative reaction to automated, unmanned aircraft than did Indian
passengers.11 Trust in air traffic controllers could be used as a proxy for trust in remote pilots. Mehta et al. (2016) looked at differing support for air traffic controllers based on age, showing that Americans generally
favored older air traffic controllers, while Indians were more trusting of young air traffic controllers.14 These findings help to shed light on trust in piloted and remotely piloted aircrafts, as emotional response toward air traffic controllers can mirror attitudes toward automated flight, with or without a pilot present.
Gender is also a significant factor for understanding passenger attitudes toward piloted and automated flight. Cultural biases can affect the public’s perceptions of flight safety and trust in a pilot, even when there
10 Anania, E. C., Rice, S., Winter, S. R., & Milner, M. N. (2018b, April). Racial Prejudice Affecting Support for Un-
manned Aerial Vehicle Operations. In Proceedings of the Technology, Mind, and Society (p. 2). ACM.
11 Rice, S., Kraemer, K., Winter, S. R., Mehta, R., Dunbar, V., Rosser, T. G., & Moore, J. C. (2014). Passengers from
India and the United States have differential opinions about autonomous auto-pilots for commercial flights. Interna-
tional Journal of Aviation, Aeronautics, and Aerospace, 1(1), 3.
12 Mehta, R., Rice, S., Winter, S., & Eudy, M. (2017). Perceptions of cockpit configurations: a culture and gender
analysis. The International Journal of Aerospace Psychology, 27(1-2), 57-63.
13 Hughes, J. S., Rice, S., Trafimow, D., & Clayton, K. (2009). The automated cockpit: A comparison of attitudes to-
wards human and automated pilots. Transportation research part F: traffic psychology and behaviour, 12(5), 428-439.
14 Mehta, R., Rice, S., Rao, N., Coudert, A., & Oyman, K. (2016). Age and Trust in Air Traffic Controllers: A Compari-son Between Two Countries.

NASA UAM Market Study – The Potential Societal Barriers of Urban Air Mobility
8 | P a g e
is contradictory evidence toward the accuracy of these perceptions. The public has greater support for automated flight with pilots onboard to monitor the system, so understanding the factors that drive the public’s attitudes toward gender in piloted flight are important to early stage UAM adoption. McCarthy, Budd,
and Ison (2015) observe that women face greater barriers than do men in flight sector participation.15 In a passenger survey conducted in 2012, 51% of respondents reported that they were less likely to trust a
woman pilot, and 32% believed men would be ‘more skilled’ as pilots than women (Anderson, 2013).16 Both
Walton and Politano (2014)17 found that male pilots were more likely to hold a negative view of female pilots, unless they frequently shared flight decks with women. Walton and Politano note that studies looking
at aircraft accidents, but did not find differences in accident rates by gender.17
Rice et al. (2015) developed a willingness-to-fly index18 that was used by Mehta et al., (2017) to examine
the ways different cultural considerations impact gender biases.12 Metha et al. (2017) found that male In-
dian passengers were less willing to fly with two female pilots than were male American passengers.12 Furthermore, Indian males had less trust in young female flight controllers than did male Americans (Mehta
et al., 2016).14
These studies show that women face greater difficulties in working as pilots and gaining acceptance as pilots. Thus, female pilots operating UAM or serving as remote pilots may confront cultural and stereotype barriers that could impact UAM adoption. McCarthy, Budd, and Ison (2015) recommend a focus on gen-dered leadership differences and positive female representations as potential future solutions.
Our study on the potential societal barriers of UAM fills a number of key gaps in the literature. First, UAM differs markedly from both commercial and general aviation in terms of potential use cases, aircraft, trip types and distances, etc. Additionally, UAM also differs from unmanned aerial vehicles and drones (e.g., size of aircraft, use cases, the role pilotless technologies when no passengers are on board, and percep-tions about privacy). While these studies from other aviation disciplines can provide a baseline understand-ing that can help shed light on potential barriers with new aviation technologies, such as UAM, actual soci-etal acceptance could vary. Additionally, methods from these studies such as the willingness to fly scale from Rice et al. 2015 were used to help develop the survey employed as part of this study. Specific methods from the literature applied in this study are discussed in the survey methodology discussion that follows.
2.2 Focus Groups
2.2.1 Methodology
Two focus groups were conducted in June 2018 to gain insight on the potential societal barriers associated with Urban Air Mobility from both the user and non-user perspectives. One focus group was held in Arling-ton, Virginia and a second focus group was held in El Segundo, California. All focus groups were guided by protocols designed to probe potential willingness to use Urban Air Mobility and potential opposition from the non-user perspective in terms of noise, visual aesthetics, safety concerns, and other potential consid-erations. The study design sought the opinions of those who could be directly exposed to UAM as passen-gers as well as non-users on the ground exposed to the impacts of vertical take-off and land (VTOL) aircraft flying overhead in urban areas. Prior to commencing each focus group, participants were asked to complete a pre-focus group questionnaire to provide basic demographic and travel behavior information. A copy of
15 McCarthy, F., Budd, L., & Ison, S. (2015). Gender on the flightdeck: Experiences of women commercial airline pi-lots in the UK. Journal of air transport management, 47, 32-38.
16 Anderson, S. (2013, November 12). Who do you trust more, male or female pilots? Retrieved November 6, 2018, from https://www.sunshine.co.uk/news/who-do-you-trust-more--male-or-female-pilots--105.html
17 Walton, R. O., & Politano, P. M. (2014). Gender-related perceptions and stress, anxiety, and depression on the flight deck. Aviation Psychology and Applied Human Factors.
18 Rice, S., Mehta, R., Dunbar, V., Oyman, K., Ghosal, S., Oni, M. D., & Oni, M. A. (2015, January). A valid and relia-ble scale for consumer willingness to fly. In Proceedings of the 2015 Aviation, Aeronautics, and Aerospace Interna-tional Research Conference.

NASA UAM Market Study – The Potential Societal Barriers of Urban Air Mobility
9 | P a g e
the pre-focus group questionnaire and full protocol used for the focus groups can be found in Error! Ref-erence source not found.. The focus group protocol followed the following structure:
• Pre-focus Group Questionnaire
• Familiarity with Air Taxi and Urban Air Mobility
• Thoughts and Impressions about Urban Air Mobility
• Automation and Electrification
• Ownership versus Sharing
• Security and Safety
• Privacy
• Concerns as a Non-User
2.2.2 Pre-Focus Group Questionnaire and Participant Demographics
The research team collected basic participant demographic data including: household income, highest level of educational attainment, age, race/ethnicity, and gender of focus group participants. In general, both focus groups had a small number of very low-income participants with household incomes of less than $15,000 per year and larger numbers of middle-to-upper income participants earning more than $75,000 per year. Both focus groups were skewed toward the upper middle-income demographic.
In terms of highest level of educational attainment, 60% of all focus group participants had a college degree (56% and 67% in Los Angeles and Washington, D.C., respectively). Among all focus group participants, there was an approximately equal distribution of participants with a high school diploma or vocational training and those with some post-graduate studies. Overall, focus group participation reflected a younger demographic. Forty-seven percent of all participants (56% and 33% in Los Angeles and Washington, D.C., respectively) were between 18 and 29 years old. The average age across all focus group participants was 36.2 (34.0 and 40.2 for Los Angeles and Washington, D.C., respectively).
A slightly larger percentage of participants were women (60%) than men (40%). While there was an approximate equal distribution of men and women in the Los Angeles focus group, the Washington, D.C. focus group was predominantly female with only one male participant. The race and ethnicity of focus group participants differed notably across both cities. In Los Angeles, 67% of the focus group participants were Caucasian compared to just 17% in Washington, D.C. In Washington, D.C., 50% of the focus group participants were African-American compared to none in Los Angeles. Detailed demographic information of all focus group participants can be found in
Table 1 below.
Table 1: Focus Group Participant Demographics
Focus Group Location Total
HOUSEHOLD INCOME
Los Ange-les
(n=9)
Washington, D.C. (n=6)
Both Locations (n=15)
Less than $15,000 11% 33% 20%
$15,000 to $24,999 0% 0% 0%
$25,000 to $34,999 0% 0% 0%
$35,000 to $49,999 0% 0% 0%
$50,000 to $74,999 0% 33% 13%
$75,000 to $99,999 22% 17% 20%
$100,000 to $149,999 22% 17% 20%
$150,000 to $199,999 11% 0% 7%

NASA UAM Market Study – The Potential Societal Barriers of Urban Air Mobility
10 | P a g e
$200,000 or more 11% 0% 7%
Decline to Answer 22% 0% 13%
HIGHEST LEVEL OF EDUCATIONAL ATTAINMENT
Less than high school 0% 0% 0%
High school/GED 0% 17% 7%
Vocational training 11% 0% 7%
Some college 11% 17% 13%
Associates degree 0% 0% 0%
Bachelor’s degree 56% 67% 60%
Some graduate school 11% 0% 7%
Post-Graduate Degree 11% 0% 7%
Decline to Answer 0% 0% 0%
AGE
18-29 56% 33% 47%
30-39 11% 0% 7%
40-49 22% 17% 20%
50-59 0% 33% 13%
60-69 11% 0% 7%
70 years or older 0% 0% 0%
Decline to Answer 0% 17% 7%
Average Age 34.0 40.2 36.2
RACE/ETHNICITY
Caucasian 67% 17% 47%
African-American 0% 50% 20%
Hispanic/Latino 11% 0% 7%
Asian/Pacific Islander 11% 33% 20%
Other/Multi-Racial 11% 0% 7%
Decline to Answer 0% 0% 0%
GENDER
Male 56% 17% 40%
Female 44% 83% 60%
Decline to Answer - - -
Note: Percentages may not add up to 100% due to rounding.
Prior to commencing each focus group, researchers administered a questionnaire to focus group partici-pants to collect general travel behavior information, travel preferences, and attitudes and perceptions to-ward aviation and flying. The questionnaire first asked participants about their household size, the number of drivers, and the number of vehicles in their family. The average household size in the Los Angeles and Washington, D.C. focus groups were 3.2 and 3.5 persons, receptively. The average number of drivers per

NASA UAM Market Study – The Potential Societal Barriers of Urban Air Mobility
11 | P a g e
household in Los Angeles and Washington, D.C. was 2.8 in both focus groups. Vehicle ownership was slightly higher in Los Angeles with 1.8 vehicles per household compared to 1.7 in Washington, D.C. House-hold ownership was much higher among Southern California participants compared to Washington, D.C. Two-thirds of Los Angeles focus group participants owned their own home compared to all participants in Washington, D.C. who rent their home. One third of focus group participants in both locations had children living in their households.
Focus group participants were asked what factors they consider when picking a travel mode. Eighty-seven percent of participants (n=13 of 15) consider cost, and 80% (n=12 of 15) consider convenience as the top factors for selecting a transportation mode. Sixty percent of participants (n=9 of 15) consider travel time and 40% (n=6 of 15) consider amenities, such as the availability of radio or WiFi. Forty-seven percent (n=7 of 15) and 13% (n=2 of 15) considered environmental impact and safety, respectively. One person per focus group also considered the number of stops or transfers, as well as exercise, when selecting a trans-portation mode.
Focus group participants were also asked about their experiences flying including questions about:
• The types of aircraft or helicopters they have flown;
• How often they fly;
• The factors that discourage them from flying;
• Factors participants like and dislike about flying; and
• Factors that would cause them to consider flying more in the future.
Participants were asked, if they had ever flown in a large aircraft (41+ passengers), a small aircraft (1-40 passengers), or a helicopter. All participants (n=15 of 15) had flown in a large aircraft, and 87% (n=13 of 15) had flown in a small aircraft. Only 26% (n=4 of 15) had flown in a helicopter. The majority of participants fly at least once a year on average. Forty-seven percent (n=7 of 15) indicated flying an average of 1 to 6 times per a year, and 20% flew an average of 6 to 12 times per a year (n=3 of 12). One participant indicated that they flew at least monthly. Yet, despite a large number of frequently flyers, 27% (n=4 of 15) flew less than once a year, on average.
Cost was overwhelmingly cited as the top reason for not flying more often. Eighty percent of participants indicated that the cost of flying limited their frequency of air travel (n=12 of 15). Forty-seven percent also indicated that long lines discouraged participants from flying more frequently (n=7 of 15). Twenty-seven percent also indicated that inconvenience was a limiting factor to flying more often. In-flight entertainment, the on-board experience, and the ability to travel and get away were the factors participants liked about flying the most. Uncomfortable seats, vibrations, noise, and turbulence were cited as the greatest flying dislikes. Eighty-six percent of participants indicated that more affordable fares would entice them to travel more frequently (n=13 of 15). Sixty percent and 53% of all participants stated that easier access to the airport and shorter lines would also entice them to flying more frequently.
Finally, focus group participants were asked to share some basic information on their preferred travel mode for work travel, non-work travel, accessing a rail station, and accessing an airport. Walking and driving were each cited as the preferred travel mode overall by 60% of all participants. Public transportation (67%) and driving (78%) were cited as the most preferred travel modes in Washington, D.C. and Los Angeles, respec-tively, reflecting differences in the built environment and public transportation accessibility in each of these regions.
Overall, ridesourcing/transportation network companies (TNCs), such as Lyft and Uber, were cited as one of the preferred travel modes for non-work trips by 60% of participants across both focus groups (n=9 of 15). Driving and walking were also preferred modes by 47% of all participants (n=7 of 15). Taking ridesourc-ing/TNCs was cited as a preferred travel mode for accessing a rail station (53%, n=8 of 15) and airports (60%, n=9 of 15), respectively. Carpooling to the airport was also a commonly preferred travel mode by 40% of participants (n=6 of 15).

NASA UAM Market Study – The Potential Societal Barriers of Urban Air Mobility
12 | P a g e
2.2.3 Familiarity with Air Taxi and Urban Air Mobility
Focus group participants were asked if they were familiar with the term “air taxi.” In Washington, D.C., 50% of participants (n=3 of 6) were familiar with the term. In Los Angeles, 44% of participants (4 of 9) had heard the term. Those that were familiar with the term compared it to an on-demand helicopter service, similar to New York City’s BLADE, although no particular brands were mentioned. A few people who were unfamiliar with the term and learning about air taxi services for the first time compared it to a water taxi service. Many people who were new to the term immediately saw opportunities for short distance air travel that would be faster than existing ground transportation. A number of focus group participants were also confused by the term. These individuals were confused because they were not sure how far along the technology was in development and viewed “air taxis” and “flying cars” as a future concept from science fiction books and movies. In the Los Angeles focus group, one participant had heard the term Urban Air Mobility from a news story about Uber Elevate in the Los Angeles market.
2.2.4 Thoughts and Impressions about Urban Air Mobility
At this point in each of the focus groups, participants were presented with a video that explained the UAM concept along with a written description. The focus group moderator then answered clarifying participant questions about the concept before proceeding with the focus group protocol. Initially, participants asked for clarification on whether the aircraft take off and land similar to conventional airplanes and for additional information on how they fly, as well as on VTOL. Participants also wanted to know about how many people could be flown in the UAM aircraft, who pilots them or are they automated, how much noise they generate, and if they are safe. Other concerns raised included the type of training pilots receive and concerns about inclement weather. There were also questions about security and baggage handling. A few clarifying an-swers were provided. Many of these questions were explored in greater detail as the focus groups pro-gressed.
After presenting the UAM concept to participants, the moderator then facilitated a discussion to gauge initial reactions to the concept, likes, and dislikes. Initial reactions to the concept included:
• Appreciation for not having to drive or sit in traffic;
• Convenience;
• Time savings and the ability to go farther distances faster than driving or public transportation;
• The ability to enjoy scenic views while flying; and
• The concept just “sounds cool.”
However, not all initial reactions to the concept was positive. Common negative initial reactions included:
• The service looked expensive;
• Concern that the service will operate similar to a bus (with multiple take-off and landings for a single passenger trip);
• Impracticality for short distance travel;
• Inconvenient number of transfers as the concept assumes that you have to take a first-and-last mile connection using another travel mode to get to or from a vertiport;
• Demand would exceed available supply leading to high costs, long waits, or both;
• Limitations on landing locations;
• Low-level flight could be unsafe or visually undesirable;
• Greater safety risks associated with accidents than with ground transportation; and
• Potentially noisy in urban areas.
Fourteen out of 15 (93%) focus group participants stated that they were interested in using UAM, if it was safe. A few participants said they would only use the service, if it saved them time and money. A few participants also stated that they would not want to be early adopters of the technology and would want to

NASA UAM Market Study – The Potential Societal Barriers of Urban Air Mobility
13 | P a g e
be sure that the concept had been tested and proven safe. A few focus group participants also said they would use the service, not for time or monetary savings, but to select more attractive routing with scenic views (e.g., flying along the coast vs. driving on a more inland highway).
Participants were also asked how they would use UAM. In most cases, participants were interested in using it to replace longer vehicular trips in excess of one hour of driving time. These participants stated that they would prefer to use UAM to travel between short interregional destinations, such as Washington, D.C. to Baltimore and Los Angeles to San Diego. In general, there was a lot of support for the concept to replace existing short air trips because of the inconvenience of going to the airport. Some participants stated that they would use UAM to avoid vehicle congestion, however, only if time savings made up for the inconven-ience of multi-modal transfers.
There was some disagreement among participants over whether they would use UAM for work or leisure trips. In general, most participants said that if the service were expensive, they would use it for periodic leisure trips and if it were affordable, they would use it for regular work trips. In general participants were hopeful that the cost would be low enough that they could replace existing public transit and Uber/Lyft trips with UAM. A few stated that if the service were expensive, they would treat themselves and use the service if they got a bonus or a good performance rating at work. There was a perception that this was a service for business executives, but participants were still interested in the service because of its convenience. A few expressed enthusiasm regarding the potential to work while flying on their work commute.
When asked about price, participants provided a variety of price comparisons. A number of people indicated that they would pay 10-20% more than an existing Lyft or Uber ride for the same trip. A number of people also said they were willing to pay a $1 to $2 per mile fee in any direction, or $25 to $40 per one-way trip, to go from the urban core to a suburb or edge city at the region’s periphery. Only one participant in each focus group stated that she would not use UAM under any circumstances. She said that she wanted to use ground transportation for emergency access/egress.
2.2.5 Automation and Electrification
Next, participants were introduced to concepts about piloted, remote piloted, and automated aircraft. Par-ticipants raised a number of questions about pilot training and whether pilots would be held to the same standard of training as existing airline pilots. There was also some apprehension about piloted and auto-mated UAM. Participants concerned with piloted concepts were concerned about road rage and potential aircraft misuse. Participants concerned with automated concepts expressed concern about safety, cyber-security, and cyberterrorism.
Generally, participants overwhelmingly preferred piloted UAM. However, in both focus groups, a handful of participants were open to automated or remotely piloted UAM operations assuming that this would result in lower costs. In general, there was a strong sense that piloted and automated UAM aircraft should operate and co-exist in the same ecosystem, providing passengers the choice to select their preference and receive a discount, if they opted for a remotely piloted or automated service.
In general, participants preferred the idea of electric powered versus gasoline power aircraft. However, participants also expressed a strong preference for longer inter-regional trips that are currently only acces-sible with gasoline powered aircraft due to the present range limitations of eVTOL aircraft.
2.2.6 Ownership Versus Sharing
There was some interest among focus group participants in private fractional ownership of UAM aircraft among family members or sharing a privately-owned aircraft within a household. There was a general per-ception that if the aircraft were “affordable” (e.g., less than $100,000), it could be financed or leased, and it required less training than a traditional pilots license, then ownership would be preferable. A few people expressed concern about how to insure privately owned or fractionally owned aircraft.
There was also some interest among a handful of participants in owning and piloting eVTOL aircraft for-hire, similar to Lyft and Uber drivers driving paying passengers in their private vehicles. Interestingly, one person did not want to own an eVTOL aircraft for personal use but only to offer for-hire flights for monetary compensation. Focus group participants also shared a number of concepts for how UAM could be shared. A few suggested that an aircraft could be shared by an apartment complex with a smaller scale landing pad for individual or a few aircraft.

NASA UAM Market Study – The Potential Societal Barriers of Urban Air Mobility
14 | P a g e
In addition to sharing the aircraft (as an asset), participants were also asked about their willingness to share a flight with other passengers. In general, most participants were willing and assumed they would be sharing a flight with other passengers with some conditions. These included:
• A discount for sharing a flight with passengers they do not know (similar to Lyft Shared rides and uberPOOL);
• A rating process to rate how pleasant it is to fly with other passengers using the service; and
• A security screening process for all passengers.
2.2.7 Security and Safety
In both focus groups, the discussion about willingness to share a flight with other passengers that a traveler would not know in advance led to a lively discussion about safety and security. In general, focus group participants viewed UAM very differently from flying with unfamiliar passengers on board a commercial aircraft for a few key reasons including:
• Smaller aircraft and passengers are unable to get up, if they feel uncomfortable or relocate to an-other seat or section of the aircraft; and
• Fewer crew members makes passengers and aircrew more vulnerable to safety incidents.
In general, participants assumed that UAM would most likely be piloted. However, participants expressed concern that the aircraft could be hijacked due to its small size and perceived lack of a separation between the pilot and passengers. As such, many participants expressed a strong preference for a pilot compartment separate from the passenger compartment. Participants also expressed concern that passengers on board would cause harm to other passengers. Concerns about sexual assault were raised numerous times, par-ticularly in an automated scenario without any flight crew on board. Interestingly, many focus group partic-ipants said they were unwilling to consider using any form of automated mobility (e.g., shared automated vehicles) for this very reason. As such, focus group participants expressed a strong preference for an “au-thority figure” on board, such as a flight attendant or other employee who could prevent and deter violence against passengers or intervene if an incident occurred on board. In the absence of a flight attendant or pilot on board, participants expressed a strong desire for an emergency button to abort the flight and land at the nearest vertiport, if they felt uncomfortable for any reason.
Most importantly, there was near unanimity that passengers should have to undergo some type of security screening before boarding. However, there was consensus that this screening process would have to be free of any lines (e.g., passengers just walk through a metal detector). Participants likened this screening process to walking through a metal detector at a museum or government building. There was unanimity that any security screening and boarding process should not take longer than 10 minutes from vertiport arrival to taking a seat in the aircraft, and the entire process had to be seamless all of the time. Specific to the airport shuttle market, focus group participants preferred having Transportation Security Administration (TSA) approved screening at the vertiport with an arrival on the airside of the airport terminal. There was also consensus that passengers should have to undergo prescreening to fly to ensure that unsafe or disre-spectful passengers would not be permitted on board.
With respect to safety, all participants were willing to share their weight information for the purposes of safety and proper aircraft weight-and-balance. When asked about safety, participants held the aviation industry and the Federal Aviation Administration (FAA) with a high level of regard and trust. Participants generally assumed that if aircraft and pilots were FAA certified that UAM would be safe. There was, how-ever, concern about sabotage or terrorism from outside the aircraft, such as “lasing” (using lasers to harm the pilot’s or passengers’ vision). Due to the low-level flight and the volume of planes, participants wanted safety equipment, such as anti-lasing glass and aircraft parachutes, in case of a mid-flight malfunction. Interestingly, participants also expressed a high dislike for pre-flight safety briefings. Given the potential frequency for UAM use, participants did not want to receive a pre-flight safety briefing every time they fly. Instead, they preferred an online course or an annual or semi-annual course that one could take in person that certifies them to flying.

NASA UAM Market Study – The Potential Societal Barriers of Urban Air Mobility
15 | P a g e
2.2.8 Privacy
In general, most passengers wanted to enjoy scenic and panoramic views while flying. However, there was some concern expressed about privacy, both from the perspective of passengers and non-users. For pas-sengers, participants expressed concern that aircraft windows would make them feel “too exposed.” There was concern that they would not feel secure or people on the ground would be able to see into the aircraft. As such, participants expressed a strong preference for aircraft tinting.
Additionally, participants expressed concern that people on the ground would have their privacy invaded due to urban aviation operations. There was a strong preference by participants to impose minimum flight altitudes that would limit visibility of individual people on the ground and prohibitions against flight over single-family residential neighborhoods. As such, many participants indicated that urban aviation should not necessarily be allowed to engage in direct point-to-point travel but should have to fly over existing highways and arterial roadways.
2.2.9 Concerns as a Non-User
In addition to privacy, there were some concerns raised from the perspective of the non-user. Primary concerns raised from the non-user perspective included: noise, followed by privacy, general safety, aesthetics, and pollution. In general, the technology was perceived to be safe, if pilots and aircraft received FAA certification and safety measures were incorporated into aircraft designs to safely abort flights in the event of an emergency. Of the concerns raised, the potential for noise was one of the most commonly raised concerns. However, participants were less concerned about individual aircraft noise and more concerned about total ambient aircraft noise from multiple aircraft operating in close proximity. Participants indicated a preference for limiting aircraft operations overnight, particularly in residential neighborhoods. In general, the concerns raised from the perspective of the non-user were lower than the potential concerns as a user. However, education, outreach, and proof of a safe UAM concept is key.
Key
Findings
(Focus Groups)
Key findings uncovered during the Los Angeles and Washington, D.C. focus groups in-clude:
• Perceptions that UAM is a premium service and a desire for the service to be offered at an affordable and accessible price point with only a minimal cost dif-ferential above ground transportation modes;
• A strong preference for longer trips including intraregional trips in excess of a one-hour driving time in contrast to short interregional trips;
• A strong preference for piloted, electric aircraft;
• An expectation of cost savings and an on-board authority figure on board with remote piloted and automated aircraft concepts;
• Willingness to share flights with other passengers and to share ownership of the aircraft, which suggests the need for more research into peer-to-peer busi-ness models;
• The need for an expedited passenger screening process for boarding passen-gers;
• Potential privacy concerns for both users and non-users; and
• General concerns about aggregate noise from multiple aircraft operating in close proximity and safety concerns associated with on board passengers and external sabotage.

NASA UAM Market Study – The Potential Societal Barriers of Urban Air Mobility
16 | P a g e
2.3 General Population Survey
2.3.1 Methodology
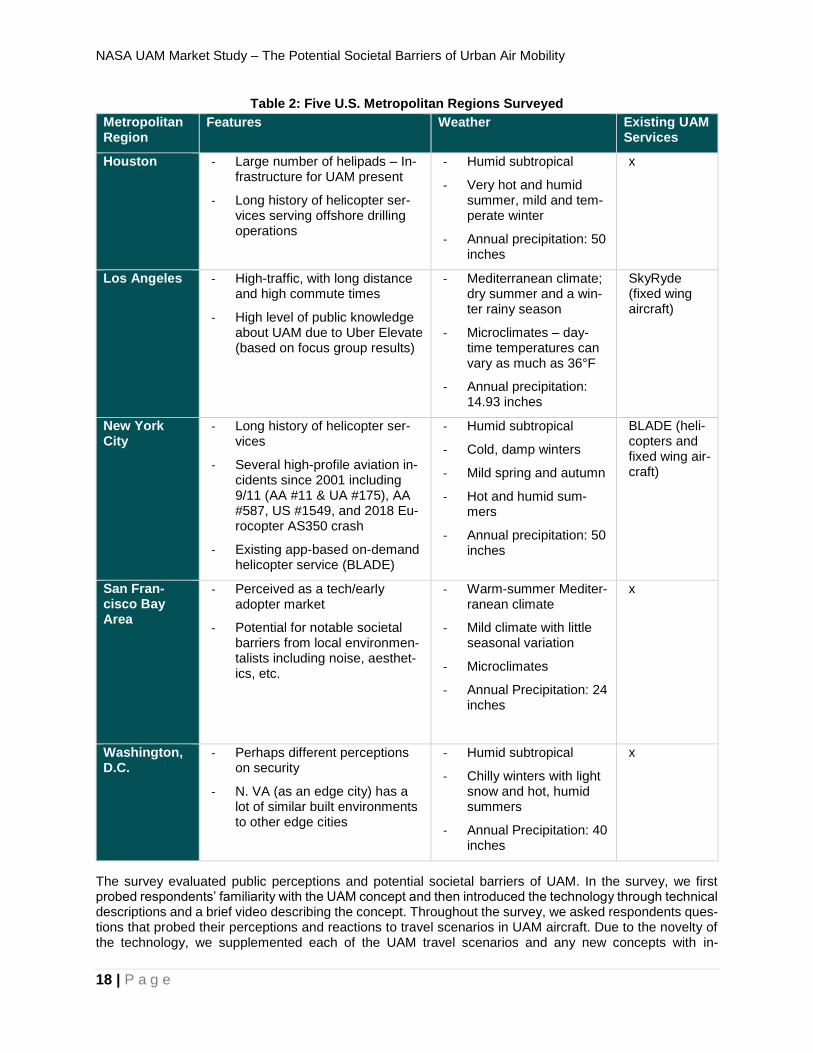
In August 2018, we conducted an exploratory survey of approximately 1,700 respondents in five U.S. cities. We created the general population survey and distributed it to a survey panel using the online survey platform Qualtrics, and survey participants were compensated after completion. Potential survey participants were screened based on their gender to obtain a more uniform distribution of male and female respondents. The survey participants were also screened based on the metropolitan region in which they resided. The completed survey target included approximately 350 respondents each from Houston, Los Angeles, New York, the San Francisco Bay Area, and Washington, D.C. For each region, we aimed to collect responses that were a fair approximation of the demographic distribution of the general population of each of the metropolitan areas in the study. The metropolitan regions were selected to capture variability in demography, geography, weather patterns, traffic characteristics, and the built environment (e.g., density, walkability, public transit accessibility), as well as the presence of past or present air taxi services. Each of the cities also has unique features that potentially make them more receptive or resistant to UAM technology, detailed in

NASA UAM Market Study – The Potential Societal Barriers of Urban Air Mobility
17 | P a g e
Table 2.
NASA UAM Market Study – The Potential Societal Barriers of Urban Air Mobility
18 | P a g e
Table 2: Five U.S. Metropolitan Regions Surveyed Metropolitan Region
Features Weather Existing UAM Services
Houston - Large number of helipads – In-frastructure for UAM present
- Long history of helicopter ser-vices serving offshore drilling operations
- Humid subtropical
- Very hot and humid summer, mild and tem-perate winter
- Annual precipitation: 50 inches
x
Los Angeles - High-traffic, with long distance and high commute times
- High level of public knowledge about UAM due to Uber Elevate (based on focus group results)
- Mediterranean climate; dry summer and a win-ter rainy season
- Microclimates – day-time temperatures can vary as much as 36°F
- Annual precipitation: 14.93 inches
SkyRyde (fixed wing aircraft)
New York City
- Long history of helicopter ser-vices
- Several high-profile aviation in-cidents since 2001 including 9/11 (AA #11 & UA #175), AA #587, US #1549, and 2018 Eu-rocopter AS350 crash
- Existing app-based on-demand helicopter service (BLADE)
- Humid subtropical
- Cold, damp winters
- Mild spring and autumn
- Hot and humid sum-mers
- Annual precipitation: 50 inches
BLADE (heli-copters and fixed wing air-craft)
San Fran-cisco Bay Area
- Perceived as a tech/early adopter market
- Potential for notable societal barriers from local environmen-talists including noise, aesthet-ics, etc.
- Warm-summer Mediter-ranean climate
- Mild climate with little seasonal variation
- Microclimates
- Annual Precipitation: 24 inches
x
Washington, D.C.
- Perhaps different perceptions on security
- N. VA (as an edge city) has a lot of similar built environments to other edge cities
- Humid subtropical
- Chilly winters with light snow and hot, humid summers
- Annual Precipitation: 40 inches
x
The survey evaluated public perceptions and potential societal barriers of UAM. In the survey, we first probed respondents’ familiarity with the UAM concept and then introduced the technology through technical descriptions and a brief video describing the concept. Throughout the survey, we asked respondents ques-tions that probed their perceptions and reactions to travel scenarios in UAM aircraft. Due to the novelty of the technology, we supplemented each of the UAM travel scenarios and any new concepts with in-
NASA UAM Market Study – The Potential Societal Barriers of Urban Air Mobility
19 | P a g e
fographics and short descriptions. Examples of topics explored in the survey included whether: 1) respond-ents would prefer automated, remote piloted, or piloted UAM; 2) the presence of other passengers or a flight attendant on board impacted their willingness to use the service; and 3) respondents would prefer for-hire services or to own their own UAM aircraft. The survey also sought to identify concerns from a non-user perspective such as noise or safety concerns (from the perspective of a person on the ground).
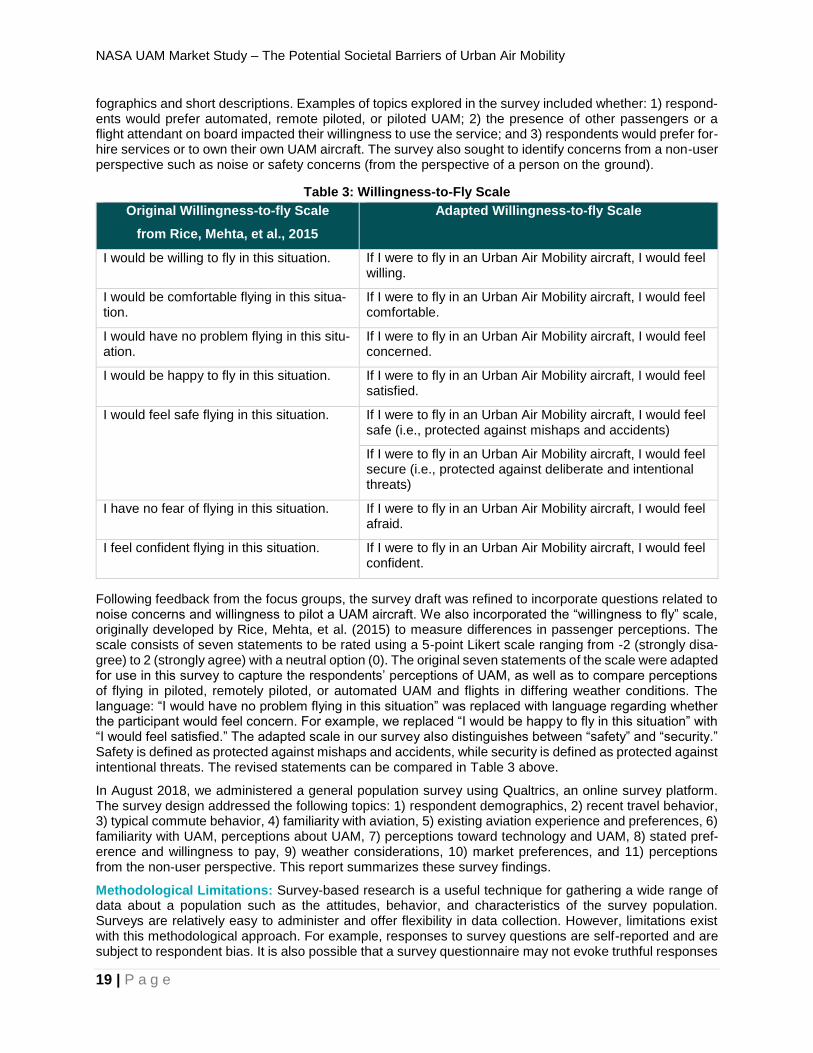
Table 3: Willingness-to-Fly Scale Original Willingness-to-fly Scale
from Rice, Mehta, et al., 2015
Adapted Willingness-to-fly Scale
I would be willing to fly in this situation. If I were to fly in an Urban Air Mobility aircraft, I would feel willing.
I would be comfortable flying in this situa-tion.
If I were to fly in an Urban Air Mobility aircraft, I would feel comfortable.
I would have no problem flying in this situ-ation.
If I were to fly in an Urban Air Mobility aircraft, I would feel concerned.
I would be happy to fly in this situation. If I were to fly in an Urban Air Mobility aircraft, I would feel satisfied.
I would feel safe flying in this situation. If I were to fly in an Urban Air Mobility aircraft, I would feel safe (i.e., protected against mishaps and accidents)
If I were to fly in an Urban Air Mobility aircraft, I would feel secure (i.e., protected against deliberate and intentional threats)
I have no fear of flying in this situation. If I were to fly in an Urban Air Mobility aircraft, I would feel afraid.
I feel confident flying in this situation. If I were to fly in an Urban Air Mobility aircraft, I would feel confident.
Following feedback from the focus groups, the survey draft was refined to incorporate questions related to noise concerns and willingness to pilot a UAM aircraft. We also incorporated the “willingness to fly” scale, originally developed by Rice, Mehta, et al. (2015) to measure differences in passenger perceptions. The scale consists of seven statements to be rated using a 5-point Likert scale ranging from -2 (strongly disa-gree) to 2 (strongly agree) with a neutral option (0). The original seven statements of the scale were adapted for use in this survey to capture the respondents’ perceptions of UAM, as well as to compare perceptions of flying in piloted, remotely piloted, or automated UAM and flights in differing weather conditions. The language: “I would have no problem flying in this situation” was replaced with language regarding whether the participant would feel concern. For example, we replaced “I would be happy to fly in this situation” with “I would feel satisfied.” The adapted scale in our survey also distinguishes between “safety” and “security.” Safety is defined as protected against mishaps and accidents, while security is defined as protected against intentional threats. The revised statements can be compared in Table 3 above.
In August 2018, we administered a general population survey using Qualtrics, an online survey platform. The survey design addressed the following topics: 1) respondent demographics, 2) recent travel behavior, 3) typical commute behavior, 4) familiarity with aviation, 5) existing aviation experience and preferences, 6) familiarity with UAM, perceptions about UAM, 7) perceptions toward technology and UAM, 8) stated pref-erence and willingness to pay, 9) weather considerations, 10) market preferences, and 11) perceptions from the non-user perspective. This report summarizes these survey findings.
Methodological Limitations: Survey-based research is a useful technique for gathering a wide range of data about a population such as the attitudes, behavior, and characteristics of the survey population. Surveys are relatively easy to administer and offer flexibility in data collection. However, limitations exist with this methodological approach. For example, responses to survey questions are self-reported and are subject to respondent bias. It is also possible that a survey questionnaire may not evoke truthful responses
NASA UAM Market Study – The Potential Societal Barriers of Urban Air Mobility
20 | P a g e
from the sample population (Ponto, 2015). Another possible source of error could occur due to priming and survey questions must be carefully ordered and worded to prevent influencing how people respond to subsequent questions. Finally, it is challenging for individuals to respond to an innovation without having direct experience with it. This impacts a respondent’s ability to answer questions based upon limited to no experiential understanding. Our survey results likely reflect this limitation. In the future, we recommend conducting a survey with early adopters or using a flying simulator, for instance.
2.3.2 Respondent Demographics
Our survey collected basic demographic information of respondents including: household income, educa-tion, age, race/ethnicity, gender, and type of housing. Table 4 below provides a summary of each of these demographic categories across all respondents as well as disaggregated per city. Table 4 also provides the 2016 American Community Survey (ACS) data as a reference point for the demographic distribution of each city.
In general, the respondents represented the distribution of household income levels across the cities, with slight underrepresentation of the highest income brackets (respondents with more than $150,000 in house-hold income). Across the cities, the respondents of the San Francisco Bay Area and New York tended to fall into higher income brackets. In terms of educational attainment, the respondents were skewed towards those who had attained a bachelor’s or graduate degree (36% with a bachelor’s degree and 32% with a graduate degree or currently in graduate school). Only 1% of the respondent population had less than a high school degree, while the average across the cities in the 2016 ACS survey was closer to 16%.
Overall, the respondent population reflected the 2016 ACS age distribution. The distribution is slightly bi-ased toward a younger demographic (those 25 to 34 years of age), but there is also a slight overrepresen-tation of respondents in the 65 to 74 age group (17% in the survey population vs 7% in the general popu-lation). Los Angeles was skewed more heavily towards a younger population, where 44% of the respond-ents were between 18 to 34 years of age. With respect to race and ethnicity, approximately 55% of re-spondents were White/Caucasian. Hispanics or Latinos were underrepresented by the survey population at approximately 10% of respondents. In Houston and Los Angeles, this underrepresentation was a bit more prominent. For example, Los Angeles has a population that is 45% Hispanic or Latino, but only 15% of survey respondents were Hispanic or Latino. Across the entire sample of survey respondents, a slightly larger percentage of women (57%) participated in the survey than men (43%). For housing, respondents in New York tended to live in the highest density housing, with 77% living in buildings with more than 10 units. Respondents in Houston lived in the lowest density housing, with 61% living in detached single-family homes.

NASA UAM Market Study – The Potential Societal Barriers of Urban Air Mobility
21 | P a g e
Table 4: Demographic Data
HOUSEHOLD INCOME 2016 ACS Survey 2016 ACS Survey 2016 ACS Survey 2016 ACS Survey 2016 ACS Survey 2016 ACS Survey
Less than $10,000 6% 5% 6% 6% 6% 3% 7% 4% 5% 8% 4% 6%
$10,000 - $14,999 4% 4% 4% 5% 5% 3% 5% 5% 4% 4% 2% 2%
$15,000 - $24,999 8% 8% 10% 6% 9% 7% 9% 9% 7% 10% 5% 6%
$25,000 - $49,999 18% 16% 22% 20% 21% 13% 18% 16% 15% 18% 14% 13%
$50,000 - $74,999 16% 16% 17% 22% 16% 14% 15% 14% 14% 13% 15% 17%
$75,000 - $99,999 12% 14% 12% 14% 12% 14% 12% 18% 12% 13% 13% 12%
$100,000 - $149,999 16% 13% 15% 12% 15% 14% 16% 15% 18% 12% 20% 14%
$150,000 - $199,999 8% 7% 7% 4% 7% 9% 8% 8% 10% 6% 12% 8%
$200,000 or more 11% 9% 8% 5% 9% 13% 11% 5% 16% 8% 15% 11%
EDUCATION 2016 ACS Survey 2016 ACS Survey 2016 ACS Survey 2016 ACS Survey 2016 ACS Survey 2016 ACS Survey
Less than high
school/Currently in High
School
16% 1% 18% 2% 12% 1% 21% 1% 10% 0% 14% 1%
High school graduate
(includes equivalency)
22% 13% 23% 19% 16% 8% 20% 11% 19% 18% 25% 8%
Some college, no
degree/Currently in
College
18% 5% 21% 6% 19% 4% 20% 7% 17% 6% 16% 2%
Associate's degree 7% 10% 7% 12% 7% 10% 7% 11% 6% 8% 7% 9%
Bachelor's degree 23% 36% 20% 34% 28% 44% 21% 37% 25% 28% 22% 37%
Graduate or professional
degree/Currently in post-
graduate degree
15% 32% 11% 26% 19% 31% 11% 30% 24% 36% 16% 39%
AGE 2016 ACS Survey 2016 ACS Survey 2016 ACS Survey 2016 ACS Survey 2016 ACS Survey 2016 ACS Survey
18 - 24 years 9% 9% 10% 11% 8% 7% 10% 10% 9% 13% 9% 7%
25 - 34 years 15% 26% 15% 26% 16% 18% 15% 34% 15% 25% 15% 23%
35 - 44 years 14% 18% 14% 13% 15% 18% 14% 17% 15% 19% 13% 17%
45 - 54 years 14% 13% 13% 10% 14% 16% 14% 9% 15% 13% 14% 13%
55 - 64 years 12% 16% 11% 16% 13% 20% 11% 10% 12% 15% 12% 17%
65 - 74 years 7% 17% 6% 18% 8% 18% 7% 15% 7% 12% 8% 17%
75+ years 6% 5% 4% 5% 6% 4% 6% 4% 5% 3% 6% 6%
RACE 2016 ACS Survey 2016 ACS Survey 2016 ACS Survey 2016 ACS Survey 2016 ACS Survey 2016 ACS Survey
Hispanic or Latino 30% 10% 36% 12% 22% 6% 45% 15% 15% 4% 24% 12%
White alone 41% 55% 38% 54% 41% 51% 30% 53% 47% 54% 48% 65%
Black or African American alone14% 16% 17% 20% 7% 3% 6% 16% 25% 31% 16% 8%
American Indian or
Alaska Native alone
0% 1% 0% 0% 0% 1% 0% 1% 0% 1% 0% 1%
Asian alone 13% 12% 7% 9% 25% 29% 15% 10% 10% 4% 11% 10%
Native Hawaiian or
Pacific Islander alone
0% 0% 0% 0% 1% 1% 0% 0% 0% 0% 0% 0%
Other alone 0% 2% 0% 3% 0% 2% 0% 2% 0% 2% 1% 1%
Two or more races 2% 2% 2% 1% 4% 4% 2% 1% 3% 3% 2% 2%
GENDER 2016 ACS Survey 2016 ACS Survey 2016 ACS Survey 2016 ACS Survey 2016 ACS Survey 2016 ACS Survey
Female 51% 57% 50% 63% 51% 50% 51% 59% 51% 56% 52% 57%
Male 49% 43% 50% 37% 49% 50% 49% 41% 49% 44% 48% 43%
HOUSING TYPE 2016 ACS Survey 2016 ACS Survey 2016 ACS Survey 2016 ACS Survey 2016 ACS Survey 2016 ACS Survey
Detached single-family home 46% 43% 63% 61% 50% 48% 37% 50% 50% 42% 46% 13%
Building/house with
fewer than 10 units
26% 19% 12% 12% 24% 26% 31% 22% 27% 24% 28% 9%
Building with between
10 and 100 units
23% 13% 20% 22% 21% 41%
Building with more than
100 units
14% 12% 5% 5% 12% 36%
Mobile home/RV/Trailer 1% 1% 5% 1% 2% 1% 1% 0% 1% 1% 1% 1%
New York City
27% 21% 25% 32% 22% 25%
Total Houston San Francisco Bay Area Los Angeles Washington, D.C.

NASA UAM Market Study – The Potential Societal Barriers of Urban Air Mobility
22 | P a g e
2.3.3 Familiarity with UAM
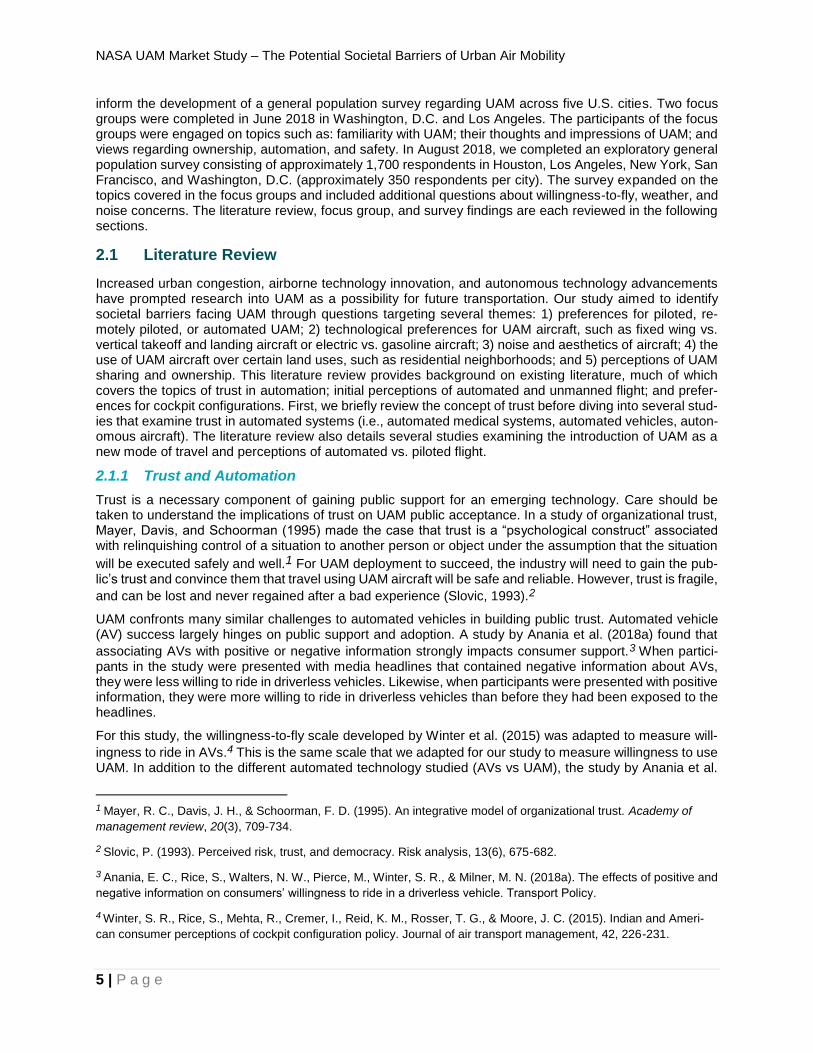
At the start of the survey, respondents were asked whether they were familiar with the concept of UAM. This question was asked before the survey and respondents were provided with a brief video and written description introducing the UAM concept. Only 23% of the respondents were familiar with the concept of UAM. Analyzing familiarity with UAM by demographic categories, we found that familiarity was slightly higher in Los Angeles (32%) than the other cities, possibly due to Uber Elevate announcing Los Angeles as one of the two first launch cities with plans to commence commercial operations in the region as soon as 2023. Men tended to be more familiar with UAM than women, at 30% and 19%, respectively. Age ap-peared to be correlated with familiarity with the concept, with Millennials and Gen Xers reporting higher levels of familiarity (Figure 2).
Figure 2: Survey responses to UAM familiarity
2.3.4 Travel Behavior
One of the objectives of this research project was to explore potential markets and future use cases for UAM. Examples of future use cases include: 1) air taxis, a service primarily used to access airports or 2) emergency travel, such as air ambulances. To inform this market analysis, respondents were asked a series of questions regarding their most recent non-commute trip. By targeting the most recent non-commute trip, the survey aimed to capture a glimpse into the travel behavior of the populations of each of the five U.S.
25% 24%
32%
16%20%
23%
58%65%
53%
70% 68%63%
17%11%
15% 13% 13% 14%
0%
10%
20%
30%
40%
50%
60%
70%
80%
Houston, N = 338
San Francisco BayArea,
N = 339
Los Angeles, N = 340
Washington, D.C., N = 341
New York City, N = 343
Total, N = 1702
Are you familiar with the concept of Urban Air Mobility?
Yes No I am not sure
31%36%
29%
14% 13% 12% 10%
56% 54%
63%68%
75%70% 72%
13% 10% 8%
18%12%
19% 18%
0%
10%
20%
30%
40%
50%
60%
70%
80%
Yes No I am not sure
NASA UAM Market Study – The Potential Societal Barriers of Urban Air Mobility
23 | P a g e
cities. Respondents were asked the purpose of their most recent trip, the modes used to travel to the des-tination, and the distance traveled of the trip.
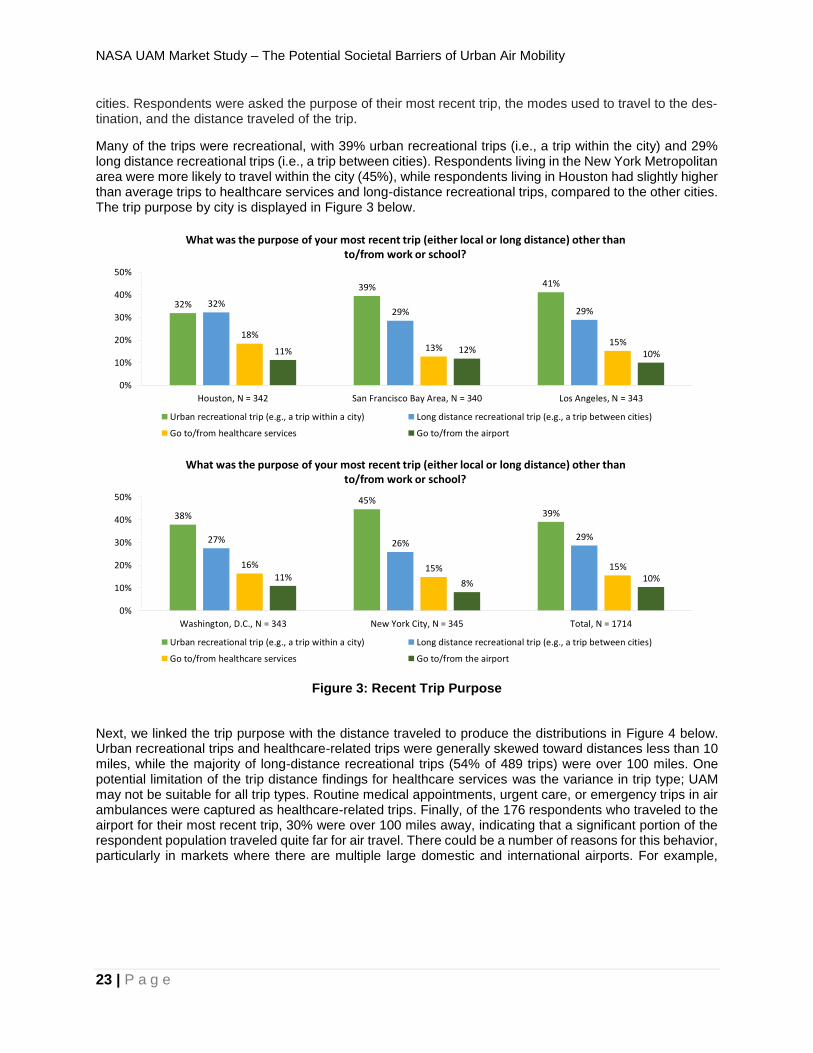
Many of the trips were recreational, with 39% urban recreational trips (i.e., a trip within the city) and 29% long distance recreational trips (i.e., a trip between cities). Respondents living in the New York Metropolitan area were more likely to travel within the city (45%), while respondents living in Houston had slightly higher than average trips to healthcare services and long-distance recreational trips, compared to the other cities. The trip purpose by city is displayed in Figure 3 below.
Figure 3: Recent Trip Purpose
Next, we linked the trip purpose with the distance traveled to produce the distributions in Figure 4 below. Urban recreational trips and healthcare-related trips were generally skewed toward distances less than 10 miles, while the majority of long-distance recreational trips (54% of 489 trips) were over 100 miles. One potential limitation of the trip distance findings for healthcare services was the variance in trip type; UAM may not be suitable for all trip types. Routine medical appointments, urgent care, or emergency trips in air ambulances were captured as healthcare-related trips. Finally, of the 176 respondents who traveled to the airport for their most recent trip, 30% were over 100 miles away, indicating that a significant portion of the respondent population traveled quite far for air travel. There could be a number of reasons for this behavior, particularly in markets where there are multiple large domestic and international airports. For example,
32%
39% 41%
32%29% 29%
18%
13%15%
11% 12% 10%
0%
10%
20%
30%
40%
50%
Houston, N = 342 San Francisco Bay Area, N = 340 Los Angeles, N = 343
What was the purpose of your most recent trip (either local or long distance) other than to/from work or school?
Urban recreational trip (e.g., a trip within a city) Long distance recreational trip (e.g., a trip between cities)
Go to/from healthcare services Go to/from the airport
38%
45%
39%
27% 26%29%
16% 15% 15%11%
8%10%
0%
10%
20%
30%
40%
50%
Washington, D.C., N = 343 New York City, N = 345 Total, N = 1714
What was the purpose of your most recent trip (either local or long distance) other than to/from work or school?
Urban recreational trip (e.g., a trip within a city) Long distance recreational trip (e.g., a trip between cities)
Go to/from healthcare services Go to/from the airport

NASA UAM Market Study – The Potential Societal Barriers of Urban Air Mobility
24 | P a g e
someone living in Northern Virginia may travel to Baltimore’s BWI for a cheaper fare or use a particular carrier rather than using their closest airport (i.e., Dulles or Regan National).
Figure 4: Most Recent Trip Distance
Figure 5 below displays the travel modes used to the most recent trip destination. The highest modal share for the most recent trip was driving, with approximately 60% of respondents using a car for the trip, followed by public transit at 31%. Sixteen percent of the trips were traveled by airplane. Houston was heavily skewed toward drivers (73%) with low public transit use (11%). Not surprisingly, New York City respondents were much less likely to drive (33%) and were skewed toward using public transit (54%). Respondents were presented a series of questions that we designed to capture their typical commute be-havior; these questions were based on the questions asked regarding the most recent non-commute trip. Respondents were asked to select the transportation modes they use to commute to work or school, how many days per week they commute, and the distance (one-way) of their commute. The typical commute distance was generally between 1 and 10 miles in all five cities. Driving (62%), public transit (56%), tele-commuting (54%), and walking (26%) were all popular modes for commuting. The percentages add up to more than 100%, as respondents could use more than one mode during their commute. For example, a respondent could have a multi-modal commute where they rode their bicycle to a light rail station and then took light rail to work. This would result in the selection of two modes. Respondents were also given the ability to select: “telecommute.” Some of the respondents telecommute several days a week and then travel to a workplace for other days throughout the week, leading to overlap between physical modes and tele-commuting in Figure 6. We also asked respondents to identify the factors that impact how they choose to travel to a destination. Cost and convenience were the most important motivators impacting modal choice.
2% 1%
6%2%
19%
3%
18%
4%
17%
7%11%
4%
9%6%7% 7%
4% 6%1%
5%6%
54%
0%
10%
20%
30%
40%
50%
60%
Urban recreational trip (e.g., a trip within a city),N = 663
Long distance recreational trip (e.g., a trip between cities),N = 489
About how far (distance, in miles) did you travel on this most recent trip?
0 - 0.5 miles
0.6 - 1 miles
1.1 - 3 miles
3.1 - 5 miles
5.1 - 10 miles
10.1 - 15 miles
15.1 - 25 miles
25.1 - 50 miles
50.1 - 75 miles
75.1-100 miles
Over 100 miles
5% 3%
8%5%
21%
4%
22%
9%
17%14%
9% 10%9%
14%
5%7%
2% 2%1%3%3%
30%
0%
10%
20%
30%
40%
50%
60%
Go to/from healthcare services,N = 265
Go to/from the airport,N = 176
About how far (distance, in miles) did you travel on this most recent trip?
0 - 0.5 miles
0.6 - 1 miles
1.1 - 3 miles
3.1 - 5 miles
5.1 - 10 miles
10.1 - 15 miles
15.1 - 25 miles
25.1 - 50 miles
50.1 - 75 miles
75.1-100 miles
Over 100 miles

NASA UAM Market Study – The Potential Societal Barriers of Urban Air Mobility
25 | P a g e
Figure 5: Most Recent Trip Mode
Figure 6: Commute Mode
73%
59%
67%
21%
14%18%
11%
33%29%
0%6%
10%
2% 2% 1%3% 1% 2%3%8%
4%1% 1% 1%1% 1% 1%1% 1% 4%
0%
10%
20%
30%
40%
50%
60%
70%
80%
Houston, N = 340 San Francisco Bay Area, N = 339 Los Angeles, N = 340
On this most recent trip, how did you travel to your final destination? Check all that apply.
Drive Fly in an airplane Public Transit Ride Sourcing Taxi Bicycle Walk/run Bikesharing Carsharing Other
61%
33%
58%
15% 12%16%
29%
54%
31%
12% 11% 10%
2%6%
3%2% 2% 2%7%
12%7%
1% 1% 1%1% 0% 1%2% 1% 2%0%
10%
20%
30%
40%
50%
60%
70%
80%
Washington, D.C., N = 336 New York City, N = 342 Total, N = 1698
On this most recent trip, how did you travel to your final destination? Check all that apply.
Drive Fly in an airplane Public Transit Ride Sourcing Taxi Bicycle Walk/run Bikesharing Carsharing Other
55%
37%42%
71%
40%
64%
21%
42% 40%
11% 9%15%
1% 1% 2%
11% 9%13%15%
19% 19%
1% 2% 2%1% 2% 2%4% 2% 4%
0%
10%
20%
30%
40%
50%
60%
70%
80%
Houston San Francisco Bay Area Los Angeles
How do you typically commute to work or school? Check all that apply.
Telecommute Drive Public Transit Ridesourcing Taxi Bicycle Walk/run Bikesharing Carsharing Other
43% 41%
54%46%
31%
62%
42%
73%
56%
14% 13% 16%
2%7%
3%9% 8%
13%19%
31%26%
2% 2% 2%2% 1% 2%6% 4%
10%
0%
10%
20%
30%
40%
50%
60%
70%
80%
Washington, D.C. New York City Total
How do you typically commute to work or school? Check all that apply
Telecommute Drive Public Transit Ridesourcing Taxi Bicycle Walk/run Bikesharing Carsharing Other

NASA UAM Market Study – The Potential Societal Barriers of Urban Air Mobility
26 | P a g e
2.3.5 Familiarity with Aviation and Existing Preferences
We wanted to measure the respondents’ comfort with using air travel and identify any barriers to UAM based on previous aviation experience. To gauge the respondent’s familiarity with aviation, respondents were first asked to identify if they had flown on four types of aircraft: 1) a large airplane (81+ passengers), 2) a regional airplane (41-80 respondents), 3) a small airplane (1-40 passengers), and 4) a helicopter. For each aircraft, respondents were shown a representative image of the aircraft type. According to a study by Airlines for America (Heimlich & Jackson, 2017), 89% of Americans have traveled by airline at some point in their lifetime. Similarly, 87% of the respondents had flown in large airplanes and 74% had flown in re-gional airplanes at least once. The respondent population was familiar with flight, but a smaller proportion of the population had flown in small aircraft. Approximately half of the respondents had flown in small air-planes (1-40 passengers), and 29% had flown in a helicopter.
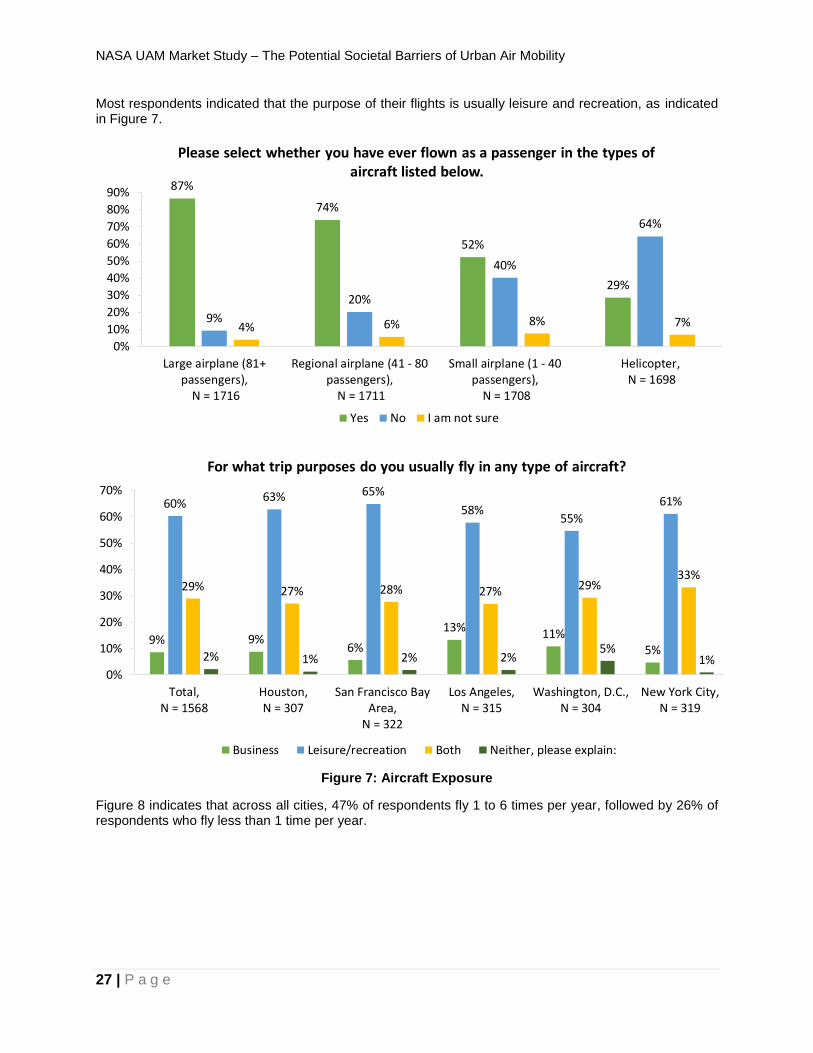
NASA UAM Market Study – The Potential Societal Barriers of Urban Air Mobility
27 | P a g e
Most respondents indicated that the purpose of their flights is usually leisure and recreation, as indicated in Figure 7.
Figure 7: Aircraft Exposure
Figure 8 indicates that across all cities, 47% of respondents fly 1 to 6 times per year, followed by 26% of respondents who fly less than 1 time per year.
87%
74%
52%
29%
9%
20%
40%
64%
4% 6% 8% 7%
0%
10%
20%
30%
40%
50%
60%
70%
80%
90%
Large airplane (81+passengers),
N = 1716
Regional airplane (41 - 80passengers),
N = 1711
Small airplane (1 - 40passengers),
N = 1708
Helicopter, N = 1698
Please select whether you have ever flown as a passenger in the types of aircraft listed below.
Yes No I am not sure
9% 9%6%
13% 11%5%
60%63% 65%
58%55%
61%
29% 27% 28% 27% 29%33%
2% 1% 2% 2%5%
1%0%
10%
20%
30%
40%
50%
60%
70%
Total,N = 1568
Houston,N = 307
San Francisco BayArea,
N = 322
Los Angeles,N = 315
Washington, D.C.,N = 304
New York City,N = 319
For what trip purposes do you usually fly in any type of aircraft?
Business Leisure/recreation Both Neither, please explain:

NASA UAM Market Study – The Potential Societal Barriers of Urban Air Mobility
28 | P a g e
Figure 8: Flight Frequency
We designed several questions to explore the factors that influence a respondent’s decision to travel by air and existing preferences from their flight experience. Regarding factors that encourage or discourage re-spondents from flying more frequently, the respondent was presented a list of factors related to the decision to fly, such as: flexibility, total flight time, cost, and the ability to visit places out of town. The respondent was presented a 5-point Likert scale ranging from “very much encourage” to “very much discourage” and was asked to rate each of the factors. Of the factors related to the decision to book a flight, cost was identified as the most important factor, as it had the highest percentage of respondents who found it “very much encouraging,” as well as the highest percentage of respondents who found it discouraging. The re-sults of this question are enumerated in Figure 9 below. Next, the respondent was asked to similarly rate factors related to their flying experience, such as the check-in experience, security process, and on-board experience. The results of this second question can be viewed in Figure 10 below. Many of the factors related to the flying experience encouraged passengers to fly more frequently, except for “anxiety around flying” and “impact on carbon footprint.” Respondents were relatively ambivalent toward these two factors. It is possible that people do not have anxiety about flying, or if they do, perhaps it does not impact their decision to fly.
3%
10%
3%
26%28%
18%
45%
39%
53%
15% 13%
18%
5% 5%3%4%
2% 2%3% 2% 1%0% 1% 2%
0%
10%
20%
30%
40%
50%
60%
Los Angeles, N = 316 Washington, D.C., N = 304 New York City, N = 319
About how often do you fly in any type of aircraft (i.e., large or small airplane, helicopter)?
Never
Less than once per year
1 to 6 times per year
7 to 11 times per year
Once per month
Two times per month
1 to 3 times per week
More than 3 times per week
5% 5%3%
26%29%
26%
47% 47%
52%
13%9% 11%
4% 5%3%3% 3% 3%2% 1% 1%1% 1% 0%
0%
10%
20%
30%
40%
50%
60%
Total, N = 1568 Houston, N = 306 San Francisco Bay Area, N = 322
About how often do you fly in any type of aircraft (i.e., large or small airplane, helicopter)?
Never
Less than once per year
1 to 6 times per year
7 to 11 times per year
Once per month
Two times per month
1 to 3 times per week
More than 3 times per week
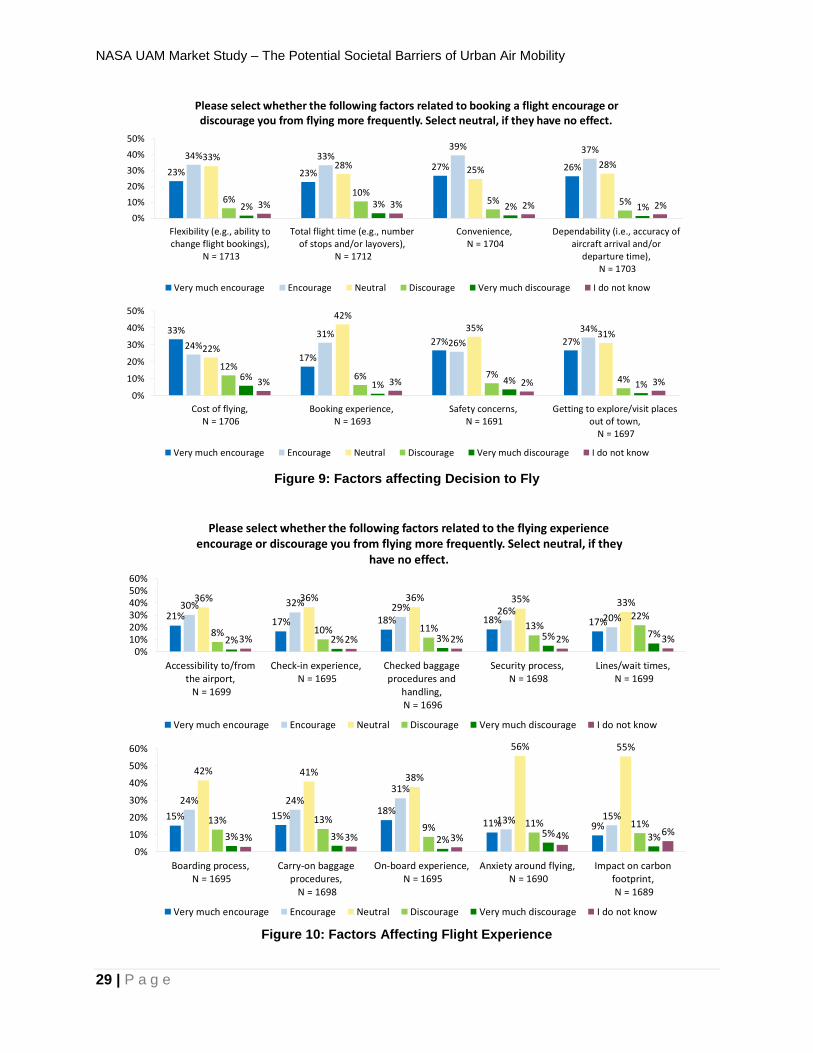
NASA UAM Market Study – The Potential Societal Barriers of Urban Air Mobility
29 | P a g e
Figure 9: Factors affecting Decision to Fly
Figure 10: Factors Affecting Flight Experience
23% 23%27% 26%
34% 33%39% 37%
33%28% 25%
28%
6%10%
5% 5%2% 3% 2% 1%3% 3% 2% 2%0%
10%
20%
30%
40%
50%
Flexibility (e.g., ability tochange flight bookings),
N = 1713
Total flight time (e.g., numberof stops and/or layovers),
N = 1712
Convenience, N = 1704
Dependability (i.e., accuracy ofaircraft arrival and/or
departure time), N = 1703
Please select whether the following factors related to booking a flight encourage or discourage you from flying more frequently. Select neutral, if they have no effect.
Very much encourage Encourage Neutral Discourage Very much discourage I do not know
33%
17%
27% 27%24%31%
26%
34%
22%
42%35%
31%
12%6% 7% 4%6%
1% 4% 1%3% 3% 2% 3%
0%
10%
20%
30%
40%
50%
Cost of flying, N = 1706
Booking experience, N = 1693
Safety concerns, N = 1691
Getting to explore/visit placesout of town,
N = 1697
Very much encourage Encourage Neutral Discourage Very much discourage I do not know
15% 15% 18%11% 9%
24% 24%31%
13% 15%
42% 41%38%
56% 55%
13% 13%9% 11% 11%
3% 3% 2%5% 3%3% 3% 3% 4% 6%
0%
10%
20%
30%
40%
50%
60%
Boarding process, N = 1695
Carry-on baggageprocedures,
N = 1698
On-board experience, N = 1695
Anxiety around flying, N = 1690
Impact on carbonfootprint, N = 1689
Very much encourage Encourage Neutral Discourage Very much discourage I do not know
21%17% 18% 18% 17%
30% 32% 29% 26%20%
36% 36% 36% 35% 33%
8% 10% 11% 13%22%
2% 2% 3% 5% 7%3% 2% 2% 2% 3%0%
10%20%30%40%50%60%
Accessibility to/fromthe airport, N = 1699
Check-in experience, N = 1695
Checked baggageprocedures and
handling, N = 1696
Security process, N = 1698
Lines/wait times, N = 1699
Please select whether the following factors related to the flying experience encourage or discourage you from flying more frequently. Select neutral, if they
have no effect.
Very much encourage Encourage Neutral Discourage Very much discourage I do not know

NASA UAM Market Study – The Potential Societal Barriers of Urban Air Mobility
30 | P a g e
Regarding the onboard flying experience, respondents considered physical comfort as the most important factor toward a satisfactory flying experience. 41% of the respondents viewed “a comfortable seat” as very important, followed closely by minimal turbulence and a pleasant ambient temperature. On-board amenities and in-flight entertainment received positive responses, but were not viewed as essential to the on-board experience in comparison to the other features. The full results are presented in Figure 11.
Figure 11: On-Board Experience
2.3.6 UAM Perceptions
As mentioned previously, the survey respondents were introduced to the concept of UAM through a short video clip and description of the technology. The video clip was approximately a minute and a half long, and it consisted of Uber Elevate’s promotional introduction to their future urban air ridesourcing product, Uber Air. In the promotional video, viewers follow the steps of an individual taking a piloted UAM trip for their commute home. For the survey introduction to UAM, we edited the video clip to remove Uber logos, and the final 12 seconds of the video were removed to eliminate references to Uber Air. The following definition prefaced the video in our survey:
“Urban Air Mobility (UAM) is a safe and efficient system for air passenger transportation within an urban area. UAM supports a mix of onboard/ground-piloted and increasingly automated operations.”
After the introduction of UAM, we asked the respondents to select from a series of emotional states that matched their initial reaction. Overall, UAM invoked a positive to neutral response, with some skepticism. The initial feelings were consistent across all cities; however, variation existed across other demographic categories. For initial reactions, 36% of male respondents selected “Excited” compared to 26% of female respondents. Excitement for the concept tended to be correlated with household income, perhaps due to perceived service cost. This corresponds with the written responses of several participants who expressed concerns that UAM would be a mode used predominantly by higher income travelers. Younger respondents tended to be more excited about the concept, while skepticism tended to increase with age. Table 5 pre-sents the initial reactions of the respondents, disaggregated by demographic categories.
18% 18%
41%
28%
41% 41%
32% 30%
15%15%8%
2%6%
2% 1%1% 1% 1%0%
10%
20%
30%
40%
50%
In-flight entertainment, N = 1565
On-board services/amenities, N = 1564
A comfortable seat, N = 1563
Please indicate how important each of the following factors is to your onboard flying experience.
Very important Important Neutral Not important Not at all important I do not know
31% 33%
24%
48%38%
43%
16%23% 26%
2% 4% 5%1% 1% 1%1% 1% 1%
0%
10%
20%
30%
40%
50%
Pleasant ambient temperature, N = 1562
Minimal turbulene/vibrations, N = 1561
Low noise, N = 1561
Very important Important Neutral Not important Not at all important I do not know
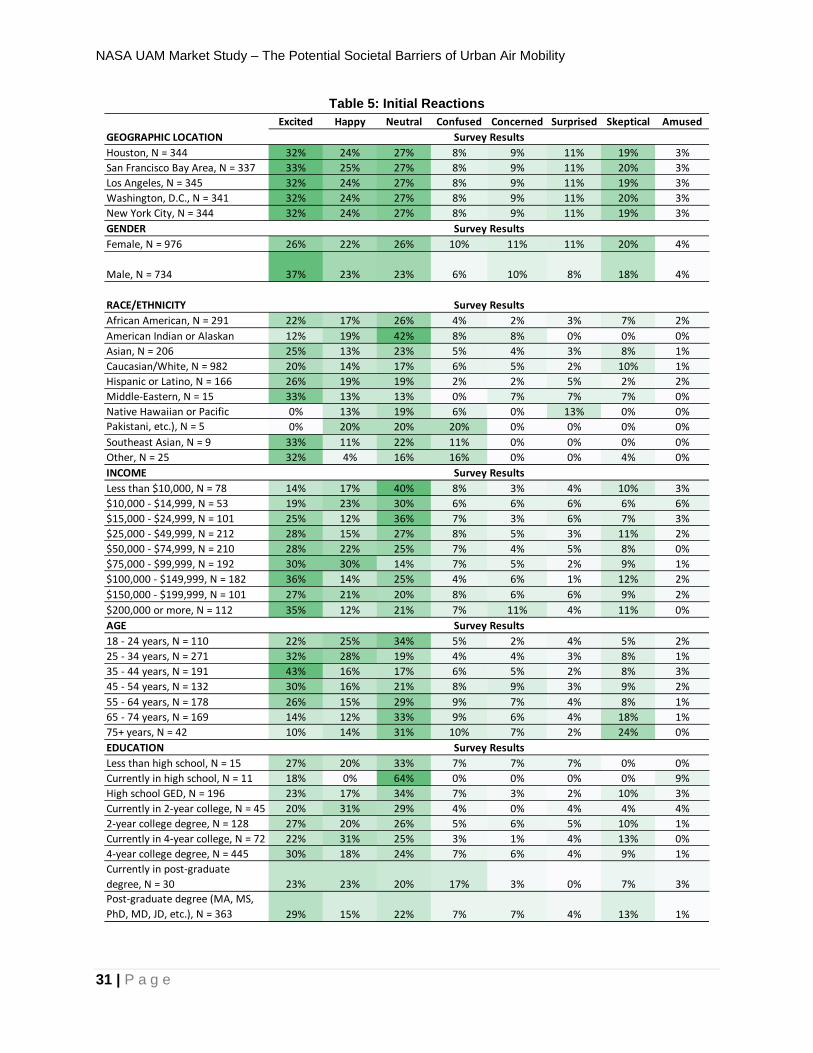
NASA UAM Market Study – The Potential Societal Barriers of Urban Air Mobility
31 | P a g e
Table 5: Initial Reactions
Excited Happy Neutral Confused Concerned Surprised Skeptical Amused
GEOGRAPHIC LOCATION
Houston, N = 344 32% 24% 27% 8% 9% 11% 19% 3%
San Francisco Bay Area, N = 337 33% 25% 27% 8% 9% 11% 20% 3%
Los Angeles, N = 345 32% 24% 27% 8% 9% 11% 19% 3%
Washington, D.C., N = 341 32% 24% 27% 8% 9% 11% 20% 3%
New York City, N = 344 32% 24% 27% 8% 9% 11% 19% 3%
GENDER
Female, N = 976 26% 22% 26% 10% 11% 11% 20% 4%
Male, N = 734 37% 23% 23% 6% 10% 8% 18% 4%
RACE/ETHNICITY
African American, N = 291 22% 17% 26% 4% 2% 3% 7% 2%
American Indian or Alaskan 12% 19% 42% 8% 8% 0% 0% 0%
Asian, N = 206 25% 13% 23% 5% 4% 3% 8% 1%
Caucasian/White, N = 982 20% 14% 17% 6% 5% 2% 10% 1%
Hispanic or Latino, N = 166 26% 19% 19% 2% 2% 5% 2% 2%
Middle-Eastern, N = 15 33% 13% 13% 0% 7% 7% 7% 0%
Native Hawaiian or Pacific 0% 13% 19% 6% 0% 13% 0% 0%South Asian (e.g., Indian,
Pakistani, etc.), N = 5 0% 20% 20% 20% 0% 0% 0% 0%
Southeast Asian, N = 9 33% 11% 22% 11% 0% 0% 0% 0%
Other, N = 25 32% 4% 16% 16% 0% 0% 4% 0%
INCOME
Less than $10,000, N = 78 14% 17% 40% 8% 3% 4% 10% 3%
$10,000 - $14,999, N = 53 19% 23% 30% 6% 6% 6% 6% 6%
$15,000 - $24,999, N = 101 25% 12% 36% 7% 3% 6% 7% 3%
$25,000 - $49,999, N = 212 28% 15% 27% 8% 5% 3% 11% 2%
$50,000 - $74,999, N = 210 28% 22% 25% 7% 4% 5% 8% 0%
$75,000 - $99,999, N = 192 30% 30% 14% 7% 5% 2% 9% 1%
$100,000 - $149,999, N = 182 36% 14% 25% 4% 6% 1% 12% 2%
$150,000 - $199,999, N = 101 27% 21% 20% 8% 6% 6% 9% 2%
$200,000 or more, N = 112 35% 12% 21% 7% 11% 4% 11% 0%
AGE
18 - 24 years, N = 110 22% 25% 34% 5% 2% 4% 5% 2%
25 - 34 years, N = 271 32% 28% 19% 4% 4% 3% 8% 1%
35 - 44 years, N = 191 43% 16% 17% 6% 5% 2% 8% 3%
45 - 54 years, N = 132 30% 16% 21% 8% 9% 3% 9% 2%
55 - 64 years, N = 178 26% 15% 29% 9% 7% 4% 8% 1%
65 - 74 years, N = 169 14% 12% 33% 9% 6% 4% 18% 1%
75+ years, N = 42 10% 14% 31% 10% 7% 2% 24% 0%
EDUCATION
Less than high school, N = 15 27% 20% 33% 7% 7% 7% 0% 0%
Currently in high school, N = 11 18% 0% 64% 0% 0% 0% 0% 9%
High school GED, N = 196 23% 17% 34% 7% 3% 2% 10% 3%
Currently in 2-year college, N = 45 20% 31% 29% 4% 0% 4% 4% 4%
2-year college degree, N = 128 27% 20% 26% 5% 6% 5% 10% 1%
Currently in 4-year college, N = 72 22% 31% 25% 3% 1% 4% 13% 0%
4-year college degree, N = 445 30% 18% 24% 7% 6% 4% 9% 1%
Currently in post-graduate
degree, N = 30 23% 23% 20% 17% 3% 0% 7% 3%
Post-graduate degree (MA, MS,
PhD, MD, JD, etc.), N = 363 29% 15% 22% 7% 7% 4% 13% 1%
Survey Results
Survey Results
Survey Results
Survey Results
Survey Results
Survey Results

NASA UAM Market Study – The Potential Societal Barriers of Urban Air Mobility
32 | P a g e
Next, we introduced respondents to the willingness-to-fly scale, which was presented in Table 3 above. Respondents were asked to rate on a 5-point Likert scale eight statements intended to capture their UAM travel perceptions. Respondents were cautiously optimistic about the idea of flying in a UAM aircraft. Of the aggregated respondents, 55% were willing to fly in a UAM aircraft, and 50% assumed they would be com-fortable in a UAM aircraft. However, only approximately 36 to 37% believed they would feel safe and secure flying in a UAM aircraft. For each statement regarding UAM aircraft feelings (willingness, safety, fear, con-cern), approximately one a third of the respondents were neutral. This neutrality might be influenced by the lack of personal experience with this technology; some of the respondents might have difficulty imagining their reaction. A follow-up study could capture more reactions to UAM flight simulators or actual flights. Men were more slightly more comfortable and willing to use UAM than women, and willingness to use UAM was highest among Millennials. We found that the percentage of objections to flying in a UAM aircraft rises as age increases (Figure 12).
Figure 12: Willingness to Fly Among Age Groups
Ordinal Logistic Regression: We performed an ordinal logistic regression to evaluate the impact of socio-economics and congestion on willingness to use UAM. In the ordinal logistic regression model, the depend-ent variable is an ordinal. Examples of ordinal variables include items on a Likert scale. For our study, respondents chose one of five ordered responses for their willingness to use UAM: “Strongly agree,” “Agree,” “Neutral,” “Disagree,” and “Strongly disagree.” The socio-demographic variables considered in-cluded age, education, household income, race/ethnicity, and gender. The respondents’ commute distance in miles was used as a stand-in variable for congestion. Finally, familiarity with the UAM concept was in-cluded as an independent variable. Before building the ordinal regression model, crosstabs were performed on each of the socio-economic variables to identify overarching trends and important variables for regres-sion analysis. From the crosstabs presented in Table 6, the survey team expected that age, gender, and income will be significant variables in the ordinal logistic regression model.
28%32%
29%
22%
35%32% 31% 30%32%
28%
21%
30%
2%5%
15% 13%
3% 3% 5% 4%
0%
10%
20%
30%
40%
18 - 24 years,N = 131
25 - 34 years,N = 348
35 - 44 years,N = 234
45 - 54 years,N = 168
Please select the degree to which you agree with the following statement.If I were to fly in an Urban Air Mobility aircraft, I would feel… WILLING
Strongly agree
Agree
Neutral
Disagree
Strongly disagree
14%
8% 10%
32%35%
28%32% 32%
28%
17% 18%
28%
5% 6% 5%
0%
10%
20%
30%
40%
55 - 64 years,N = 217
65 - 74 years,N = 220
75+ years,N = 60
Strongly agree
Agree
Neutral
Disagree
Strongly disagree

NASA UAM Market Study – The Potential Societal Barriers of Urban Air Mobility
33 | P a g e
Table 6: Crosstabs on Socio-Demographic Variables
EDUCATION
Strongly
agree Agree Neutral Disagree
Strongly
disagree
Less than high school, N = 19 37% 21% 37% 0% 5%
Currently in high school, N = 15 20% 40% 40% 0% 0%
High school GED, N = 242 20% 30% 36% 9% 6%
Currently in 2-year college, N = 51 29% 24% 37% 8% 2%
2-year college degree, N = 163 18% 35% 32% 10% 6%
Currently in 4-year college, N = 82 17% 41% 29% 10% 2%
4-year college degree, N = 568 25% 33% 29% 8% 5%
Currently in post-graduate degree, N = 37 27% 27% 35% 8% 3%
Post-graduate degree (MA, MS, PhD, MD, JD,
etc.), N = 468 24% 32% 28% 13% 3%
INCOME
Strongly
agree Agree Neutral Disagree
Strongly
disagree
Less than $10,000, N = 94 23% 23% 34% 14% 5%
$10,000 - $14,999, N = 64 13% 42% 36% 6% 3%
$15,000 - $24,999, N = 128 21% 30% 40% 6% 3%
$25,000 - $49,999, N = 269 21% 30% 32% 9% 7%
$50,000 - $74,999, N = 267 22% 37% 28% 11% 2%
$75,000 - $99,999, N = 241 32% 30% 27% 7% 4%
$100,000 - $149,999, N = 229 24% 38% 27% 7% 4%
$150,000 - $199,999, N = 119 28% 27% 31% 13% 2%
$200,000 or more, N = 146 25% 36% 21% 15% 3%
AGE
Strongly
agree Agree Neutral Disagree
Strongly
disagree
18 - 24 years, N = 131 28% 35% 32% 2% 3%
25 - 34 years, N = 348 32% 32% 28% 5% 3%
35 - 44 years, N = 234 29% 31% 21% 15% 5%
45 - 54 years, N = 168 22% 30% 30% 13% 4%
55 - 64 years, N = 215 18% 32% 35% 12% 4%
65 - 74 years, N = 219 11% 38% 32% 12% 7%
75+ years, N = 59 14% 24% 37% 20% 5%
Willing

NASA UAM Market Study – The Potential Societal Barriers of Urban Air Mobility
34 | P a g e
Table 7: Ordinal Regression Model
Model estimation was completed using the ordinal package in R. The ordinal regression model is displayed in Table 7. Positive coefficients indicate that the variable increases willingness to fly. The variables for age, gender, and familiarity with the UAM concept before the survey are the most significant variables. The coefficient for age was negative, indicating that older respondents were less willing to fly. The coefficients for male gender and “yes” for familiarity were positive. Commute distance and Hispanic or Latino ethnicity were significant, but less influential. Both had positive coefficients, indicating that respondents with longer commutes and Hispanic/Latino respondents tended to be willing to fly in UAM aircraft.
2.3.7 Perceptions Toward Technology and UAM
Through a series of scenarios with varying degrees of automation, we also explored the public’s perceptions towards the level of automation of UAM aircraft. We presented five scenarios to the respondent: flying in (1) an automated aircraft, (2) a remotely piloted aircraft with a flight attendant on board, (3) a remotely piloted aircraft without a flight attendant on board, (4) an automated aircraft with a flight attendant on board, and (5) an automated aircraft without a flight attendant on board. As noted in the methodology, we showed respondents infographics representing each of the three levels of automation (automated, remotely piloted, and piloted) to help the respondents visualize the scenarios. For each of these scenarios, the respondents
Estimate Std. Error Z Value Pr(>|z|)
Dependent variable threshold coefficients
Strongly disagree | Disagree -3.32E+00 0.23830 -13.953
Disagree | Neutral -2.00E+00 0.21600 -9.280
Neutral | Agree -2.82E-01 0.20840 -1.353
Agree | Strongly agree 1.35E+00 0.21240 6.352
Covariate variables
Age -1.08E-02 0.00278 -3.871 0.000108 ***
Income 1.28E-06 0.00000 1.451 0.333130
Commute Distance 7.35E-03 0.00374 1.965 0.049428 *
Factor variables
Gender (Male) 3.42E-01 0.09117 3.754 0.000174 ***
Familiarity
No -3.00E-01 0.12890 -2.325 0.020089 *
Yes 1.07E+00 0.15560 6.848 7.47E-12 ***
Education (ordered factor)
Currently in high school -2.78E-01 0.32720 -0.849 0.395855
High school GED 4.14E-01 0.28560 1.450 0.147127
Currently in 2-year college -3.16E-01 0.26250 -1.204 0.228457
2-year college degree 7.46E-02 0.30470 0.245 0.806609
Currently in 4-year college -2.00E-01 0.31380 -0.638 0.523738
4-year college degree -8.51E-03 0.22760 -0.037 0.970168
Currently in post-graduate degree 3.11E-01 0.20070 1.549 0.121348
Post-graduate degree -3.41E-03 0.19390 -0.018 0.985963
Race or Ethnicity
American Indian or Alaskan Native (alone) -2.03E-01 0.56010 -0.362 0.717402
Asian -4.09E-02 0.17690 -0.231 0.817135
Caucasian/White 1.03E-01 0.13340 0.769 0.442122
Hispanic or Latino 4.93E-01 0.19440 2.533 0.011296 *
Middle-Eastern 4.07E-01 0.50570 0.804 0.421302
Mixed 3.63E-01 0.21830 1.662 0.096605 .
Native Hawaiian or Pacific Islander -5.28E-01 0.64200 -0.822 0.410927
Southeast Asian -2.03E-01 0.85360 -0.238 0.811991
Signif. Codes: 0 '***' 0.001 '**' 0.01 '*' 0.05 '.'

NASA UAM Market Study – The Potential Societal Barriers of Urban Air Mobility
35 | P a g e
were asked if they would be willing to fly alone, with other passengers that they knew, and with passengers they did not know.
Of the respondents who were willing to fly in a UAM aircraft, the respondents preferred to travel with other passengers that they knew (Figure 13). However, respondents were more willing to fly alone or with strangers in a piloted aircraft. The presence of a flight attendant only very slightly increased willingness to fly in remotely piloted or automated aircraft. We also explored the respondents’ perceptions of comfort (Figure 13) and safety and security (Figure 14). For this study, we defined safety as “protected against mishaps and accidents,” and security is defined as “protected against deliberate and intentional threats.” The respondents’ answers were closely correlated to their willingness to fly – respondents felt more safe, secure, and comfortable in piloted aircraft than in remotely piloted or automated aircraft. As displayed in Figure 13 and Figure 14, the presence of a flight attendant had a slight effect on respondents’ feelings toward travel in a remotely piloted or automated aircraft; approximately 5 to 10% more respondents felt comfortable, safe, and secure traveling in a UAM aircraft if a flight attendant was on board. However, these results may be affected by lack of experience with UAM or survey fatigue. It is possible that survey respond-ents would have had difficulty visualizing the different levels of automation and gauging their feelings toward UAM flight.
Figure 13: Perceptions of willingness and comfort
52%
28%23% 27%
21%
68%
52%43%
48%41%
53%
30%24% 27%
22%
0%
20%
40%
60%
80%
Piloted,N = 1722
Remotely piloted, witha flight attendant on
board,N = 1722
Remotely piloted,without a flight
attendant on board,N = 1722
Automated, with a flightattendant on board,
N = 1722
Automated, without aflight attendant on
board,N = 1722
Please select whether you would be willing to travel in an Urban Air Mobility aircraft in the following situations (i.e., piloted, remotely piloted, or automated) by yourself,
and/or with other people on board.
Alone With other passengers, whom I know With other passengers, whom I do not know
53%
27%21% 24% 21%
66%
50%41%
47%40%
49%
28% 24% 26%20%
0%
20%
40%
60%
80%
Piloted,N = 1722
Remotely piloted, witha flight attendant on
board,N = 1722
Remotely piloted,without a flight
attendant on board,N = 1722
Automated, with a flightattendant on board,
N = 1722
Automated, without aflight attendant on
board,N = 1722
Please select whether you would be comfortable traveling in an Urban Air Mobility aircraft in the following situations (i.e., piloted, remotely piloted, or automated) by
yourself, and/or with other people on board.
Alone With other passengers, whom I know With other passengers, whom I do not know
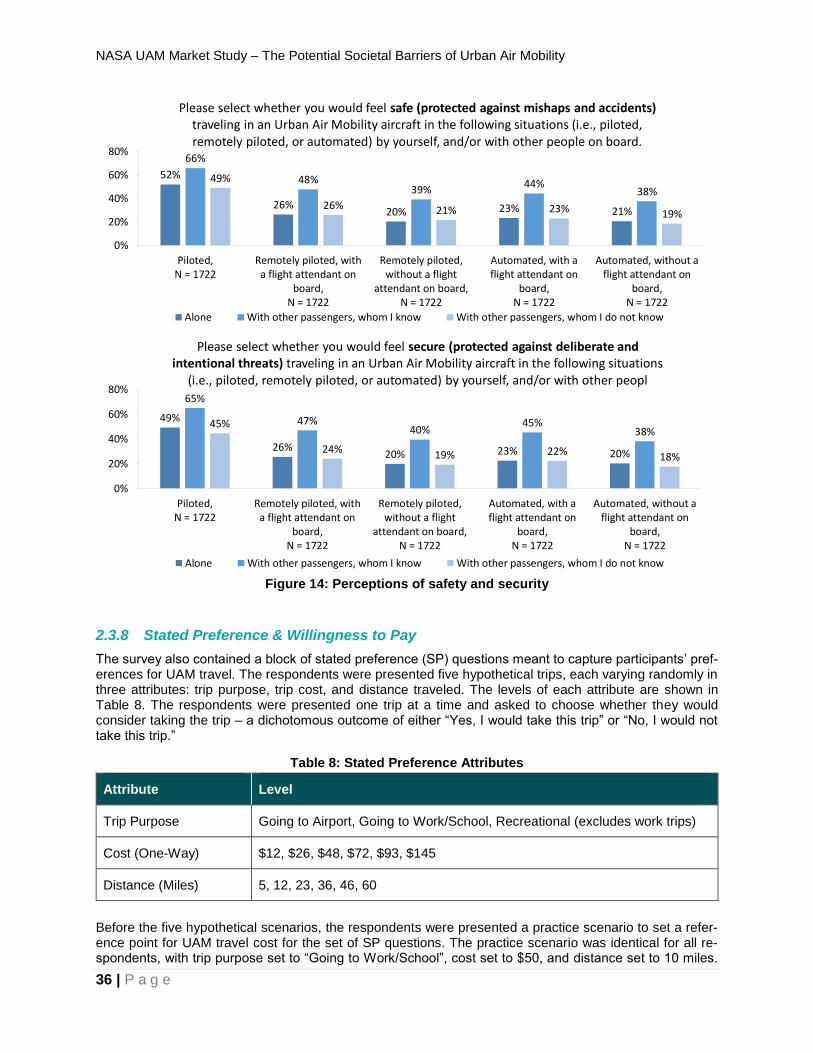
NASA UAM Market Study – The Potential Societal Barriers of Urban Air Mobility
36 | P a g e
Figure 14: Perceptions of safety and security
2.3.8 Stated Preference & Willingness to Pay
The survey also contained a block of stated preference (SP) questions meant to capture participants’ pref-erences for UAM travel. The respondents were presented five hypothetical trips, each varying randomly in three attributes: trip purpose, trip cost, and distance traveled. The levels of each attribute are shown in Table 8. The respondents were presented one trip at a time and asked to choose whether they would consider taking the trip – a dichotomous outcome of either “Yes, I would take this trip” or “No, I would not take this trip.”
Table 8: Stated Preference Attributes
Attribute Level
Trip Purpose Going to Airport, Going to Work/School, Recreational (excludes work trips)
Cost (One-Way) $12, $26, $48, $72, $93, $145
Distance (Miles) 5, 12, 23, 36, 46, 60
Before the five hypothetical scenarios, the respondents were presented a practice scenario to set a refer-ence point for UAM travel cost for the set of SP questions. The practice scenario was identical for all re-spondents, with trip purpose set to “Going to Work/School”, cost set to $50, and distance set to 10 miles.
52%
26%20% 23% 21%
66%
48%39%
44%38%
49%
26% 21% 23% 19%
0%
20%
40%
60%
80%
Piloted,N = 1722
Remotely piloted, witha flight attendant on
board,N = 1722
Remotely piloted,without a flight
attendant on board,N = 1722
Automated, with aflight attendant on
board,N = 1722
Automated, without aflight attendant on
board,N = 1722
Please select whether you would feel safe (protected against mishaps and accidents) traveling in an Urban Air Mobility aircraft in the following situations (i.e., piloted, remotely piloted, or automated) by yourself, and/or with other people on board.
Alone With other passengers, whom I know With other passengers, whom I do not know
49%
26%20% 23% 20%
65%
47%40%
45%38%
45%
24% 19% 22% 18%
0%
20%
40%
60%
80%
Piloted,N = 1722
Remotely piloted, witha flight attendant on
board,N = 1722
Remotely piloted,without a flight
attendant on board,N = 1722
Automated, with aflight attendant on
board,N = 1722
Automated, without aflight attendant on
board,N = 1722
Please select whether you would feel secure (protected against deliberate and intentional threats) traveling in an Urban Air Mobility aircraft in the following situations
(i.e., piloted, remotely piloted, or automated) by yourself, and/or with other peopl
Alone With other passengers, whom I know With other passengers, whom I do not know

NASA UAM Market Study – The Potential Societal Barriers of Urban Air Mobility
37 | P a g e
The pricing was set to $5 per mile based on an estimate from Uber Air. Uber estimates that their on-demand electric Vertical Take-off and Landing (eVOTL) taxis will initially cost $5.73 per passenger mile (Dickey, 2018).
The outcome data from the SP questions were used to build a logistic regression model with the binary outcome (“yes” or “no” to taking the trip) as the dependent variable, and the trip attributes and respondent characteristics as the predictor variables. The logistic regression model was created in R using the glm function. Model results are shown in Table 9 below.
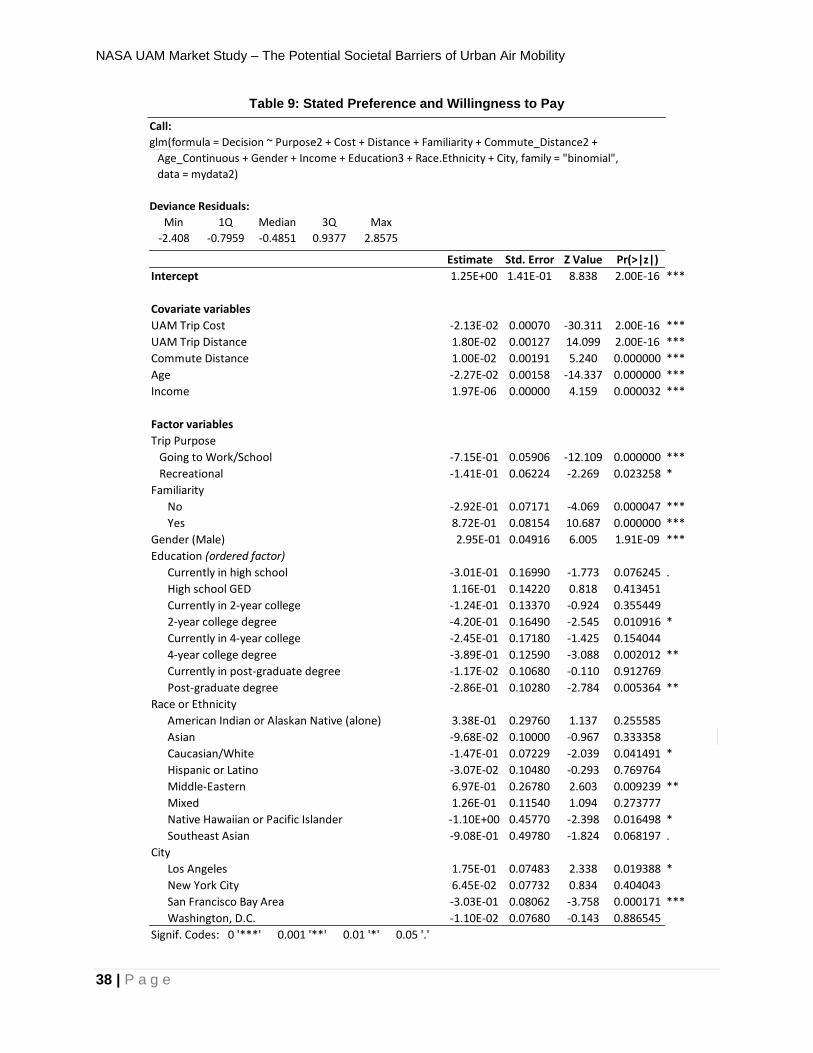
NASA UAM Market Study – The Potential Societal Barriers of Urban Air Mobility
38 | P a g e
Table 9: Stated Preference and Willingness to Pay
Call:
glm(formula = Decision ~ Purpose2 + Cost + Distance + Familiarity + Commute_Distance2 +
Age_Continuous + Gender + Income + Education3 + Race.Ethnicity + City, family = "binomial",
data = mydata2)
Deviance Residuals:
Min 1Q Median 3Q Max
-2.408 -0.7959 -0.4851 0.9377 2.8575
Estimate Std. Error Z Value Pr(>|z|)
Intercept 1.25E+00 1.41E-01 8.838 2.00E-16 ***
Covariate variables
UAM Trip Cost -2.13E-02 0.00070 -30.311 2.00E-16 ***
UAM Trip Distance 1.80E-02 0.00127 14.099 2.00E-16 ***
Commute Distance 1.00E-02 0.00191 5.240 0.000000 ***
Age -2.27E-02 0.00158 -14.337 0.000000 ***
Income 1.97E-06 0.00000 4.159 0.000032 ***
Factor variables
Trip Purpose
Going to Work/School -7.15E-01 0.05906 -12.109 0.000000 ***
Recreational -1.41E-01 0.06224 -2.269 0.023258 *
Familiarity
No -2.92E-01 0.07171 -4.069 0.000047 ***
Yes 8.72E-01 0.08154 10.687 0.000000 ***
Gender (Male) 2.95E-01 0.04916 6.005 1.91E-09 ***
Education (ordered factor)
Currently in high school -3.01E-01 0.16990 -1.773 0.076245 .
High school GED 1.16E-01 0.14220 0.818 0.413451
Currently in 2-year college -1.24E-01 0.13370 -0.924 0.355449
2-year college degree -4.20E-01 0.16490 -2.545 0.010916 *
Currently in 4-year college -2.45E-01 0.17180 -1.425 0.154044
4-year college degree -3.89E-01 0.12590 -3.088 0.002012 **
Currently in post-graduate degree -1.17E-02 0.10680 -0.110 0.912769
Post-graduate degree -2.86E-01 0.10280 -2.784 0.005364 **
Race or Ethnicity
American Indian or Alaskan Native (alone) 3.38E-01 0.29760 1.137 0.255585
Asian -9.68E-02 0.10000 -0.967 0.333358
Caucasian/White -1.47E-01 0.07229 -2.039 0.041491 *
Hispanic or Latino -3.07E-02 0.10480 -0.293 0.769764
Middle-Eastern 6.97E-01 0.26780 2.603 0.009239 **
Mixed 1.26E-01 0.11540 1.094 0.273777
Native Hawaiian or Pacific Islander -1.10E+00 0.45770 -2.398 0.016498 *
Southeast Asian -9.08E-01 0.49780 -1.824 0.068197 .
City
Los Angeles 1.75E-01 0.07483 2.338 0.019388 *
New York City 6.45E-02 0.07732 0.834 0.404043
San Francisco Bay Area -3.03E-01 0.08062 -3.758 0.000171 ***
Washington, D.C. -1.10E-02 0.07680 -0.143 0.886545
Signif. Codes: 0 '***' 0.001 '**' 0.01 '*' 0.05 '.'

NASA UAM Market Study – The Potential Societal Barriers of Urban Air Mobility
39 | P a g e
Each of the attributes of the stated preference scenarios – trip purpose, cost, and distance – were statisti-cally significant predictors for the decision to take a UAM trip. For every one mile increase in trip distance, the logarithm of the odds of the respondent taking the trip increases by 0.018. For every one dollar increase in trip cost, the logarithm of the odds of the respondent taking the trip decreases by 0.0213. If the purpose of the trip is going to work or school, versus going to the airport, the logarithm of the odds of taking the trip decrease by 0.715. If the purpose of the trip is recreational, as opposed to going to the airport, the logarithm of the odds of taking the trip decrease by 0.141. These results indicate that UAM travel would be more successful for trips that are longer, and respondents were not as interested in using UAM aircraft for com-muting as they were for recreational trips or trips to the airport.
Similar to the results of the ordinal logistic regression model, age, gender, and familiarity with the concept of UAM were statistically significant predictors of whether a person would take a UAM trip. Younger re-spondents, male respondents, and respondents familiar with UAM prior to the survey were more likely to take a UAM trip. The coefficient for income was statistically significant and positive, indicating respondents with higher income were more likely to take UAM trips. Survey respondents from Los Angeles were more likely to agree to take a trip compared to respondents from Houston, and respondents from the San Fran-cisco Bay Area were less likely to agree to take a UAM trip compared to respondents from Houston.
In order to measure how well the logistic regression model fits, the research team tested whether the model with predictors fits significantly better than a null model using a likelihood ratio test. The test statistic used is the difference in residual deviance between our model and a null model. We obtained a chi-square of 2544 with 30 degrees of freedom and an associated p-value of 0, indicating that the estimated model fits significantly better than a null model. The log-likelihood of our model was -5290.
The null deviance of the model is 13123 on 10201 degrees of freedom. The residual deviance is 10579 n 10171 degrees of freedom. The AIC is 10641, and the number of Fisher Scoring iterations is 4.
The research team also estimated the willingness-to-pay for distance traveled. The ratio of coefficients (βtrip_distance/βtrip_cost) represents the survey respondent’s willingness to pay for additional miles traveled. In our model, βtrip_distance is estimated to be .018 and βtrip_cost is estimated to be -0.0213, implying that the re-spondents were willing to pay approximately 0.85 dollars more for a trip whose distance is one mile longer.
2.3.9 Weather Considerations
Naturally, weather conditions impacted the willingness of a respondent to fly in a UAM aircraft. While a significant portion of the respondents (more than 50% in each of the weather scenarios, and as high as 81% for hot and cold conditions) were willing to fly in a UAM aircraft under adverse weather conditions, respondents reported increased levels of fear and concern. The survey respondents were apprehensive towards flying in rain, snow, low visibility, and turbulence, while they tended to be indifferent to hot and cold weather conditions. Respondents were the most afraid of snow (54%), fog/low visibility (57%), and turbu-lence (54%) (Figure 15).
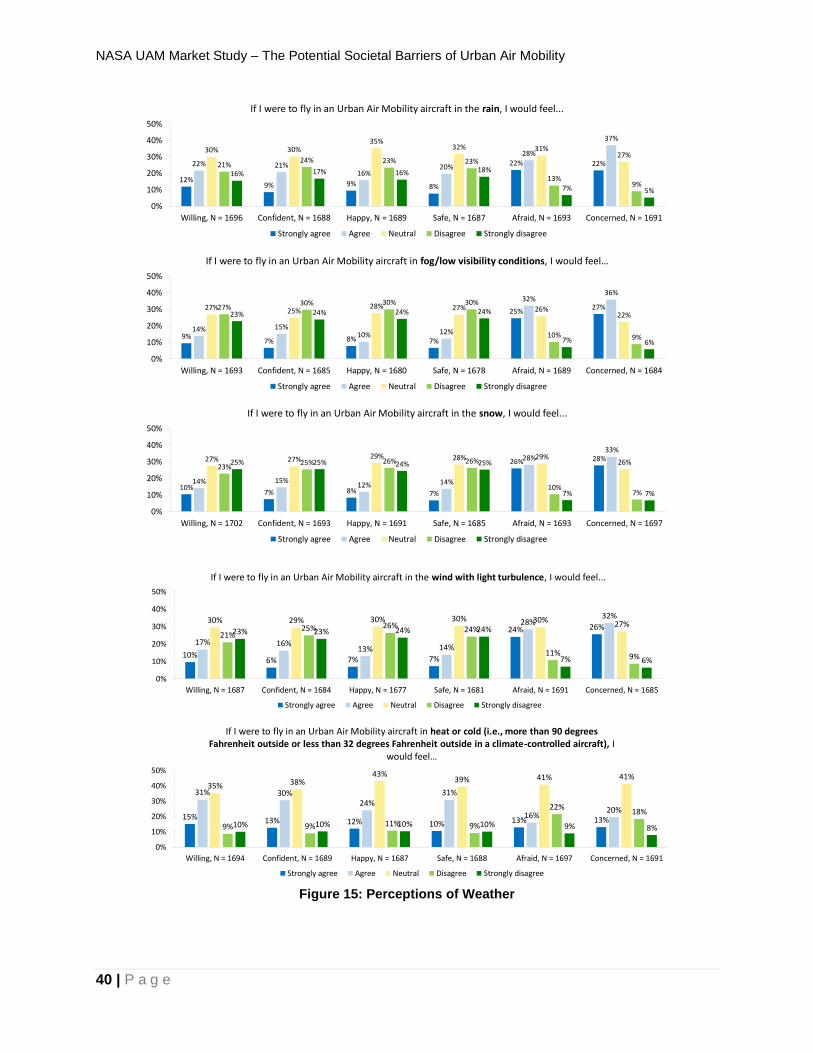
NASA UAM Market Study – The Potential Societal Barriers of Urban Air Mobility
40 | P a g e
Figure 15: Perceptions of Weather
12%9% 9% 8%
22% 22%22% 21%16%
20%
28%
37%
30% 30%35%
32% 31%27%
21%24% 23% 23%
13%9%
16% 17% 16% 18%
7% 5%
0%
10%
20%
30%
40%
50%
Willing, N = 1696 Confident, N = 1688 Happy, N = 1689 Safe, N = 1687 Afraid, N = 1693 Concerned, N = 1691
If I were to fly in an Urban Air Mobility aircraft in the rain, I would feel...
Strongly agree Agree Neutral Disagree Strongly disagree
9%7% 8% 7%
25%27%
14% 15%10% 12%
32%36%
27% 25%28% 27% 26%
22%27%
30% 30% 30%
10% 9%
23% 24% 24% 24%
7% 6%
0%
10%
20%
30%
40%
50%
Willing, N = 1693 Confident, N = 1685 Happy, N = 1680 Safe, N = 1678 Afraid, N = 1689 Concerned, N = 1684
If I were to fly in an Urban Air Mobility aircraft in fog/low visibility conditions, I would feel…
Strongly agree Agree Neutral Disagree Strongly disagree
10%7% 8% 7%
26% 28%
14% 15%12% 14%
28%33%
27% 27% 29% 28% 29%26%
23%25% 26% 26%
10%7%
25% 25% 24% 25%
7% 7%
0%
10%
20%
30%
40%
50%
Willing, N = 1702 Confident, N = 1693 Happy, N = 1691 Safe, N = 1685 Afraid, N = 1693 Concerned, N = 1697
If I were to fly in an Urban Air Mobility aircraft in the snow, I would feel...
Strongly agree Agree Neutral Disagree Strongly disagree
10%6% 7% 7%
24% 26%
17% 16%13% 14%
28%32%
30% 29% 30% 30% 30% 27%
21%25% 26% 24%
11% 9%
23% 23% 24% 24%
7% 6%
0%
10%
20%
30%
40%
50%
Willing, N = 1687 Confident, N = 1684 Happy, N = 1677 Safe, N = 1681 Afraid, N = 1691 Concerned, N = 1685
If I were to fly in an Urban Air Mobility aircraft in the wind with light turbulence, I would feel...
Strongly agree Agree Neutral Disagree Strongly disagree
15% 13% 12% 10% 13% 13%
31% 30%24%
31%
16%20%
35% 38%43%
39% 41% 41%
9% 9% 11% 9%
22%18%
10% 10% 10% 10% 9% 8%
0%
10%
20%
30%
40%
50%
Willing, N = 1694 Confident, N = 1689 Happy, N = 1687 Safe, N = 1688 Afraid, N = 1697 Concerned, N = 1691
If I were to fly in an Urban Air Mobility aircraft in heat or cold (i.e., more than 90 degrees Fahrenheit outside or less than 32 degrees Fahrenheit outside in a climate-controlled aircraft), I
would feel…
Strongly agree Agree Neutral Disagree Strongly disagree
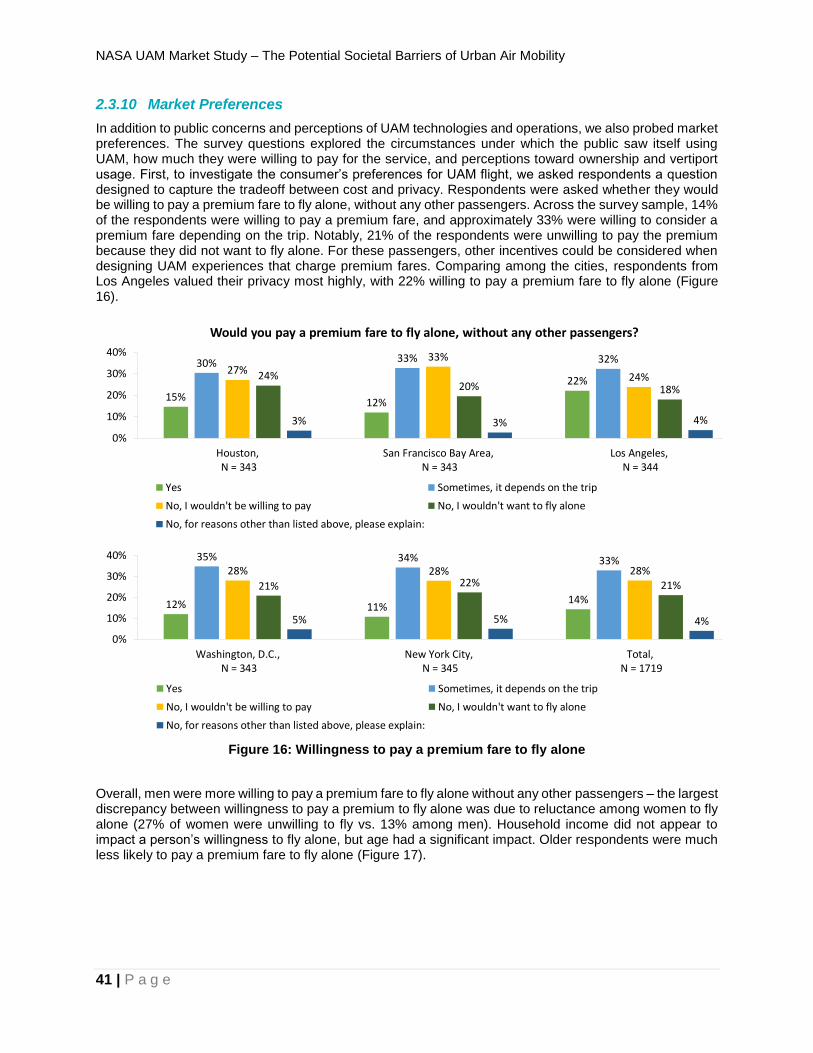
NASA UAM Market Study – The Potential Societal Barriers of Urban Air Mobility
41 | P a g e
2.3.10 Market Preferences
In addition to public concerns and perceptions of UAM technologies and operations, we also probed market preferences. The survey questions explored the circumstances under which the public saw itself using UAM, how much they were willing to pay for the service, and perceptions toward ownership and vertiport usage. First, to investigate the consumer’s preferences for UAM flight, we asked respondents a question designed to capture the tradeoff between cost and privacy. Respondents were asked whether they would be willing to pay a premium fare to fly alone, without any other passengers. Across the survey sample, 14% of the respondents were willing to pay a premium fare, and approximately 33% were willing to consider a premium fare depending on the trip. Notably, 21% of the respondents were unwilling to pay the premium because they did not want to fly alone. For these passengers, other incentives could be considered when designing UAM experiences that charge premium fares. Comparing among the cities, respondents from Los Angeles valued their privacy most highly, with 22% willing to pay a premium fare to fly alone (Figure 16).
Figure 16: Willingness to pay a premium fare to fly alone
Overall, men were more willing to pay a premium fare to fly alone without any other passengers – the largest discrepancy between willingness to pay a premium to fly alone was due to reluctance among women to fly alone (27% of women were unwilling to fly vs. 13% among men). Household income did not appear to impact a person’s willingness to fly alone, but age had a significant impact. Older respondents were much less likely to pay a premium fare to fly alone (Figure 17).
15% 12%
22%
30% 33% 32%27%
33%
24%24%20% 18%
3% 3% 4%
0%
10%
20%
30%
40%
Houston, N = 343
San Francisco Bay Area, N = 343
Los Angeles, N = 344
Would you pay a premium fare to fly alone, without any other passengers?
Yes Sometimes, it depends on the trip
No, I wouldn't be willing to pay No, I wouldn't want to fly alone
No, for reasons other than listed above, please explain:
12% 11%14%
35% 34% 33%28% 28% 28%
21% 22% 21%
5% 5% 4%
0%
10%
20%
30%
40%
Washington, D.C., N = 343
New York City, N = 345
Total, N = 1719
Yes Sometimes, it depends on the trip
No, I wouldn't be willing to pay No, I wouldn't want to fly alone
No, for reasons other than listed above, please explain:

NASA UAM Market Study – The Potential Societal Barriers of Urban Air Mobility
42 | P a g e
Figure 17: Willingness to pay a premium fare by age demographics
Next, the survey explored the security preferences among the respondents. Most of the respondents pre-ferred routine security screenings for UAM flight. Only 8% of the respondents were unwilling to undergo a security screening process before each flight, and only 4% of the respondents did not want other passen-gers to undergo a security screening process (Figure 18). Respondents were also probed for potential trip purposes of UAM. Similar to the findings from the focus groups, respondents were most interested in using the technology for long-distance recreational trips (Figure 19).
Figure 18: Security Screenings
0%
10%
20%
30%
40%
50%
Yes Sometimes, itdepends on the
trip
No, I wouldn't bewilling to pay
No, I wouldn'twant to fly alone
No, for reasonsother than listed
above, pleaseexplain:
Would you pay a premium fare to fly alone, without any other passengers?
18 - 24 years, N = 131
25 - 34 years, N = 351
35 - 44 years, N = 235
45 - 54 years, N = 169
55 - 64 years, N = 219
65 - 74 years, N = 223
75+ years, N = 61
44%
55%
32%
25%
16% 16%
3% 2%5%2%
0%
10%
20%
30%
40%
50%
60%
I would be willing to go through a brief securityscreening process before each trip to be a passenger in
an Urban Air Mobility aircraft.N = 1716
I would want other passengers - people sharing theUrban Air Mobility aircraft with me - to go through a
security screening process before each trip.N = 1718
Please select the degree to which you agree with the following statements:
Strongly agree
Agree
Neutral
Disagree
Strongly disagree

NASA UAM Market Study – The Potential Societal Barriers of Urban Air Mobility
43 | P a g e
Figure 19: Responses to UAM trip purpose
Figure 20: Likely Travel Partners
For each trip purpose that respondents would consider using a UAM aircraft, we asked them to specify who they would likely travel with, if anyone (Figure 20). Most of the respondents planned to fly with friends, a spouse/partner, or alone.
Respondents were also asked a series of questions regarding their travel preferences in an automated future, where automated vehicles (AVs), shared automated vehicles (SAVs), and UAM are all present on
26%
37%
57%
16%
39%
9%
0%
10%
20%
30%
40%
50%
60%
Commuteto/from work or
school
Urbanrecreational trip
(e.g., a tripwithin a city)
Long-distancerecreational trip
(e.g., a tripbetween cities)
Go to/fromhealthcare
services
Go to/from theairport
Other, pleasespecify:
Please select the trip purposes for which you would consider using an Urban Air Mobility aircraft. You may select more than one trip purpose.
Total, N = 1700
69%
49% 49%
62%63%
29%
54% 55%
38%47%
18%
25% 23%
18%17%
14%
20% 19%
17%
14%
13%
19% 22%
12%
14%
7%14% 17%
9%
14%
22% 47% 50%
14%34%
15% 14% 14% 5% 14%
0%
10%
20%
30%
40%
50%
60%
70%
80%
90%
100%
Commute to/fromwork or school,
N = 438
Urban recreational trip(e.g., a trip within a
city), N = 631
Long-distancerecreational trip (e.g., a
trip between cities), N = 962
Go to/from healthcareservices, N = 277
Go to/from the airport, N = 665
For the trip purposes you selected, please select who you would likely travel with in an Urban Air Mobility taxi.
Alone Spouse/Partner Children Parents Siblings Other relatives Friends Colleagues
NASA UAM Market Study – The Potential Societal Barriers of Urban Air Mobility
44 | P a g e
the market. Respondents were then asked questions regarding vertiports (specified landing/takeoff loca-tions for UAM aircraft) and their use case preferences.
As automation becomes an increasingly prevalent feature of transportation, it is likely that UAM will exist alongside an automated vehicle future. As such, we aimed to evaluate the extent to which respondents would use UAM in an altered transportation landscape. Respondents were introduced to the concepts of automated vehicles (AVs) and shared automated vehicles (SAVs) through short descriptions, as follows: “AVs are vehicles that move passengers with some level of automation that assists or replaces human control. Shared AVs are automated vehicles that are shared among multiple users and can be summoned on-demand similar to ridesourcing (Uber/Lyft) or can operate a fixed-route service like a bus.” Next, we asked respondents whether they would prefer to use an AV or SAV over a UAM aircraft for the trip purposes they had already selected for use. Generally, respondents preferred UAM aircraft for long-distance trips and going to/from the airport, while they preferred AVs for commuting and urban recreational trips. Across the cities, preferences for UAM vs. AVs varied, as seen in Figure 21 below. Respondents in Los Angeles appeared to be more open to future technologies, as there were far fewer neutral responses. Respondents in New York City expressed a slight preference for using UAM for healthcare trips, perhaps due to the location of health services within the cityscape or traffic concerns. The other cities were either evenly split or preferred AV for healthcare trips.
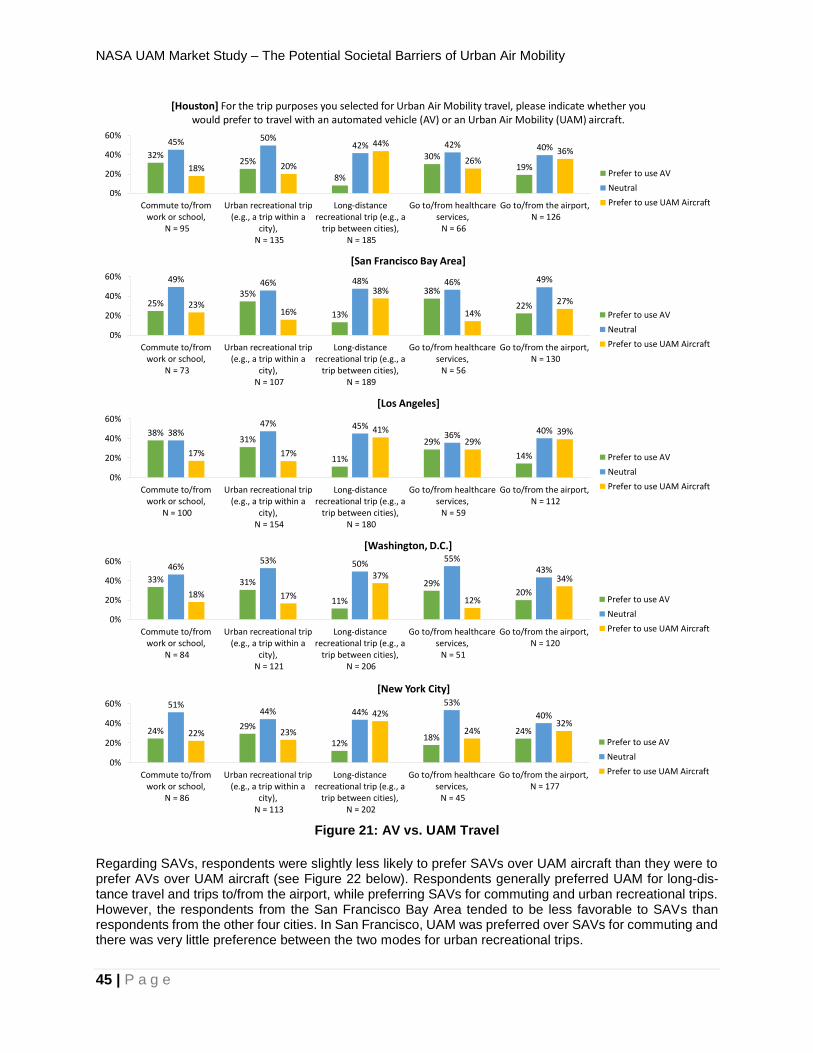
NASA UAM Market Study – The Potential Societal Barriers of Urban Air Mobility
45 | P a g e
Figure 21: AV vs. UAM Travel
Regarding SAVs, respondents were slightly less likely to prefer SAVs over UAM aircraft than they were to prefer AVs over UAM aircraft (see Figure 22 below). Respondents generally preferred UAM for long-dis-tance travel and trips to/from the airport, while preferring SAVs for commuting and urban recreational trips. However, the respondents from the San Francisco Bay Area tended to be less favorable to SAVs than respondents from the other four cities. In San Francisco, UAM was preferred over SAVs for commuting and there was very little preference between the two modes for urban recreational trips.
32%25%
8%
30%19%
45% 50%42% 42% 40%
18% 20%
44%
26%36%
0%
20%
40%
60%
Commute to/fromwork or school,
N = 95
Urban recreational trip(e.g., a trip within a
city), N = 135
Long-distancerecreational trip (e.g., a
trip between cities), N = 185
Go to/from healthcareservices, N = 66
Go to/from the airport, N = 126
[Houston] For the trip purposes you selected for Urban Air Mobility travel, please indicate whether you would prefer to travel with an automated vehicle (AV) or an Urban Air Mobility (UAM) aircraft.
Prefer to use AV
Neutral
Prefer to use UAM Aircraft
25%35%
13%
38%
22%
49% 46% 48% 46% 49%
23%16%
38%
14%
27%
0%
20%
40%
60%
Commute to/fromwork or school,
N = 73
Urban recreational trip(e.g., a trip within a
city), N = 107
Long-distancerecreational trip (e.g., a
trip between cities), N = 189
Go to/from healthcareservices, N = 56
Go to/from the airport, N = 130
[San Francisco Bay Area]
Prefer to use AV
Neutral
Prefer to use UAM Aircraft
38%31%
11%
29%
14%
38%47% 45%
36% 40%
17% 17%
41%
29%39%
0%
20%
40%
60%
Commute to/fromwork or school,
N = 100
Urban recreational trip(e.g., a trip within a
city), N = 154
Long-distancerecreational trip (e.g., a
trip between cities), N = 180
Go to/from healthcareservices, N = 59
Go to/from the airport, N = 112
[Los Angeles]
Prefer to use AV
Neutral
Prefer to use UAM Aircraft
33% 31%
11%
29%20%
46%53% 50%
55%43%
18% 17%
37%
12%
34%
0%
20%
40%
60%
Commute to/fromwork or school,
N = 84
Urban recreational trip(e.g., a trip within a
city), N = 121
Long-distancerecreational trip (e.g., a
trip between cities), N = 206
Go to/from healthcareservices, N = 51
Go to/from the airport, N = 120
[Washington, D.C.]
Prefer to use AV
Neutral
Prefer to use UAM Aircraft
24% 29%
12%18%
24%
51%44% 44%
53%
40%
22% 23%
42%
24%32%
0%
20%
40%
60%
Commute to/fromwork or school,
N = 86
Urban recreational trip(e.g., a trip within a
city), N = 113
Long-distancerecreational trip (e.g., a
trip between cities), N = 202
Go to/from healthcareservices, N = 45
Go to/from the airport, N = 177
[New York City]
Prefer to use AV
Neutral
Prefer to use UAM Aircraft

NASA UAM Market Study – The Potential Societal Barriers of Urban Air Mobility
46 | P a g e
Figure 22: SAV vs. UAM Travel
Next, we asked several questions related to vertiports (specified landing/takeoff locations for UAM aircraft). Future UAM users will most likely need to travel to vertiports to use the service, and users will most likely take multimodal trips which require travel to access a UAM aircraft. We asked survey respondents whether they would be willing to travel to a vertiport, how much they would be willing to pay to travel to a vertiport, and how much time they would be willing to spend traveling to the vertiport. An additional question probed the preferred transportation mode that each respondent would use to access the vertiport. The results of these questions are presented in Figure 23 to 24, as well as Table 10.
28%19%
10%20%
13%
42% 45% 41%47% 47%
24% 29%
43%32% 34%
0%10%20%30%40%50%60%70%
Commute to/fromwork or school,
N = 95
Urban recreational trip(e.g., a trip within a
city), N = 135
Long-distancerecreational trip (e.g., a
trip between cities), N = 185
Go to/from healthcareservices, N = 66
Go to/from the airport, N = 126
[Houston] For the trip purposes you selected for Urban Air Mobility travel, please indicate whether you would prefer to travel with a shared automated vehicle (SAV) or an Urban Air Mobility (UAM) aircraft.
Prefer to use SAV
Neutral
Prefer to use UAM Aircraft
15% 20%7%
23% 20%
58% 57% 52% 50% 50%
26%18%
39%
18%27%
0%10%20%30%40%50%60%70%
Commute to/fromwork or school,
N = 73
Urban recreational trip(e.g., a trip within a
city), N = 107
Long-distancerecreational trip (e.g., a
trip between cities), N = 189
Go to/from healthcareservices, N = 56
Go to/from the airport, N = 130
[San Francisco Bay Area]
Prefer to use SAV
Neutral
Prefer to use UAM Aircraft
32%20%
13%22%
15%
44%51%
43% 39% 43%
18%25%
41%29%
36%
0%10%20%30%40%50%60%70%
Commute to/fromwork or school,
N = 100
Urban recreational trip(e.g., a trip within a
city), N = 154
Long-distancerecreational trip (e.g., a
trip between cities), N = 180
Go to/from healthcareservices, N = 59
Go to/from the airport, N = 112
[Los Angeles]
Prefer to use SAV
Neutral
Prefer to use UAM Aircraft
29% 26%
11%24%
13%
46%53%
46%53%
43%
24% 21%
41%
22%
40%
0%10%20%30%40%50%60%70%
Commute to/fromwork or school,
N = 84
Urban recreational trip(e.g., a trip within a
city), N = 121
Long-distancerecreational trip (e.g., a
trip between cities), N = 206
Go to/from healthcareservices, N = 51
Go to/from the airport, N = 120
[Washington, D.C.]
Prefer to use SAV
Neutral
Prefer to use UAM Aircraft
22% 19%12% 16% 17%
53% 49%38%
47% 42%
21%27%
47%
31%37%
0%10%20%30%40%50%60%70%
Commute to/fromwork or school,
N = 86
Urban recreational trip(e.g., a trip within a
city), N = 113
Long-distancerecreational trip (e.g., a
trip between cities), N = 202
Go to/from healthcareservices, N = 45
Go to/from the airport, N = 177
[New York City]
Prefer to use SAV
Neutral
Prefer to use UAM Aircraft
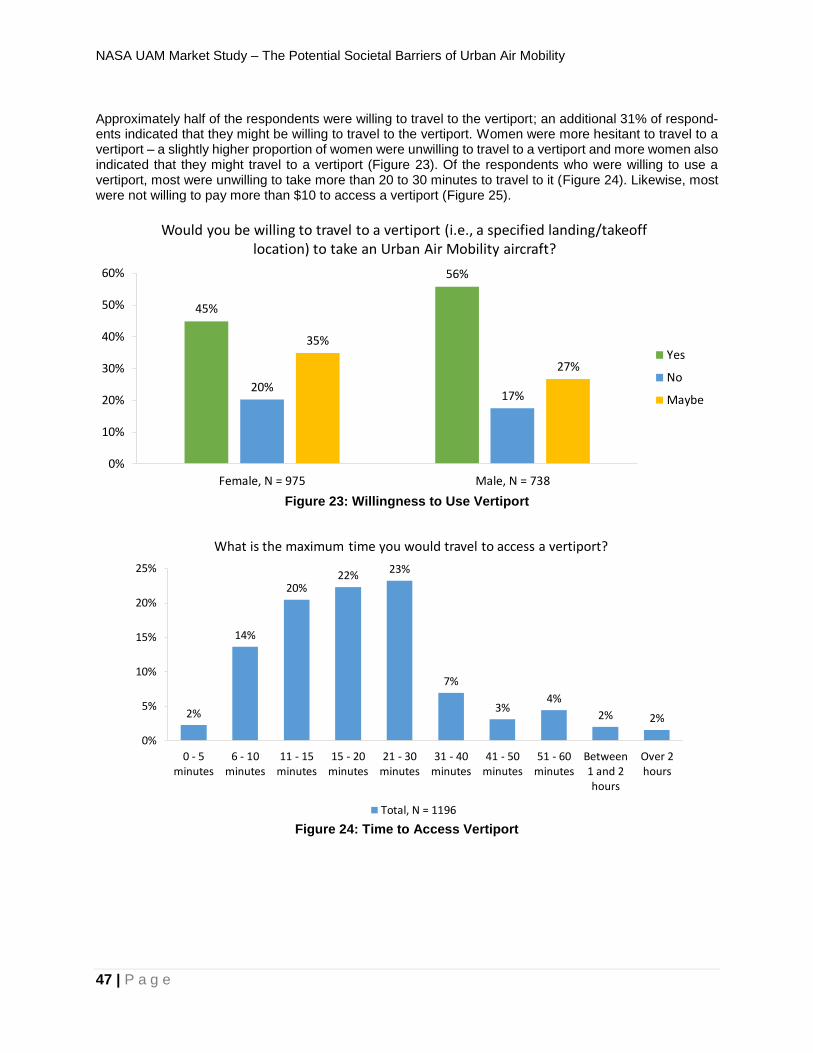
NASA UAM Market Study – The Potential Societal Barriers of Urban Air Mobility
47 | P a g e
Approximately half of the respondents were willing to travel to the vertiport; an additional 31% of respond-ents indicated that they might be willing to travel to the vertiport. Women were more hesitant to travel to a vertiport – a slightly higher proportion of women were unwilling to travel to a vertiport and more women also indicated that they might travel to a vertiport (Figure 23). Of the respondents who were willing to use a vertiport, most were unwilling to take more than 20 to 30 minutes to travel to it (Figure 24). Likewise, most were not willing to pay more than $10 to access a vertiport (Figure 25).
Figure 23: Willingness to Use Vertiport
Figure 24: Time to Access Vertiport
45%
56%
20%17%
35%
27%
0%
10%
20%
30%
40%
50%
60%
Female, N = 975 Male, N = 738
Would you be willing to travel to a vertiport (i.e., a specified landing/takeoff location) to take an Urban Air Mobility aircraft?
Yes
No
Maybe
2%
14%
20%22%
23%
7%
3%4%
2% 2%
0%
5%
10%
15%
20%
25%
0 - 5minutes
6 - 10minutes
11 - 15minutes
15 - 20minutes
21 - 30minutes
31 - 40minutes
41 - 50minutes
51 - 60minutes
Between1 and 2hours
Over 2hours
What is the maximum time you would travel to access a vertiport?
Total, N = 1196
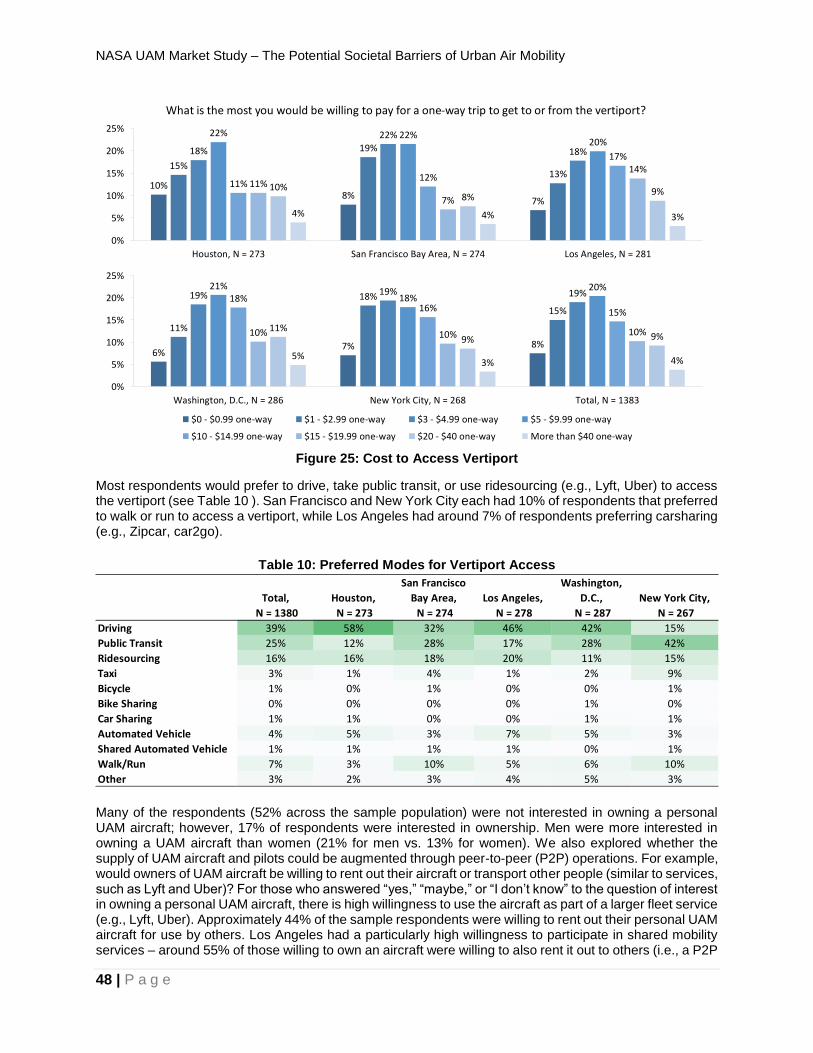
NASA UAM Market Study – The Potential Societal Barriers of Urban Air Mobility
48 | P a g e
Figure 25: Cost to Access Vertiport
Most respondents would prefer to drive, take public transit, or use ridesourcing (e.g., Lyft, Uber) to access the vertiport (see Table 10 ). San Francisco and New York City each had 10% of respondents that preferred to walk or run to access a vertiport, while Los Angeles had around 7% of respondents preferring carsharing (e.g., Zipcar, car2go).
Table 10: Preferred Modes for Vertiport Access
Many of the respondents (52% across the sample population) were not interested in owning a personal UAM aircraft; however, 17% of respondents were interested in ownership. Men were more interested in owning a UAM aircraft than women (21% for men vs. 13% for women). We also explored whether the supply of UAM aircraft and pilots could be augmented through peer-to-peer (P2P) operations. For example, would owners of UAM aircraft be willing to rent out their aircraft or transport other people (similar to services, such as Lyft and Uber)? For those who answered “yes,” “maybe,” or “I don’t know” to the question of interest in owning a personal UAM aircraft, there is high willingness to use the aircraft as part of a larger fleet service (e.g., Lyft, Uber). Approximately 44% of the sample respondents were willing to rent out their personal UAM aircraft for use by others. Los Angeles had a particularly high willingness to participate in shared mobility services – around 55% of those willing to own an aircraft were willing to also rent it out to others (i.e., a P2P
10%8%
7%
15%
19%
13%
18%
22%
18%
22% 22%20%
11%12%
17%
11%
7%
14%
10%8%
9%
4% 4% 3%
0%
5%
10%
15%
20%
25%
Houston, N = 273 San Francisco Bay Area, N = 274 Los Angeles, N = 281
What is the most you would be willing to pay for a one-way trip to get to or from the vertiport?
6%7% 8%
11%
18%
15%
19% 19% 19%21%
18%20%
18%16% 15%
10% 10% 10%11%9% 9%
5%3% 4%
0%
5%
10%
15%
20%
25%
Washington, D.C., N = 286 New York City, N = 268 Total, N = 1383
$0 - $0.99 one-way $1 - $2.99 one-way $3 - $4.99 one-way $5 - $9.99 one-way
$10 - $14.99 one-way $15 - $19.99 one-way $20 - $40 one-way More than $40 one-way
Total,
N = 1380
Houston,
N = 273
San Francisco
Bay Area,
N = 274
Los Angeles,
N = 278
Washington,
D.C.,
N = 287
New York City,
N = 267
Driving 39% 58% 32% 46% 42% 15%
Public Transit 25% 12% 28% 17% 28% 42%
Ridesourcing 16% 16% 18% 20% 11% 15%
Taxi 3% 1% 4% 1% 2% 9%
Bicycle 1% 0% 1% 0% 0% 1%
Bike Sharing 0% 0% 0% 0% 1% 0%
Car Sharing 1% 1% 0% 0% 1% 1%
Automated Vehicle 4% 5% 3% 7% 5% 3%
Shared Automated Vehicle 1% 1% 1% 1% 0% 1%
Walk/Run 7% 3% 10% 5% 6% 10%
Other 3% 2% 3% 4% 5% 3%

NASA UAM Market Study – The Potential Societal Barriers of Urban Air Mobility
49 | P a g e
service model). This suggests that perhaps there may be room for P2P operations with UAM aircraft. How-ever, respondents were not as interested in fractional ownership (i.e., shared ownership of a UAM among individuals). Only 20% of the sample respondents were willing to share ownership of a UAM aircraft. In order for P2P markets to be viable, licensed pilots and people willing to fly UAM aircraft are necessary. The respondents were asked if they would be willing to fly a UAM aircraft, and approximately one in five respondents were willing. Los Angeles had an even higher percentage of respondents who were willing to fly a UAM aircraft at 30%. However, the survey population was heavily skewed toward those with pilot’s licenses. Approximately one in five of the survey respondents claimed to possess a pilot’s license, which is much higher than the national average. As of 2017, only 0.2% of U.S. residents were active certified pilots (FAA, 2018). Many of the respondents (52% across the sample population) were not interested in owning a personal UAM aircraft, but 17% of respondents were interested in ownership. Men were more interested in owning a UAM aircraft than women (21% and 13%, respectively). We also explored whether the supply of UAM aircraft and pilots could be augmented through peer-to-peer (P2P) operations. For example, would owners of UAM aircraft be willing to rent out their aircraft or transport other people (similar to services, such as Lyft and Uber)? For those who answered “yes,” “maybe,” or “I don’t know” to the question of interest in owning a personal UAM aircraft, there was high willingness to use the aircraft as part of a larger fleet service (e.g., Lyft, Uber). Approximately 44% of the sample respondents were willing to rent out their personal UAM aircraft for use by others. Los Angeles had a particularly high willingness to participate in shared mobility services – around 55% of those willing to own an aircraft were willing to also rent it out to others (i.e., a P2P service model). This suggests that perhaps there may be opportunity for P2P operations with UAM aircraft. However, respondents were not as interested in fractional ownership (i.e., shared ownership of a UAM among individuals) with only 20% of the sample respondents indicating willingness to share ownership of a UAM aircraft.
If P2P operations are to become a possibility, there will be a need for licensed pilots and people willing to fly UAM aircraft. The respondents were asked if they would be willing to fly a UAM aircraft, and approxi-mately one in five respondents were willing. Los Angeles had an even higher percentage of respondents who were willing to fly a UAM aircraft at 30%. However, the survey population was heavily skewed toward those with pilot’s licenses. Approximately one in five of the survey respondents claimed to possess a pilot’s license, which is much higher than the national average. As of 2017, only 0.2% of U.S. residents were active certified pilots (FAA, 2018).
2.3.11 Perceptions from Non-User Perspective
We designed a set of questions that aimed to collect respondents’ opinions from a non-user perspective. In other words, how would people on the ground feel about UAM traffic overhead? Would there be pushback from those not planning to use technology? Respondents were asked how they perceived a UAM taxi flying overhead if it was piloted, remote piloted, and automated. For the latter two types of UAM taxi, respondents were asked about flights overhead with and without flight attendants. Respondents tended to prefer flights that were piloted or that had a flight attendant on board (Figure 26) as their presence made non-users feel safer.
To gauge concern over noise, we probed the respondents’ current experiences and perceptions about noise. The most common bothersome noises experienced by the respondents were noise from motor ve-hicles and neighboring properties, and they tended to be most bothered by noise at home. Respondents who reported being bothered by noise from aircraft tended to experience the most disturbance during the early morning hours and at night. Overall, respondents preferred that UAM technology have no noticeable noise. The noise levels of the technology could affect support for UAM.

NASA UAM Market Study – The Potential Societal Barriers of Urban Air Mobility
50 | P a g e
Figure 26: Perceptions from a non-user perspective
14% 12% 13% 10% 11% 11%
32% 35% 32% 31% 28% 29%
43% 42% 42% 40% 41%44%
6% 6% 8%12% 11% 9%
5% 5% 6% 7% 8% 7%
0%
10%
20%
30%
40%
50%
Dependable, N = 1708
Reliable, N = 1704
Responsible, N = 1695
Safe (protected againstmishaps andaccidents), N = 1703
Secure (protectedagainst deliberate and
intentional threats), N = 1708
Trustworthy, N = 1704
A piloted Urban Air Mobility taxi is flying over your city. To me, Urban Air Mobility is…
Strongly agree Agree Neutral Disagree Strongly disagree
11% 9% 9% 8% 8% 9%
21% 22% 19% 17% 17% 17%
40% 41% 41%38% 38%
42%
18% 17% 19%23% 23% 20%
11% 11% 11% 13% 14% 12%
0%
10%
20%
30%
40%
50%
Dependable, N = 1707
Reliable, N = 1704
Responsible, N = 1700
Safe (protected againstmishaps andaccidents), N = 1706
Secure (protectedagainst deliberate and
intentional threats), N = 1702
Trustworthy, N = 1693
A remotely piloted Urban Air Mobility aircraft is flying over your city. To me, Urban Air Mobility is
Strongly agree Agree Neutral Disagree Strongly disagree
10% 8% 9% 8% 8% 8%
17% 18% 16% 15% 15% 16%
39% 40%36% 34% 34%
39%
20% 19%23% 25% 25%
21%14% 15% 16% 18% 18% 16%
0%
10%
20%
30%
40%
50%
Dependable, N = 1707
Reliable, N = 1704
Responsible, N = 1695
Safe (protected againstmishaps andaccidents), N = 1705
Secure (protectedagainst deliberate and
intentional threats), N = 1704
Trustworthy, N = 1692
An automated Urban Air Mobility taxi is flying over your city. There are no flight attendants on board. To me, Urban Air Mobility is…
Strongly agree Agree Neutral Disagree Strongly disagree
13% 10% 12% 10% 12% 9%
26% 28% 26% 23% 20% 24%
40% 40% 39% 38% 39% 42%
12% 13% 14% 17% 18% 15%9% 9% 9% 11% 11% 10%
0%10%20%30%40%50%
Dependable, N = 1711
Reliable, N = 1705
Responsible, N = 1699
Safe (protected againstmishaps andaccidents), N = 1704
Secure (protectedagainst deliberate and
intentional threats), N = 1707
Trustworthy, N = 1695
An automated Urban Air Mobility taxi is flying over your city. There is at least one flight attendant on board. To me, Urban Air Mobility is…
Strongly agree Agree Neutral Disagree Strongly disagree

NASA UAM Market Study – The Potential Societal Barriers of Urban Air Mobility
51 | P a g e
3.0 SUMMARY AND KEY FINDINGS Based on the findings of the exploratory survey administered to five metropolitan regions (Houston, Los Angeles, San Francisco Bay Area, New York City, and Washington, D.C.), the survey respondents were cautiously receptive to the concept of UAM. Initial reactions were clustered around excitement and happi-ness, neutrality, and skepticism. Overall, male respondents and young respondents tended to express more excitement over the technology, and they were also more willing to fly in a UAM aircraft. Familiarity with the UAM concept was also a strong factor influencing willingness-to-fly and a participant’s decision on whether to take a UAM trip, suggesting that public education will play an important role in introducing UAM as a new travel mode. Not surprisingly, the characteristics of a UAM trip impacted a respondents’ feelings toward UAM. Respond-ents were more comfortable and willing to fly with passengers they knew in contrast to flying alone or with strangers. Willingness decreased with increasing levels of automation, and the presence of a flight at-tendant only slightly alleviated discomfort. The characteristics of the trip itself were also important. The respondents visualized themselves using UAM for longer trips and traveling to the airport. Long distance recreational trips were more popular than using a UAM for commuting. While most of the respondents were not interested in UAM aircraft ownership, approximately 17% of the respondents expressed interest. In addition, almost half of the individuals attracted to ownership expressed significant levels of interest in placing their aircraft into a larger fleet service, opening the possibility for P2P UAM operations in the future. For those on the ground, piloted UAM aircraft or automated/remotely piloted UAM aircraft with flight attend-ants on board were preferred for travel overhead. UAM will need to address concerns of trust, reliability, safety, and other issues to gain acceptance from non-users. Our results also indicate that noise levels could impact non-user support for UAM. The societal barrier analysis demonstrated the need to conduct further research by employing a flight simulator and/or an actual certified aircraft as part of a pilot program or test clinic. Simulations or flight experience in a UAM aircraft might give respondents a more realistic understanding of UAM travel. Another option would be to further study the influence of congestion on UAM perceptions. In our survey, we did not collect data on a respondent’s commute time or attitude toward congestion. Interestingly, commute distance was slightly significant in regression model. To better understand this, we examined the city of residence as a possible predictor related to commute time, as each of the cities has a different mean commute time. According to the 2016 ACS, mean travel time to work is 29.5 minutes in Houston, 29.6 minutes in Los Angeles, 35.9 in New York City, 32.1 minutes in the San Francisco Bay Area, and 34.4 minutes in Washington, D.C. The binomial logistic regression model had statistically significant coefficients for Los Angeles and the San Francisco Bay Area in contrast to Houston. However, respondents from Houston and Los Angeles have shorter mean commute times and yet are more willing to use UAM. This indicates the mean commute time for the city is not a good stand-in for a respondent’s willingness to use UAM or perhaps our respondent population was not representative of each of the cities with respect to commute time. Further study of the role of congestion as a predictor of UAM interest may be fruitful to explore in a future project.
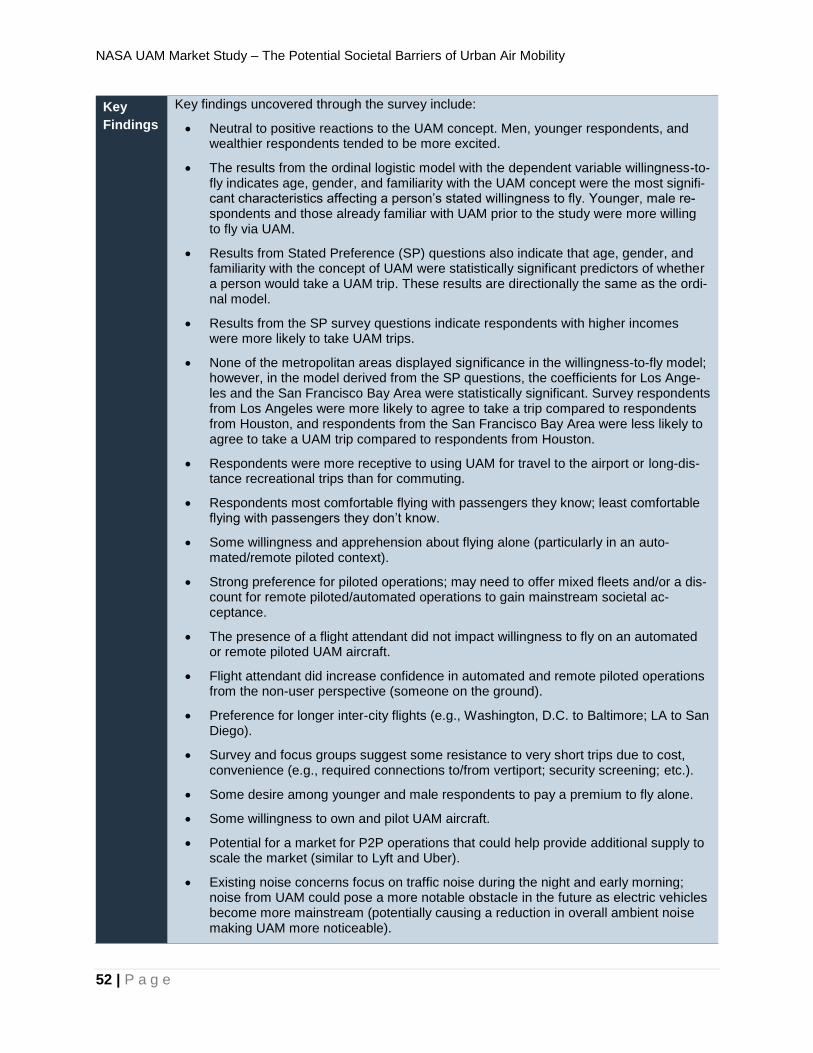
NASA UAM Market Study – The Potential Societal Barriers of Urban Air Mobility
52 | P a g e
Key
Findings
Key findings uncovered through the survey include:
• Neutral to positive reactions to the UAM concept. Men, younger respondents, and wealthier respondents tended to be more excited.
• The results from the ordinal logistic model with the dependent variable willingness-to-fly indicates age, gender, and familiarity with the UAM concept were the most signifi-cant characteristics affecting a person’s stated willingness to fly. Younger, male re-spondents and those already familiar with UAM prior to the study were more willing to fly via UAM.
• Results from Stated Preference (SP) questions also indicate that age, gender, and familiarity with the concept of UAM were statistically significant predictors of whether a person would take a UAM trip. These results are directionally the same as the ordi-nal model.
• Results from the SP survey questions indicate respondents with higher incomes were more likely to take UAM trips.
• None of the metropolitan areas displayed significance in the willingness-to-fly model; however, in the model derived from the SP questions, the coefficients for Los Ange-les and the San Francisco Bay Area were statistically significant. Survey respondents from Los Angeles were more likely to agree to take a trip compared to respondents from Houston, and respondents from the San Francisco Bay Area were less likely to agree to take a UAM trip compared to respondents from Houston.
• Respondents were more receptive to using UAM for travel to the airport or long-dis-tance recreational trips than for commuting.
• Respondents most comfortable flying with passengers they know; least comfortable flying with passengers they don’t know.
• Some willingness and apprehension about flying alone (particularly in an auto-mated/remote piloted context).
• Strong preference for piloted operations; may need to offer mixed fleets and/or a dis-count for remote piloted/automated operations to gain mainstream societal ac-ceptance.
• The presence of a flight attendant did not impact willingness to fly on an automated or remote piloted UAM aircraft.
• Flight attendant did increase confidence in automated and remote piloted operations from the non-user perspective (someone on the ground).
• Preference for longer inter-city flights (e.g., Washington, D.C. to Baltimore; LA to San Diego).
• Survey and focus groups suggest some resistance to very short trips due to cost, convenience (e.g., required connections to/from vertiport; security screening; etc.).
• Some desire among younger and male respondents to pay a premium to fly alone.
• Some willingness to own and pilot UAM aircraft.
• Potential for a market for P2P operations that could help provide additional supply to scale the market (similar to Lyft and Uber).
• Existing noise concerns focus on traffic noise during the night and early morning; noise from UAM could pose a more notable obstacle in the future as electric vehicles become more mainstream (potentially causing a reduction in overall ambient noise making UAM more noticeable).

NASA UAM Market Study – The Potential Societal Barriers of Urban Air Mobility
53 | P a g e
4.0 APPENDIX
4.1.1 NASA Societal Barriers Focus Group Protocol
Introduction As part of the general population survey development, two focus groups are planned with members of the general population. The purpose of the focus groups is to identify key issues opportunities and potential societal barriers to the development of urban air mobility. This document represents the protocol for lead-ing these focus groups.
Protocol
1. Pre-Focus Group: (10 Minutes)
a. Permission to record (i.e., audio); consent forms; intake questionnaire
2. Introductory Remarks (5 Minutes)
a. Moderator introduction and focus group purpose by TSRC staff and followed by an intro-
duction of the attendees
b. Participants will be briefed on the location of exits, restrooms, and other administrative
items including that they can discontinue the focus group at any time. Participants will
also be provided with a brief focus group questionnaire to collect basic demographic in-
formation on age, ethnicity, educational attainment, and household income.
c. Brief overview of TSRC and NASA’s research on Urban Air Mobility
d. Present definition/overview of Urban Air Mobility
e. Importance/function of these focus group discussions to guide future research on this
topic
3. Baseline Questions on About Flying and Urban Air Mobility (20 Minutes)
a. How familiar are you with the term “air taxi”? Have you ever used an air taxi before?
i. What did you like/dislike about using an air taxi?
b. How familiar are you with the concept of Urban Air Mobility?
i. Moderator provides a definition and shows visuals of the Urban Air Mobility con-
cept.
4. Thoughts and Impressions about Urban Air Mobility (30 Minutes)
a. What did you like about the Urban Air Mobility concept?
b. What did you dislike about the Urban Air Mobility concept?
c. What questions/concerns do you have about the concept?
d. Would you use Urban Air Mobility? Why?
e. How would you use Urban Air Mobility? (e.g., trip purpose, frequency, distance, etc.)
f. Would you use Urban Air Mobility to …
i. Commute to work?
ii. For non-work trips?
iii. To travel to the airport?
iv. Other …
g. Do you think you would use Urban Air Mobility in place of existing trips? If so, what types
of trips (e.g., daily car commute, trips to the airport, etc.) do you think you might make via
Urban Air Mobility?
h. Would you prefer to own your own Urban Air Mobility vehicle?

NASA UAM Market Study – The Potential Societal Barriers of Urban Air Mobility
54 | P a g e
i. Would you be willing to share ownership of an Urban Air Mobility vehicle (e.g.,
with other family members, neighbors, friends, etc.)?
ii. Would you be willing to rent out your Urban Air Mobility vehicle for use by others
when you weren’t using it?
i. Would you use an Urban Air Mobility taxi (point-to-point from one origin to a single desti-
nation)?
j. Would you be willing to travel to a vertiport to take Urban Air Mobility?
i. How would you get there (e.g., car, taxi, Uber/Lyft, transit, cycle, walk, etc.)?
ii. What is the maximum distance (or travel time) you would be willing to travel to
access a vertiport?
k. Would you be willing to share a ride with other passengers for a reduced fare? If so, un-
der what circumstances?
l. Are there other examples of how you may use this concept? Which of these options do
you prefer?
m. From the user/passenger prospective of Urban Air Mobility interests or concerns you the
most?
n. Do you have any questions/concerns about Urban Air Mobility on your community (even
if you wouldn’t use the service)? (e.g., aesthetics, noise, etc.)
o. What aspect of Urban Air Mobility interests or concerns you the most in terms of its ef-
fects on your city/community?
p. What are the biggest benefits (top 3) you see in the potential for this service? What’s your
hope for its future benefits (top 3)? What are the biggest disadvantages (top 3) you see in
the potential for this service? What’s your biggest worries (top 3) about the potential of
Urban Air Mobility for your community?
5. Thoughts and Impressions About Automation & Electrification (10 Minutes)
The moderator introduces concepts and definitions of piloted aircraft, remotely piloted aircraft,
and automated aircraft.
a. By a show of hands, how many people would fly in a piloted Urban Air Mobility vehicle?
Remotely piloted? Automated?
b. What concerns you about a piloted vehicle? Remotely piloted? Automated?
c. Do you have a preference? With respect to piloted vehicles, do you have any preferences
about the pilot (e.g., any personal characteristics that would make you more or less will-
ing to fly)?
d. What are your thoughts about a gasoline powered vehicle? An electric powered vehicle?
Do you have a preference?
6. Personal Preferences (20 Minutes)
a. If you were flying in an Urban Air Mobility vehicle, are there amenities you would like to
have in flight? What type of amenities?
b. Do you have any comfort or safety concerns about flying with other passengers?
c. What types of things could we do to make you more comfortable with Urban Air Mobility?
d. Would you prefer to have assigned seats or unassigned seats? Would you be willing to
share your weight as part of a confidential user profile to aid in weight and balance of as-
signed seats?
e. As a member of the community (e.g., on the ground), do you have any concerns about
flying or Urban Air Mobility? Please explain. What types of things could we do to make
you more comfortable with Urban Air Mobility?
NASA UAM Market Study – The Potential Societal Barriers of Urban Air Mobility
55 | P a g e
f. How much would you be willing to pay for this service? (e.g., per a trip to work; per a trip
to the airport; per a month to own; etc.)?
g. What types of changes/resources/etc. would you need to accept Urban Air Mobility as a
transportation mode?
h. What types of changes/resources/etc. would you need to use Urban Air Mobility as a
transportation mode?
7. Closing (10 Minutes)
a. If you could change one thing about Urban Air Mobility, what would it be?
b. Do you have anything else you would like to share?
c. Thank you. Moderator will provide instructions on how to receive the incentive.

NASA UAM Market Study – The Potential Societal Barriers of Urban Air Mobility
56 | P a g e
4.1.2 NASA Societal Barriers Survey Instrument
Which metropolitan area do you currently reside within? (Please choose one.)
o Boston
o Chicago
o Dallas - Fort Worth
o Houston
o Los Angeles
o New York City
o Miami - Fort Lauderdale
o Philadelphia
o San Francisco Bay Area
o Washington, D.C.
o Other, please specify: ________________________________________________
What is your gender?
o Male
o Female
o Other
o Prefer not to answer

NASA UAM Market Study – The Potential Societal Barriers of Urban Air Mobility
57 | P a g e
Are you familiar with the concept of Urban Air Mobility?
o Yes
o No
o I am not sure
Please read the following definition of Urban Air Mobility. Urban Air Mobility (UAM) is a safe and efficient system for air passenger transportation within an urban area. UAM supports a mix of onboard/ground-piloted and increasingly automated operations. What is your initial reaction to Urban Air Mobility? Please select all that apply.
▢ Excited
▢ Happy
▢ Neutral
▢ Confused
▢ Concerned
▢ Surprised
▢ Skeptical
▢ Amused
▢ Other: ________________________________________________

NASA UAM Market Study – The Potential Societal Barriers of Urban Air Mobility
58 | P a g e
Please select the degree to which you agree with the following statement. If I were to fly in an Urban Air Mobility aircraft, I would feel...
Strongly agree Agree Neutral Disagree Strongly disa-
gree
Willing o o o o o
Comfortable o o o o o
Satisfied o o o o o
Safe (i.e., pro-tected against
mishaps and ac-cidents)
o o o o o
Secure (i.e., protected
against deliber-ate and inten-tional threats)
o o o o o
Afraid o o o o o
Concerned o o o o o
Confident o o o o o

NASA UAM Market Study – The Potential Societal Barriers of Urban Air Mobility
59 | P a g e
Please read the following definitions of Piloted, Remotely Piloted (with and without attendant), and Automated Aircraft (with and without attendant). Piloted Aircraft - An aircraft that is flown by a person on board who operates the flying controls of an aircraft. The pilot has taken a formal course of aviation training and holds a personal qualification, such as a pilot's license. Remotely Piloted Aircraft (with or without flight attendant) - An aircraft that is flown from a remote location without a pilot located in the aircraft itself. The aircraft is flown by a qualified remote pilot who has undertaken a formal course of aviation training and holds a personal qualification, such as a remote pilot license. If present, the flight attendant ensures passenger safety. Automated Aircraft (with or without flight attendant) - An aircraft flown without an onboard or remote pilot but rather by onboard computers and information technologies that control the aircraft. Like piloted aircraft, the auto-mated aircraft and its flight systems would be certified and regulated by the Federal Aviation Administration (FAA). If present, the flight attendant ensures passenger safety. Please select whether you would be willing to travel in an Urban Air Mobility aircraft in the following situations (i.e., piloted, remotely piloted, or automated) by yourself, and/or with other people on board. Please select all that apply.
Alone With other passengers,
whom I know With other passengers,
whom I do not know
Piloted (i.e., pilot on board) ▢ ▢ ▢
Remotely piloted (i.e., flown by a pilot not on board), with a flight at-
tendant on board
▢ ▢ ▢
Remotely piloted, with-out a flight attendant on
board ▢ ▢ ▢
Automated, with a flight attendant on board ▢ ▢ ▢
Automated, without a flight attendant on board ▢ ▢ ▢
Please select whether you would be comfortable traveling in an Urban Air Mobility aircraft in the following situa-tions (i.e., piloted, remotely piloted, or automated) by yourself, and/or with other people on board.
NASA UAM Market Study – The Potential Societal Barriers of Urban Air Mobility
60 | P a g e
Please select all that apply.
Alone With other passengers,
whom I know With other passengers,
whom I do not know
Piloted (i.e., pilot on board) ▢ ▢ ▢
Remotely piloted (i.e., flown by a pilot not on board), with a flight at-
tendant on board
▢ ▢ ▢
Remotely piloted, with-out a flight attendant on
board ▢ ▢ ▢
Automated, with a flight attendant on board ▢ ▢ ▢
Automated, without a flight attendant on board ▢ ▢ ▢
NASA UAM Market Study – The Potential Societal Barriers of Urban Air Mobility
61 | P a g e
Please select whether you would feel safe (protected against mishaps and accidents) traveling in an Urban Air Mobility aircraft in the following situations (i.e., piloted, remotely piloted, or automated) by yourself, and/or with other people on board. Please select all that apply.
Alone With other passengers,
whom I know With other passengers,
whom I do not know
Piloted (i.e., pilot on board) ▢ ▢ ▢
Remotely piloted (i.e., flown by a pilot not on board), with a flight at-
tendant on board
▢ ▢ ▢
Remotely piloted, with-out a flight attendant on
board ▢ ▢ ▢
Automated, with a flight attendant on board ▢ ▢ ▢
Automated, without a flight attendant on board ▢ ▢ ▢

NASA UAM Market Study – The Potential Societal Barriers of Urban Air Mobility
62 | P a g e
Please select whether you would feel secure (protected against deliberate and intentional threats) traveling in an Urban Air Mobility aircraft in the following situations (i.e., piloted, remotely piloted, or automated) by yourself, and/or with other people on board. Please select all that apply.
Alone With other passengers,
whom I know With other passengers,
whom I do not know
Piloted (i.e., pilot on board) ▢ ▢ ▢
Remotely piloted (i.e., flown by a pilot not on board), with a flight at-
tendant on board
▢ ▢ ▢
Remotely piloted, with-out a flight attendant on
board ▢ ▢ ▢
Automated, with a flight attendant on board ▢ ▢ ▢
Automated, without a flight attendant on board ▢ ▢ ▢
NASA UAM Market Study – The Potential Societal Barriers of Urban Air Mobility
63 | P a g e
Please select whether you would feel afraid traveling in an Urban Air Mobility aircraft in the following situations (i.e., piloted, remotely piloted, or automated) by yourself, and/or with other people on board. Please select all that apply.
Alone With other passengers,
whom I know With other passengers,
whom I do not know
Piloted (i.e., pilot on board) ▢ ▢ ▢
Remotely piloted (i.e., flown by a pilot not on board), with a flight at-
tendant on board
▢ ▢ ▢
Remotely piloted, with-out a flight attendant on
board ▢ ▢ ▢
Automated, with a flight attendant on board ▢ ▢ ▢
Automated, without a flight attendant on board ▢ ▢ ▢
If you would feel afraid traveling in an Urban Air Mobility aircraft (in any of the described situations), please ex-plain your fears:
________________________________________________________________
________________________________________________________________
________________________________________________________________
________________________________________________________________
________________________________________________________________
NASA UAM Market Study – The Potential Societal Barriers of Urban Air Mobility
64 | P a g e
Would you pay a premium fare to fly alone, without any other passengers?
o Yes
o Sometimes, it depends on the trip
o No, I wouldn't be willing to pay
o No, I wouldn't want to fly alone
o No, for reasons other than listed above, please explain:
________________________________________________
Please select the degree to which you agree with the following statement: I would be willing to go through a brief security screening process before each trip to be a passenger in an Urban Air Mobility aircraft.
o Strongly agree
o Agree
o Neutral
o Disagree
o Strongly disagree
NASA UAM Market Study – The Potential Societal Barriers of Urban Air Mobility
65 | P a g e
Please select the degree to which you agree with the following statement: I would want other passengers – people sharing the Urban Air Mobility aircraft with me – to go through a security screening process before each trip.
o Strongly agree
o Agree
o Neutral
o Disagree
o Strongly disagree
NASA UAM Market Study – The Potential Societal Barriers of Urban Air Mobility
66 | P a g e
Which in-flight amenities would be important for you to have in an Urban Air Mobility aircraft? Please select all that apply.
▢ High-performance Wi-Fi
▢ In-seat charging for electronics
▢ Texting capabilities
▢ Real-time flight information (e.g., location, speed, altitude, etc.)
▢ Real-time information alerts (e.g., weather, departure, and arrival information via text message,
email, or phone call)
▢ Ability to select your seat
▢ Private compartments (i.e., to separate yourself from other passengers)
▢ Ability to have food and beverages on board
▢ None of the above
▢ I would not fly in an Urban Air Mobility aircraft

NASA UAM Market Study – The Potential Societal Barriers of Urban Air Mobility
67 | P a g e
In the following questions, we will ask you about your recent travel patterns. Which of the following transportation modes have you used in the past two months? Please select all that apply.
▢ Drive alone in a personal vehicle
▢ Drive/Ride with a family/friend (non-commute)
▢ Carpool (for commuting)
▢ Fly in an aircraft (e.g., airplane, helicopter)
▢ Public Bus
▢ BART
▢ LA Metro
▢ Washington Metro/Metrorail
▢ NYC Subway
▢ Light Rail (i.e., rail line within an urban area)
▢ Commuter Rail (i.e., larger train between cities and suburbs)
▢ Uber/Lyft or a similar service
▢ UberPOOL/Lyft Shared rides or other pooled service
▢ Uber Express POOL
NASA UAM Market Study – The Potential Societal Barriers of Urban Air Mobility
68 | P a g e
▢ Taxi (not Uber or Lyft)
▢ Personal Bicycle
▢ Dockless bikesharing (e.g., Spin, Lime, JUMP)
▢ Station-Based bikesharing (e.g., Citi Bike, Ford GoBike, Capital Bikeshare)
▢ Walk/run (to a destination)
▢ Round-trip carsharing (e.g., Zipcar, Getaround)
▢ One-way carsharing (e.g., car2go, ReachNow)
▢ Hourly rental cars
▢ Personal motorcycle or scooter
▢ Moped-style scooter sharing (e.g., Scoot Networks)
▢ Scooter sharing (e.g., Bird, Lime-S)
▢ Vanpool
▢ Microtransit (e.g., Chariot, Via)
▢ Ferry (for commuting)
▢ Other, please specify: ________________________________________________

NASA UAM Market Study – The Potential Societal Barriers of Urban Air Mobility
69 | P a g e
When you choose how to travel to a destination (e.g., driving, flying in an airplane, taking public transit, etc.), which of the following factors impact your decision? Please select all that apply.
▢ Cost
▢ Convenience
▢ Reliability
▢ Flexibility
▢ Speed
▢ Time to be productive or to spend as I choose
▢ Amenities (e.g., radio, WiFi, etc.). Please specify:
________________________________________________
▢ Reduced environmental (greenhouse gas) impact
▢ Other, please specify: ________________________________________________
Of the factors you selected, please rate their importance to you on a scale of 1 to 10, where 1 is the least im-portant and 10 is the most important.
1 2 3 4 5 6 7 8 9 10

NASA UAM Market Study – The Potential Societal Barriers of Urban Air Mobility
70 | P a g e
Cost ()
Convenience ()
Reliability ()
Flexibility ()
Speed ()
Time to be productive or to spend as I choose ()
Amenities (e.g., radio, WiFi, etc.), specifically: ${Q1/ChoiceTextEntryValue/5} ()
Reduced environmental (greenhouse gas) impact ()
Other, specifically: ${Q1/ChoiceTextEntryValue/7} ()

NASA UAM Market Study – The Potential Societal Barriers of Urban Air Mobility
71 | P a g e
What was the purpose of your most recent trip (either local or long distance) other than to/from work or school?
o Urban recreational trip (e.g., a trip within a city)
o Long distance recreational trip (e.g., a trip between cities)
o Go to/from healthcare services
o Go to/from the airport
o Other, please specify: ________________________________________________
Q54 On this most recent trip, how did you travel to your final destination? Check all that apply.
▢ Drive alone in a personal vehicle
▢ Drive/Ride with a family/friend (non-commute)
▢ Carpool (for commuting)
▢ Fly in an aircraft (e.g., airplane, helicopter)
▢ Public Bus
▢ BART
▢ LA Metro
▢ Washington Metro/Metrorail
▢ NYC Subway
▢ Light Rail (i.e., rail line within an urban area)

NASA UAM Market Study – The Potential Societal Barriers of Urban Air Mobility
72 | P a g e
▢ Commuter Rail (i.e., larger train between cities and suburbs)
▢ Uber/Lyft or a similar service
▢ UberPOOL/Lyft Shared rides or other pooled service
▢ Uber Express POOL
▢ Taxi (not Uber or Lyft)
▢ Personal Bicycle
▢ Dockless bikesharing (e.g., Spin, Lime, JUMP)
▢ Station-based bikesharing (e.g., Citi Bike, Ford GoBike, Capital Bikeshare)
▢ Walk/run (to a destination)
▢ Round-trip carsharing (e.g., Zipcar, Getaround)
▢ One-way carsharing (e.g., car2go, ReachNow)
▢ Hourly rental cars
▢ Personal motorcycle or scooter
▢ Moped-style scooter sharing (e.g., Scoot Networks)
▢ Scooter sharing (e.g., Bird, Lime-S)
▢ Vanpool

NASA UAM Market Study – The Potential Societal Barriers of Urban Air Mobility
73 | P a g e
▢ Microtransit (e.g., Chariot, Via)
▢ Ferry (for commuting)
▢ Other____________________________
About how far (distance, in miles) did you travel on this most recent trip?
o 0 - 0.5 miles
o 0.6 - 1 miles
o 1.1 - 3 miles
o 3.1 - 5 miles
o 5.1 - 10 miles
o 10.1 - 15 miles
o 15.1 - 25 miles
o 25.1 - 50 miles
o 50.1 - 75 miles
o 75.1-100 miles
o Over 100 miles

NASA UAM Market Study – The Potential Societal Barriers of Urban Air Mobility
74 | P a g e
How many days per week do you currently commute to work or school?
o 0 days per week
o 1 day per week
o 2 days per week
o 3 days per week
o 4 days per week
o 5 days per week
o 6 days per week
o 7 days per week

NASA UAM Market Study – The Potential Societal Barriers of Urban Air Mobility
75 | P a g e
How do you typi-cally commute to work or school?
Please indicate
how many days a week you typically commute to work by the transporta-
tion modes be-low. "0 days per
week" is selected by default; if you
do not use a mode, leave it
blank.
0 days per
1 days per
2 days per
3 days per
4 days per
5 days per
6 days per
7 days per
I telecommute (work from
home); I do not commute to work/school
o o o o o o o o
Drive alone in a personal vehicle o o o o o o o o
Drive/Ride with a family/friend
(non-commute) o o o o o o o o
Carpool (for com-muting) o o o o o o o o
Public Bus o o o o o o o o
BART o o o o o o o o
LA Metro o o o o o o o o
Washington Metro/Metrorail o o o o o o o o

NASA UAM Market Study – The Potential Societal Barriers of Urban Air Mobility
76 | P a g e
NYC Subway o o o o o o o o
Light Rail (i.e., rail line within an ur-
ban area) o o o o o o o o
Commuter Rail (i.e., larger train between cities and suburbs)
o o o o o o o o
Uber/Lyft or a similar service o o o o o o o o
UberPOOL/Lyft Shared rides or
other pooled ser-vice
o o o o o o o o
Uber Express POOL o o o o o o o o
Taxi (not Uber or Lyft) o o o o o o o o
Personal Bicycle o o o o o o o o
Dockless Bikeshar-ing (e.g., Spin, Lime, JUMP)
o o o o o o o o
Station-Based Bikesharing (e.g., Citi Bike, Ford Go-
Bike, Capital Bikeshare) (15)
o o o o o o o o
Walk/run (to a destination) (16) o o o o o o o o
Round-trip car-sharing (e.g., Zip-car, Getaround)
o o o o o o o o

NASA UAM Market Study – The Potential Societal Barriers of Urban Air Mobility
77 | P a g e
One-way carshar-ing (e.g., car2go,
ReachNow) o o o o o o o o
Hourly rental cars o o o o o o o o
Personal motorcy-cle or scooter o o o o o o o o
Moped-style scooter sharing (e.g., Scoot Net-
works)
o o o o o o o o
Scooter sharing (e.g., Bird, Lime-S) o o o o o o o o
Vanpool o o o o o o o o
Microtransit (e.g., Chariot, Via) o o o o o o o o
Ferry (for com-muting) o o o o o o o o
Other o o o o o o o o
How far (distance, in miles) is your one-way commute to work or school?
▼ 0 - 0.5 miles each way ... Over 100 miles each way
In the following questions, we will explore potential travel scenarios for Urban Air Mobility.
NASA UAM Market Study – The Potential Societal Barriers of Urban Air Mobility
78 | P a g e
Please select the trip purposes for which you would consider using an Urban Air Mobility aircraft. You may select more than one trip purpose.
▢ Commute to/from work or school
▢ Urban recreational trip (e.g., a trip within a city)
▢ Long-distance recreational trip (e.g., a trip between cities)
▢ Go to/from healthcare services
▢ Go to/from the airport
▢ Other, please specify: ________________________________________________

NASA UAM Market Study – The Potential Societal Barriers of Urban Air Mobility
79 | P a g e
For the trip pur-poses you selected, please select who you would likely travel with in an
Urban Air Mobility taxi.
Alone Spouse/Part-
ner Chil-dren
Par-ents
Sib-lings
Other rela-tives
Friends Col-
leagues Other
Commute to/from work or school ▢ ▢ ▢ ▢ ▢ ▢ ▢ ▢ ▢
Urban recreational trip (e.g., a trip within a city)
▢ ▢ ▢ ▢ ▢ ▢ ▢ ▢ ▢
Long-distance rec-reational trip (e.g., a trip between cit-
ies)
▢ ▢ ▢ ▢ ▢ ▢ ▢ ▢ ▢
Go to/from healthcare services ▢ ▢ ▢ ▢ ▢ ▢ ▢ ▢ ▢
Go to/from the air-port ▢ ▢ ▢ ▢ ▢ ▢ ▢ ▢ ▢
Other: ▢ ▢ ▢ ▢ ▢ ▢ ▢ ▢ ▢
If you selected "other" for any of the previous trip purposes, please explain your relationship to the people that you would travel with: ________________________________________________________________ In this survey, we ask you to imagine your travel behavior in a future with new transportation modes available. In this future world, you may also have the opportunity to use automated vehicles (AVs) or shared automated vehi-cles (SAVs). AVs are vehicles that move passengers with some level of automation that assists or replaces human control.

NASA UAM Market Study – The Potential Societal Barriers of Urban Air Mobility
80 | P a g e
Shared AVs are automated vehicles that are shared among multiple users and can be summoned on-demand simi-lar to ridesourcing (Uber/Lyft) or can operate a fixed-route service like a bus. For the trip purposes you selected for Urban Air Mobility travel, please indicate whether you would prefer to travel with an automated vehicle (AV) or an Urban Air Mobility (UAM) aircraft.
Prefer to use AV Neutral Prefer to use UAM Air-
craft
Commute to/from work or school o o o
Urban recreational trip (e.g., a trip within a city) o o o
Long-distance recrea-tional trip (e.g., a trip be-
tween cities) o o o
Go to/from healthcare services o o o
Go to/from the airport o o o
Other: o o o

NASA UAM Market Study – The Potential Societal Barriers of Urban Air Mobility
81 | P a g e
For the trip purposes you selected for Urban Air Mobility travel, please indicate whether you would pre-fer to travel with a shared automated vehicle (SAV) or an Urban Air Mobility (UAM) aircraft.
Prefer to use SAV Neutral Prefer to use UAM Air-
craf
Commute to/from work or school o o o
Urban recreational trip (e.g., a trip within a
city) o o o
Long-distance recrea-tional trip (e.g., a trip
between cities) o o o
Go to/from healthcare services o o o
Go to/from the airport o o o
Other: o o o
You will be presented with five possible trips that could be taken using an Urban Air Mobility aircraft. Each trip will vary in purpose, cost, and distance traveled. You will be asked whether you would consider taking each trip. There are no right or wrong answers. This is a practice question. Please select whether you would choose to take this Urban Air Mobility trip. Trip Details Going to Work/School
o Yes, I would take this trip.
o No, I would not take this trip.
NASA UAM Market Study – The Potential Societal Barriers of Urban Air Mobility
82 | P a g e
Trip 1 Please select whether you would choose to take this Urban Air Mobility trip. Trip Details
o Yes, I would take this trip.
o No, I would not take this trip.
Trip 2 Please select whether you would choose to take this Urban Air Mobility trip. Trip Details
o Yes, I would take this trip.
o No, I would not take this trip.
Trip 3 Please select whether you would choose to take this Urban Air Mobility trip. Trip Details
o Yes, I would take this trip.
o No, I would not take this trip.
Trip 4 Please select whether you would choose to take this Urban Air Mobility trip. Trip Details
o Yes, I would take this trip.
o No, I would not take this trip.
NASA UAM Market Study – The Potential Societal Barriers of Urban Air Mobility
83 | P a g e
Trip 5 Please select whether you would choose to take this Urban Air Mobility trip. Trip Details
o Yes, I would take this trip.
o No, I would not take this trip.
A vertiport is a specified landing/takeoff location for Urban Air Mobility aircraft. Examples of vertiports are de-picted in the following pictures:
Would you be willing to travel to a vertiport (i.e., a specified landing/takeoff location) to take an Urban Air Mobility aircraft?
o Yes
o No
o Maybe
What is the maximum time you would travel to access a vertiport?
▼ 0 - 5 minutes (1) ... Over 2 hours (10)

NASA UAM Market Study – The Potential Societal Barriers of Urban Air Mobility
84 | P a g e
What is the most you would be willing to pay for a one-way trip to get to or from the vertiport?
o $0 - $0.99 one-way
o $1 - $2.99 one-way
o $3 - $4.99 one-way
o $5 - $9.99 one-way
o $10 - $14.99 one-way
o $15 - $19.99 one-way
o $20 - $40 one-way
o More than $40 one-way
NASA UAM Market Study – The Potential Societal Barriers of Urban Air Mobility
85 | P a g e
Please select the mode that you would prefer to use to access a vertiport.
o Drive alone in a personal vehicle
o Personally owned Automated Vehicle
o Drive/Ride with a family/friend (non-commute)
o Carpool (for commuting)
o Public Bus
o BART
o LA Metro
o Washington Metro/Metrorail
o NYC Subway
o Light Rail (i.e., rail line within an urban area)
o Commuter Rail (i.e., larger train between cities and suburbs)
o Uber/Lyft or other service
o UberPOOL/Lyft Shared rides or other pooled service
o Uber Express POOL
o Taxi (not Uber or Lyft)
o Shared Automated Vehicle (e.g., Waymo)
o Personal bicycle
NASA UAM Market Study – The Potential Societal Barriers of Urban Air Mobility
86 | P a g e
o Dockless bikesharing (e.g., Spin, Lime, JUMP)
o Station-based bikesharing (e.g., Citi Bike, Ford GoBike)
o Walk/run (to a destination)
o Round-trip carsharing (e.g., Zipcar, Getaround)
o One-way carsharing (e.g., car2go, ReachNow)
o Hourly rental cars
o Personal motorcycle or scooter
o Moped-style scooter sharing (e.g., Scoot Networks)
o Scooter sharing (e.g., Bird, Lime-S)
o Vanpool
o Microtransit (e.g., Chariot, Via)
o Ferry (for commuting)
o Other, please specify: ________________________________________________

NASA UAM Market Study – The Potential Societal Barriers of Urban Air Mobility
87 | P a g e
Would you prefer to own a personal Urban Air Mobility aircraft?
o Yes
o Maybe
o No
o I do not know
Would you be willing to rent your personal Urban Air Mobility aircraft for use by others during times when you are not using it?
o Yes
o Maybe
o No
o I do not know
Would you be willing to share ownership of an Urban Air Mobility aircraft?

NASA UAM Market Study – The Potential Societal Barriers of Urban Air Mobility
88 | P a g e
This could include sharing with friends, family members, neighbors, etc.
o Yes
o Maybe
o No
o I do not know
Would you be willing to fly an Urban Air Mobility aircraft as an on-board pilot?
o Yes
o Maybe
o No
o I do not know
Do you currently have a pilot's license?
o Yes
o No
In the following questions, we explore how weather would affect your experience as a passenger in an Urban Air Mobility aircraft.
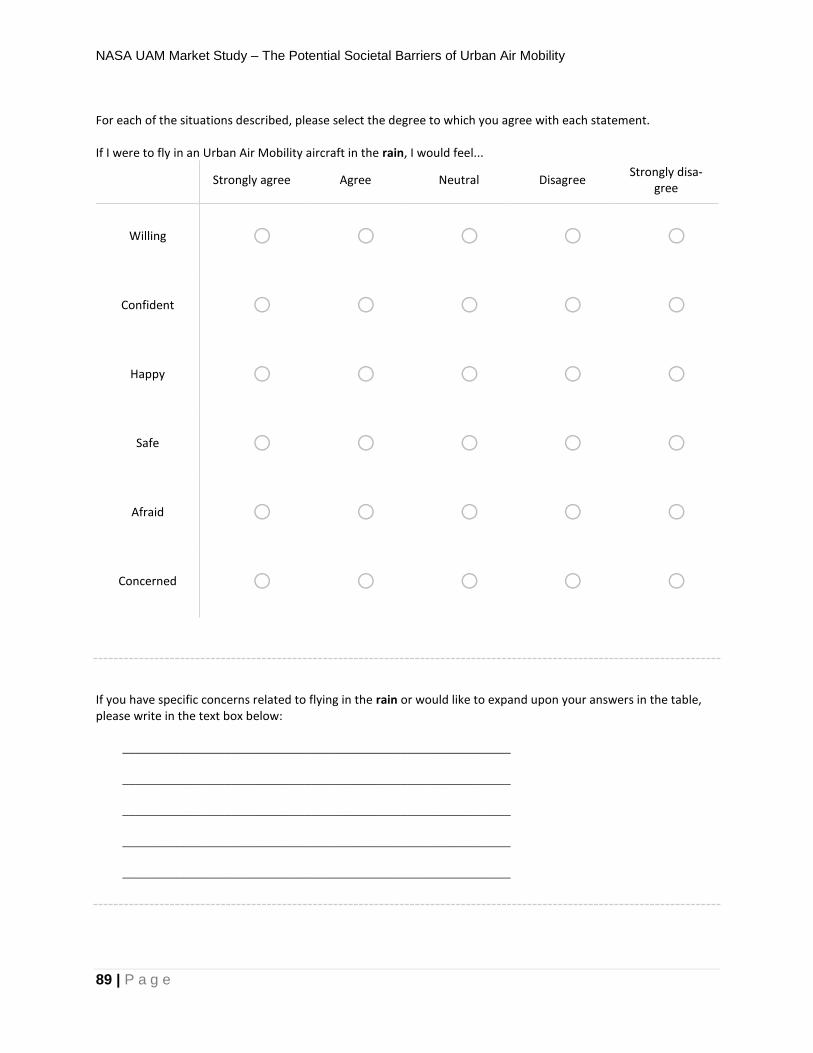
NASA UAM Market Study – The Potential Societal Barriers of Urban Air Mobility
89 | P a g e
For each of the situations described, please select the degree to which you agree with each statement. If I were to fly in an Urban Air Mobility aircraft in the rain, I would feel...
Strongly agree Agree Neutral Disagree Strongly disa-
gree
Willing o o o o o
Confident o o o o o
Happy o o o o o
Safe o o o o o
Afraid o o o o o
Concerned o o o o o
If you have specific concerns related to flying in the rain or would like to expand upon your answers in the table, please write in the text box below:
________________________________________________________________
________________________________________________________________
________________________________________________________________
________________________________________________________________
________________________________________________________________
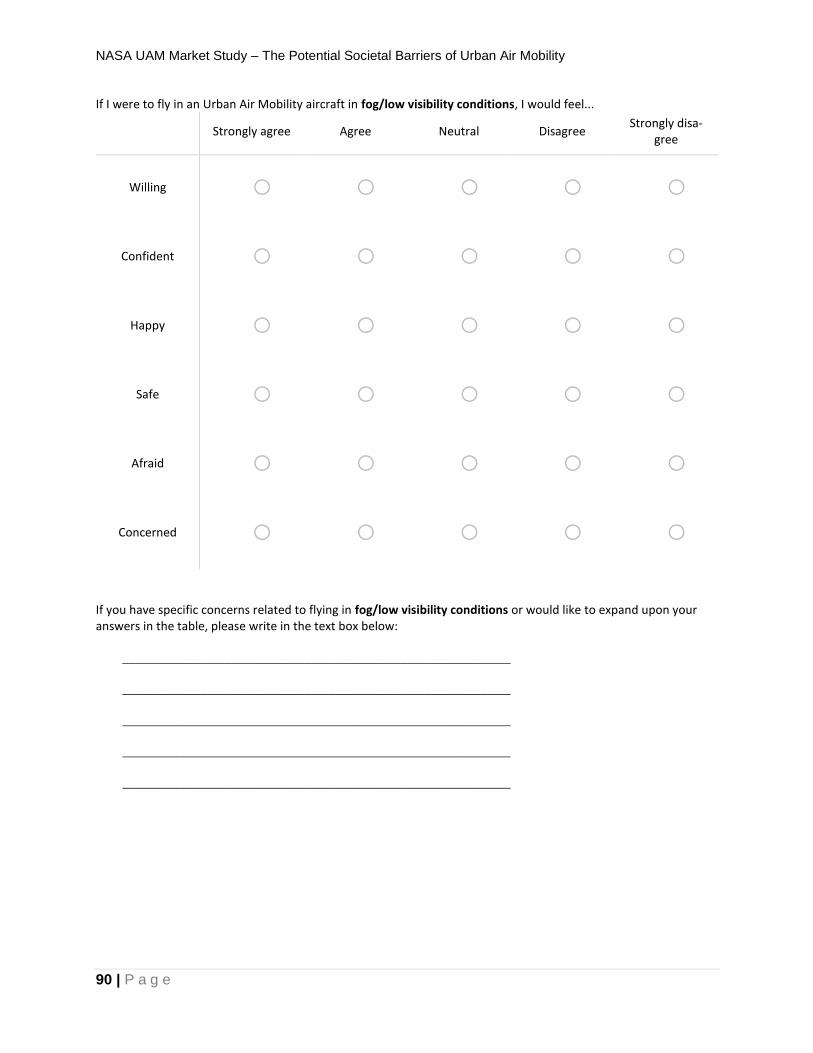
NASA UAM Market Study – The Potential Societal Barriers of Urban Air Mobility
90 | P a g e
If I were to fly in an Urban Air Mobility aircraft in fog/low visibility conditions, I would feel...
Strongly agree Agree Neutral Disagree Strongly disa-
gree
Willing o o o o o
Confident o o o o o
Happy o o o o o
Safe o o o o o
Afraid o o o o o
Concerned o o o o o
If you have specific concerns related to flying in fog/low visibility conditions or would like to expand upon your answers in the table, please write in the text box below:
________________________________________________________________
________________________________________________________________
________________________________________________________________
________________________________________________________________
________________________________________________________________
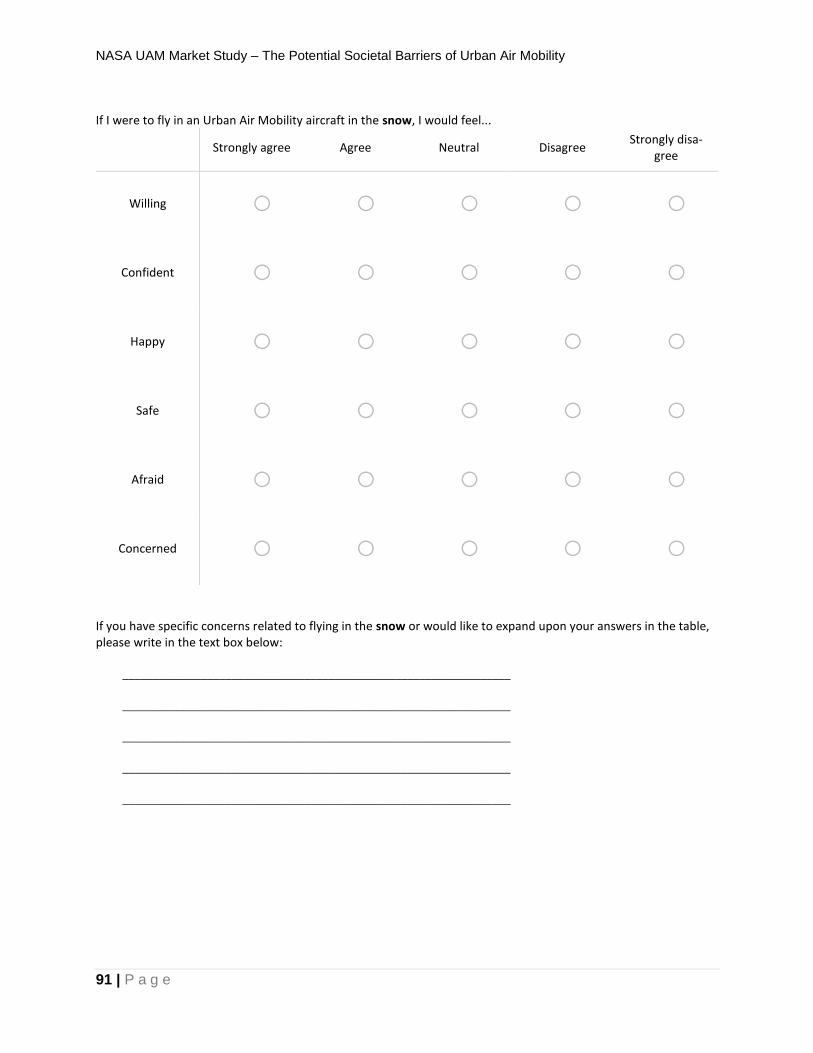
NASA UAM Market Study – The Potential Societal Barriers of Urban Air Mobility
91 | P a g e
If I were to fly in an Urban Air Mobility aircraft in the snow, I would feel...
Strongly agree Agree Neutral Disagree Strongly disa-
gree
Willing o o o o o
Confident o o o o o
Happy o o o o o
Safe o o o o o
Afraid o o o o o
Concerned o o o o o
If you have specific concerns related to flying in the snow or would like to expand upon your answers in the table, please write in the text box below:
________________________________________________________________
________________________________________________________________
________________________________________________________________
________________________________________________________________
________________________________________________________________

NASA UAM Market Study – The Potential Societal Barriers of Urban Air Mobility
92 | P a g e
If I were to fly in an Urban Air Mobility aircraft in the wind with light turbulence, I would feel...
Strongly agree Agree Neutral Disagree Strongly disa-
gree
Willing o o o o o
Confident o o o o o
Happy o o o o o
Safe o o o o o
Afraid o o o o o
Concerned o o o o o
If you have specific concerns related to flying in the wind with light turbulence or would like to expand upon your answers in the table, please write in the text box below:
________________________________________________________________
________________________________________________________________
________________________________________________________________
________________________________________________________________
________________________________________________________________

NASA UAM Market Study – The Potential Societal Barriers of Urban Air Mobility
93 | P a g e
If I were to fly in an Urban Air Mobility aircraft in heat or cold (i.e., more than 90 degrees Fahrenheit outside or less than 32 degrees Fahrenheit outside in a climate-controlled aircraft), I would feel...
Strongly agree Agree Neutral Disagree Strongly disa-
gree
Willing o o o o o
Confident o o o o o
Happy o o o o o
Safe o o o o o
Afraid o o o o o
Concerned o o o o o
If you have specific concerns related to flying in heat or cold or would like to expand upon your answers in the ta-ble, please write in the text box below:
________________________________________________________________
________________________________________________________________
________________________________________________________________
________________________________________________________________
________________________________________________________________
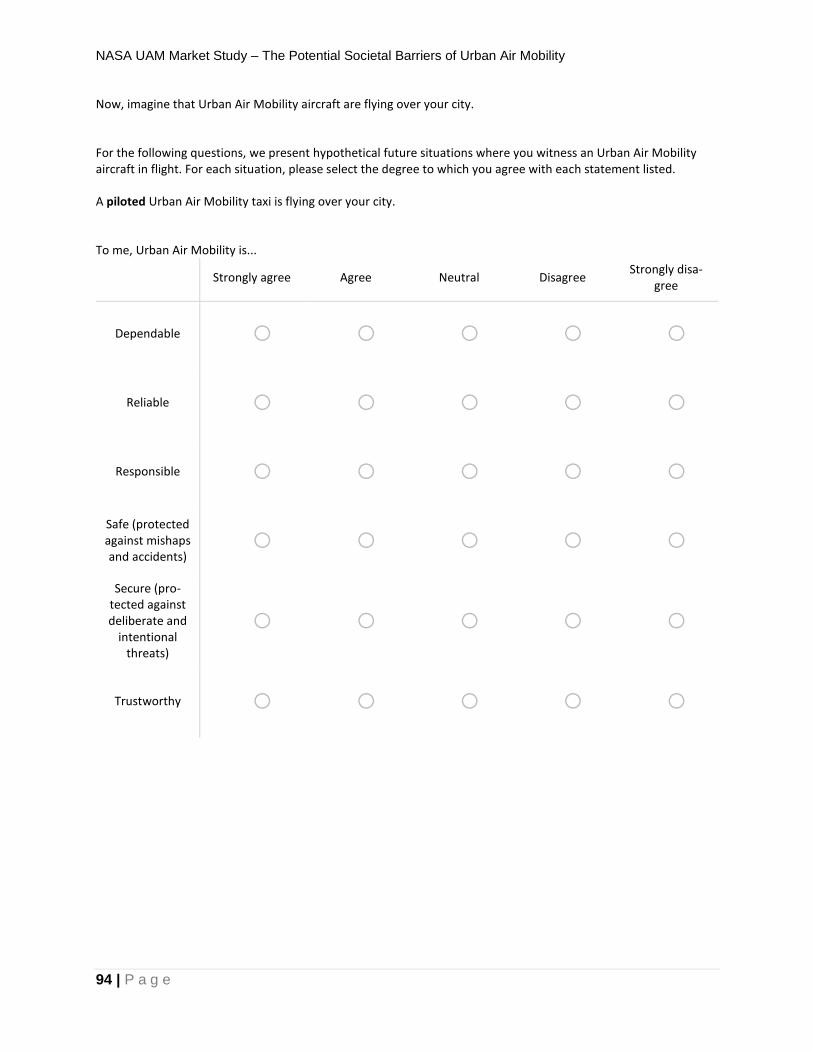
NASA UAM Market Study – The Potential Societal Barriers of Urban Air Mobility
94 | P a g e
Now, imagine that Urban Air Mobility aircraft are flying over your city. For the following questions, we present hypothetical future situations where you witness an Urban Air Mobility aircraft in flight. For each situation, please select the degree to which you agree with each statement listed. A piloted Urban Air Mobility taxi is flying over your city. To me, Urban Air Mobility is...
Strongly agree Agree Neutral Disagree Strongly disa-
gree
Dependable o o o o o
Reliable o o o o o
Responsible o o o o o
Safe (protected against mishaps and accidents)
o o o o o
Secure (pro-tected against deliberate and
intentional threats)
o o o o o
Trustworthy o o o o o
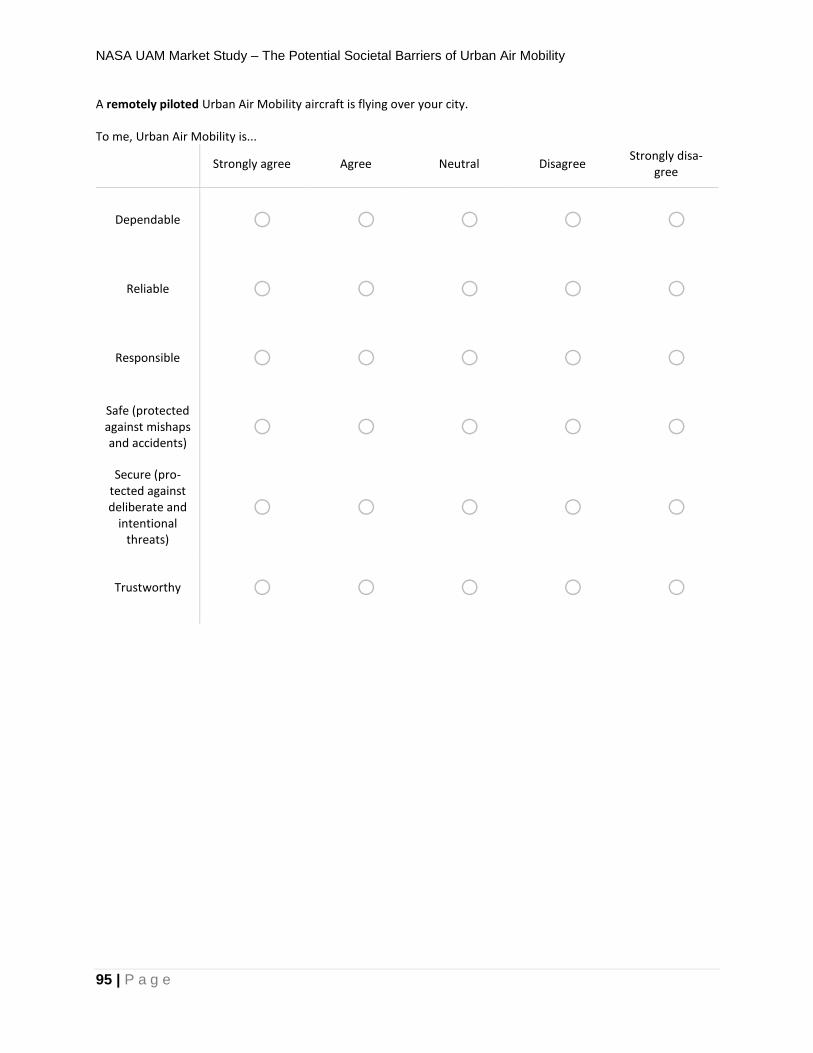
NASA UAM Market Study – The Potential Societal Barriers of Urban Air Mobility
95 | P a g e
A remotely piloted Urban Air Mobility aircraft is flying over your city. To me, Urban Air Mobility is...
Strongly agree Agree Neutral Disagree Strongly disa-
gree
Dependable o o o o o
Reliable o o o o o
Responsible o o o o o
Safe (protected against mishaps and accidents)
o o o o o
Secure (pro-tected against deliberate and
intentional threats)
o o o o o
Trustworthy o o o o o

NASA UAM Market Study – The Potential Societal Barriers of Urban Air Mobility
96 | P a g e
An automated Urban Air Mobility taxi is flying over your city. There is at least one flight attendant on board. To me, Urban Air Mobility is...
Strongly agree Agree Neutral Disagree Strongly disa-
gree
Dependable o o o o o
Reliable o o o o o
Responsible o o o o o
Safe (protected against mishaps and accidents)
o o o o o
Secure (pro-tected against deliberate and
intentional threats)
o o o o o
Trustworthy o o o o o
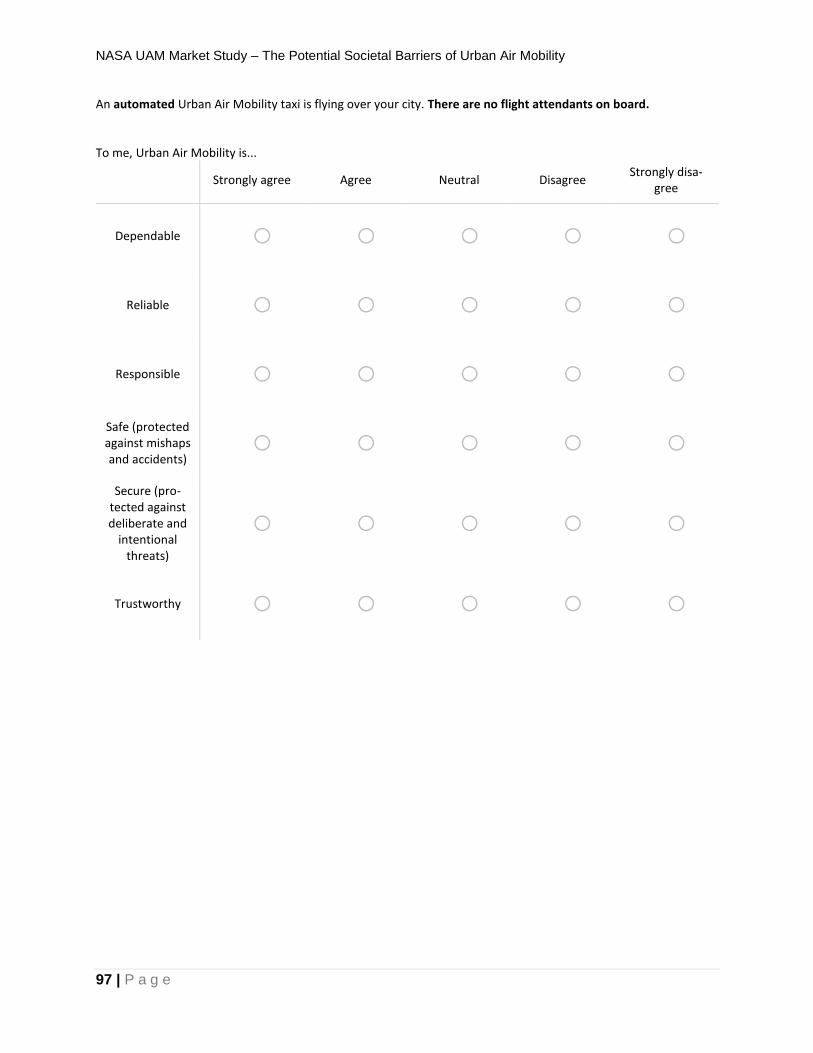
NASA UAM Market Study – The Potential Societal Barriers of Urban Air Mobility
97 | P a g e
An automated Urban Air Mobility taxi is flying over your city. There are no flight attendants on board. To me, Urban Air Mobility is...
Strongly agree Agree Neutral Disagree Strongly disa-
gree
Dependable o o o o o
Reliable o o o o o
Responsible o o o o o
Safe (protected against mishaps and accidents)
o o o o o
Secure (pro-tected against deliberate and
intentional threats)
o o o o o
Trustworthy o o o o o
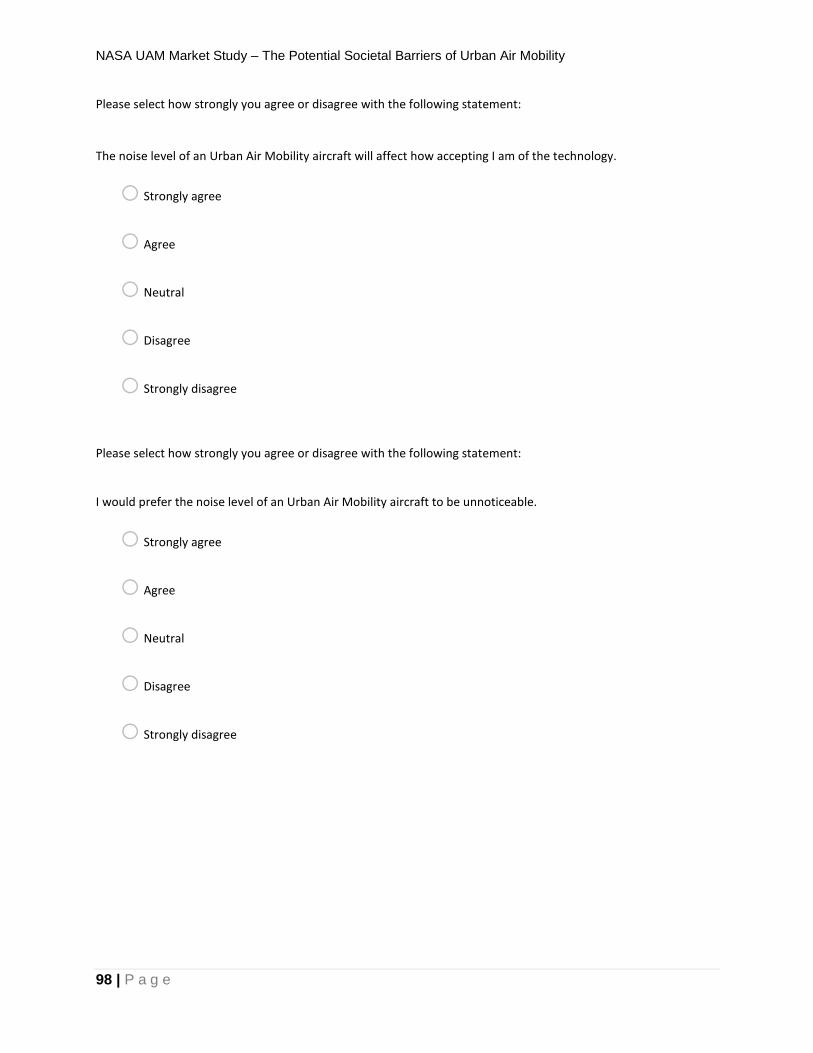
NASA UAM Market Study – The Potential Societal Barriers of Urban Air Mobility
98 | P a g e
Please select how strongly you agree or disagree with the following statement: The noise level of an Urban Air Mobility aircraft will affect how accepting I am of the technology.
o Strongly agree
o Agree
o Neutral
o Disagree
o Strongly disagree
Please select how strongly you agree or disagree with the following statement: I would prefer the noise level of an Urban Air Mobility aircraft to be unnoticeable.
o Strongly agree
o Agree
o Neutral
o Disagree
o Strongly disagree

NASA UAM Market Study – The Potential Societal Barriers of Urban Air Mobility
99 | P a g e
How often are you disturbed by noise generally?
o Never
o Rarely
o Occasionally
o Frequently
o Always
What source of noise bothers you the most? Please select one.
o Noise from trains
o Noise from a neighboring property
o Noise from passersby (street noise)
o Noise from motor vehicles
o Noise from aircraft operations
o Other: ________________________________________________
When are you bothered by aircraft noise? Please select all that apply.
▢ Early morning hours
▢ Around midday
▢ Evening hours
▢ During the night

NASA UAM Market Study – The Potential Societal Barriers of Urban Air Mobility
100 | P a g e
In which locations are you disturbed by noise? Please select all that apply.
▢ At work
▢ At school
▢ Outdoors
▢ At home
▢ Other: ________________________________________________
5 Please select whether you have ever flown as a passenger in the types of aircraft listed below.
Yes No I am not sure
Large airplane (81+ pas-sengers) o o o
Regional airplane (41 - 80 passengers) o o o
Small airplane (1 - 40 pas-sengers) o o o
Helicopter o o o
NASA UAM Market Study – The Potential Societal Barriers of Urban Air Mobility
101 | P a g e
About how often do you fly in any type of aircraft (i.e., large or small airplane, helicopter)?
o Never
o Less than once per year
o 1 to 6 times per year
o 7 to 11 times per year
o Once per month
o Two times per month
o 1 to 3 times per week
o More than 3 times per week
For what trip purposes do you usually fly in any type of aircraft?
o Business
o Leisure/recreation
o Both (3)
o Neither, please explain: ________________________________________________
NASA UAM Market Study – The Potential Societal Barriers of Urban Air Mobility
102 | P a g e
Before your last flight, how did you travel to your departure airport? If you used more than one mode, please select all modes that you used to get to the airport.
▢ Drive alone in a personal vehicle
▢ Drive/Ride with a family/friend (non-commute)
▢ Carpool (for commuting)
▢ Public Bus
▢ BART
▢ LA Metro
▢ Washington Metro/Metrorail
▢ NYC Subway
▢ Light Rail (i.e., rail line within an urban area)
▢ Commuter Rail (i.e., larger train between cities and suburbs)
▢ Uber/Lyft or similar service
▢ UberPOOL/Lyft Shared rides or other pooled service
▢ Uber Express POOL
▢ Taxi (not Uber or Lyft)
▢ Personal Bicycle

NASA UAM Market Study – The Potential Societal Barriers of Urban Air Mobility
103 | P a g e
▢ Dockless bikesharing (e.g., Spin, Lime, JUMP)
▢ Station-based bikesharing (e.g., Citi Bike, Ford GoBike)
▢ Walk/run (to a destination)
▢ Round-trip carsharing (e.g, Zipcar, Getaround)
▢ One-way carsharing (e.g., car2go, ReachNow)
▢ Hourly rental cars
▢ Personal motorcycle or scooter
▢ Moped-style scooter sharing (e.g., Scoot Networks)
▢ Scooter sharing (e.g., Bird, Lime-S)
▢ Vanpool
▢ Microtransit (e.g., Chariot, Via)
▢ Ferry (for commuting)
▢ Other

NASA UAM Market Study – The Potential Societal Barriers of Urban Air Mobility
104 | P a g e
Please select whether the following factors related to booking a flight encourage or discourage you from flying more frequently. Select neutral, if they have no effect.
Very much encourage
Encourage Neutral Discourage Very much discourage
I do not know
Flexibility (e.g., ability to change
flight book-ings)
o o o o o o
Total flight time (e.g., number of
stops and/or layovers)
o o o o o o
Convenience o o o o o o
Dependabil-ity (i.e., accu-
racy of air-craft arrival and/or de-
parture time)
o o o o o o
Cost of flying o o o o o o
Booking ex-perience o o o o o o
Safety con-cerns o o o o o o
Getting to ex-plore/visit
places out of town
o o o o o o
Other, please specify: o o o o o o
NASA UAM Market Study – The Potential Societal Barriers of Urban Air Mobility
105 | P a g e
Please select whether the following factors related to the flying experience encourage or discourage you from fly-ing more frequently. Select neutral, if they have no effect.
Very much encourage
Encourage Neutral Discourage Very much discourage
I do not know
Accessibility to/from the
airport o o o o o o
Check-in ex-perience o o o o o o
Checked bag-gage proce-dures and handling
o o o o o o
Security pro-cess o o o o o o
Lines/wait times o o o o o o
Boarding pro-cess o o o o o o
Carry-on bag-gage proce-
dures o o o o o o
On-board ex-perience o o o o o o
Anxiety around flying o o o o o o
Impact on carbon foot-
print o o o o o o
Other, please specify: o o o o o o

NASA UAM Market Study – The Potential Societal Barriers of Urban Air Mobility
106 | P a g e
Please indicate how important each of the following factors is to your onboard flying experience.
Very im-portant
Important Neutral Not im-portant
Not at all im-portant
I do not know
In-flight en-tertainment o o o o o o
On-board ser-
vices/ameni-ties
o o o o o o
A comforta-ble seat o o o o o o
Pleasant am-bient temper-
ature o o o o o o
Minimal tur-bulence/vi-
brations o o o o o o
Low noise o o o o o o
Other, please explain: o o o o o o

NASA UAM Market Study – The Potential Societal Barriers of Urban Air Mobility
107 | P a g e
The following are questions about you and your household. Including yourself, how many people live in your current household?
o 1
o 2
o 3
o 4
o 5
o 6
o More than 6
How would you describe the other members of your household? (e.g., if you live with your mother, select "Par-ent/Guardian(s)")? Please select all that apply.
▢ Parent/Guardian(s)
▢ Relatives (e.g., siblings, etc.)
▢ Housemates/Roommates
▢ Partner/Significant Other
▢ Children (who are under your guardianship)

NASA UAM Market Study – The Potential Societal Barriers of Urban Air Mobility
108 | P a g e
Please select the option that BEST describes how you and the other people in your household manage finances. This question helps us frame survey questions and responses in the appropriate context.
o We share expenses (e.g., rent, utilities), but we do not share income.
o We share expenses (e.g., rent, utilities) AND income, and we make purchasing decisions together (e.g, we
would decide whether to buy a personal vehicle together).
o Other, please specify: ________________________________________________
In what year were you born?
▼ 2000 (0) ... I prefer not to answer. (86)
Q66 What is the highest level of education you have completed?
o Less than high school
o Currently in high school
o High school GED
o Currently in 2-year college
o 2-year college degree
o Currently in 4-year college
o 4-year college degree
o Currently in post-graduate degree
o Post-graduate degree (MA, MS, PhD, MD, JD, etc.)
o Prefer not to answer
NASA UAM Market Study – The Potential Societal Barriers of Urban Air Mobility
109 | P a g e
What is your race or ethnicity? (Please check all that apply.)
▢ African American
▢ American Indian or Alaskan Native
▢ Asian
▢ Caucasian/White
▢ Hispanic or Latino
▢ Middle-Eastern
▢ Native Hawaiian or Pacific Islander
▢ South Asian (e.g., Indian, Pakistani, etc.)
▢ Southeast Asian
▢ Other, please specify: ________________________________________________
▢ Prefer not to answer
NASA UAM Market Study – The Potential Societal Barriers of Urban Air Mobility
110 | P a g e
What kind of housing do you currently live in?
o Detached single-family home
o Building/house with fewer than 10 units
o Building with between 10 and 100 units
o Building with more than 100 units
o Mobile home/RV/Trailer
Approximately what was your gross (pre-tax) income last year?
o Less than $10,000
o $10,000 - $14,999
o $15,000 - $24,999
o $25,000 - $49,999
o $50,000 - $74,999
o $75,000 - $99,999
o $100,000 - $149,999
o $150,000 - $199,999
o $200,000 or more
o Prefer not to answer
NASA UAM Market Study – The Potential Societal Barriers of Urban Air Mobility
111 | P a g e
Please indicate the number of household members (including yourself) that fall into the different age groups listed below. Your household includes people who live with you and with whom you share income. "0" is selected by default. If you do not have anyone in an age range, leave the selection as is.
0 1 2 3 4 More than 5
0 - 5 o o o o o o
6 - 15 o o o o o o
16 - 18 o o o o o o
19 - 24 o o o o o o
25 - 34 o o o o o o
35 - 44 o o o o o o
45 - 54 o o o o o o
55 - 65 o o o o o o
66 or older o o o o o o
What are your households CURRENT estimated monthly ground transportation expenses?

NASA UAM Market Study – The Potential Societal Barriers of Urban Air Mobility
112 | P a g e
Please include expenses related to public transportation; personal vehicle expenses (e.g., fuel, maintenance, park-ing); taxi/Uber/Lyft; and biking expenses. Please exclude: Airfare expenses.
o $0 - $99
o $100 - $199
o $200 - $299
o $300 - $399
o $400 - $499
o $500 - $599
o $600 - $699
o $700 - $799
o $800 - $899
o $900 - $999
o $1000 or more
o Not sure
NASA UAM Market Study – The Potential Societal Barriers of Urban Air Mobility
113 | P a g e
Please indicate two streets that cross near your HOME location, as well as the city (please indicate NW, NE, SW, SE, if applicable).
o City ________________________________________________
o Street #1 ________________________________________________
o Street #2 ________________________________________________
Please indicate two streets that cross near your WORK/SCHOOL location, as well as the city (please indicate NW, NE, SW, SE, if applicable).
o City ________________________________________________
o Street #1 ________________________________________________
o Street #2 ________________________________________________
[OPTIONAL] This survey asked a lot of questions about your travel behavior and perceptions of Urban Air Mobility. If you would like, please feel free to elaborate here about your perceptions of Urban Air Mobility. Your comments (if you provide any) will only be reviewed confidentially in support of your other responses. You will not be contacted about them. Anything you write may help support the impact analysis, or clarify responses provided in the survey. You can tell us about elements we might have missed through the survey questions or that you feel need addi-tional clarification. This is completely optional, you can write as much as you would like or nothing at all. If you do choose to provide comments, please try to be kind, constructive, and/or helpful; what you write will be read by a real person. In either case, thank you again for taking this survey.
________________________________________________________________
________________________________________________________________
________________________________________________________________
________________________________________________________________