SCALING-UP RENEWABLE ENERGY PROGRAM filerenewable energy resources in country. Kenya has developed...
28
SCALING-UP RENEWABLE ENERGY PROGRAM (SREP) COUNTRY INVESTMENT PLAN KENYA SREP Sub- Committee Meeting, Cape Town June 21, 2011 1
Transcript of SCALING-UP RENEWABLE ENERGY PROGRAM filerenewable energy resources in country. Kenya has developed...

SCALING-UP RENEWABLE ENERGY PROGRAM (SREP)
COUNTRY INVESTMENT PLAN KENYA
SREP Sub- Committee Meeting, Cape Town
June 21, 2011
1

Kenya is one of the six Pilot Countries selected to benefit from the Scaling-Up Renewable Energy Program (SREP).
The SREP program will support Kenya’s initiatives towards achieving atransformational change that will lead the country towards low greenhousegas (GHG) emission development pathway by harnessing the abundantrenewable energy resources in country.
Kenya has developed an Investment Plan (IP) which is in line with nationalrenewable energy development strategy
Introduction
2
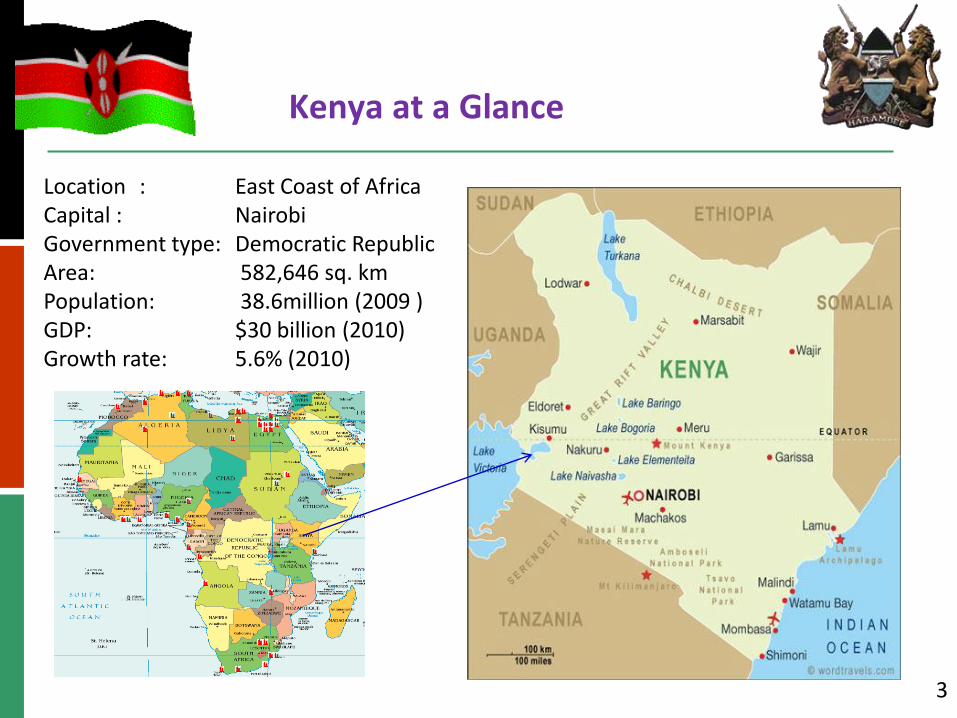
Kenya at a Glance
Location : East Coast of AfricaCapital : NairobiGovernment type: Democratic RepublicArea: 582,646 sq. kmPopulation: 38.6million (2009 )GDP: $30 billion (2010)Growth rate: 5.6% (2010)
3
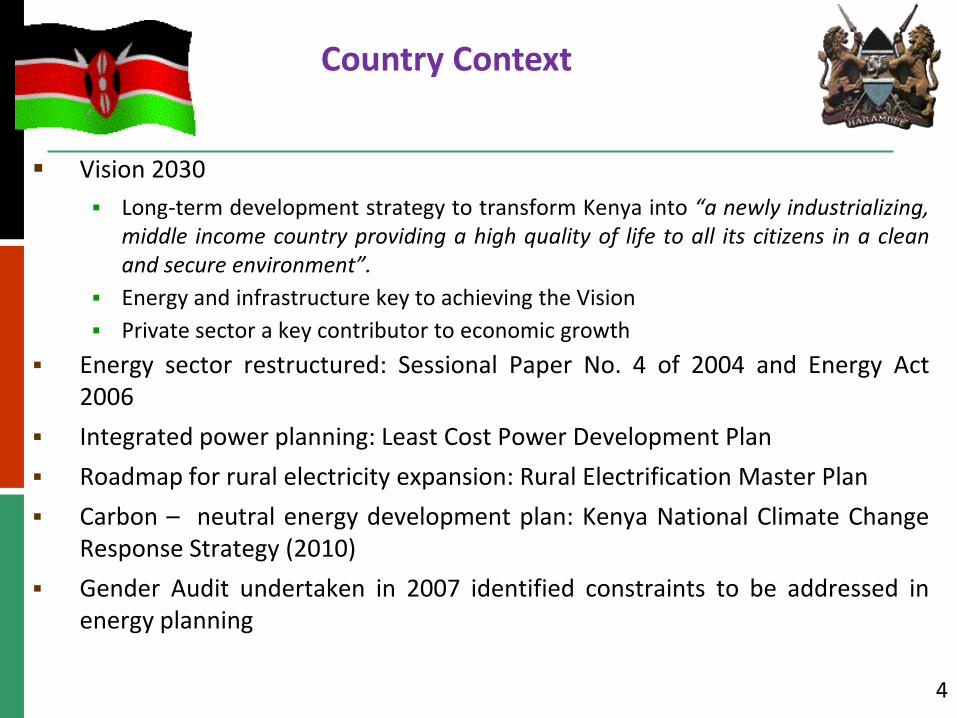
Vision 2030
Long-term development strategy to transform Kenya into “a newly industrializing,middle income country providing a high quality of life to all its citizens in a cleanand secure environment”.
Energy and infrastructure key to achieving the Vision
Private sector a key contributor to economic growth
Energy sector restructured: Sessional Paper No. 4 of 2004 and Energy Act2006
Integrated power planning: Least Cost Power Development Plan
Roadmap for rural electricity expansion: Rural Electrification Master Plan
Carbon – neutral energy development plan: Kenya National Climate ChangeResponse Strategy (2010)
Gender Audit undertaken in 2007 identified constraints to be addressed inenergy planning
Country Context
4

Power sector unbundled -generation, transmission and distribution
Market liberalized – 6 IPPs + 1 Public generator.
Electricity peak demand - 1,191 MW
Effective installed capacity - 1,429 MW(under normal hydrology)
1 national grid and 14 isolated mini-grids
Connectivity – 23%
Power Sector Overview
Ministry of
Energy
ERC
Energy Tribunal
KenGen Importss
IPPs REA
GDC –steam resource
development
KETRACO – Transmission /Wholesale Market operator
KPLC – Distribution/Supply
Customers
5

Base load generation is hydro and geothermal
Climate change effects have led to unreliability of hydro generation
Expensive thermal power plants used for base load leading to high tariffs
Average tariff ~15 US cents/kWh
Cross –subsidy
Government subsidizes emergency power to keep tariffs reasonable
Per capita consumption ~ 134 kWh
Power Mix and Costs
Large Hydro , 749.2, 49%
Small Hydro, 15.3, 1%
Geothermal, 198, 13%
Co-generation (biomass), 26,
2%
Wind, 5.1, 0%
Thermal (Fossil), 525,
34%
Isolated mini-grids (Fossil)
181%
6Power mix for main grid and isolated
mini-grids
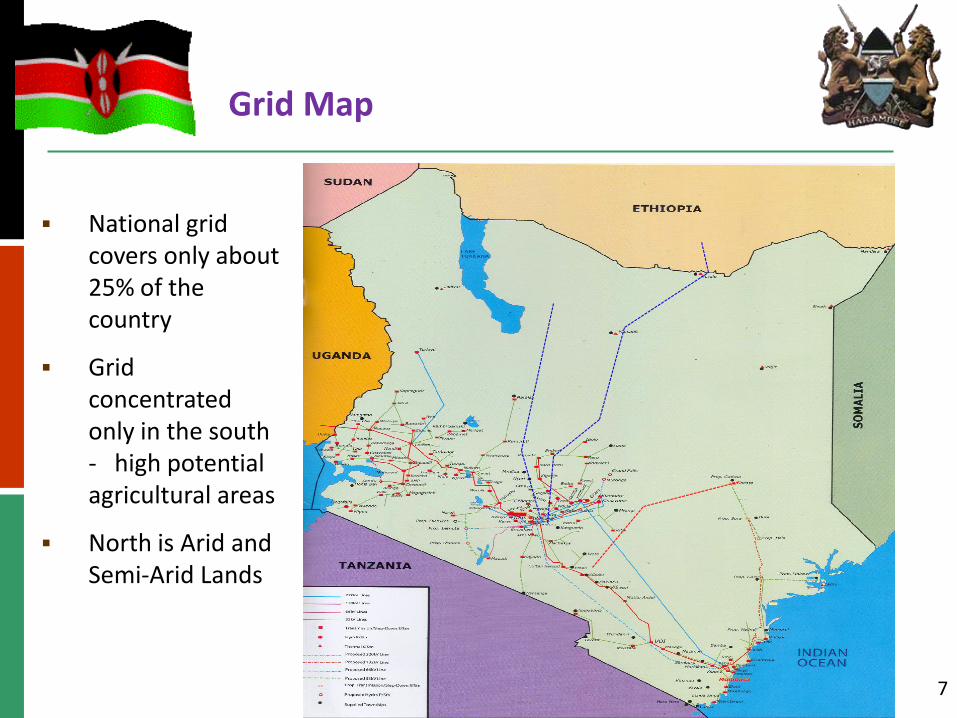
Grid Map
7
National grid covers only about 25% of the country
Grid concentrated only in the south - high potential agricultural areas
North is Arid and Semi-Arid Lands
Policy objective is to ensure adequate, quality, cost effective and affordable supply of energy through indigenous resources while protecting the environment
Interventions to accelerate RE development include:
Rapid expansion of electricity generation capacity;
Developing renewable energy programmes targeting the low income population;
Increasing the market penetration of renewable energy systems;
Enhancing energy security through diversification of energy sources; and
Promotion of energy efficiency and conservation.
Guiding principle for electricity infrastructure expansion is to promote equitable access to quality energy services at least cost while protecting the environment.
Energy Sector Strategy
8
Government is committed to promoting development of renewable energy resources:
Feed -In -Tariff Policy
Wind Atlas developed in 2003; installation of Data Loggers and Wind Masts
Program for Solar PV installations in public institutions in Arid and Semi-Arid Land areas
Regulations for Solar Water Heating developed
Developed Solar Photo Voltaic Systems Regulations
Carrying out feasibility studies for small hydro power sites
Promotion of improved cook stoves
Establishment of Geothermal Development Company
Green Energy Facility to be set up to finance development of clean energy projects
Renewable Energy Sector Context
9

Allows sale of RE generated electricity to a distributor at a pre-determined fixed tariff fora given period of time (20 yrs).
Feed-in-Tariff Policy
10
Technology Type Plant Capacity (MW) Max. Tariff (US$/kWh)
Firm Power Non-Firm Power
Geothermal Up to 75 0.85 -
Wind 0.5-100 - 0.12
Biomass 0.5-100 0.08 0.06
Small Hydro 0.5-0.99 0.12 0.10
1-5 0.10 0.08
5.1-10 0.08 0.06
Biogas 0.5-100 0.08 0.06
Solar 0.5-10 0.2 0.1
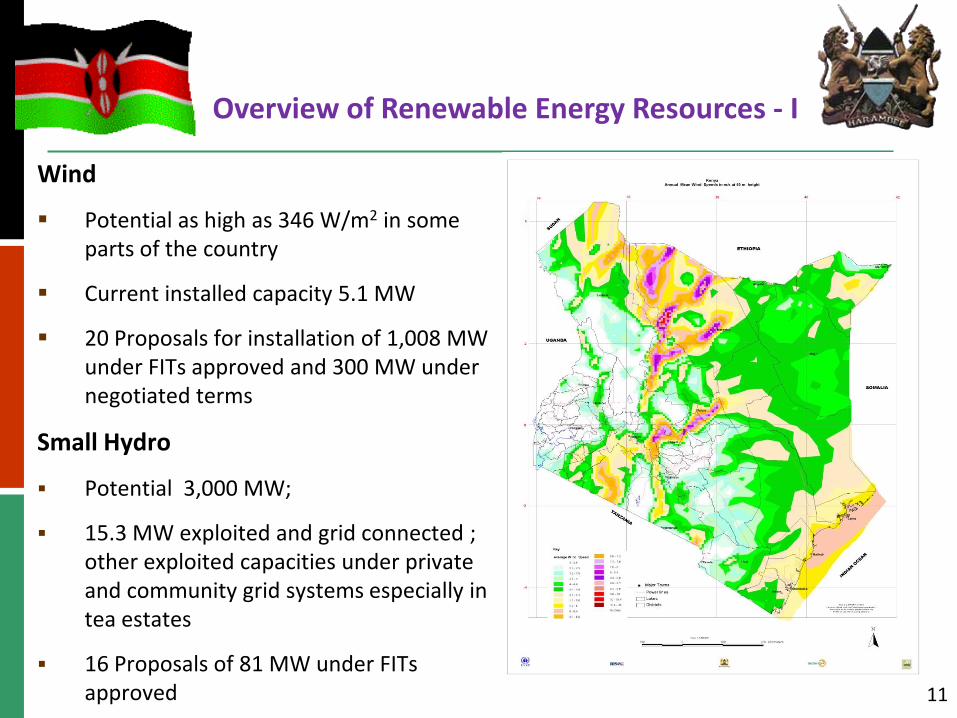
Wind
Potential as high as 346 W/m2 in some parts of the country
Current installed capacity 5.1 MW
20 Proposals for installation of 1,008 MW under FITs approved and 300 MW under negotiated terms
Small Hydro
Potential 3,000 MW;
15.3 MW exploited and grid connected ; other exploited capacities under private and community grid systems especially in tea estates
16 Proposals of 81 MW under FITs approved
Overview of Renewable Energy Resources - I
11

Solar
Daily insolation 4-6 kWh/m2
Government targeting use of Solar PV Technology to supply isolated mini-grids
Approximately 8 MW of Domestic Solar PV installion
Estimated Solar Water Heating Units currently in use –140,000
Biomass
Provides for more than 85% of rural household energy needs
Forest cover less than world recommended 10% largely due to land use activities and overdependence on woodfuel
Approximately 20,000 institutions consuming ~270 tons each of woodfuel per year
Total potential for cogeneration using sugarcane bagasse – 193MW, however only 35MW are exploited
Overview of Renewable Energy Resources – II
12

Geothermal
Advantages: Green; Unaffected by climate variability ; High plant availability ; Indigenous
Potential estimated at 7,000 –10,000 MW
Prospecting began in 1950s
First plant (45 MW) commissioned in 1985
Currently 202 MW: KenGen –150 MW; IPPs - 52 MW;
Overview of Renewable Energy Resources – III
13
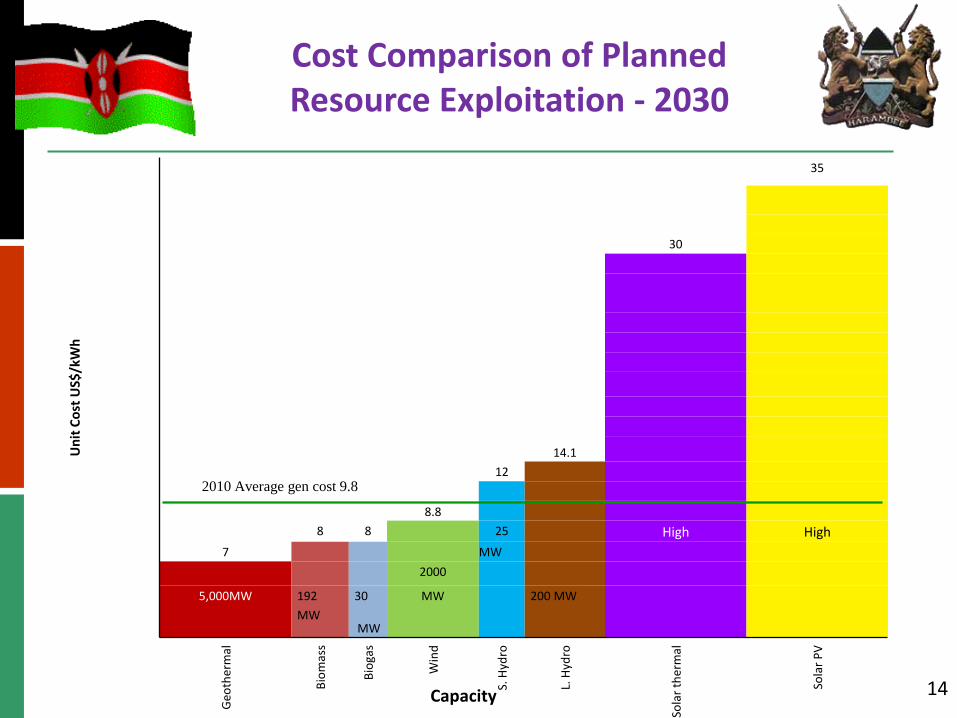
Cost Comparison of Planned Resource Exploitation - 2030
Un
it C
ost
US$
/kW
h
35
30
14.1
12
8.8
8 8 25 High High
7 MW
2000
5,000MW 192
MW
30
MW
MW 200 MW
Geo
ther
mal
Bio
mas
s
Bio
gas
Win
d
S. H
ydro
L. H
ydro
Sola
r th
erm
al
Sola
r P
V
14Capacity
2010 Average gen cost 9.8

Inadequate supply due to slow rate of capacity addition and high demand growth
Over-reliance on hydropower
High cost of power
Weak transmission and distribution network
Long lead times in the development of power infrastructure
Low private sector investments in power sector
Heavy dependence on fossil fuels for electricity supply in remote rural areas.
High cost of rural electrification
Low countrywide electricity access and connectivity
Power Sector Challenges
15

GoK planning a major expansion of energy access to support planned higher levels of economic growth while committed to reducing the impact of the energy sector on climate change.
Business as usual scenario of current hydro/thermal will result on an insecure and expensive system likely to increase production of GHG and yet there is abundant renewable energy resources to be developed
A programmatic approach to long-term transformation of Kenya’s power system is required toward expanded use of renewable energy, resulting in reduced GHG.
IP focuses on investments and capacity-building likely to catalyze additional financing and attract private sector investment
GoK requires external support to accelerate the development of both energy access and environmental objectives
SREP necessary to support GoK programmes by designing innovative business models to finance high-risk high-reward projects
Rationale for SREP
16

IP Development Process
Presentation to SREP Sub-Committee – June 21, 2011
Peer Review and Joint MDB Comments June 12, 2011
Circulation and disclosure on Government Website – May 23, 2011
Update of Investment Plan - May 17 – 20, 2011
Joint MDB Mission – May 3 -12, 2011National Stakeholders Workshop – May 6, 2011 Technical Workshop May 8, 2011
Receipt of Comments – April 12 - 27, 2011
Draft Investment Plan Preparation March 1 – April 11, 2011; Circulation – April 12, 2011
Scoping Mission - February 7 – 11, 2011Launch of IP Preparation ; Constitution of Task Force; Stakeholder Consultation
17
Project Identification
Energy sector stakeholder s’ consultations
Proposed and ongoing Government programs – LCPDP, Rural Electrification Master Plan
Identified Projects
Hybrid Mini-Grid Systems
Solar Water Heating
Small Hydro Power Development
Scaling Up Improved Biomass Cookstoves in Institutions
Development of 200 MW of Geothermal
Program Description
18
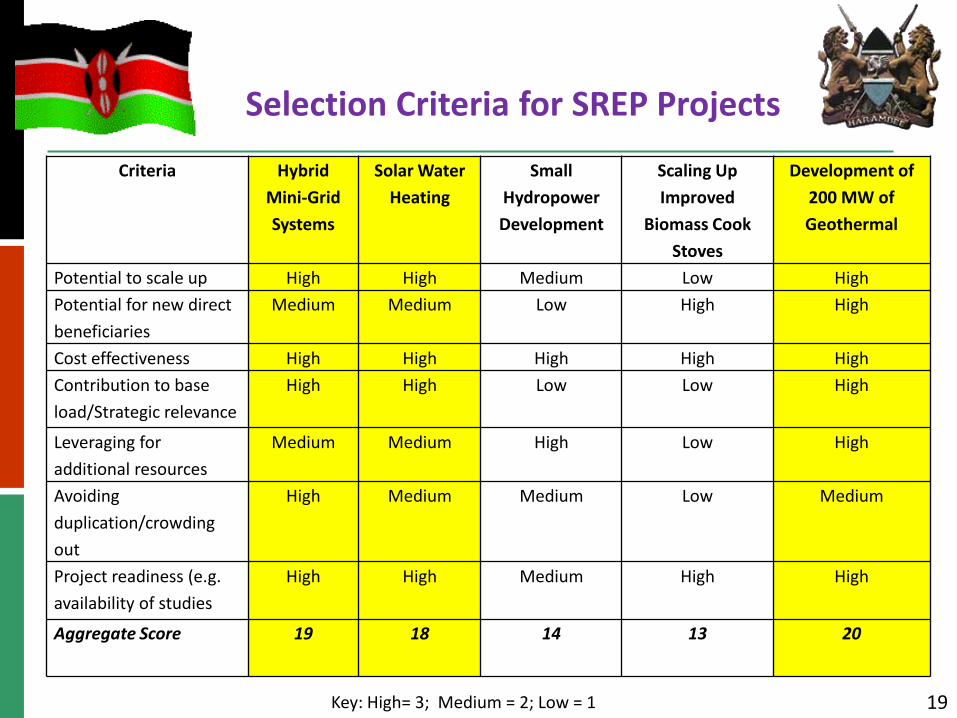
Selection Criteria for SREP Projects
Criteria Hybrid
Mini-Grid
Systems
Solar Water
Heating
Small
Hydropower
Development
Scaling Up
Improved
Biomass Cook
Stoves
Development of
200 MW of
Geothermal
Potential to scale up High High Medium Low High
Potential for new direct
beneficiaries
Medium Medium Low High High
Cost effectiveness High High High High High
Contribution to base
load/Strategic relevance
High High Low Low High
Leveraging for
additional resources
Medium Medium High Low High
Avoiding
duplication/crowding
out
High Medium Medium Low Medium
Project readiness (e.g.
availability of studies
High High Medium High High
Aggregate Score 19 18 14 13 20
19Key: High= 3; Medium = 2; Low = 1
Objective: accelerate the shift to geothermal-based power as the main source of grid-based electricity.
Expected Result: reduced development time for 200 MW of geothermal power capacity in 5 years compared to between 11 and 30 years in the past.
Means of Achievement: channeling funds that are not merely additive to geothermal financing but play a major catalytic role in scaling up the resource base to finance more than ten-fold increase in capacity between 2015 and 2030 through demonstration of a replicable, business model for public-private partnerships.
Focus of SREP Funds:
Phase A:
Post-exploration activities to minimize risk perception of the private sector: well drilling, steam-field development etc in greenfield Menengai geothermal field.
Capacity-building for GDC in resource confirmation, marketing geothermal steam, and contracting with private sector players.
Phase B:
Mobilization of financing for power plant -- 200 MW of capacity in Menengai.
Construction of transmission infrastructure, including transmission line and substations, “way leave” acquisition and a resettlement plan.
Projects - Geothermal
20
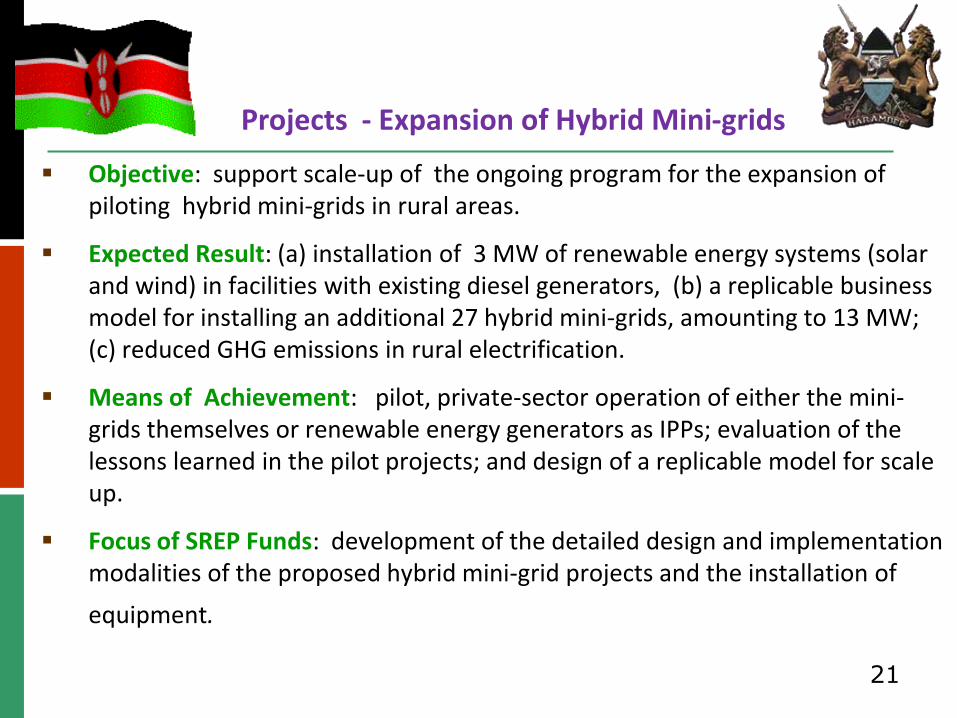
Objective: support scale-up of the ongoing program for the expansion of piloting hybrid mini-grids in rural areas.
Expected Result: (a) installation of 3 MW of renewable energy systems (solar and wind) in facilities with existing diesel generators, (b) a replicable business model for installing an additional 27 hybrid mini-grids, amounting to 13 MW; (c) reduced GHG emissions in rural electrification.
Means of Achievement: pilot, private-sector operation of either the mini-grids themselves or renewable energy generators as IPPs; evaluation of the lessons learned in the pilot projects; and design of a replicable model for scale up.
Focus of SREP Funds: development of the detailed design and implementation modalities of the proposed hybrid mini-grid projects and the installation of
equipment.
Projects - Expansion of Hybrid Mini-grids
21
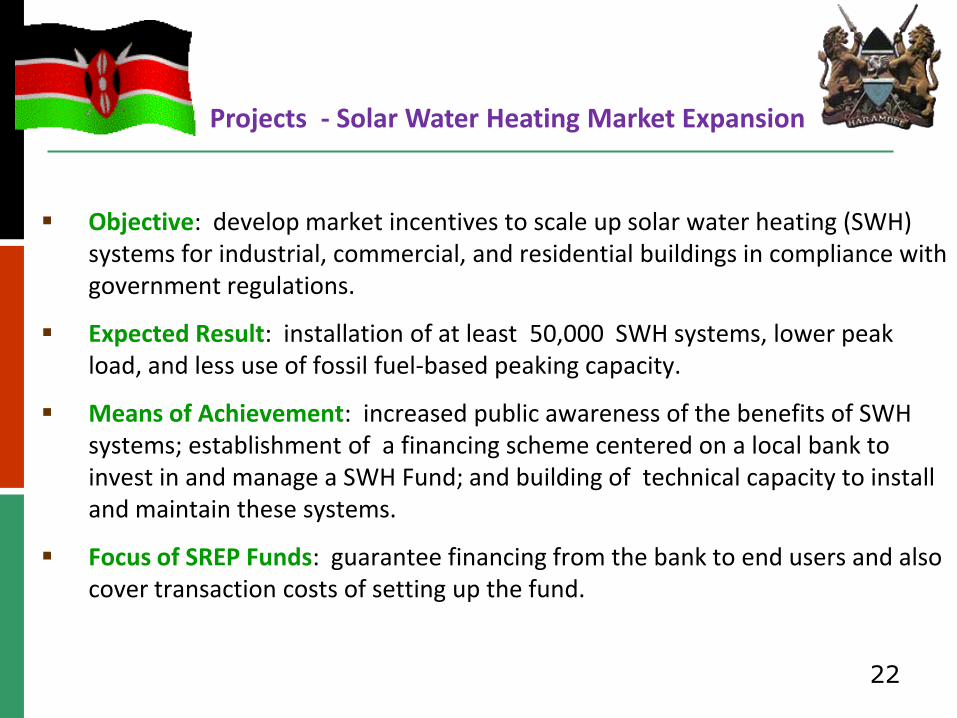
Objective: develop market incentives to scale up solar water heating (SWH) systems for industrial, commercial, and residential buildings in compliance with government regulations.
Expected Result: installation of at least 50,000 SWH systems, lower peak load, and less use of fossil fuel-based peaking capacity.
Means of Achievement: increased public awareness of the benefits of SWH systems; establishment of a financing scheme centered on a local bank to invest in and manage a SWH Fund; and building of technical capacity to install and maintain these systems.
Focus of SREP Funds: guarantee financing from the bank to end users and also cover transaction costs of setting up the fund.
Projects - Solar Water Heating Market Expansion
22

Financing
Activity GoK SREP AfDB/
WBG
Development
Partners /
Commercial
Loans
Private
Investors
Financing
Gap
Total
(MUS$)
SREP INITIAL
ALLOCATION
200 MW of
Geothermal - Phase A
Resource
Development126.0 40.0 234.0 400.0
Hybrid Mini -Grid
Systems1.0 10.0 10.0 42.0 5.0 68.0
SREP RESERVES 200 MW of
Geothermal - Phase B
Power Plant
Construction14.6 75.0 200.0 100.0 385.6
Transmission &
Substations10.4 10.4
Solar Water Heating
Component1.0 10.0 2.0 47.0 60.0
Total 128.0 85.0 321 242.0 105.0 47.0 928.0
23

Geothermal
Initiation of a business model for making private sector investment the driver of geothermal power development, creating a competitive market for renewable energy.
Low-carbon expansion of grid-based power , through the business model, resulting in more secure, less costly and more environmentally friendly source of power for electricity access expansion.
Increased access to the power grid through renewable energy by increasing the installed capacity of geothermal, lowering generation costs and making electricity more affordable.
Improved infrastructure for attracting investors due to reduced outages from unavailable hydropower.
Transformation of the local economy in the Menengai area through infrastructure development (power, roads and water) and opportunities for industrial and agricultural application of geothermal steam.
SREP Transformative Impacts
24

Hybrid Mini-Grids
Partial / full displacement of diesel-fired generators with solar or wind energy reducing, dependence on expensive and CO2-intensive fossil fuels.
Low-carbon impact of increased remote electricity access through greater renewable energy content of power facilities in remote rural areas.
Poverty reduction through enhanced business opportunities and improvements in the quality of education and health care, made possible by electricity.
Solar Water Heating
More business opportunities in the private sector resulting from capacity building to expansion of the solar energy industry in the fields of installation and maintenance as well as marketing/sales.
Reduced peak demand and the consequent need for expensive fossil-fuel fired peaking power plants.
Lower GHG emissions resulting from reduced peak demand.
SREP Transformative Impacts
25
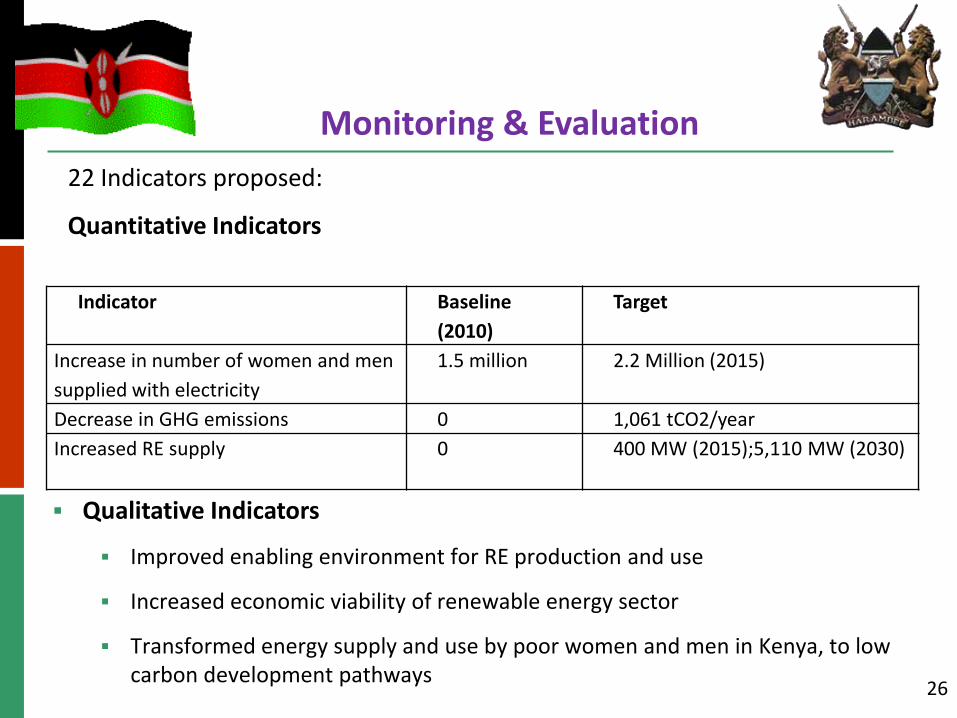
Qualitative Indicators
Improved enabling environment for RE production and use
Increased economic viability of renewable energy sector
Transformed energy supply and use by poor women and men in Kenya, to low carbon development pathways
Monitoring & Evaluation
26
Indicator Baseline
(2010)
Target
Increase in number of women and men
supplied with electricity
1.5 million 2.2 Million (2015)
Decrease in GHG emissions 0 1,061 tCO2/year
Increased RE supply 0 400 MW (2015);5,110 MW (2030)
22 Indicators proposed:
Quantitative Indicators

July: Incorporation of SREP Sub-Committee’s feedbacks on the draft IP, and submission of final IP to SREP Sub-Committee for endorsement;
August: Preparation of detailed investment proposals, financing plans, and required environmental and social impact analyses; and
August/September: Project Preparation Joint Mission by MDBs.
Next Steps
27

THANK YOU
28