Scaling Propensity of Water - IWA Publishing · Started in 1948, Kiwa Water Research has developed...
30
Scaling Propensity of Water New Predictive Parameters
Transcript of Scaling Propensity of Water - IWA Publishing · Started in 1948, Kiwa Water Research has developed...

Scaling Propensity of Water
New Predictive Parameters

KIWA: PROFILE AND MISSION
Started in 1948, Kiwa Water Research has developed into an internationally respected research center in the field of drinking water and related environmental issues. The 120 scientific specialists conduct the joint research program of the water supply companies in the Netherlands, and also provide research services for other national and international clients.
While the major focus is on drinking water supply, Kiwa is also involved in projects addressing the integration of the water chain, including water for industrial and other use. Core tasks of the division include innovative research and transfer of knowledge and know-how.
Other divisions of Kiwa provide a range of certification, inspection and management consultancy services for water businesses and other sectors of industry.
More information can be found on www.kiwa.nl
KIWA REPORT
Scaling Propensity of Water
New Predictive Parameters
M.J.C. van Raalte-Drewes, H. Brink, L.A.C. Feij, P.G.G. Slaats, E.A.M. van Soest, P.P.R. Vaal, G. Veenendaal
Published by IWA Publishing, Alliance House, 12 Caxton Street, London SW1H 0QS, UK Telephone: +44 (0) 20 7654 5500; Fax: +44 (0) 20 7654 5555; Email: [email protected] Web: www.iwapublishing.com First published 2004 © 2004 KIWA Printed by Ashford Overload, Southampton, UK Apart from any fair dealing for the purposes of research or private study, or criticism or review, as permitted under the UK Copyright, Designs and Patents Act (1998), no part of this publication may be reproduced, stored or transmitted in any form or by any means, without the prior permission in writing of the publisher, or, in the case of photographic reproduction, in accordance with the terms of licences issued by the Copyright Licensing Agency in the UK, or in accordance with the terms of licenses issued by the appropriate reproduction rights organization outside the UK. Enquiries concerning reproduction outside the terms stated here should be sent to IWA Publishing at the address printed above. The publisher makes no representation, express or implied, with regard to the accuracy of the information contained in this book and cannot accept any legal responsibility or liability for errors or omissions that may be made.
Disclaimer
The information provided and the opinions given in this publication are not necessarily those of IWA, KIWA or the editors, and should not be acted upon without independent consideration and professional advice. IWA and the editor will not accept responsibility for any loss or damage suffered by any person acting or refraining from acting upon any material contained in this publication.
British Library Cataloging in Publication Data A CIP catalogue record for this book is available from the British Library
Library of Congress Cataloging- in-Publication Data A catalog record for this book is available from the Library of Congress
ISBN: 1 84339 047 7
[ v ]
CONTENTS
Summary 1 1 New parameters to determine the scaling potential of water 3 2 Recommendations to prevent scaling 5
2.1 Approach to establish recommendations 5 2.2 Relation between results of determination methods and practical experience 6 2.3 Recommendations 8
3 Examples of applications 9 3.1 Determination of the benefits and necessity of water treatment/conditioning 9 3.2 Answering complaints of users about calcium carbonate precipitation 11 3.3 Optimisation of conditioning processes 12
4 How to use the new scaling prediction methods 15 4.1 Implementation to prevent client complaints 15 4.2 Implementation to determine the benefits and necessity of conditioning 17 4.3 Implementation to optimise the conditioning and filtration process 18
5 Conclusions 19 Literature 21

[ 1 ]
SUMMARY
New parameters were developed that enable to predict and analyse in a quick and simple way the occurrence of calcium carbonate precipitation (scaling) during heating of drinking water. The commonly used parameter to predict the occurrence of calcium carbonate precipitation, e.g. the Saturation Index determined at 10oC (SI10), turned out not to cover the problems appearing in practice.
To perform a good analysis of the factors influencing calcium carbonate precipitation in water heating equipment, four parameters need to be determined:
• the CCPP90 (Calcium Carbonate Precipitation Potential at 90oC); • the SI90 (Saturation Index at 90oC); • the NI (Nucleation Index); • the MCCP (Measured Calcium Carbonate Precipitation).
The CCPP90 and SI90 describe together the hydrodynamic driven force for the calcium carbonate precipitation reaction. The nucleation index indicates in which rate the calcium carbonate precipitation is accelerated by nuclei present in the water. Finally, the MCCP refers to a measurement under practical conditions, whereby the calcium carbonate accumulation is measured.
In this report the link between values of the parameters and practical problems to appear is determined. In addition some practical examples on the use of the parameters are described.
The research indicates that no excessive calcium carbonate precipitation in water heating equipment occurs when the water type complies with the following recommendations:
CCPP90 < 0.6 mmol/L SI90 < 1.0 NI < 0.85 MCCP < 0.2 mmol/L

2 Summary
]
Serious problems regarding calcium carbonate precipitation will be found in water types
where the following values are exceeded: CCPP90 > 1.2 mmol/L MCCP > 0.6 mmol/L A decisive answer regarding the magnitude of calcium carbonate precipitation during
water heating can be obtained by performing an MCCP-measurement. There is a clear relation found between the results of the scaling measurement (MCCP) and the occurrence of calcium carbonate precipitation in practice. When MCCP is smaller than 0.2 mmol/L, no calcium carbonate precipitation is usually found. Moderate problems with calcium carbonate precipitation were experienced when MCCP values were between 0.2 and 0.6 mmol/L while values exceeding 0.6 mmol/L led almost always to serious problems.
When no measurements of MCCP are available, the CCPP90 can be used to predict the seriousness of calcium carbonate precipitation. When CCPP90 is smaller than 0.6 mmol/L no problems with precipitation appear. Between 0.6 and 1.2 moderate problems can be faced, while by values higher than 1.2, excessive calcium carbonate precipitation usually occurs.
The saturation index at 90oC (SI90) and the nucleation index (NI) seem to be too less distinctive for Dutch water types. It turned out however, that calcium carbonate precipitation is enhanced by higher values of nucleation index (higher than ca. 0.85), what can occur after softening of water in pellet reactors.
It turned out after application of the new determination methods that the new parameters are suitable to predict calcium carbonate precipitation in household water heating equipment and to analyse it further. The scaling measurement (determination of MCCP) seems to be the most appropriate to estimate the seriousness of the problems associated with calcium carbonate precipitation. Prediction of the magnitude of calcium carbonate precipitation can be done using the CCPP90 parameter. To optimise the conditioning and filtration processes, the nucleation index should be considered.
[ 3 ]
1 New parameters to determine the scaling potential of water
In the period between 1989 and 1996 new determination methods were developed enabling to predict and analyse relatively quickly and simple the occurrence of calcium carbonate precipitation during heating of drinking water. The reason for the development of these measurement methods was that there were inexplicable problems with calcium carbonate precipitation. These appeared in the end of the 80’s after introduction of softening and deacidification. In addition it turned out that the commonly used parameter to predict calcium carbonate precipitation, the saturation index SI calculated by 10oC, was not sufficient (Van Eekhout et al., 1991). Within the Netherlands’ Water Works Joint Research Program, a project was started focussed on the development of better prediction methods.
In the research it turned out that four parameters need to be considered to perform a good analysis of calcium carbonate precipitation (Van Eekhout et al., 1991):
• the CCPP90 (Calcium Carbonate Precipitation Potential at 90oC); • the SI90 (Saturation Index at 90oC); • the NI (Nucleation Index); • the MCCP (Measured Calcium Carbonate Precipitation).
The CCPP90 and SI90 together describe the hydrodynamic driven force for the calcium carbonate precipitation reaction. The nucleation index indicates in which rate the calcium carbonate precipitation is accelerated by nuclei present in the water. Finally, the MCCP refers to a measurement under practical conditions, whereby depth of calcium carbonate accumulation is measured.
For each of these four parameters calculation procedures, computer programs as well as measurement set-ups are proposed. It regards:

4 New Parameters to determine the scaling potential of water
]
• the computer program CCPP90 to calculate the CCPP90 and the SI90; • the set-up to for the determination of the Nucleation Index; • the measurement of MCCP.
More information on these parameters can be found in various manuals (Kiwa reports
SWS 95.505, SWE 95.014 and SWE 97.012). At the end of the research it is stated by which results of the measurement methods
excessive calcium carbonate scaling may occur. In this report the results are reported. In chapter 2 the relation between the results of the new determination methods and
practical experiences are given. Based on this, recommended values are defined for the results of these methods. Chapter 3 shows some examples of the use of the measurement methods. These applications give the base for earlier defined recommended limit values. A systematic approach for the efficient implementation of new determination methods is included in chapter 4. Finally the conclusions of this research are given in chapter 5.

[ 5 ]
2 Recommendations to prevent scaling
2.1 Approach to establish new recommendations To define limits for the results of the new determination methods a relation with practical experiences is established. This should enable prevention against problems with calcium carbonate precipitation during heating of water.
As first it was attempted to collect quantitative data regarding maintenance of water heating equipment. The link between these maintenance data and the measured parameters could result in a statistical relation. However, it turned out during the performance of the experiment that insufficient quantitative data about maintenance of water heating equipment were available for a statistical analysis.
Therefore it was decided not to formulate statistical relations, but to define empirical limiting values. For some supplementary drinking water supply areas it was decided whether the problems with calcium carbonate precipitation in water heating equipment were known. The following data were used in the latter case: qualitative information about maintenance of water heating equipment (when available), qualitative information about maintenance of water heating equipment made available by lessors and information from complains registration system of the involved Drinking Water Companies.
Finally the calcium carbonate precipitation capacity was determined using the four new parameters for 27 water types. These water types were first divided into three groups: water types causing evidently calcium carbonate precipitation in water heating equipment, water types which are known by Drinking Water Company to lead from time to time to complains related to calcium carbonate precipitation and finally water types causing no problems with calcium carbonate precipitation. By comparison of the results of new determination methods for these three water types, the limiting values were determined.

6 Recommendations to prevent scaling
]
It was important for this research to investigate very different water types. It regards for instance drinking water produced from ground water, bank filtrate water and surface water. In addition a large geographical spreading was considered leading to a representative picture for the Dutch situation.
2.2 Relation between results of determination methods and practical experience
For drinking water originating from different locations in The Netherlands where no softening process is applied, the results of the measurements are given in Table 2.1. The locations are divided into three groups:
• locations where calcium carbonate precipitation in water heating equipment is
evident; • locations where it is known by Drinking Water Companies that calcium carbonate
precipitation in water heating equipment occurs from time to time; • locations where no complains are registered about calcium carbonate precipitation.
Table 2.1 Results of new determination methods: calcium carbonate precipitation parameters of drinking water samples taken at the pump stations at various locations in The Netherlands.
Pump station CCPP90 mmol/L
SI90 (-)
NI (-)
MCCP (mmol/L)
Boilers % of cleaned units
Problems with calcium carbonate precipitation 1 0.93 1.09 0.61 0.59 2 1.63 1.24 0.62 1.01 10.9 3 1.86 1.17 0.72 0.70 12.5 4 1.18 1.21 0.76 0.63 6.4
Moderate problems with calcium carbonate precipitation 5 0.61 1.00 0.65 0.23 6 0.83 0.96 0.60 0.16 7 0.98 1.17 0.57 0.22 3.5 8 1.00 1.03 0.67 0.45 9 1.08 1.12 0.62 0.50 5.5 10 1.09 1.24 0.53 0.37 11 1.11 1.14 0.55 0.51 12 1.11 1.08 0.87 0.28 13 0.80 1.04 0.63 0.33
No problems with calcium carbonate precipitation 14 0.34 0.85 0.68 0.04 <5 15 0.37 1.09 0.45 0.01 16 0.38 0.67 0.54 0.01 0.9 17 0.63 0.25 0.52 0.01 1.6 18 0.63 0.98 <0.47 0.08 <2 19 0.69 0.98 0.50 0.01 <2 20 0.13 0.52 0.73 0.00 21 0.17 0.58 0.69 0.07
The comparison of the calcium carbonate precipitation parameters from the three groups
leads to the following ranges (Table 2.2).
Recommendations to prevent scaling 7
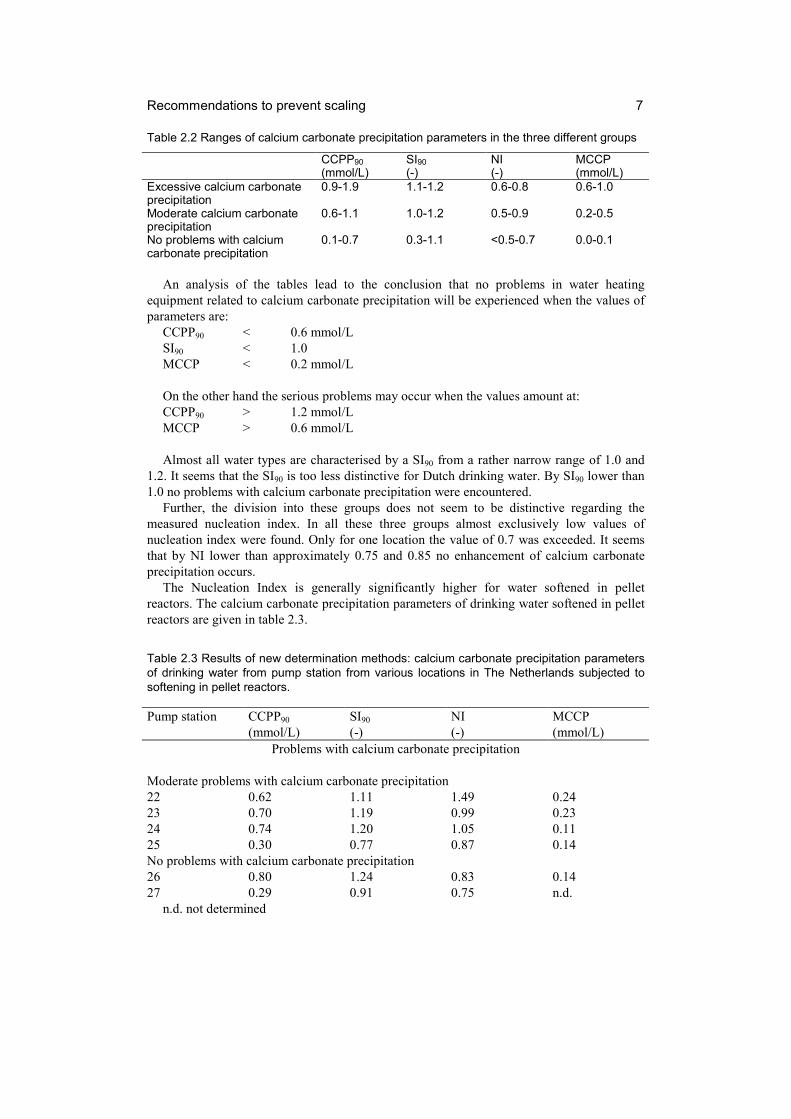
Table 2.2 Ranges of calcium carbonate precipitation parameters in the three different groups
CCPP90 (mmol/L)
SI90 (-)
NI (-)
MCCP (mmol/L)
Excessive calcium carbonate precipitation
0.9-1.9 1.1-1.2 0.6-0.8 0.6-1.0
Moderate calcium carbonate precipitation
0.6-1.1 1.0-1.2 0.5-0.9 0.2-0.5
No problems with calcium carbonate precipitation
0.1-0.7 0.3-1.1 <0.5-0.7 0.0-0.1
An analysis of the tables lead to the conclusion that no problems in water heating
equipment related to calcium carbonate precipitation will be experienced when the values of parameters are:
CCPP90 < 0.6 mmol/L SI90 < 1.0 MCCP < 0.2 mmol/L On the other hand the serious problems may occur when the values amount at: CCPP90 > 1.2 mmol/L MCCP > 0.6 mmol/L Almost all water types are characterised by a SI90 from a rather narrow range of 1.0 and
1.2. It seems that the SI90 is too less distinctive for Dutch drinking water. By SI90 lower than 1.0 no problems with calcium carbonate precipitation were encountered.
Further, the division into these groups does not seem to be distinctive regarding the measured nucleation index. In all these three groups almost exclusively low values of nucleation index were found. Only for one location the value of 0.7 was exceeded. It seems that by NI lower than approximately 0.75 and 0.85 no enhancement of calcium carbonate precipitation occurs.
The Nucleation Index is generally significantly higher for water softened in pellet reactors. The calcium carbonate precipitation parameters of drinking water softened in pellet reactors are given in table 2.3.
Table 2.3 Results of new determination methods: calcium carbonate precipitation parameters of drinking water from pump station from various locations in The Netherlands subjected to softening in pellet reactors.
Pump station CCPP90 (mmol/L)
SI90 (-)
NI (-)
MCCP (mmol/L)
Problems with calcium carbonate precipitation Moderate problems with calcium carbonate precipitation 22 0.62 1.11 1.49 0.24 23 0.70 1.19 0.99 0.23 24 0.74 1.20 1.05 0.11 25 0.30 0.77 0.87 0.14 No problems with calcium carbonate precipitation 26 0.80 1.24 0.83 0.14 27 0.29 0.91 0.75 n.d.
n.d. not determined

8 Recommendations to prevent scaling
]
Table 2.3 shows that the higher values of NI are found in water after softening in pellet
reactors. Further it turns out that in some cases complains about calcium carbonate precipitation are periodically registered. It mainly appears by water types characterised by high nucleation index, or in another words in water types rich in nuclei accelerating the calcium carbonate precipitation. By the values of NI lower than 0.85 no complains were registered.
The enhancement of the calcium carbonate precipitation at higher values of nucleation index is also visible in two measurements shown in Table 2.4. It considers the same water supply area. The first sample was taken just after the pump station, the second in the supply area.
Table 2.4 Calcium carbonate precipitation parameters for drinking water in the supply area G.1.
CCPP90 (mmol/L)
SI90 (-)
NI (-)
MCCP (mmol/L)
Drinking water directly after pump station
0.62 1.11 1.49 0.24
Drinking water from supply area 0.59 1.11 0.73 0.15
The chemical composition of the water was almost identical, which can be seen in
comparable values of the CCPP90 and SI90. The nucleation index of water directly after the pump station is however higher than the nucleation capacity in the supply area. Also, in the MCCP measurement in the sample after the pump station, more precipitated calcium was found. It seems that calcium carbonate precipitation is accelerated at a nucleation index of approximately 1.5.
2.3 Recommendations Excessive calcium carbonate precipitation in water heating equipment does not occur in types of water complying with the following limit values for the new parameters of calcium carbonate precipitation capacity:
CCPP90 < 0.6 mmol/L SI90 < 1.0 NI < 0.85 MCCP < 0.2 mmol/L To be sure that the water does not cause any excessive calcium carbonate precipitation in
domestic water heating equipment, it is recommended to condition water in question in such a way that the parameter limits are fulfilled. Exceeding of one of these limit values will however not always lead to problems with calcium carbonate precipitation. It is further analysed in chapter 4.
[ 9 ]
3 Examples of applications
3.1 Determination of the benefits and necessity of water treatment/conditioning
A study was performed to determine the necessity and the benefits of water conditioning (softening, deacification) for all existing and future water intakes belonging to the Drinking Water Company Limburg, The Netherlands. For all water types the CCPP90 was determined based on water quality data delivered by Water Laboratories. In addition, the maintenance of water heating equipment within the considered water supply area was surveyed. The Electricity Enterprise delivered data regarding maintenance state of electric(al) boilers. The results are given in Figure 3.1
The comparison of both schemes in Figure 3.1 shows large similarities. For all water supply areas where the CCPP90 is lower than 0.6 mmol/L, the percentage of decalcified boilers is lower than 5%; for the pump stations with CCPP90 higher than 0.6 mmol/L the percentage of boilers yearly decalcified was higher than 5%.

10 Examples of applications
]
Figure 3.1. The percentage of the boilers needed to be yearly decalcified and the CCPP90 in the water supply areas in Limburg, The Netherlands.
In Figure 3.2 the results are presented in another way: the percentage of boilers decalcified per year per water supply area is presented against the CCPP90 of the drinking water distributed in the water supply area. Each point in this figure represents one drinking water supply area.
Figure 3.2 The percentage of boilers yearly decalcified versus the CCPP90 of the drinking water in the water supply area.
This figure shows that in the areas where the CCPP90 is lower than 0.6 mmol/L less than 5% of the electrical boilers was decalcified. By water types characterised by CCPP90 higher than 0.6 mmol/L a decrease in maintenance of water heating equipment can be expected when the CCPP90 will be decreased as a result of conditioning to a value lower than 0.6 mmol/L.
Examples of applications 11
3.2 Answering complaints of users about calcium carbonate precipitation
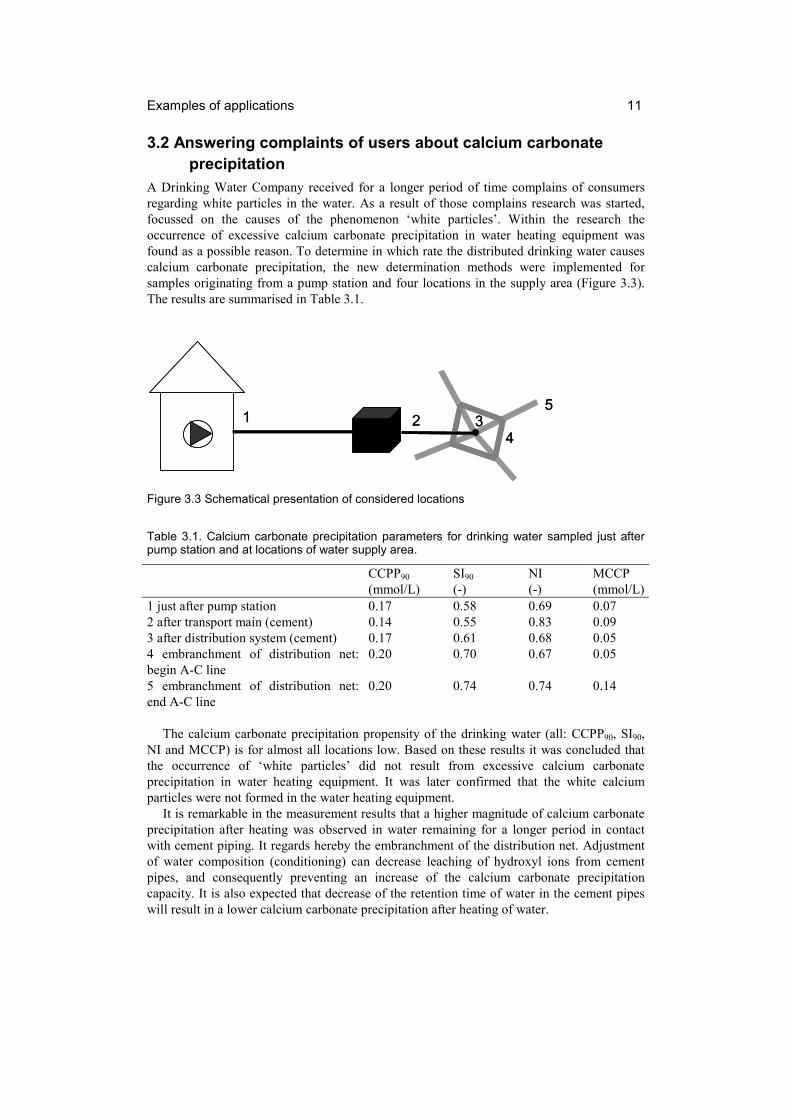
A Drinking Water Company received for a longer period of time complains of consumers regarding white particles in the water. As a result of those complains research was started, focussed on the causes of the phenomenon ‘white particles’. Within the research the occurrence of excessive calcium carbonate precipitation in water heating equipment was found as a possible reason. To determine in which rate the distributed drinking water causes calcium carbonate precipitation, the new determination methods were implemented for samples originating from a pump station and four locations in the supply area (Figure 3.3). The results are summarised in Table 3.1.
Figure 3.3 Schematical presentation of considered locations
Table 3.1. Calcium carbonate precipitation parameters for drinking water sampled just after pump station and at locations of water supply area.
CCPP90 (mmol/L)
SI90 (-)
NI (-)
MCCP (mmol/L)
1 just after pump station 0.17 0.58 0.69 0.07 2 after transport main (cement) 0.14 0.55 0.83 0.09 3 after distribution system (cement) 0.17 0.61 0.68 0.05 4 embranchment of distribution net: begin A-C line
0.20 0.70 0.67 0.05
5 embranchment of distribution net: end A-C line
0.20 0.74 0.74 0.14
The calcium carbonate precipitation propensity of the drinking water (all: CCPP90, SI90,
NI and MCCP) is for almost all locations low. Based on these results it was concluded that the occurrence of ‘white particles’ did not result from excessive calcium carbonate precipitation in water heating equipment. It was later confirmed that the white calcium particles were not formed in the water heating equipment.
It is remarkable in the measurement results that a higher magnitude of calcium carbonate precipitation after heating was observed in water remaining for a longer period in contact with cement piping. It regards hereby the embranchment of the distribution net. Adjustment of water composition (conditioning) can decrease leaching of hydroxyl ions from cement pipes, and consequently preventing an increase of the calcium carbonate precipitation capacity. It is also expected that decrease of the retention time of water in the cement pipes will result in a lower calcium carbonate precipitation after heating of water.
1 2 34
51 2 3
4
5

12 Examples of applications
]
It turned out in this research that implementation of the new determination methods, and especially the MCCP measurement, are very suitable to quantify the problem signalised by users complains.
3.3 Optimisation of conditioning processes Already at the beginning of the 1980s it was known that during softening of water using pellet-softening, micro-crystals of calcium carbonate can be formed (Van Ammers, 1982, Graveland, 1987). It was assumed then that micro-crystals were formed when caustic soda was used as softening agent, but now it is known that micro-crystals are formed also when using milk of lime. The reason for the formation of micro-crystals of calcium carbonate during the softening process is local (high) over-saturation with calcium carbonate (spontaneous formation of nuclei) and the erosion of splinters during collisions of softening granules (Van Eekhout et al., 1991, De Blois et al., 1991). Micro-crystals of calcium carbonate in the water accelerate the calcium carbonate precipitation.
Taking into account the spontaneous formation of micro-crystals caused by local high over-saturation of calcium carbonate, it is expected that micro-crystals can be also formed in other places causing or accelerating calcium carbonate precipitation. For instance dosage of caustic soda to correct pH of water can be one of the reasons. Micro-crystals can also be formed during distribution of water, for instance by leaching of calcium hydroxide from cement-containing materials. There are however no experiences that the formation of micro-crystals under mentioned circumstances led to problems with calcium carbonate precipitation in heating water units.
Measurement of the nucleation index allows the determination of how far calcium carbonate precipitation is enhanced by the presence of nuclei in water.
The amount of micro-crystals formed during softening of water depends on the design and the operation of the pellet reactors. In the research performed by KIWA in co-operation with diverse Drinking Water Company, it turned out that the following factors are important:
• construction of the bottom in the softening reactor (Van Eekeren et al., 1992); • water upflow velocity in the reactor; • depth of softening (Dirken et al., 1995).
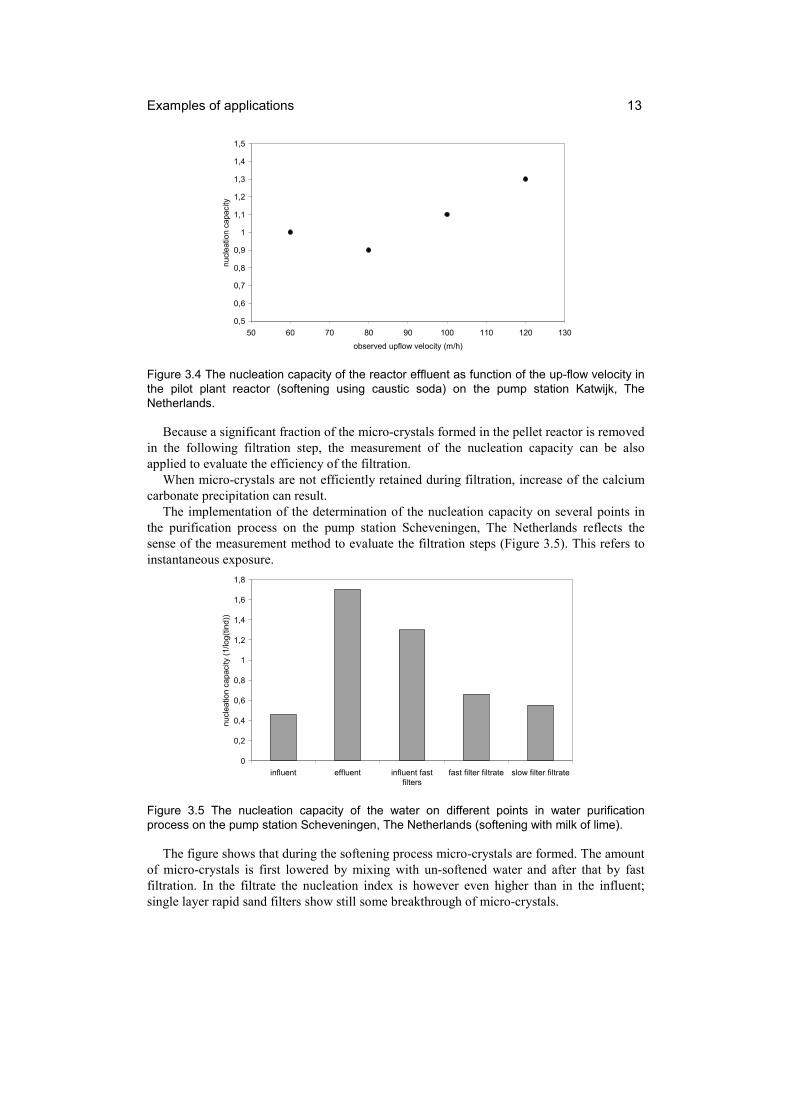
It was confirmed by research that an increase of the up-flow velocity in the pellet reactor
leads to an increase of the formation of micro-crystals.
Examples of applications 13
Figure 3.4 The nucleation capacity of the reactor effluent as function of the up-flow velocity in the pilot plant reactor (softening using caustic soda) on the pump station Katwijk, The Netherlands.
Because a significant fraction of the micro-crystals formed in the pellet reactor is removed in the following filtration step, the measurement of the nucleation capacity can be also applied to evaluate the efficiency of the filtration.
When micro-crystals are not efficiently retained during filtration, increase of the calcium carbonate precipitation can result.
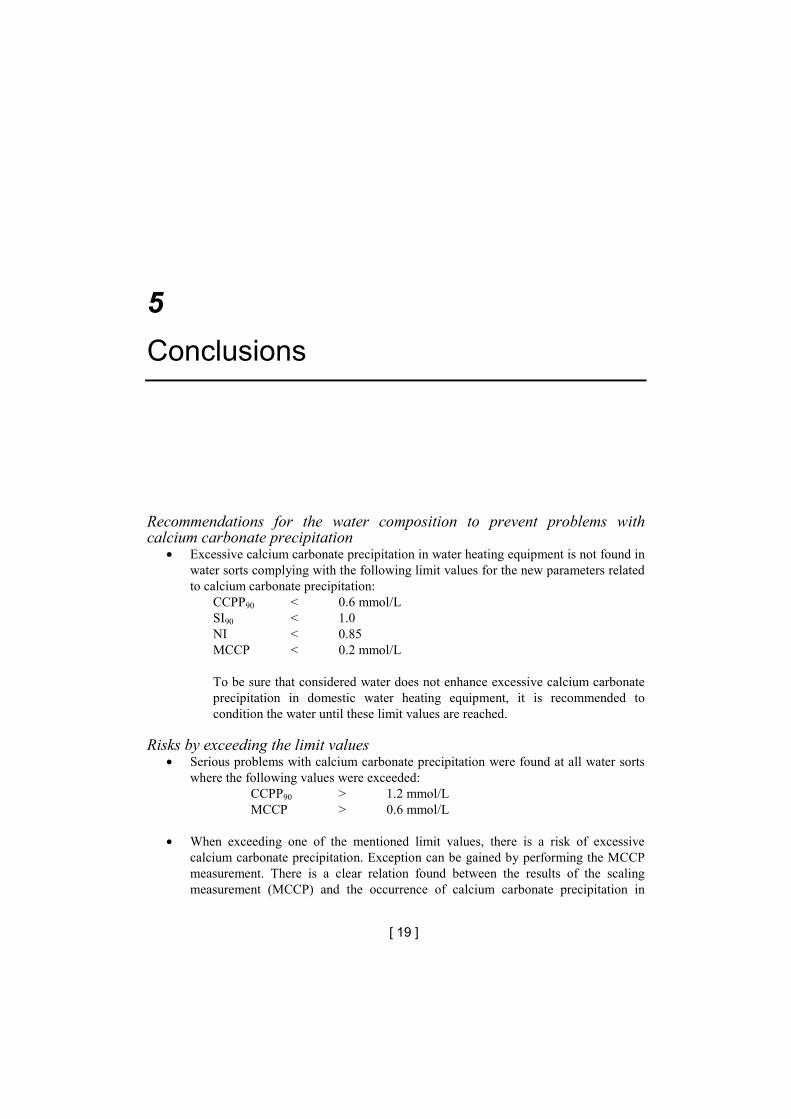
The implementation of the determination of the nucleation capacity on several points in the purification process on the pump station Scheveningen, The Netherlands reflects the sense of the measurement method to evaluate the filtration steps (Figure 3.5). This refers to instantaneous exposure.
Figure 3.5 The nucleation capacity of the water on different points in water purification process on the pump station Scheveningen, The Netherlands (softening with milk of lime).
The figure shows that during the softening process micro-crystals are formed. The amount of micro-crystals is first lowered by mixing with un-softened water and after that by fast filtration. In the filtrate the nucleation index is however even higher than in the influent; single layer rapid sand filters show still some breakthrough of micro-crystals.
0
0,2
0,4
0,6
0,8
1
1,2
1,4
1,6
1,8
influent effluent influent fastfilters
fast filter filtrate slow filter filtrate
nucl
eatio
n ca
paci
ty (1
/log(
tind)
)
0,5
0,6
0,7
0,8
0,9
1
1,1
1,2
1,3
1,4
1,5
50 60 70 80 90 100 110 120 130observed upflow velocity (m/h)
nucl
eatio
n ca
paci
ty


[ 15 ]
4 How to use the new scaling prediction methods
4.1 Implementation to prevent client complaints Establish the scaling measurement and determine MCCP:
- when MCCP < 0.2 it is hardly to be expected that complaints are caused by occurrence of calcium carbonate precipitation during water heating. The following action: search further for the reasons of complaints;
- when MCCP > 0.2: complaints can result from calcium carbonate precipitation during heating. Action follows: search for the reason for the occurrence of calcium carbonate precipitation by implementing of new determination methods:
o CCPP90 > 0.6 mmol/L: the chemical composition of water may lead to calcium carbonate precipitation during water heating. Implementation of water conditioning is usually efficient to decrease the calcium carbonate precipitation capacity.
o CCPP90 < 0.6 mmol/L: the chemical water composition does not lead directly to enhancement of calcium carbonate precipitation. Implement now the measurement of index capacity:
NI > 0.85: there are nuclei present in the water enhancing calcium carbonate precipitation. The calcium carbonate precipitation capacity can be decreased by optimisation of the purification process.
NI < 0.85: no indication for nuclei in the water. The reason for the relatively large magnitude of calcium carbonate precipitation is not known.
The schematic representation of this systematic procedure is given in Figure 4.1.

16 How to use the new scaling prediction methods
]
Figure 4.1. Implementation of measurement methods to solve the complains regarding calcium carbonate precipitation
Compains about calcium carbonate precipitation
PPCC > 0.2 ?PPCC > 0.2 ?PPCC > 0.2 ?PPCC > 0.2 ?
YES
NOThe water does not cause calcium carbonate precipitation.Complains are not caused by calcium carbonate precipitation during water heating
Look for other reasonsof compains (for instancevarying water composition
The water has moderateto strong calcium carbonateprecipitation propensity
TPCCTPCCTPCCTPCC90909090 > 0.6 ?> 0.6 ?> 0.6 ?> 0.6 ?YES
Calcium carbonate precipitationcaused by TPCC90 (high hardness,pH, HCO3
-)
Lowering TPCC90 byconditioning (softening)
NO
NI > 0.85 ?NI > 0.85 ?NI > 0.85 ?NI > 0.85 ?
NO
Reason for calcium carbonate precipitation not found
YES Calcium carbonate precipitationcaused by micro-crystals presentIn the water
Decrease formation of micro-crystals or remove them

How to use the new scaling prediction methods 17
4.2 Implementation to determine the benefits and necessity of conditioning
Calculate the CCPP90 to determine the magnitude of benefit by conditioning for calcium carbonate precipitation:
- the CCPP90 > 1.2 mmol/L: a lot of calcium carbonate precipitation will occur after water heating in the water supply area resulting in intensive maintenance of water heating equipment and relatively high costs. Introduction of conditioning (softening) will decrease this effect;
- the CCPP90 lies between 0.6 and 1.2 mmol/L: in the water supply area the calcium carbonate precipitation will occur during water heating although not in extreme rate. Conditioning will decrease this effect;
- the CCPP90 < 0.6 mmol/L: problem with calcium carbonate precipitation will not arise in the water supply area. Conditioning will not improve here anything.
Figure 4.2 presents schematically the above-described procedure.
Figure 4.2. Implementation of measurement methods to determine the sense and necessity of water conditioning
Has conditioning sense from point of view of calcium
carbonate precipitation?
TPCC>1.2 ?TPCC>1.2 ?TPCC>1.2 ?TPCC>1.2 ?
NO
YES Large decrease of calciumcarbonate precipitationbecause of conditioningis possible
TPCCTPCCTPCCTPCC90909090 > 0.6 ?> 0.6 ?> 0.6 ?> 0.6 ?YES
NO
No decrease in calcium carbonate precipitation by conditioning
Significant decrease of calciumcarbonate precipitationbecause of conditioningis possible

18 How to use the new scaling prediction methods
]
4.3 Implementation to optimise conditioning and filtration processes
Conditioning processes Implement the measurement of the nucleation index to evaluate changes in process settings during conditioning processes (for instance adjustment of surface velocity during softening, change in caustic solution dosage for pH correction). Better process setting should result in decrease of nucleation capacity. During softening this will lead, among others, in a decrease of the loading to the filters following softening process.
Filtration processes Implement the measurement of nucleation capacity on diverse points in the purification scheme and determine the rate of nuclei occurrence in the water, the rate of their formation and removal respectively. Control, using the scaling measurement, whether the distributed drinking water after optimisation of purification has indeed a lower calcium carbonate precipitation capacity. Figure 4.3 presents schematically the implementation of the measurement methods.
Figure 4.3. Implementation of measurement methods to optimise the purification processes
Optimisation of thepurification process from point of calcium
carbonate precipitation?
PPCC < 0.2 PPCC < 0.2 PPCC < 0.2 PPCC < 0.2 en NI < 0.85?en NI < 0.85?en NI < 0.85?en NI < 0.85?
NO
YES
Change process settings
Stop optimisation
Calcium carbonate precipitationDoes not constitute problemanymore
[ 19 ]
5 Conclusions
Recommendations for the water composition to prevent problems with calcium carbonate precipitation
• Excessive calcium carbonate precipitation in water heating equipment is not found in water sorts complying with the following limit values for the new parameters related to calcium carbonate precipitation:
CCPP90 < 0.6 mmol/L SI90 < 1.0 NI < 0.85 MCCP < 0.2 mmol/L To be sure that considered water does not enhance excessive calcium carbonate precipitation in domestic water heating equipment, it is recommended to condition the water until these limit values are reached.
Risks by exceeding the limit values
• Serious problems with calcium carbonate precipitation were found at all water sorts where the following values were exceeded:
CCPP90 > 1.2 mmol/L MCCP > 0.6 mmol/L
• When exceeding one of the mentioned limit values, there is a risk of excessive calcium carbonate precipitation. Exception can be gained by performing the MCCP measurement. There is a clear relation found between the results of the scaling measurement (MCCP) and the occurrence of calcium carbonate precipitation in

20 Conclusions
practice. With MCCP lower than 0.2 mmol/L no calcium carbonate precipitation was observed, by values between 0.2 and 0.6 mmol/L moderate problems with calcium carbonate precipitation were experienced, and the values exceeding 0.6 mmol/L led almost always to serious problems. When no measurements of MCCP are available, the CCPP90 can be used to predict the magnitude of the calcium carbonate precipitation. By values of CCPP90 lower than 0.6 mmol/L problems with calcium carbonate precipitation do not occur, between 0.6 and 1.2 moderate problems can be concluded, while, by values higher than 1.2 excessive calcium carbonate precipitation prevails.
• The saturation index at 90 °C (SI90) does not vary too much for Dutch water types. Almost all water types were characterised by a SI90 in the range between 1.0 and 1.2. A value for the SI90 higher than 1.0 does not implicate acute problems with calcium carbonate precipitation.
• The nucleation index NI, obtained from measurement of nucleation capacity, seems not to be very distinguished. It is found, however, that in water sorts that were softened in crystallisation reactors, high NI values could be found, enhancing calcium carbonate precipitation. By NI values lower than 0.85 there was no enhancement of calcium carbonate precipitation. There are, however, some measurements of higher values, whereby an enhancement of calcium carbonate precipitation occurred.
Possibilities to use new parameters • The new parameters to estimate calcium carbonate precipitation capacity are suitable
to predict and analyse the problems experienced with calcium carbonate precipitation in domestic water heating equipment.
Predictions of the magnitude of calcium carbonate precipitation can be attained using the parameter CCPP90. To optimise conditioning and filtration processes, the nucleation index is important. To evaluate the magnitude of the problem by complains about calcium carbonate precipitation, the scaling measurement (MCCP) is suitable.
[ 21 ]
Literature
Ammers, M. van (1982) … H2O, 15, 485- Blois, M.R. de, Moel, P.J. de, Dotremont, C. and Wilms, D. (1991) Troebeling en scaling van drinkwater na ontharden met korrelreactoren. H2O, 31, No. 3, 72-78. Brink, H. and Ekkers, G.H. (1995) Handleiding programma TACC90 - versie 1.2'. Kiwa report SWS 95.505. Dirken, P.J., Baars, E.T., Graveland, A. and Woensdrecht, C.F. (1995) Invloed van entmateriaal op
waterontharding in korrelreactoren, een kristallografische benadering van kiemvorming en kristallisatie. H2O 28 No. 16, 497-502
Eekhout, J.M.J.M. van, Hoogsteen, K.J., Haring B.J.A.M. and Eekeren, M.W.M., van (1991) Problemen met kalkafzetting. H2O 24 no 12, 310-314.
Eekhout, J.M.J.M. van, Eekeren M.W.M. van and Brink, H. (1992) Kiwa-workshop: Vóórkomen en voorkómen van kalkafzetting. H2O 25 no 25, 697-699.
Feij, L.A.C. and Smeenk, J.G.M.M. (1981). De bepaling van de kalkverzadigingsindex van water. H2O 14 no. 6, 131-136.
Feij, L.A.C. and Smeenk, J.G.M.M. (1983). De bepaling van de kalkverzadigingsindex van water. Kiwa-notification number 73.
Galjaard, G., Brink, H. and Jagt, van der, H. (1995). Voorschrift meting nucleërend vermogen. Kiwa report SWE 95.014.
Galjaard, G., Dussen J.C. van der and Brink, H. (1997). Voorschrift hechtingsmeting. Kiwa report SWE 97.009
Graveland, A. (1987). Amsterdam: van hard naar zacht water. H2O 20 no. 13, 291-294. Rossum, J.R. and Merrill, D.T. (1983). An evaluation of the calcium carbonate saturation indexes. Journ.
AWWA, 75 no. 2, 95-100. Stumm, W. and Morgan, J.J. (1982). 'Aquatic chemistry'. Wiley & Sons, London. Swinney, L.D., J.D. Stevens, J.D. and Peters, R.W. (1982). Calcium carbonate crystallization kinetics. Ind.
Eng. chem. dundam., 21, 31-36. Verdoes, D. (1991). Calcium carbonate precipitation in relation to detergent performance. PhD thesis TU
Delft, The Netherlands. Vinke, G.B. (1990). Ontharden van drinkwater gaat goed, maar goede kalk is duur (report
Kiwa-workshop Kalk en Kalkafzetting)'. H2O 23 no. 8, 216-217.