Scaling of Anatomically Derived Maximal Bite Force in Primates
31
University of South Carolina University of South Carolina Scholar Commons Scholar Commons Senior Theses Honors College 5-5-2017 Scaling of Anatomically Derived Maximal Bite Force in Primates Scaling of Anatomically Derived Maximal Bite Force in Primates Ashley Deutsch Follow this and additional works at: https://scholarcommons.sc.edu/senior_theses Part of the Biology Commons, and the Evolution Commons Recommended Citation Recommended Citation Deutsch, Ashley, "Scaling of Anatomically Derived Maximal Bite Force in Primates" (2017). Senior Theses. 147. https://scholarcommons.sc.edu/senior_theses/147 This Thesis is brought to you by the Honors College at Scholar Commons. It has been accepted for inclusion in Senior Theses by an authorized administrator of Scholar Commons. For more information, please contact [email protected].
Transcript of Scaling of Anatomically Derived Maximal Bite Force in Primates

University of South Carolina University of South Carolina
Scholar Commons Scholar Commons
Senior Theses Honors College
5-5-2017
Scaling of Anatomically Derived Maximal Bite Force in Primates Scaling of Anatomically Derived Maximal Bite Force in Primates
Ashley Deutsch
Follow this and additional works at: https://scholarcommons.sc.edu/senior_theses
Part of the Biology Commons, and the Evolution Commons
Recommended Citation Recommended Citation Deutsch, Ashley, "Scaling of Anatomically Derived Maximal Bite Force in Primates" (2017). Senior Theses. 147. https://scholarcommons.sc.edu/senior_theses/147
This Thesis is brought to you by the Honors College at Scholar Commons. It has been accepted for inclusion in Senior Theses by an authorized administrator of Scholar Commons. For more information, please contact [email protected].

Deutsch: Scaling of Anatomically Derived Maximal Bite Force in Primates
1
SCALING OF ANATOMICALLY DERIVED MAXIMAL BITE FORCE IN PRIMATES
By
Ashley Deutsch
Submitted in Partial Fulfillment of the Requirements for
Graduation with Honors from the South Carolina Honors College
May, 2017
Approved:
Adam Hartstone-Rose
Director of Thesis
Michael Couch Second Reader
Steve Lynn, Dean
For South Carolina Honors College

Deutsch: Scaling of Anatomically Derived Maximal Bite Force in Primates
2
TABLE OF CONTENTS
Summary ................................................................................................................................................ 3
Abstract ................................................................................................................................................. 5
Introduction ........................................................................................................................................... 6
Hypotheses ........................................................................................................................................ 12
Materials and Methods ........................................................................................................................ 13
Sample............................................................................................................................................... 13
Force Production Variables ................................................................................................................ 14
Dietary Categorization ....................................................................................................................... 18
Body Mass Proxies ............................................................................................................................ 19
Data Analysis .................................................................................................................................... 20
Results .................................................................................................................................................. 20
Discussion............................................................................................................................................. 21
Literature Cited ................................................................................................................................... 23
Tables ................................................................................................................................................... 26

Deutsch: Scaling of Anatomically Derived Maximal Bite Force in Primates
3
THESIS SUMMARY
Because the masticatory apparatus plays a role in processing food, its morphology has
been evolutionarily shaped by the mechanical properties of diet. The masticatory apparatus
consists of several muscles that act together to produce force along the tooth row. These jaw
adductors, which are muscles that act in closing the jaw, are the temporalis, the masseter, and the
medial pterygoid. The highly variable diets of species in the primate order make them
particularly intriguing for studying signals of dietary adaptation. Because of this dietary
diversity, we decided to categorize primate diets for analysis. We have chosen to divide our
sample into two categories: (1) species that consume pliant and mechanically unchallenging
diets, which include those who primarily eat fruits and (2) species that consume hard diets
requiring forceful or repetitive mastication, which include species that are primarily leaf-eating.
Bite force is an important variable of the masticatory apparatus that can be examined for signals
of dietary adaptation. In the primate order, empirically measured bite force, which involves
forcing a living specimen to bite down on a transducer, is not available because many species are
rare or endangered and therefore unavailable for the invasive procedure. We have instead chosen
to anatomically estimate bite force (BF) in our sample. Our sample consists of 31 specimen
representing 23 different species. Eight of these species are platyrhines, new world monkeys, and
15 are catarrhines, old world monkeys and apes. 14 of the species fell into dietary category 1,
while 9 species fell into dietary category 2.
For this study, we have chosen to estimate BF by combining physiological cross-
sectional area (PCSA) data with skull dimensions that approximate the moment arms of the
muscles and bite points to model the action of the jaw. PCSA is a function of muscle mass,
fascicle length, and the specific density of muscle. It represents the area of the muscle in cross

Deutsch: Scaling of Anatomically Derived Maximal Bite Force in Primates
4
section perpendicular to the muscle fascicle direction. This accounts for the force generated
along the muscle’s line of action in pennate muscles, which produce an angled force due to
angular fiber orientation. Pennation is the angulation of muscle fibers.
In order to estimate BF, we modeled the jaw as a third-class lever, such that the fulcrum
was the point of rotation on the mandibular condyle, the force was applied by each of the
masticatory muscles, and the load was at a specific bite point along the tooth row. We measured
the moment arm of the muscle and the moment arm of the bite at each point to scale PCSA and
produce a BF estimate. We chose three realistic bite points along the tooth row: first upper
incisor, the upper canine, and the front cusp of the first upper molar. We used muscle
attachments as a guide for modeling the orientation of a muscle’s force. The muscle’s action was
modeled between the centroid of the origin and insertion of each muscle. PCSA was scaled by
the mechanical advantage of each muscle in order to estimate BF.
We examined the scaling of bite force variables with body size proxies for the sample as
a whole and for each suborder and dietary category. We found no statistically significant
deviation from isometry (symmetric scaling) in our bite force variables, although bite force
approached positive allometry in our sample at all bite points in the catarrhine suborder. We also
analyzed the residuals of bite force grouped by diet category and suborder. We found no
statistically significant differences in scaling between these variables.
The discrepancy between these findings and those in Hartstone-Rose and colleagues
(2017) demonstrate the role of leverage in force production. These results suggest that PCSA,
which represents force production capability, scales allometrically to counteract muscle or bite
point leverages that are inadequate for sufficient force production rather than dietary signals. The

Deutsch: Scaling of Anatomically Derived Maximal Bite Force in Primates
5
lack of clear signals of dietary adaptation in our sample are likely due to the large variation
within primate diets and the generalized dentition of all primates.
ABSTRACT
Bite force analysis is important the examination of the evolutionary factors that have shaped the
masticatory apparatus. Unfortunately, in primates, empirically measured bite force is largely
unavailable because of the invasive nature of the procedure. Because of this, we have estimated
bite force in a large sample across the primate order at three different realistic bite points along
the tooth row: the first maxillary incisor, the maxillary canine, and the paracone of the first
maxillary molar. Here, we model bite force by combining measured physiological cross-
sectional area of the jaw adductors from Hartstone-Rose and colleagues (2017) with osteological
measurements from the same specimen. We did this by treating the jaw as a third-class lever as
has been done by Hartstone-Rose and colleagues (2012). Our findings at all bite points suggest
that there is no statistically significant difference in scaling of bite force based on diet or
suborder. These findings contrast the findings of positive allometry in the Catarrhine suborder
for the bite force proxies of muscle mass and muscle PCSA by Hartstone-Rose and colleagues
(2017). This difference is likely due to the role of leverage in bite force production. PCSA has
been evolutionarily driven up to account of inadequacies in bite point or muscle leverages in
order to produce forces necessary for food consumption. The lack of dietary signals seen in the
sample is likely due to the generalized dentition of primate species and the variation within
species’ diets.

Deutsch: Scaling of Anatomically Derived Maximal Bite Force in Primates
6
INTRODUCTION
Due to the role that the musculoskeletal masticatory apparatus plays in chewing, its
morphology has been evolutionarily shaped by the mechanical properties of the diet. The
masticatory apparatus consists of several jaw muscles, which produce forces with different
magnitudes and orientations, that act cooperatively in a system to produce force along the tooth
row, thereby mechanically processing food. Modeling muscle force production is essential for
understanding muscle function, because of its functional correlates and the current unavailability
of empirically measured bite force data.
The highly variable diets of species in the primate order make them particularly
intriguing for studying signals of dietary adaptation. Primate muscle architecture has been widely
studied for this reason. In particular, cross-sectional area, a variable of muscle architecture, has
been found to scale with body size isometrically or with slight positive allometry in primate
masticatory muscles across both strepsirrhines and platyrrhines (Anapol et al., 2008; Perry and
Wall, 2008; Hartstone-Rose et al., 2017). Previous studies have demonstrated the relationship
between masticatory muscle fiber architecture and dietary requirements in primates. A
correlation between masticatory muscle architecture and mechanical requirements of diet,
including gape and bite force have been demonstrated in Callitrichid monkeys. Some
Callitrichids engage in tree gouging to encourage the flow of tree gum or sap. Tree gouging
requires a relatively wide jaw gape, which has driven muscle fiber lengths (FL) to be relatively
long in relation to muscle mass (Taylor and Vinyard, 2004; Eng et al., 2009; Taylor et al., 2009).
Another primate study on capuchins showed that some primates have both large jaw adductor
physiological cross-sectional area (PCSA) and long FL, likely as an adaptation to maximize gape
and bite force for processing large, resistant foods (Taylor and Vinyard, 2009).

Deutsch: Scaling of Anatomically Derived Maximal Bite Force in Primates
7
Previously, the masticatory apparatus has been modeled to estimate bite force (BF) (Perry
et al., 2010; Taylor et al., 2015). This study builds upon previous literature by examining the
correlation of bite force with diet and body size in a large sample across the primate order. We
produced bite force estimates at several bite points along the tooth row, which is valuable,
because actual bite force data of this kind are not available for many species. Modeling bite force
in primates is important for making inferences about diet and feeding behavior in fossil primates
and for understanding the masticatory apparatus of primates in the field of primatology.
Empirical bite force data is not readily accessible for primates primarily due to the
invasive nature of this research. Therefore, it is essential to be able to effectively model the force
generated by the masticatory muscles. The most relevant variables for modeling bite force are
electromyography, physiological cross-sectional area (PCSA), and skull dimensions that
approximate moment arms of the masticatory muscles and jaw (Hartstone-Rose et al., 2012).
Electromyography (EMG) allows for the analysis of electrical signals during muscle
contraction. This is ideal for the analysis of the relationship between diet and masticatory muscle
architecture, because it allows for the contraction of different muscle groups to be analyzed
individually in-vivo during chewing of foods of various textures. EMG data for primate jaw
adductors has been used by Vinyard et al. (2008) and Vinyard and Taylor (2010). A recent study
of primate jaw adductor EMG activity and fiber architecture suggests that evolutionary forces
acting upon masseter and temporalis fiber architectures may have occurred separately (Vinyard
and Taylor, 2010). Despite the useful nature of this data, the collection of EMG data was not
feasible for this study, because it was logistically impossible to travel to numerous zoos for data
collection. More importantly, the EMG procedure is fairly invasive, and as many primate species
are rare or endangered, the EMG procedure was not a viable option for data collection.

Deutsch: Scaling of Anatomically Derived Maximal Bite Force in Primates
8
Therefore, in this study, we have instead selected to model the forces produced by the
masticatory apparatus of primates in our sample by combining data on the PCSA of the
mandibular adductors with cranial geometry to model BF.
The contractile force of a muscle, BF in the case of masticatory muscles, is a function of
cross-sectional area such that muscle size and the force of contraction are positively correlated
(Hartstone-Rose et al., 2017). Cross-sectional area does not adequately represent the force
production capabilities, because it models the muscle as though all muscle fibers are parallel to
the orientation of the muscle throughout the entire muscle. This is, however, not always the case.
Many muscles are divided by fascial planes, which the muscle fibers attach to at an angle rather
than parallel to muscle orientation as assumed in cross sectional area. This angulation of muscle
fascicles is called pennation, and it impacts the force production capabilities of a muscle (Anapol
and Barry, 1996). Because of this, it is important to take the cross-section of of the muscle fibers
perpendicular to the fiber orientation rather than the entire muscle. The measurement that takes
this into account is the physiological cross-sectional area.
Physiological cross-sectional area is a function of muscle mass, fascicle length, and the
specific density of muscle. It represents the area of the muscle in cross section perpendicular to
the muscle fascicle direction. This measurement accounts for pennation of muscle fibers within
the muscles, by accounting only for force generated along the muscle’s line of action, where
pennate muscles produce angled force due to their angled fiber orientations. Pennation increases
the number of fascicles present within a given volume of muscle, thus increasing PCSA. Since
force is produced in a muscle along the muscle fascicle, PCSA is related to maximum muscle
force production (Close, 1972; Anapol et al., 2008), making it important for modeling BF.

Deutsch: Scaling of Anatomically Derived Maximal Bite Force in Primates
9
Force production capabilities are maximized by increasing pennation and shortening fiber
length. Shortening fiber length or increasing pennation, however, decreases muscle stretch and
contraction speed. Therefore, there is a physiological trade of between BF production and gape
that is based on dietary requirements. Both BF and gape can only be simultaneously increased by
increasing muscle mass, allowing for a relatively larger number of fascicles to be present within
the given muscle.
Hartstone-Rose and colleagues (2017) examined the muscle architecture of the
masticatory muscles within a large sample from across the primate order. That same sample has
been used in this contribution to further investigate bite force. In that study as well as others,
PCSA has been found to scale isometrically or with positive allometry in primates (Perry and
Wall, 2008; Anapol et al., 2008; Hartstone-Rose et al., 2017). Although there was little evidence
of dietary signals in the masticatory muscle architecture data, Hartstone-Rose and colleagues
(2017) found that fiber length scaled with positive allometry in the temporalis in taxa that
consume softer foods (i.e., frugivores). This suggests that the temporalis plays an important role
in the production of gape in primates. This intriguing relationship was the catalyst needed for us
to expand the investigations conducted by Harstone-Rose and colleagues (2017) by combining
the previous findings with skeletal measurements from the same specimen in order to produce
BF estimations.
The measurements of the skull used in BF estimation allow for the masticatory apparatus
to be modeled as a third-class lever. This model has been suggested by many authors (e.g.,
Turnbull, 1970; Hartstone-Rose et al., 2012). The orientation of the force produced by the each
of the jaw adductors (the masseter, temporalis, and medial pterygoid) can be approximated using
each muscle’s respective origin and insertion. The orientation of each individual muscle’s force

Deutsch: Scaling of Anatomically Derived Maximal Bite Force in Primates
10
is important for modeling this complex system in which the jaw adductors perform a single
action together. The moment arm of each muscle can then be modeled as a vector perpendicular
to the orientation of the force that spans the force line to the rotational axis on the mandibular
condyle. The moment arm can be used to scale PCSA in order to find the mechanical advantage
of the muscle. This can then be multiplied by the force constant of muscle cross-section as
defined by Close (1972) to calculate the force production capabilities of each muscle. This force
acts as the in-lever for the system.
BF estimation must account for the force produced on the working side, side of the jaw
that contains the load, and balancing side, side that has no load but contracts to allow for
symmetrical closure. Bite force is therefore the result of working side bite force (WBF) and
balancing side bite force (BBF). Both WBF and BBF are estimated using the same in-lever, the
force produced by the masticatory muscles; however, they have different out-levers based on
their action. The out-lever of WBF is from the point of rotation on the mandibular condyle to the
point on the same side of the skull where the load is applied, which is a bite point. BBF is the
contraction of the muscles on the side opposite to that of the bite point. Because of this, the out-
lever must wrap around the skull. It is measured from the point of rotation on the mandibular
condyle to interdentale and then to the bite point on the other side. Because we made these
measurements on two dimensional images of the specimen taken from only one side, we assume
bilateral symmetry in our measurements. We have modeled BF in this way at three different
realistic bite points along the tooth row: the first maxillary incisor, the canine, and the paracone
of the first molar. This method of modeling assumes that muscles are firing constantly,
uniformly, and maximally. It also assumes that all fascicles within a muscle fire simultaneously.
These conditions are unrealistic for any normal consumption; however, these assumptions are

Deutsch: Scaling of Anatomically Derived Maximal Bite Force in Primates
11
necessary for the purpose of modeling bite force. This kind of modeling has been used to
represent bite force when muscles contract maximally (e.g., Perry et al., 2011; Hartstone-Rose et
al., 2012).
The primate order is particularly interesting for the examination of dietary signals on bite
force because of the varied nature of primate diets. We applied the dietary categorization used by
Hartstone-Rose and colleagues (2017), which categorizes primate diets as either primarily
frugivorous or primarily folivorous. For these categorizations, dietary data was taken from
dietary descriptions in the Handbook of the Mammals of the World (Mittermeier et al., 2012).
We assess the way in which the functional demands of diet impact masticatory muscle
architecture because of the functional relationships of muscle architecture with bite force and
gape. This relationship of functional adaptation to physical morphology has been demonstrated
in several primate studies. In Callitrichid monkeys, tree gouging, which requires a relatively
wide jaw gape, has driven muscle fiber lengths (FL) to be relatively long in relation to muscle
mass (Taylor and Vinyard, 2004; Eng et al., 2009; Taylor et al., 2009). Another primate study on
capuchins showed that some primates have both large jaw adductor physiological cross-sectional
area (PCSA) and long FL, likely as an adaptation to maximize gape and bite force for processing
large, resistant foods (Taylor and Vinyard, 2009). Hartstone-Rose and colleagues (2017) found
little impact of diet on PCSA in the sample used in this study; however, we attempted to
determine whether BF is impacted differently than PCSA by functional requirements of diet.
This contribution evaluates the effect of leverage on scaling by examining the
functionally significant differences in scaling of BF from the simpler PCSA. We assess the
scaling of estimated maximum bite force production with the geometric means of the skull, jaw
length, and body mass, which we use as proxies for body size, and determine whether

Deutsch: Scaling of Anatomically Derived Maximal Bite Force in Primates
12
mechanical properties of food can account for some of the deviation. We have modeled bite
force by scaling the jaw adductor PCSA data from Hartstone-Rose and colleagues (2017) using
cranial geometry data from the same specimen to approximate moment arms of the masticatory
apparatus. This procedure is similar to that used in Hartstone-Rose et al. (2012); however, this
study differs in that species within the primate order have more variable diets than species of the
felid order. For instance, species of the Aotus genus are primarily frugivorous, whereas species
of the genus Mandrillus eat a fairly obdurate diet including crabs and small mammals
(Mittermeier et al., 2012). A similar study has been performed in a small sample of primates
(Perry et al., 2011); however, the sampling of this study only included primates within the
strepsirrhines suborder, which is less diverse than the order as a whole. The order is more
extensively sampled in this study and represents a larger diversity of diets. Additionally, this
study attempts to model bite force at three realistic bite points along the tooth row, which has not
previously been done in such a large and diverse sample of primates.
HYPOTHESES
We hypothesize that estimated BF scales isometrically with body mass (BM), geometric
mean (GM), and jaw length (JL), which act as proxies for body size, across this primate sample
based on the scaling observed in strepsirrhines (Perry et al., 2011).
Previous studies have suggested that bite volume relative to body size is larger in
frugivorous Strepsirrhines than in folivorous Strepsirrhines (Perry and Hartstone-Rose, 2010).
Species that consume relatively large bites of food, such as ripe fruits, will require a relatively
larger gape than species who consume diets that do not require wide gape, such as foliage.
Because of the physiological trade-off that exists between gape and bite force, we can expect that

Deutsch: Scaling of Anatomically Derived Maximal Bite Force in Primates
13
these two capabilities will have an inverse relationship. Therefore, we can expect that
frugivorous primates (Category 1) will have lower maximum bite force capabilities than
folivorous primates (Category 2).
We expect that species that exploit relatively obdurate (hard or tough) foods, such as hard
nuts and seeds (Category 2), will exhibit relatively larger maximal bite force when compared
with species who consume more malleable diets, such as ripe fruits or flowers (Category 1).
Primarily folivorous species, which consume a rough diet requiring a relatively large
amount of masticatory manipulation prior to exploitation (Category 2) will have a relatively
higher estimated bite force than those that consume more malleable, primarily frugivorous diets
(Category 1), because of the greater need for force production during consumption.
We expect that primates who consume relatively obdurate or folivorous (Category 2)
diets will be capable of producing relatively higher BF at the paracone bite point than other
species, due to the requirement of large force in grinding foods. We also expect that species that
consume diets that require tearing (Category 2) have relatively higher estimated BF at the canine
bite force compared to other species.
MATERIALS AND METHODS
Sample
Our sample consisted of 31 specimens representing 23 species from 14 different genera
(Table 1). The muscle architecture for these same specimens was examined by Hartstone-Rose
and colleagues (2017). We have combined the PCSA values from that contribution with cranial
Deutsch: Scaling of Anatomically Derived Maximal Bite Force in Primates
14
morphology data from in order to calculate BF. As stated in Hartstone-Rose and colleagues
(2017), these specimens were all captive-raised adults, which, with the exception of one
specimen (C. jacchus, which was dissected in the USA), were from zoos in Spain and were
dissected at the Universidad de Valladolid in Valladolid, Spain. These specimens were preserved
and dissected according to the methodology described in Hartstone-Rose and colleagues (2017).
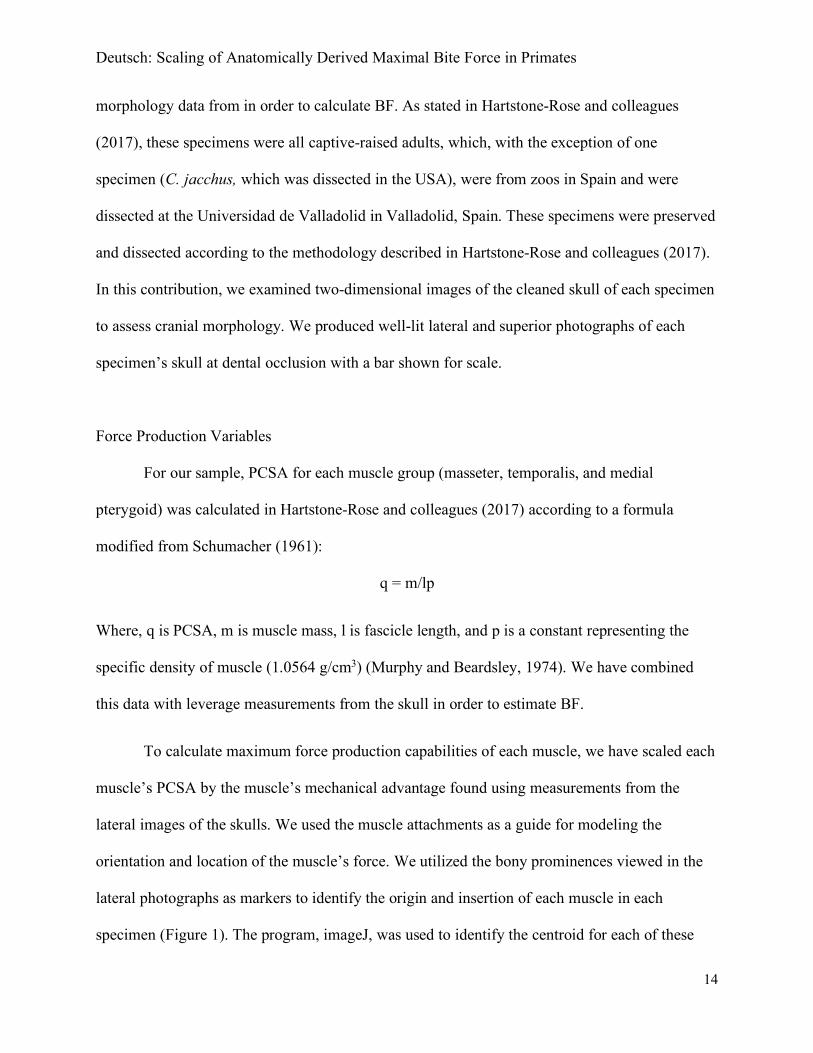
In this contribution, we examined two-dimensional images of the cleaned skull of each specimen
to assess cranial morphology. We produced well-lit lateral and superior photographs of each
specimen’s skull at dental occlusion with a bar shown for scale.
Force Production Variables
For our sample, PCSA for each muscle group (masseter, temporalis, and medial
pterygoid) was calculated in Hartstone-Rose and colleagues (2017) according to a formula
modified from Schumacher (1961):
q = m/lp
Where, q is PCSA, m is muscle mass, l is fascicle length, and p is a constant representing the
specific density of muscle (1.0564 g/cm3) (Murphy and Beardsley, 1974). We have combined
this data with leverage measurements from the skull in order to estimate BF.
To calculate maximum force production capabilities of each muscle, we have scaled each
muscle’s PCSA by the muscle’s mechanical advantage found using measurements from the
lateral images of the skulls. We used the muscle attachments as a guide for modeling the
orientation and location of the muscle’s force. We utilized the bony prominences viewed in the
lateral photographs as markers to identify the origin and insertion of each muscle in each
specimen (Figure 1). The program, imageJ, was used to identify the centroid for each of these
Deutsch: Scaling of Anatomically Derived Maximal Bite Force in Primates
15
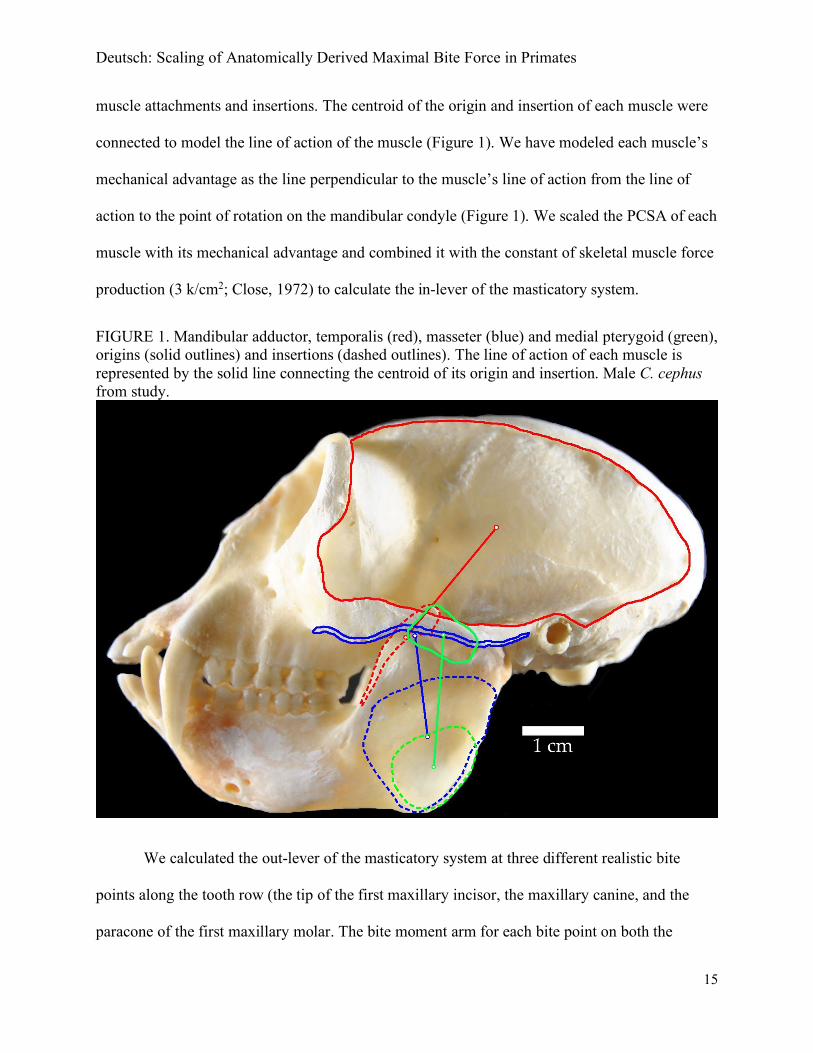
muscle attachments and insertions. The centroid of the origin and insertion of each muscle were
connected to model the line of action of the muscle (Figure 1). We have modeled each muscle’s
mechanical advantage as the line perpendicular to the muscle’s line of action from the line of
action to the point of rotation on the mandibular condyle (Figure 1). We scaled the PCSA of each
muscle with its mechanical advantage and combined it with the constant of skeletal muscle force
production (3 k/cm2; Close, 1972) to calculate the in-lever of the masticatory system.
FIGURE 1. Mandibular adductor, temporalis (red), masseter (blue) and medial pterygoid (green), origins (solid outlines) and insertions (dashed outlines). The line of action of each muscle is represented by the solid line connecting the centroid of its origin and insertion. Male C. cephus from study.
We calculated the out-lever of the masticatory system at three different realistic bite
points along the tooth row (the tip of the first maxillary incisor, the maxillary canine, and the
paracone of the first maxillary molar. The bite moment arm for each bite point on both the

Deutsch: Scaling of Anatomically Derived Maximal Bite Force in Primates
16
working and balancing side were calculated using imageJ on the lateral photograph for each
specimen. The moment arm of the working-side (Figure 2) was modeled as the distance from the
point of rotation on the mandibular condyle to each of the bite points. The moment arm of the
balancing side of the system was modeled as the distance from the point of rotation on the
mandibular condyle to interdentale, the point on the maxilla between the central incisors, and
back to one of the bite points. This measurement assumes bilateral symmetry.
FIGURE 2. Yellow lines represent working-side bite point leverages at the central incisor (A),
paracone (B) and canine (C) bite points. The lever arm for each mandibular adductor, temporalis
(red), masseter (blue), and medial pterygoid (green), is represented by the line perpendicular to
the muscle’s line of action that connects with the mandibular condyle.
A
B
C

Deutsch: Scaling of Anatomically Derived Maximal Bite Force in Primates
17
The measurements of the load arms that applied the force to the specific bite points and
the moment arm of muscle force production were combined to calculate the working-side bite
force at each bite point (Hartstone-Rose et al., 2012):
𝑊𝐵𝐹$% = 𝑐((𝑞*+𝐿*+) + (𝑞/*0𝐿/*0) + (𝑞*0𝐿*0)
(𝐿$%))
𝑊𝐵𝐹%1 = 𝑐((𝑞*+𝐿*+) + (𝑞/*0𝐿/*0) + (𝑞*0𝐿*0)
(𝐿%1))
𝑊𝐵𝐹0% = 𝑐((𝑞*+𝐿*+) + (𝑞/*0𝐿/*0) + (𝑞0*𝐿*0)
(𝐿2*))
where WBFIC, WBFCA, and WBFPC are the BF on the working side at the central incisor, canine,
and paracone bite points respectively. The moment arms for the masseter, temporalis, and medial
pterygoid are represented by LTMP, LMS, and LMP, respectively. qTMP, qMS, and qPT represent the
PCSA values (Hartstone-Rose et al., 2017) for the temporalis, masseter, and medial pterygoid,
respectively. The load arms for the incisor, canine, and molar bite points from the working-side
are indicated by LIC, LCA, and LFM in the equations above, respectively. The force constant that is
generated by the muscle cross-section is indicated by c in the equations above (3 kg/cm2; Close,
1972).
Estimated BF on the balancing-side of the was calculated using the same formula. The
moment arm for the muscles on the balancing-side were modeled as being equivalent to that of
the working-side; however, the load arms of the bite points were different (as described above).
These measurements were used in the following equations with slight modifications from
Hartstone-Rose and colleagues (2012) to calculate balancing-side BF:
𝐵𝐵𝐹$% = 𝑐((𝑞*+𝐿*+) + (𝑞/*0𝐿/*0) + (𝑞*0𝐿*0)
(𝐿′$%))

Deutsch: Scaling of Anatomically Derived Maximal Bite Force in Primates
18
𝐵𝐵𝐹%1 = 𝑐((𝑞*+𝐿*+) + (𝑞/*0𝐿/*0) + (𝑞*0𝐿*0)
(𝐿′%1))
𝐵𝐵𝐹0% = 𝑐((𝑞*+𝐿*+) + (𝑞/*0𝐿/*0) + (𝑞0*𝐿*0)
(𝐿′2*))
where BBFIC, BBFCA, and BBFPC are the BF on the balancing side at the central incisor, canine,
and paracone bite points respectively. LTMP, LMS, LMP, qTMP, qMS, qPT, and c are defined as in the
working-side equations and represent equivalent values. The load arms for the incisor, canine,
and molar bite points from the working-side are indicated by L’IC, L’CA, and L’FM in the
equations above, respectively.
Because the working-side and balancing-side BF act simultaneously to produce a BF at a
specific bite point, the BF for the working-side and balancing-side were summed to calculate
total BF estimates for each bite point as follows:
𝐵𝐹$% = 𝑊𝐵𝐹$% + 𝐵𝐵𝐹$%
𝐵𝐹%1 = 𝑊𝐵𝐹%1 + 𝐵𝐵𝐹%1
𝐵𝐹0% = 𝑊𝐵𝐹0% + 𝐵𝐵𝐹0%
Where BFIC, BFCA, and BFPC represent the estimated total BF at the first maxillary incisor,
maxillary canine, and paracone bite points, respectively.
Dietary Categorization
In order to assess the adaptation of bite force to the mechanical properties of diet, we
have categorized the species in our sample into two groups based on mechanical properties of

Deutsch: Scaling of Anatomically Derived Maximal Bite Force in Primates
19
diet (Table 1). The species were sorted as in Hartstone-Rose and colleagues (2017) based on
published accounts of species diets (Mittermeier et al., 2012). The first category consists of
species that consume diets made up of pliant and mechanically unchallenging foods, such as ripe
fruits (score of 1). The second category is made up of species that consume obdurate (hard or
tough) diets requiring a great deal of forceful or repetitive manipulation prior to digestion (score
of 2). We have categorized gummivorous members of the genus Callithrix into category one
despite their engagement in tree gouging. Tree gouging requires a relatively wide jaw gape,
which has driven muscle fiber lengths (FL) to be relatively long in relation to muscle mass
(Taylor and Vinyard, 2004; Eng et al., 2009; Taylor et al., 2009), rather than a large BF. Two
dietary categories were chosen despite the subtle differences that can be observed amongst the
diversity of primate diets, because morphology tends to largely fall along the lines of broad
dietary divisions. This functional split between primarily frugivorous and primarily folivorous
groups is a classical observation in primate adaptation literature (notably Kay, 1975).
Body Mass Proxies
Last living body weight was not available for the specimens in this sample. In order to
assess scaling of the bite force with body size in our sample without actual individual body mass
measurements, we selected three different proxies for body size: 1) average species body mass
(BM) from literature, 2) the geometric mean (GM) of a series of cranial measurements
(Hartstone-Rose et al., 2017) (Table 2), and 3) mandibular length for each individual specimen
(JL). Body mass measurements were taken from Fleagle (2013) based on the average weight by
sex for each species. For specimens of unknown sex, the overall species average was used. All of
the craniometric measurements included in GM and JL (mandibular length being a component of

Deutsch: Scaling of Anatomically Derived Maximal Bite Force in Primates
20
GM and the proxy JL) were measured from the lateral and superior photographs of the
specimens’ skulls.
Data Analysis
For analysis, the BF variables were analyzed by species. In this sample, several of the
species had multiple specimen. Because of this, the data for all variables from specimen of the
same species were averaged prior to analysis.
The BF variable for each bite point were regressed against the body mass proxies to
assess scaling. Before regression, the BF and BM variables were reduced to linear variables in
order to simplify the analysis of scaling, so that their predicted slopes were standardized to 1.
The cube root of the BM and square root of BF variables were taken before the variables were
logged. Pairwise comparisons were applied according to phylogenetic and dietary groups.
Residuals were calculated from these RMA regressions as the distance from the line in log space.
All analyses were done in JMP13 (SAS), using a significance criterion of alpha < 0.05.
RESULTS
We have estimated BF by combining PCSA data from Hartstone-Rose and colleagues
(2017) with leverage data from the same specimen for both working- and balancing-side
masticatory muscles. Therefore, differences in scaling between PCSA and BF are due to the role
of leverage in force production. PCSA and muscle mass, both variables correlated with BF, have
been found to scale with slight positive allometry in the Catarrhine suborder (Hartstone-Rose et
al., 2017). We examine deviation from this pattern of scaling in bite force (see discussion).
This study examined the scaling of bite force with three different body size proxies. In
most allometric regressions (Table 3), all bite force variables scale isometrically. None of the

Deutsch: Scaling of Anatomically Derived Maximal Bite Force in Primates
21
variables deviated from isometry with statistical significance. Scaling approaches positive
allometry in the Catarrhine suborder consistently across all bite points (central incisor, canine,
and paracone) when the cranial GM body size proxy was used. At the canine bite point, BF
regressed on GM was driven toward positive allometry across the whole sample. None of the
correlations between the BF variables and GM or JL approached significance beyond isometry.
The analyses of the residuals (Table 4) do not reveal any statistically significant
differences between the two dietary groups; however, all BF variables that approach significance
are higher for category 2 species, those who consume obdurate diets. There were no differences
approaching statistical significance in the comparison of residuals between catarrhines and
platyrrhines.
DISCUSSION
No bite force variables scaled with allometry with statistical significance. Although this
data does not demonstrate statistically significant allometric scaling of any bite force variables,
BF variables at all bite points do approach statistically significant positive allometry in
cattarrhines with the geometric mean body size proxy. These results differ from the finding of
statistically significant positive allometric scaling of PCSA and muscle mass in the Catarrhine
suborder in this sample (Hartstone-Rose et al., 2017). The difference in scaling between these
muscle force production variables, PCSA, muscle mass, and bite force at each of the three
chosen bite points, is due to the role of the osteological components of leverage in bite force
production. The difference in scaling between these variables is due to the variation of cranial
shape, which is obviously correlated with leverage, within the primate order. These results
indicate that leverage only acts to counteract or make up for differences in muscle force

Deutsch: Scaling of Anatomically Derived Maximal Bite Force in Primates
22
production capabilities (PCSA). Potentially PCSA has been driven up in Catarrhines in order to
increase BF due to inadequate muscle or leverage moment arms, such that the bite point is too far
from the point of rotation or the muscles too close to produce adequate force.
We have used JL as one proxy for body size. Because of the importance of leverage in
muscle force production as demonstrated by these results, jaw length is not an appropriate body
size proxy for the purpose of analyzing scaling in the masticatory system. It has impacted and
been impacted by the same evolutionary factors as masticatory muscle architecture, because it is
a part of the same system.
The analysis of residuals in our sample did not reveal any more statistically significant
dietary signals. Although statistically significant differences were not present in our sample,
there is consistent evidence that bite strength is higher, although not significantly so, in species
who consume obdurate diets. The lack of clear dietary signals for the bite force variables
demonstrates the absence of significant evolutionary forces related to diet. This lack of
morphological adaptation to dietary requirements is likely due to the varied diets of primate
species and their generalized dentition and adaptability.

Deutsch: Scaling of Anatomically Derived Maximal Bite Force in Primates
23
Literature Cited
Anapol F, Barry K. 1996. Fiber architecture of the extensors of the hindlimb in semiterrestrial
and arboreal guenons. Am J Phys Anthropol 99:429-447.
Anapol F, Shahnoor N, Ross CF. 2008. Scaling of reduced physiologic cross-sectional area in
primate muscles of mastication. In: Vinyard CJ, Ravosa MJ, Wall CE, editors. Primate
Craniofacial Function and Biology. New York: Springer US. p 201-216.
Cachel S. 1984. Growth and allometry in primate masticatory muscles. Arch Oral Biol 29:287-
293.
Close RI. 1972. Dynamic properties of mammalian skeletal muscles. Physiol Rev 52:129–197.
Eng CM, Ward SR, Vinyard CJ, Taylor AB. 2009. The mechanics of the masticatory apparatus
facilitate muscle force production at wide jaw gapes in tree-gouging marmosets
(Callithrix jacchus). J Exp Biol 212:4040-4055.
Fleagle JG. 2013. Primate adaptation and evolution: Academic Press.
Hartstone-Rose A, Deutsch A, Lischner C, Pastor F. 2017. Dietary and phylogenetic correlates of
primate masticatory muscle fiber architecture. The Anatomical Record
Hartstone-Rose, Perry, Morrow. 2012. Bite Force Estimation and the Fiber Architecture of Felid
Masticatory Muscles. The Anatomical Record 295:1336-1351.
Mittermeier R, Rylands A, Wilson D. 2012. Handbook of the Mammals of the World: Primates.
Volume 3.
Murphy R, Beardsley AC. 1974. Mechanical properties of the cat soleus muscle in situ.
American Journal of Physiology--Legacy Content 227:1008-1013.
Perry JMG, Hartstone-Rose A, and Logan. 2010. The Jaw Adductor Resultant and Estimated
Bite Force in Primates. Anatomical Research International.

Deutsch: Scaling of Anatomically Derived Maximal Bite Force in Primates
24
Perry JMG, Hartstone-Rose A, Wall CE. 2011. The jaw adductors of strepsirrhines in relation to
body size, diet, and Ingested Food Size. The Anatomical Record 294:712-728.
Perry JMG, Wall CE. 2008. Scaling of the chewing muscles in prosimians. In: Vinyard CJ,
Ravosa MJ, Wall CE, editors. Primate craniofacial function and biology. New York:
Springer. p 217–240.
Schumacher G. 1961. Funktionelle morphologie der kaumuskulatur. Jena: Fisher.
Taylor A, Eng C, Anapol F, Vinyard C. 2009. The functional Correlates of Jaw-Muscle Fiber
Architecture in Tree-Gouging and Nongouging Callitrichid monkeys
Taylor A, Vinyard C. 2004. Comparative analysis of masseter fiber architecture in tree-gouging
(Callithrix jacchus) and nongouging (Saguinus oedipus) Callitrichids. Journal of
Morphology 261:275-285.
Taylor A, Vinyard C. 2009. Jaw-muscle fiber architecture in tufted capuchins favors generating
relatively large muscle forces without compromising jaw gape. Journal of Human
Evolution:710-720.
Taylor A, Yuan T, Ross C, and Vinyard C. 2015. Jaw-Muscle Force and Excursion Scale with
Negative Allometry in Platyrrhine Primates. American Journal of Physical Anthropology.
158:242-256.
Turnbull WD. Mammalian masticatory apparatus. Fieldiana: Geology 1970;18:149–356.
Vinyard C, Taylor A. 2010. A Preliminary analysis of the relationship between jaw-muscle
architecture and jaw-muscle electromyography during chewing across primates. The
Anatomical Record. 293:572-582.

Deutsch: Scaling of Anatomically Derived Maximal Bite Force in Primates
25
Vinyard C, Wall C, Williams S, and Hylander W. 2008. Patterns of Variation across Primates in
Jaw-Muscle Electromyography during Mastication. Integrative and Comparative
Biology. 48(2):291-311.

Deutsch: Scaling of Anatomically Derived Maximal Bite Force in Primates
26
TABLE 1. Sample
Species Suborder N (M, F, Unknown)
Body Mass (g)a
Dietary Descriptionb Dietary Categorization
Aotus nancymaae Platyrrhine 2 (1,0,1) 790.5 Insectivore/Carnivore 1
Callithrix jacchus Platyrrhine 1 (1,0,0) 317 Gummivore/Frugivore 1
Cercocebus atys Catarrhine 1 (1,0,0) 11000 Frugivore/Granivore 2
Cercocebus torquatus Catarrhine 1 (0,1,0) 6230 Frugivore/Granivore 2
Cercopithecus
campbelli
Catarrhine 1 (0,1,0) 2699 Frugivore/Insectivore 1
Cercopithecus cephus Catarrhine 1 (1,0,0) 4289 Frugivore 1
Cercopithecus hamlyni Catarrhine 1 (0,1,0) 3360 Omnivore/Generalist 2
Cercopithecus mona Catarrhine 1 (0,1,0) 5100 Frugivore 1
Cercopithecus
neglectus
Catarrhine 1 (1,0,0) 7350 Frugivore 1
Cercopithecus
petaurista
Catarrhine 1 (0,1,0) 2900 Frugivore/Folivore 2
Chlorocebus aethiops Catarrhine 2 (1,1,0) 3563 Omnivore/Generalist 2
Colobus guereza Catarrhine 1 (0,1,0) 9200 Folivore 2
Hylobates lar Catarrhine 1 (0,1,0) 5340 Frugivore 1
Macaca silenus Catarrhine 1 (1,0,0) 8900 Frugivore 1
Macaca sylvanus Catarrhine 2 (1,1,0) 13266.5 Omnivore/Generalist 2
Mandrillus sphynx Catarrhine 1 (0,1,0) 12900 Omnivore/Generalist 2
Mico argentatus Platyrrhine 1 (0,1,0) 360 Gummivore 1
Miopithecus talapoin Catarrhine 3 (3,0,0) 1380 Frugivore/Insectivore 1
Saguinus imperator Platyrrhine 1 (0,1,0) 475 Frugivore/Nectarivore 1

Deutsch: Scaling of Anatomically Derived Maximal Bite Force in Primates
27
Saguinus labiatus Platyrrhine 1 (0,1,0) 539 Frugivore 1
Saguinus oedipus Platyrrhine 1 (0,1,0) 404 Frugivore 1
Saimiri sciureus Platyrrhine 2 (1,1,0) 721.4 Frugivore/Insectivore 1
Sapajus apella Platyrrhine 3 (0,2,1) 2695.8 Frugivore/Granivore 2
aBody mass from species average for each sex listed in Fleagle (2013). The species average was
used for individuals of unknown sex.
bBased on Mittermeier et al. (2012).
TABLE 2. Craniometric Measurements used in geometric mean calculation from Hartstone-Rose
and colleagues (2017).
Mandible length from the posterior edge of the condyle to infradentale
Cranial length from prosthion to inion
Height of the mandibular corpus inferior to m2 protoconid
Maximum cranial height from inferior mandible to vertex
Maximum orbital height
Maximum bizygomatic breadth
Maximum cranial breadth posterior to the zygomatic arches
Postorbital constriction (minimum cranial breadth posterior to the orbits)
Biorbital width (maximum width measured on the lateral margins of the orbital walls)
TABLE 3. Descriptive statistics for RMA regressions of BF variables against BM, cranial GM
and JL across the whole sample and by dietary category and suborder. As described in the
methods, all slopes are expected to be 1. Significance is assessed at an alpha <0.05 and values
that approach significance (~) are noted solely for discussion purposes.

Deutsch: Scaling of Anatomically Derived Maximal Bite Force in Primates
28
Body Size Proxy Y-variable
Sample Y-intercept
Slope (β)^b
Lower β CL
Upper β CL r
Log Incisor BF^1/2
Log Body Mass (g) ^ 1/3
All Primates -0.53 1.01 0.81 1.25 0.91 Soft Diet -0.4 0.87 0.6 1.24 0.89
Obdurate Diet -0.48 0.99 0.52 1.87 0.85 Catarrhines -0.98 1.36 0.79 2.32 0.77 Platyrrhines -0.59 1.1 0.47 2.59 0.86
Log Cranial Geometric
Mean
All Primates -0.07 1.14 0.92 1.42 0.91 Soft Diet -0.01 0.99 0.68 1.44 0.88
Obdurate Diet -0.04 1.14 0.59 2.22 0.84 Catarrhines -0.33 1.51~ 0.94~ 2.42 0.81 Platyrrhines -0.01 1.06 0.16 6.83 0.77
Log Jaw Length (mm)
All Primates -0.09 0.95 0.78 1.16 0.92 Soft Diet -0.06 0.89 0.64 1.23 0.91
Obdurate Diet 0.07 0.79 0.3 2.12 0.76 Catarrhines -0.16 1.02 0.63 1.66 0.8 Platyrrhines -0.21 1.22 0.56 2.68 0.87
Log Canine BF^1/2
Log Body Mass (g) ^ 1/3
All Primates -0.51 1.01 0.83 2.15 0.8 Soft Diet -0.41 0.9 0.65 1.26 0.9
Obdurate Diet -0.51 1.03 0.56 1.88 0.86 Catarrhines -0.93 1.33 0.83 2.15 0.8 Platyrrhines -0.5 1.02 0.44 2.39 0.86
Log Cranial Geometric
Mean
All Primates -0.05 1.14~ 0.94~ 1.4 0.92 Soft Diet 0 1.03 0.73 1.46 0.89
Obdurate Diet -0.06 1.18 0.62 2.27 0.84 Catarrhines -0.28 1.48~ 0.98~ 2.23 0.84 Platyrrhines 0.04 0.98 0.09 10.38 0.76
Log Jaw Length (mm)
All Primates -0.06 0.95 0.79 1.14 0.93 Soft Diet -0.06 0.93 0.7 1.23 0.92
Obdurate Diet 0.06 0.82 0.35 1.96 0.79 Catarrhines -0.11 1 0.65 1.54 0.83 Platyrrhines -0.15 1.14 0.5 2.59 0.86
Log Protoconid BF^1/2
Log Body Mass (g) ^ 1/3
All Primates -0.37 0.94 0.77 1.15 0.92 Soft Diet -0.25 0.82 0.58 1.15 0.89
Obdurate Diet -0.38 0.97 0.55 1.71 0.87 Catarrhines -0.82 1.29 0.79 2.11 0.8

Deutsch: Scaling of Anatomically Derived Maximal Bite Force in Primates
29
Platyrrhines -0.38 0.98 0.47 2.03 0.88
Log Cranial Geometric
Mean
All Primates 0.06 1.07 0.88 1.31 0.92 Soft Diet 0.12 0.93 0.66 1.32 0.89
Obdurate Diet 0.05 1.12 0.65 1.93 0.88 Catarrhines -0.19 1.43~ 0.97~ 2.12 0.85 Platyrrhines 0.14 0.94 0.22 4.08 0.79
Log Jaw Length (mm)
All Primates 0.05 0.89 0.74 1.06 0.94 Soft Diet 0.07 0.84 0.63 1.11 0.93
Obdurate Diet 0.16 0.78 0.37 1.65 0.82 Catarrhines -0.03 0.97 0.65 1.45 0.84 Platyrrhines -0.04 1.08 0.53 2.21 0.88
TABLE 4. Descriptive statistics for one-way analyses of residuals of BF variables grouped by
dietary score. P-values annotated by “~” approach significance. Significance is defined as an
alpha of 0.05.

Deutsch: Scaling of Anatomically Derived Maximal Bite Force in Primates
30
Architecture Variable p-value Statistically higher dietary group
Body Mass (BM)
Incisor Bite Force ^1/2 0.1599~ ~Obdurate
Canine Bite Force ^1/2 0.2788
Paracone Bite Force ^1/2 0.1853~ ~Obdurate
Cranial Geometric Mean (GM)
Incisor Bite Force ^1/2 0.1970~ ~Obdurate
Canine Bite Force ^1/2 0.3369
Paracone Bite Force ^1/2 0.2124
Mandible Length (JL)
Incisor Bite Force ^1/2 0.3667
Canine Bite Force ^1/2 0.5866
Paracone Bite Force ^1/2 0.3869