
ScaleupEurope Jun2017 ultracompressed · If we compare the capital raised by scaleups to the GDP,...
28
SEP MONITOR JUNE 2017 Scaleup Europe
Transcript of ScaleupEurope Jun2017 ultracompressed · If we compare the capital raised by scaleups to the GDP,...

SEP MONITORJUNE 2017
Scaleup Europe

About Startup Europe Partnership (SEP)
Established by the European Commission in January 2014 at the World Economic Forum in Davos, SEP is the first pan-European open innovation platform dedicated to transforming European startups into scaleups by linking them with global corporations.
By participating in the SEP program, global companies can ease the scale up process via business partnerships and strategic and venture corporate investments, providing them with access to the best technologies and talents through procurement of services or products, corporate acquisition or “acqui-hiring”.SEP is led by Mind the Bridge Foundation, a global organization based in Europe and United States, with the support of Nesta (the UK’s innovation foundation).
SEP is a Startup Europe initiative. Partners include Telefónica, Orange, BBVA (Founding), and Telecom Italia, SKY, Unipol Group, Microsoft, Acciona and Enel (SEP Corporate Member), with the institutional support of the European Investment Fund/ European Investment Bank Group, London Stock Exchange Group, EBAN, Cambridge University, IE Business School and Alexander von Humboldt Institute for Internet and Society.
For more info:
http://startupeuropepartnership.eu | @sep_eu
SEP MONITORJUNE 2017
Scaleup Europe

4200SCALEUPS
1 SCALEUP
100K PEOPLEevery 0.33%
of EU GDP
$58BCAPITAL RAISED
E-COMMERCE
FINANCE
HOSPITALITY
Top Sectors$11.8BNEW CAPITAL RAISED
700NEW SCALEUPS
2016
86 SCALERS
$25B CAPITAL RAISED
$7.1B
$6.5B
$4.5B
SCALEUP EUROPE
1,550$21.5B
1,150$18.1B
620$9.4B
430$4.2B
300$3.6B
120$0.7B
30$0.2B
30$0.2B

Welcome to Scaleup Europe!
Europe is home to approximately 4,200 fast growing, high-tech companies that we refer to as “scaleups”. This distinction serves to separate this group from startups, i.e. to draw a line between early stage initiatives and real companies that are producing revenue and employment. If the count is restricted to only countries who are current members of the European Union, the number of scaleups goes down to 3,950 and the capital raised to $56B.
Our research confirms the absolute leading position of UK (34% scaleups come from the UK). This increases the concerns about the potential impact of Brexit on Scaleup Europe.Everything happens for a reason. 0.71% of GDP has been invested in ICT scaleups in the UK and 0.64% in the Nordics, versus only 0.29% in the Central States and Benelux and 0.12% in Southern Europe.Scaleup Europe is still far too venture capital driven. Only 2% of the European Scaleups go public and approximately 15% of the overall amount raised in Europe has been collected through IPOs (slightly less than half of which were completed in the U.S.). And it is not a coincidence that the top performing country in terms of scaleups (UK) has the highest percentage (19%) in terms of capital raised on the stock markets. Germany and France are below average.
Looking at the big scaleups (what we define as scalers those who have raised over $100M), we identified 86. They raised cumulatively $25B, 43% of the overall capital. Only 14 countries have been able thus far to produce scalers. More than a third are from (surprise) the UK. This is about 2 times more than Germany (15) and three times more than France (11). 4 scalers crossed the $1 billion bar in funding: Markit (UK), Delivery Hero and Zalando (Germany) and Spotify (Sweden). It’s worth noting that Germany has been able to produce two of these giants. Still, when compared with the rest of the world, Scaleup Europe has a long way to go in producing the new giants. Of the 53 of these worldwide, Europe, with 4, ranks third, still far behind China (16) and the U.S. (25).
Scaleup Europe is relatively young and therefore there is a lot of potential for growth. Our data shows a remarkable increase in the number of scaleups in recent years. On average, about 67% of scaleups were established after 2010. Of these, 76% have been founded after 2013. Specifically, 2016 has been a turning point for Scaleup Europe. $12B in new capital has poured into European scaleups. That is approximately 20% of the total funding collected by scaleups in the 2010-2016 timeframe.E-commerce, Fintech and Hospitality are driving the growth of scaleups in the European ecosystem. Fintech - no surprise - attracts the most investment in UK. Brexit could hurt this European specialization a lot. Gaming - even less of a surprise - is the leading vertical in the Nordics, while in Germany E-commerce and in Southern Europe Fashion and Mobile drive the growth.
We hope that the data included in this report can help provide useful insights for governments, and assist them in creating better policies, and for corporate executives who are developing effective innovation strategies.
More studies with in-depth country analysis will follow. We have just released a report on Portugal1, more to come. Stay tuned!
by Alberto Onetti
Alberto OnettiChairman, Mind the BridgeCoordinator, Startup Europe Partnership
1 - See SEP Monitor, Scaleup Portugal, Mind the Bridge, June 2017.

Editor Note
The current analysis is based on analytical in-depth research for 12 countries
(Denmark, Finland, France, Germany, Iceland, Italy, Norway, Poland, Portugal, Spain,
Sweden, and the UK) that represent approximately 80% of Europe’s GDP. The data
for the other remaining 33 countries has been estimated based on an exploratory
analysis of multiple data sources and assumptions.
Data are updated as of December 31st, 2016.
The current analysis is limited to ICT companies. Other key areas in the startup
ecosystem, such as biotech/life science, hard-tech and cleantech, are currently
under investigation and are not included.
SEP refers to “scaleup” as of startups that raised over $1 million (see Methodology
for further details). This criterion may fail to consider startups that are scaling-up in a
sustainable way (such as bootstrapped companies that grow organically and
generate revenue and employment), although it includes startups that raised
enormous seed investment while still in the “search phase”. Although the data fail to
represent the complete scaleup landscape, we chose this methodology because it is
the only one that allows an up-to-date “who’s who” of scaling-up in the various
startup ecosystems. Furthermore, it is often not possible to report revenue and
employment data (the real key variables to assess growth of a startup) as most cases
are private companies, and many countries are simply not accessible in a timely
manner.
SEP sources include public data (e.g. press articles, blogs), and direct information
collected by investors and companies. The accuracy of our dataset is limited to the
available information and disclosed data.

Europe is home to approximately4,200 fast growing, high-tech companies

Scaleup Europe. Indeed.
In Europe we have tracked 4,200 ICT scaleups in 45 countries. They
collectively raised about $58B in funding2, equal to 0.33% of Europe’s GDP.
By region, the British Isles (U.K. and Ireland) top the charts with approximately 1,550
scaleups, which have collectively raised about $21.5B in funding. In other words,
37% of the European scaleup ecosystem is across the Channel.
The “Central States” (Germany and France, plus Austria, Switzerland and
Liechtenstein) account for about 1,150 scaleups (28% of the total), these scaleups
have raised $18.1B. Adding the Benelux (with approximately 300 scaleups able to
raise $3.6B) to the Central States almost closes the gap with the UK, this shows the
dominance of the UK in scaleup Europe.
This gap grows when factoring in the GDP. The overall GDP of the Central States and
Benelux is 2.6 times more than the UK and Ireland. If we compare the capital
raised by scaleups to the GDP, 0.71% of the GDP have been invested in ICT
scaleups in the UK, versus 0.29% in the Central States and Benelux.
The Nordics are the third region in Scaleup Europe. The Scandinavian countries
account for approximately 620 scaleups (15% of the total) and $9.4B in capital raised.
This equals to 0.64% of the GDP in the region invested3.
Southern Europe still lags behind in the scaleup game. The Southern countries (Spain,
Portugal, Italy, Greece, Malta and Cyprus) collectively account for only 430 companies
and $4.2B in funding, which is slightly better than the Benelux region.
This accounts for 0.12% of GDP, about one third of the European average showing
the severity of their under performance.
Scaleups from Eastern Countries (not including Russia, Baltics and Caucasus) form
an emerging group of 120 companies (3% of the total) that have been able to attract
about $0.7B in funding (0.07% of GDP).
Another emerging area is the Baltics (including Estonia, Latvia, Lithuania) with a total
of about 30 scaleups that raised $0.2B (0.26% of GDP).
2 - The SEP database currently fully covers the European scaleup scene in 12 countries that represent approximately 80% of Europe’s GDP. For those 12 countries, we tracked a total 3,444 ICT scaleups who were able to collectively raise $50.8 billion in funding either from VC or via IPO. The data for the other remaining 33 countries has been estimated based on an exploratory analysis of multiple data sources and assumptions.
3 - The figure is quite distorted by the presence of Spotify, the largest European unicorn (about $2.1B in capital raised). Without Spotify, percentage of GDP invested drops to 0.50%, still above the European average.
How Much Brexit Will Impact Scaleup Europe?
If we restrict the analysis to the European Union (current 28 countries), the number of
scaleups goes down to 3,950 and the capital raised to $55.6B.
Without the UK, in a potential post-Brexit situation, the number of European
scaleups shrinks to 2,540 and capital raised to $35.4B. All told, Brexit will
reduce Scaleup Europe by 36%.
1
Brexit might reduceScaleup Europe
by 36%.

Scaleup Europe by Regions
EU 28
3,95
0$5
5.6B
$16,
350B
EU POST-BREXIT
2,53
8$3
5.4B
$13,
500B
36%decrease
BRITISH ISLES
1,55
0$2
1.5B
$3,1
30B
CENTER STATES
$18.
1B
$6,8
50B
1,15
0
2.3
0.7
4200 SCALEUPS
$58B
0.33%
CAPITAL RAISED
of GDPINVESTED IN ICT SCALEUPS
0.9 SCALEUPSEVERY 100K PEOPLE

NORDICS
BALTICS
EASTERN EU
CENTRAL STATES
SOUTHERN EU
BENELUX
BRITISH ISLES
NORDICS
$9.4
B
$ 1,4
70B
620
SOUTHERN EU
$4.2
B
$ 3,4
25B
430
BENELUX
$3.6
B
$1,2
60B
300
EASTERN EU
$0.7
B
$935
B
120
BALTICS
$90B
$0.2
B
30
2.4
0.4
1.0
0.1
0.5

UK Leads, Germany and France Follow
Scaleup Europe: Top 20 Ecosystems
PORTU
GAL 67$0.4B
UK
GERMANY
FRANCE
SWEDEN
SPAIN
NETHER
LANDS*
DENMARK
IRELAND*
FINLA
ND
SWITZER
LAND*
ITALY
LUXE
MBOURG*
NORWAY
BELGIUM*
ICELAND
ESTO
NIA*
LITHUANIA*
1412
442
513
279
207
178
110
135
150
153
135
22
68
93
16
15
5
AUSTRIA* 38
$20.2B
$10.1B
$6.6B
$5.3B
$2.8B
$2.2B
$1.7B
$1.5B
$1.4B
$1.3B
$0.9B
$0.8B
$0.8B
$0.6B
POLA
ND 46$0.4B
$0.2B
$0.2B
$0.1B
$0.1B
* Estimated values** Includes only countries with $0.1B+ in capital raised
As expected, the UK is the scaleup capital of Europe: 1,412 scaleups (34% of total)
come from the UK. They secured $20.2B in funding which amounts to 35% of
the total capital made available to scaleups in Europe.
Germany comes in at a distant second with 442 scaleups (11% of the total) that raised
$10.1B (17%). In terms of the number of scaleups, Germany is slightly less than one
third of UK with approximately half of the capital raised.
France has a larger number of 513 scaleups (12%, about 1.2 times more than
Germany), but a lower amount of capital raised ($6.6M, 11% of the total funding).
4
The UK is the scaleupcapital of Europe,
with 1,412 scaleups.

Sweden ranks number four with 279 scaleups (7% of total) able to raise $5.3B (9%).
To be noted that, out of the $5.3B, $2.1B come from Spotify only. If we exclude the
amount collected by Spotify, Sweden’s figures are closer to Spain, who immediately
follows it ($2.8B raised by 207 scaleups).
The Netherlands lead the Benelux pack with 178 scaleups (4%). Driven by the giant
Adyen, they collectively raised $2.2B (slightly less than 4%).
A group of five countries follow with a number of scaleups in the 100-150 range (2-3%
of the total). It includes Denmark ($1.7B in capital raised), Ireland ($1.5B), Finland
($1.4), Switzerland ($1.3B), and Italy ($1B).
Belgium (93 scaleups, $0.6B) and Norway (67 scaleups, $0.8B) precede a group of
emerging ecosystems - including Portugal (68 scaleups, $0.4B), Poland (46 scaleups,
$0.4B), Austria (38 scaleups, $0.2B), Luxembourg (22 scaleups but $0.8B raised)
and, further off, Estonia and Lithuania - both of whom are showing a thriving attitude.
All the other European countries that have not been included in the chart are still below
the $0.1B bar in capital raised. There’s still a lot of work in progress in many areas of
Scaleup Europe.
Number of Scaleups vs Capital Raised
Is it better to have ecosystems with a large number of scaleups or a large
amount of capital raised?
The obvious answer is: ecosystems with many scaleups are able to leverage big
investments. Unfortunately, it doesn’t happen everywhere.
0.6
0.4
0.2
0.0 0.330.1 0.2
3.0
1.50
1.0
2.0
0.50 1.00
3.7
5.3
CAPITAL RAISED/GDP (%)
NU
MB
ER
OF
SC
AL
EU
PS
/PO
PU
LA
TIO
N (
10
0K
)
5
Scaleup Europe: Number of Scaleups vs Capital Raised
Sweden ranksfourth in capitalraised, powered
by Spotify.
The matrix visualizes the data discussed in the prior paragraphs. Specifically, it
compares ecosystems by considering:
the number of scaleups measured with reference to the population (number of
scaleup per 100k inhabitants);
the amount of capital raised by scaleups compared to the respective national GDP.
The European average (0.9 scaleups per 100k inhabitants and 0.32% of capital raised
versus GDP) is at the origin. The Netherlands, France and Germany are positioned
quite close to the center meaning that they are closest to the average for the fields
mentioned (France and the Netherlands a bit better than average, Germany slightly
below).
In the top right quadrant we find ecosystems characterized by many scaleups and a
large amount of financing (both above the European average). UK and Sweden not
surprisingly are positioned in this quadrant, Luxembourg and Iceland join them, and
occupy spots even higher and the right. Despite their small size, both countries
relatively outperform all the other European countries. Finland, Denmark, Ireland, and
Estonia are also present in this quadrant. Not surprisingly, these are all, except for
Luxembourg, Northern countries.
In the top left we find countries such as Switzerland and Norway with a number of
scaleups above the average, but amounts capital raised lower than average. This top
left quadrant represent a more diluted market for the amount of capital available.
The lower left sector is occupied by countries who under perform both in percentage
of GDP invested, and number of scaleups per capita. Portugal and Belgium match the
European average in terms of number of scaleups, but still underperform as capital
raised. Spain shows lower than average results for both indicator. Poland and Italy are
positioned in the low left hand corner, while Austria is just a bit better in terms of
number of scaleups, but still underperforming in terms of capital raised.
4 - Approximately $7.5B in the 12 countries we analyzed in depth.
Scaleups and stock markets are not (yet) a good fit in Europe. Only 2% of the
European scaleups go public and approximately 15% of the overall amount raised in
Europe has been collected through IPOs4.
To be noted that 45% of the IPOs over $100M are completed in the U.S.. The
most effective IPOs occur outside of Europe: the scalups that decide to go public in
the U.S. raise about 6 times more capital than the ones that IPO in Europe.
It is not a coincidence that the top performing country in terms of scaleups
(UK) has the highest percentage (19%) in terms of capital raised on the stock
markets. Germany and France are below average (10% of capital raised via IPO).
6
The Elephant in the Room: the Stock Markets
Only 2% of Europeanscaleups go public.

2% of total scaleups
15% of total capital raised
45%of $100M+ IPOs in the U.S.
EU IPOs
Scaleup Europe is still far too venture capital driven.
This poses a problem, because IPOs, beyond simply providing growth capital, offer
exit opportunities to the VC funds. Without exits, the venture capital engine risks
being flooded.
The European Scalers
In this section, consistent with our methodology, rather than looking for Unicorns (i.e.
companies with more than one billion dollar valuation), we analyzed the “Scalers”, i.e.
scaleups able to raise over $100M. Quantity over valuation.
We identified 86 scalers in Europe. They represent 2% of the European scale-
ups and raised cumulatively $25B, 43% of the overall capital raised.
Only 14 countries have been able thus far to produce scalers. 29 (34%) are from UK6.
This is double the number in Germany (15), which is then followed by France (11)5.
Sweden comes in fourth place with 7 scalers, directly followed by Spain (6 scalers)
and Denmark (5).
In Luxembourg, scalers accounted for the largest percentage of capital raised by
scaleups (71%), followed by Sweden (62%), Germany (55%), Denmark (50%), and
Spain (47%).
4 scalers raised more than $1 billion in funding: Markit (UK), Delivery Hero and Zalando
(Germany) and Spotify (Sweden).
Those 4 “super scalers” managed to raise $6B cumulatively, representing the
12% of the total funding secured by the European scaleups.
Germany - and specifically Rocket Internet - has been able to produce two of these
giants.
Still, when compared with the rest of the world, Scaleup Europe has a long way to go
in producing $1B giants.
Of the 53 of these worldwide, Europe, with 4, ranks third, tied with India, behind China
(16) and the U.S. (25) where most are concentrated.
7
5 - In the first months of 2017, two French scaleups have turned into scalers: Actility and Vestiaire Collective.6 - Consistently with SEP methodology, Powa (as all the scaleups that have run out of business) is not included in the scaleup count, but the capital raised is still factored.
We identified 86scalers that raised$23B in funding.

UK ICELAND
SPAIN
ITALYFRANCE
DENMARK
*
*
*
*
*
*
*
*
*
IRELAND
** Italian-French company
The European Scalers

NORWAY SWEDEN GERMANY
FINLAND
* acquired or merged
*
*
*
*
*
LUXEMBOURG
NETHERLANDS
SWITZERLAND
UK
29$8.5B
GERMANY
15$5.6B
FRANCE
11$2.5B
SWEDEN
7$3.3B
SPAIN
6$1.4B
DENMARK
5$0.9B
FINLAND
2$0.3B
ICELAND
1$0.1B
ITALY
1$0.2B
NORWAY
1$0.1B
NETHERLANDS
3$0.9B
IRELAND
1$0.4B
LUXEMBOURG
1$0.6B
SWITZERLAND
3$0.3B
86 SCALERS
$25BCAPITAL RAISED

IHS MARKIT
Markit, founded in the early 2000s in London, is the first independent source of credit derivative pricing.
The company’s client base includes institutional participants in the financial marketplace such as investment banks, hedge funds, asset managers, rating agencies, insurance companies and central banks to which Markit provides independent data, trade processing of derivatives, foreign exchange and loans, customised technology platforms and services. In 2016, HIS Inc., a London-based company, which provides data analysis for energy and automotive companies, agreed to acquire 57% of Markit, a stake valued at about $5.5B.
Prior to the acquisition, Markit had shown sustainable growth over a long period, in 2010 it raised $0.3B in VC financing from General Atlantic. General Atlantic’s investment supported Markit’s strategic growth through acquisitions and internal expansion; it also provided knowledge about the financial services industry.
The company went through an IPO in 2014, securing a further $1.3B. It debuted on the NASDAQ under the symbol “MRKT”.
HQ: London (GBR)
Capital Raised: $1.5B
SPOTIFY
HQ: Stockholm (SWE)
Capital Raised: $2.1B
With 100 million users, the music streaming company was launched in 2008, in Stockholm,
and today it is the leading provider of music, podcast and video streaming service.
The company’s first round of financing, rumoured to amount around $20 million, was secured when
the service was still in private beta. With another round later, in 2010, the company managed to raise
further $90 million, to pay off the record labels. Spotify finalized a huge funding round of about $100 million
from DST, Kleiner Perkins and Accel in 2011; valuing the company at about $1B and in the spring of the same
year, Spotify announced 1,000,000 paid subscribers as well as its launch in the United States. In 2012, Spotify
held another round that included Coca-Cola as a minor investor, with Goldman Sachs leading, as well as Fidelity
Investments as a newcomer. The round brought $100 million to Spotify’s pockets valuing it about $3B. At the end
of 2013, Spotify revealed that 24 million active users streamed over 4.5 billion hours of music that year, and it also managed
to raise a further $250 million in VC financing from Silicon Valley firm Technology Crossover Ventures. When Apple
launched its streaming music service, Spotify responded by raising another $526 million to brace for a costly battle with its
new competitor. In 2016, the on-demand streaming music sector was crawling with competition, so Spotify agreed to secure further
$1B in convertible debt from private equity firm TPG Capital and hedge fund Dragoneer Investment Group.
Founder:DANIEL EK
Founder:LANCE UGGLA

DELIVERY HERO
Delivery Hero was founded by Niklas Östberg in 2011 in Berlin, and ever since then it has begun its journey for being the global leader in online food ordering. One year after foundation, in 2012, Delivery Hero raised more than $100 million (either from domestic and UK-based investors) and acquired OnlinePizza Norden Group. At the end of 2013, the company raised $30 million from the Russian VC Phenomen Ventures. With this financing, it partnered with the Danish food delivery platform Hungry.dk and acquired the Indian TastyKhana.In 2014 Delivery Hero secured more than $0.5B from existing investors (Insight Venture Partners and Kite Ventures) as well as new ones, such as the Vostok Nafta VC fund. The funds were invested with the goal of further fueling international growth. In 2015 the company raised a further $0.7B from investors, including German Rocket Internet, and the US-based Insight Venture Partners, General Atlantic, as well as several US-based public fund managers. At the time, the company was able to provide ordering capability for about 100,000 restaurants in 24 countries and it generated more than a billion euros in annual sales while delivering more than 12 million meals every month. On December 2016, Delivery Hero acquired one of its major competitors: Foodpanda.
HQ: Berlin (GER)
Capital Raised: $1.4B
ZALANDO
HQ: Berlin (GER)
Capital Raised: $1.2B
Zalando started out in 2008 as a clone of the US-based e-commerce retailer
Zappos. The company, with headquarters in Berlin, had a simple idea: to provide a
simple way for buying shoes online. However, shortly after foundation, Zalando
included clothing and other fashion items in its offering. Over the years, the company has
grown rapidly, raising capital from early-stage investors, such as Holtzbrinck Ventures, Rocket
Internet and Tengelmann, as well as from other later-stage investors, including DST, JP Morgan,
Kinnevik, Ontario Teacher’s Pension Plan and Putnam Investments.
Raising funds was quite effortless for Zalando. By the end of 2012, the total financing secured
exceeded $0.3 billion, enabling the company to focus on developing its business and plan future
growth with Germany, Austria and Switzerland being its more mature markets (though it also has a
presence in other European countries). One year later, Zalando collected further $0.2B from Canadian and
US-based investors and at that time it was active in 15 European countries. After persistent rumors about a
forthcoming IPO, in October 2014, Zalando went public. The online retailer was listed on the Frankfurt stock
exchange and it managed to raise slightly less than $0.7B with a company evaluation of $6.7B.
Founder:ROBERT GENTZ
Founder:NIKLAS ÖSTBERG

Scaleup Migration?
A large percentage (14%) of European scaleups and even larger percentage
of scalers (24%) have moved their headquarters abroad (specifically in the
US) since inception, while maintaining a strong operational presence (such as R&D
activities) in their home country.
They are referred as “Dual Companies”. We analyze this scaleup relocation
phenomena in a dedicated report7.
EUROPEAN DUAL COMPANIESSCALEUP MIGRATION?
with the support of:
14% of total scaleups
24% of total scalers
30% more capital
Dual Companiesraise on average
than domestic scaleups
European Dual Companies
Europe: a Scaleup Every 100K People
If we look at the number of scaleups per inhabitant, we record – on average –
almost one (0.9) scaleup every 100,000 inhabitants.
The colder climates of Europe seem to be the scaleup habitat of choice. The Nordic
countries produce on average 2.4 scaleups for every 100K people, with countries
from this region topping the charts, such as Iceland (5.3), Sweden (2.9) and Finland
(2.8). The U.K. continues to prove to be a driving force for innovation and scaleups,
with 2.2 scaleups per 100K inhabitants having been established in the UK. This is
about three times more than France and Germany (0.7) and just under 6 times higher
than the average of Southern Europe (0.4).
Eastern countries such as Poland show still lower figures (about 0.1 scaleups per
100K inhabitants).
0.9 SCALEUPS
100K PEOPLEevery
BRITISH ISLES
NORDICS
SOUTHERN EU
BENELUX
EASTERN EU
BALTICS
CENTER STATES
Scaleups per Population
2.3
2.4
0.7
0.4
1.0
0.1
0.5
127 - European Dual Companies. Scaleup Migration?, Mind the Bridge, June 2017.
In Europe, there isabout 1 scaleup every
100K inhabitants.

Europe: a Relatively Young and Growing Scaleup Ecosystem
Scaleup Europe is relatively young. Our data shows a remarkable increase in the
number of scaleups over the years.
On average, about 67% of scaleups were established after 2010. Of these,
76% have been founded after 2013 (that is slightly less than a third of the total
amount). The UK is the most mature ecosystem, where about 40% of scaleups have
been founded before 2010 and “only” about 30% after 2013.
On the opposite side of this trend, ecosystems like Portugal (approximately 80% of
scaleups founded after 2010) and Italy (76%) show a more recent growth.
SPAIN
DENMARK
ICELAND
GERMANY
NORWAY
FRANCE
SWEDEN
ITALY
PORTU
GAL
FINLA
ND
POLA
NDUK
EU AV
ERAGE
35%
31%
34%
38%
29%
33%
29%
37%
34%
39%
24%
37%
28%
28%
44%
24%
31%
45%
20%
36%
44%
29%
40%
31%
31%
29%
30%
53%
24%
23%
33%
41%
26%
35%
37%
28%
36%
36%
28%
BEFORE 2010 2010-2013 2013 AND AFTER
European Scaleups: Year of Establishment
It is also worth noting the growing pattern of funding in Europe, as we observe that
there are more and more scaleups getting funded in the recent years.
33%
25%
16%
10%
7%
5%
4%
2016
2015
2014
2013
2012
2011
2010
European Scaleups: Year of Last Funding Event
13
2016, the Turning Point?
In 2016, Europeanscaleups raised $11.8B
in new funding.
Further evidence of the growing pattern for the European scaleup scene is
represented by the number of scaleups that got funded in the past few years.
In this respect, we clearly see a growing trend since 2010 and a steep acceleration
after 2013.
In 2016, 33% of European scaleups completed their most recent funding
event (it was 25% in 2015 and 16% in 2014).
10% 15% 20% 25% 30% 40%35%
15%
20%
25%
30%
35%
40%
% OF NEW SCALEUPS
% O
F N
EW
CA
PIT
AL
RA
ISE
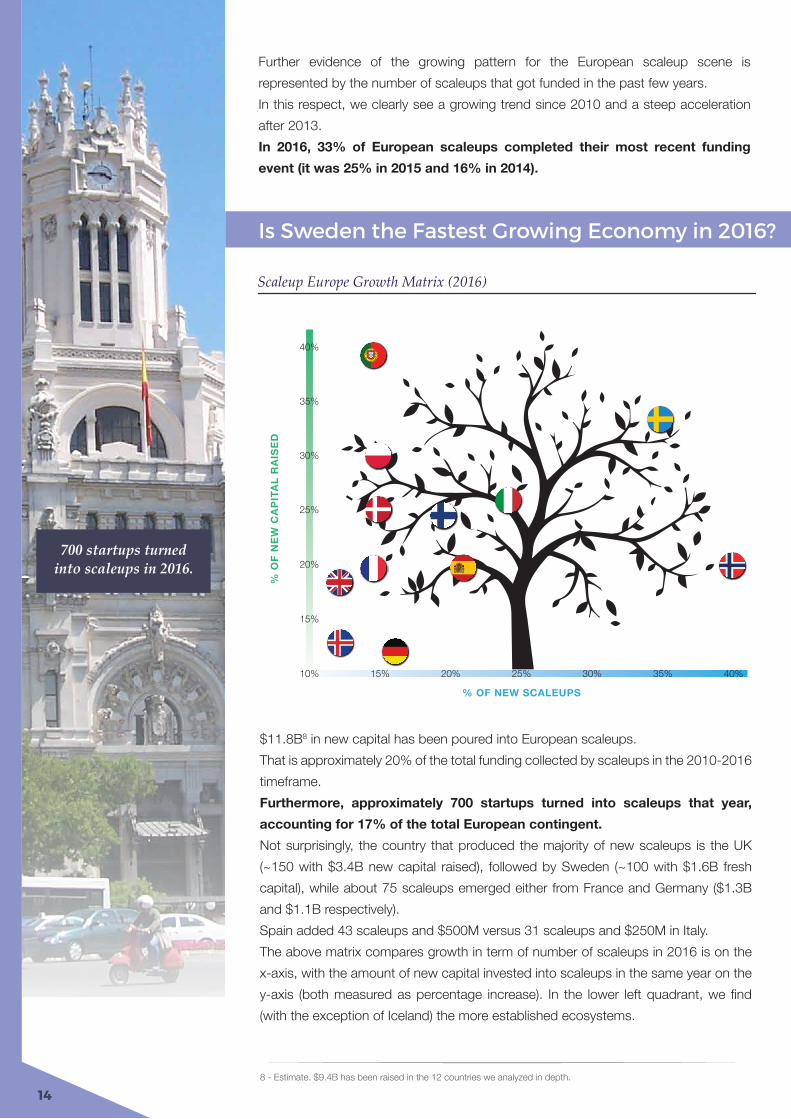
DScaleup Europe Growth Matrix (2016)
$11.8B8 in new capital has been poured into European scaleups.
That is approximately 20% of the total funding collected by scaleups in the 2010-2016
timeframe.
Furthermore, approximately 700 startups turned into scaleups that year,
accounting for 17% of the total European contingent.
Not surprisingly, the country that produced the majority of new scaleups is the UK
(~150 with $3.4B new capital raised), followed by Sweden (~100 with $1.6B fresh
capital), while about 75 scaleups emerged either from France and Germany ($1.3B
and $1.1B respectively).
Spain added 43 scaleups and $500M versus 31 scaleups and $250M in Italy.
The above matrix compares growth in term of number of scaleups in 2016 is on the
x-axis, with the amount of new capital invested into scaleups in the same year on the
y-axis (both measured as percentage increase). In the lower left quadrant, we find
(with the exception of Iceland) the more established ecosystems.
148 - Estimate. $9.4B has been raised in the 12 countries we analyzed in depth.
Is Sweden the Fastest Growing Economy in 2016?
700 startups turnedinto scaleups in 2016.

The UK has added more capital (17%) than scaleups (11%) percentage wise, while
Germany has shown an opposite trend (respectively, 11% and 16%).
The situation in France has been remarkable in that it has shown a 20% increase in
venture capital investments, thus confirming the strong acceleration of investments in
the French startup scene in 2016. The situation of Spain is similar, it too has shown a
20% increase both in terms of capital raised and number of scaleups.
Sweden is the only country positioned in the top right quadrant showing a 30%
increase in both new capital raised and scaleups. These figures are remarkable given
the already strong position of the Scandinavian country in the scaleup ranking (num-
ber 4). Other Nordic countries show a very positive performance in 2016 as well.
Finland and Denmark increased investments in scaleups by 25% (while number of
scaleups increased less than proportionally). In Norway the scaleup population
increased by 40% (accompanied by a 20% increase in capital raised).
The growth in Italy is promising (25% both in number of scaleups and capital raised),
though it is probably not enough to fill the gap with the larger neighbouring countries.
Poland and particularly Portugal, situated in the left hand of the matrix, have
shown good momentum, though the increase in capital raised has not yet been
accompanied by a growth in the number of scaleups.
E-COMMER
CE
FINANCE
HOSPITALIT
Y
DIGITAL M
EDIA
SOFTWARE
ENTE
RPRISE
$7.1
B
$ 6.5
B
$4.5
B
$ 4.1
B
$3.7
B
$ 3.1
B
335
322
188
153
462
230
E-Commerce and Fintech Drive the Growth
Top Sectors in Europe
E-Commerce, Finance and Hospitality drive the growth of the European ICT
scaleup ecosystems. 1 scaleup out of 5 in Europe operates in those sectors.
Collectively, they raised $18.1B which is almost one third of the total capital made
available to European scaleups.
Following are the Digital Media, Software Solutions and Enterprise Services sectors.
It is worth noting that the highest concentration of scaleups resides in the Software
sector, with more than 460 companies.
15
1 out of 5 Europeanscaleups operate in
E-Commerce, Financeand Hospitality.

22%
Finance
22%
E-Commerce
18%
Software Solutions
13%
Gaming
14%
Fashion
BRITISH ISLES
CENTRAL STATES
NORDICS
SOUTHERN EU
EASTERN EU
Scaleup Europe: Regional Specialties
We identified several “regional specialties” in Europe.
The British Isles stand out as the land of Finance, with 22% of capital raised
being collected by scaleups in that sector.
This should not come as a surprise, considering that, among their scaler population,
1 out 3 operates in Finance.
The Central States are clearly driven by E-Commerce scaleups (22% of capital raised).
Giants such as Zalando, Westwing, and Bestsecret.com are certainly responsible for
this result.
The Nordics maintain their status as the land of Gaming, as previously indicated
by SEP9, with new data confirming this trend, with 13% of total capital raised by
Nordic scaleups injected in Gaming companies.
In 2016, tech giants such as King.com, Supercell and their followers reaffirmed their
supremacy and consistently fostered ecosystem growth.
The Southern European countries are driven by Fashion scaleups (14% of capital
raised), with Mobile tech companies almost on par (13%) with them.
The Eastern European countries are net producers of good software indeed, with
companies operating in that sector attracting 18% of total capital.
16
Regional Specialties
UK stands out inFintech, while
the Nordics for Gaming.
9 - See: SEP Monitor, Northern Lights: ICT Scaleups in the Nordics, Mind the Bridge, June 2016.

European scaleups collectively raised about$58B in funding. This is 0.33% of Europe’s GDP.
18
Methodology
The SEP Monitor is based on the Startup Europe Partnership (SEP) mapping and
scouting database that focuses on scaleups.
SEP categorizes ICT companies as follows:
Startup:
<$1M funding raised (since foundation) and at least one funding event since 2010.
Scaleup:
>$1M funding raised (since foundation) and at least one funding event since 2010.
Scaler:
>$100M funding raised (since foundation) and at least one funding event since 2010.
Super Scaler:
>$1B funding raised (since foundation) and at least one funding event since 2010.
Only companies founded in the new Millennium have been considered.
SEP categorization is based on capital raised (including both capital raised through
VC and the stock market), not on valuation. This alternative methodology is the one
used by The Wall Street Journal and Dow Jones Venture Source that are tracking
venture-backed private companies valued at $1 billion or more (aka The Billion Dollar
Startup Club or Unicorn Club).
Other Definitions:
Exit:
Liquidity event that occurred since 2010.
M&A:
For companies that exited via M&A, the valuation is the amount that the company got
acquired for.
IPO:
For companies that went public, the exit valuation is that on the day of the IPO.
Dual Companies:
Startups founded in one country that relocated their headquarters – and with that part
of their value chain – abroad, while maintaining a strong operational presence in their
country of origin.
GDP and Population:
Data are from World Bank (last year available).
19
SEP Sources of information include the SEP database, business information
platforms, portfolios of VC companies, corporate venture units, business angels,
accelerators and active seed and early stage funds, crowdfunding platforms, tech
competitions and events, and other relevant channels.
Research is ongoing and results reported in the SEP Monitor are subject of
continuous update. SEP welcomes research from everyone in the European startup
ecosystem by providing data and indicating cases of scaleup companies and exits to
be monitored.
SEP Monitors are published by Mind the Bridge in collaboration with CrESIT.

Powered by

First published in Belgium by Mind the Bridge in June 2017

About Mind the Bridge:
Mind the Bridge is a global organization that provides innovation advisory services for corporates and startups.With HQs in San Francisco (CA) and offices in London, Italy and Spain, since 2007 we have been working as an international bridge at the intersection between Startups and Corporations.We scout, filter and work with 1,500+ startups a year. We support global corporations in their innovation quest driving open innovation initiatives that often translate in curated deals with startups (namely POCs, licensing, investments, and/or acquisitions).We publish curated reports on the status of the Startup Economy in different geographies, M&A and innovation market trends in various verticals.We enjoy strong partnerships with entities such as the London Stock Exchange and the European Commission, for whom we run the Startup Europe Partnership (SEP) open innovation platform.We are the organizer of the Startup Europe Comes to Silicon Valley (SEC2SV) mission and the European Innovation Day conference.
For more info:
http://mindthebridge.com | @mindthebridge


