Scale Effects on Conventional and Intercooled Turbofan ...
15
ISABE 2017-22659 1 ISABE 2017-22659 Scale Effects on Conventional and Intercooled Turbofan Engine Performance Andrew Rolt, Vishal Sethi, Florian Jacob, Joshua Sebastiampillai corresponding author email: [email protected] Cranfield University, Bedfordshire, MK43 0AL, UK Carlos Xisto, Tomas Grönstedt Chalmers University of Technology, Göteborg, Sweden Lorenzo Raffaelli Rolls-Royce plc, Derby, Derbyshire, DE24 8BJ, UK ABSTRACT New commercial aero engines for 2050 are expected to have lower specific thrusts for reduced noise and improved propulsive efficiency, but meeting the ACARE Flightpath 2050 fuel burn and emissions targets will also need radical design changes to improve core thermal efficiency. Intercooling, recuperation, inter-turbine combustion and added topping and bottoming cycles all have the potential to improve thermal efficiency. However, these new technologies tend to increase core specific power and reduce core mass flow, giving smaller and less efficient core components. Turbine cooling also gets more difficult as engine cores get smaller. The core-size-dependent performance penalties will become increasingly significant with the development of more aerodynamically efficient and lighter-weight aircraft having lower thrust requirements. In this study the effects of engine thrust and core size on performance are investigated for conventional and intercooled aero engine cycles. Large intercooled engines could have 3-4% SFC improvement relative to conventional cycle engines, while smaller engines may only realize half of this benefit. The study provides a foundation for investigations of more complex cycles in the EU Horizon 2020 ULTIMATE programme. Keywords: Horizon 2020; ULTIMATE; Flightpath 2050; Propulsion.
Transcript of Scale Effects on Conventional and Intercooled Turbofan ...
ISABE 2017-22659 1
ISABE 2017-22659
Scale Effects on Conventional and Intercooled Turbofan Engine Performance
Andrew Rolt, Vishal Sethi, Florian Jacob, Joshua Sebastiampillai
corresponding author email: [email protected]
Cranfield University, Bedfordshire, MK43 0AL, UK
Carlos Xisto, Tomas Grönstedt
Chalmers University of Technology,
Göteborg, Sweden
Lorenzo Raffaelli
Rolls-Royce plc,
Derby, Derbyshire, DE24 8BJ, UK
ABSTRACT
New commercial aero engines for 2050 are expected to have lower specific thrusts for reduced noise and
improved propulsive efficiency, but meeting the ACARE Flightpath 2050 fuel burn and emissions targets will
also need radical design changes to improve core thermal efficiency. Intercooling, recuperation, inter-turbine
combustion and added topping and bottoming cycles all have the potential to improve thermal efficiency.
However, these new technologies tend to increase core specific power and reduce core mass flow, giving
smaller and less efficient core components. Turbine cooling also gets more difficult as engine cores get smaller.
The core-size-dependent performance penalties will become increasingly significant with the development of
more aerodynamically efficient and lighter-weight aircraft having lower thrust requirements.
In this study the effects of engine thrust and core size on performance are investigated for conventional and
intercooled aero engine cycles. Large intercooled engines could have 3-4% SFC improvement relative to
conventional cycle engines, while smaller engines may only realize half of this benefit. The study provides a
foundation for investigations of more complex cycles in the EU Horizon 2020 ULTIMATE programme.
Keywords: Horizon 2020; ULTIMATE; Flightpath 2050; Propulsion.
e804426
Text Box
Aeronautical Journal, Volume 121, Issue 1242, August 2017 pp. 1162-1185 DOI:10.1017/aer.2017.38
e804426
Text Box
©2017 Cambridge University Press. This is the Author Accepted Manuscript. Please refer to any applicable publisher terms of use.
2 ISABE 2017-22659
NOMENCLATURE
ACARE Advisory Council for Aerospace Research in Europe
Booster An IP compressor driven in a fixed speed relationship to the fan
CCA Cooled cooling air
CCACA Cooled cooling air cooling air
CLEAN Component Validator for Environmentally Friendly Aero Engine
Core Those parts of the engine that generate power for propulsion
EPA Environmental Protection Agency
HP High Pressure
IATA International Air Transport Association
ICAO International Civil Aviation Organisation
IP Intermediate Pressure
ISA International Standard Atmosphere
LEMCOTEC Low Emissions Core Engine Technologies
LP Low Pressure
NEWAC New Aero-engine Core Concepts
NOx Oxides of nitrogen
Open Rotor A high-speed propulsor or propulsion system with one or two propeller blade rows
OPR Overall Pressure Ratio
Propulsion System All the components needed to provide thrust, integrated for the aircraft
Propulsor A fan, propeller, open rotor or other thrust producing device
SFC Specific Fuel Consumption
T3 HP compressor exit temperature
Tc HP cooling air temperature
Tcref Reference engine HP cooling air temperature
Tgref Reference engine gas relative inlet temperature for HP turbine first stage
Tgrel Gas relative inlet temperature for HP turbine first stage at design point
TET Turbine Entry Temperature
ULTIMATE Ultra Low Emissions Technology Innovations for Mid-century Aircraft Turbine Engines
VITAL Environmentally Friendly Aero Engine
W4 Combustor exit mass flow
W4ref Reference engine combustor exit mass flow
Wc HP cooling air mass flow
Wcref Reference engine HP cooling air mass flow
Symbols
δ Correction to HP compressor polytropic efficiency
λ HP compressor last stage blade height
1.0 INTRODUCTION
Long-range commercial aircraft in 2050 are expected to have geared-fan engines, while short-range aircraft,
cruising slightly slower, may use open rotors [1]. The high bypass ratio ducted fan engines could have variable-
pitch fan blades as an enabler to reduce specific thrust and increase propulsive efficiency. The open rotor
engines could have a pusher configuration with very efficient contra-rotating blades. Nevertheless, these
engines will not meet the ambitious ICAO, IATA, NASA, EPA and ACARE fuel burn targets for aero engines
without radical developments in engine cores to improve thermal efficiency. This is because further increases to
overall pressure ratio (OPR) and turbine entry temperature (TET), in the currently used open-circuit Brayton
cycle, give diminishing returns. Limiting combustor entry and exit temperatures will also limit NOx emissions.
The EU Horizon 2020 ULTIMATE programme [2, 3] investigates breakthrough technologies for aircraft
propulsion to meet ACARE ‘Flightpath 2050’ targets for CO2, noise and emissions [4]. It reviews the potential
benefits of combinations of intercooling, recuperation, inter-turbine combustion, and topping and bottoming
cycles. These technologies have the potential to give step-change improvements in core thermal efficiency.
However the technologies also tend to reduce core engine mass flow and core size, which can offset some of the
benefits by reducing component efficiencies.
A ROLT ET AL. ISABE 2017-22659 3
1.1 Aircraft and Propulsion Systems for 2050
Regarding airframes for 2050 entry into service, the ULTIMATE project includes studies of two advanced “tube
and wing” configured aircraft. These will provide thrust requirements for more detailed engine design studies
and facilitate holistic engine assessments over complete flight missions. The airframes are an intra-European
aircraft with twin open rotor powerplants, and an inter-continental aircraft with two turbofan engines. However,
the thrust requirements are not defined at the time of writing, so reference turbofan engine thrusts are taken from
the previous EU Framework 6 research programme NEWAC [5, 6]. Factors influencing the choice of propulsor
configuration include: initial cost, maintenance cost, weight, propulsive efficiency, nacelle drag, ease of
installation, noise and reverse thrust requirements.
Open rotor powerplants can have one or two propeller blade rows in either tractor or pusher configuration. The
second contra-rotating blade row straightens out the swirl from the first rotor, increasing overall efficiency.
This also enables quieter, lower tip-speed propellers to be used. Low noise is essential if open rotor powerplants
are to be adopted on future medium sized commercial aircraft. For these aircraft the pusher arrangement, with
engines mounted on pylons either side of the aft fuselage, is preferred. This installation minimizes cabin noise
provided the core exhaust is ducted around the rotor hubs, rather than impinging on the propeller blades in the
open air. A further advantage of the pusher arrangement is that the propulsor drive-shafts do not need to run
through the core of the engine and so do not compromise its design. Nevertheless the tractor arrangement may
be preferred for wing mounted engines on lower speed aircraft. In this case a reverse flow core arrangement,
like that of the Pratt & Whitney PT6 turboprop, should avoid compromising the turbomachinery design.
Contra-rotating open rotors offer significant fuel burn reductions from increased propulsive efficiency and
reduced nacelle drag, but they are less attractive for larger aircraft wanting higher cruise speeds for longer
flights. The current study does not model open rotor engine configurations, but it does consider the effects of
scaling down the thrust requirements for the turbofan to levels where the core mass flow would be appropriate
for an open rotor propulsion system.
Reverse thrust is a requirement for most commercial aircraft, because it provides an effective means of stopping
them on icy runways. Turboprops and open rotor engines with variable-pitch blades can provide reverse thrust
at relatively little cost or weight penalty, but conventional thrust reverser designs for large turbofan engines
come with significant penalties. They add cost, weight and drag, and are a disincentive to the development of
engines with larger fans for increased propulsive efficiency. In this study it is assumed the turbofan engines all
have variable-pitch fans with capability to provide reverse thrust if needed. All the engines are modelled with
the same low cruise specific thrust that ULTIMATE industry partners considered likely to be feasible by 2050.
Ground clearance is a possible restriction on fan diameter for under-wing mounted engines, but no constraint is
applied in the current study because the thrust requirements for the 2050 long-range aircraft should be
significantly reduced by airframe and engine weight savings and efficiency improvements.
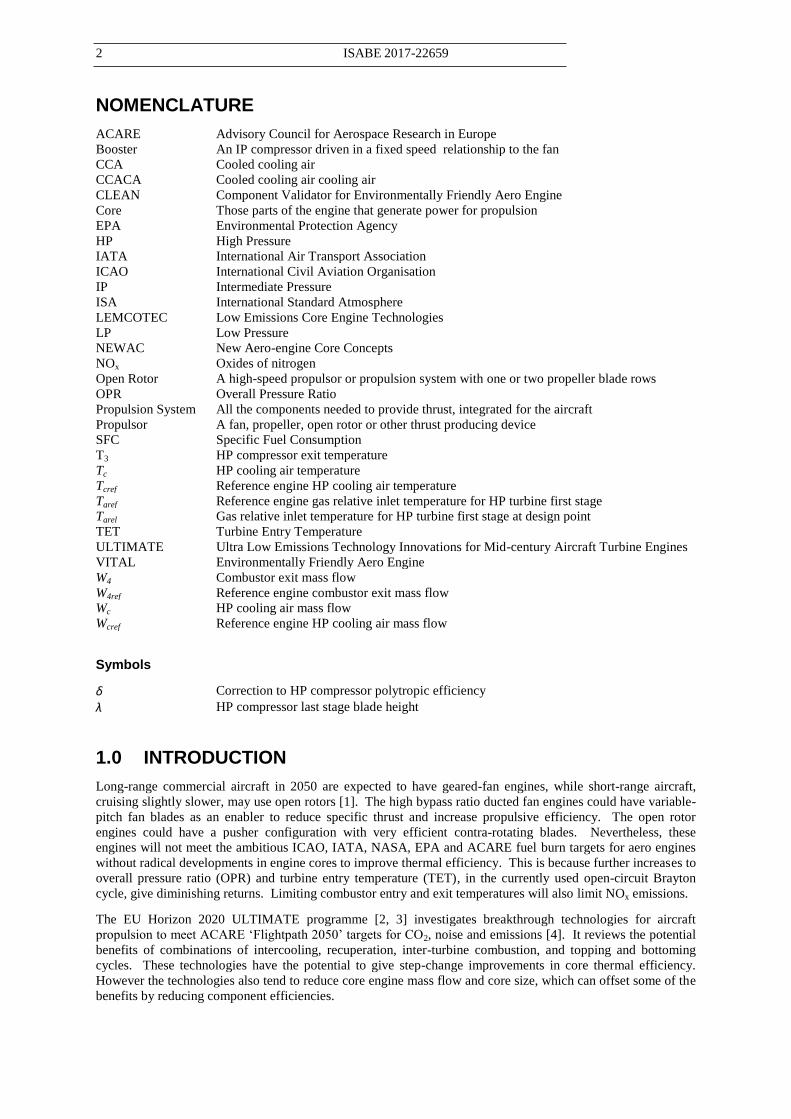
1.2 Intercooled Engines
In intercooled turbofan engines, part of the fan bypass air-flow is used to cool the intermediate pressure (IP)
compressor delivery air before this enters the high pressure (HP) compressor. This engine arrangement was
studied in NEWAC and is shown schematically in Fig. 1. NEWAC showed that high OPR intercooled cores, or
intercooled and recuperated cores, should reduce SFC and NOx emissions. However, the required heat
exchangers add weight and drag to these propulsion systems, offsetting much of the potential fuel burn benefit
[6]. Some rig tests have been carried out, but intercooling has not yet seen full engine demonstration.
Figure 1 Schematic diagram of an intercooled engine with a low-speed LP turbine and a direct-drive fan
4 ISABE 2017-22659
Intercooling reduces compression work by reducing the inlet air temperature for the HP compressor and the
volume flow rate of air passing through it, enabling increased OPR without raising HP compressor delivery air
temperatures (T3) to very high levels. It also reduces annulus cross-section areas in the HP system, saving some
weight, but by reducing blade heights it also reduces core component efficiencies.
Small blade height at the back of the HP compressor was a major issue for intercooled engine designs in the
NEWAC programme. The original three-shaft study engines had fans directly driven by the low-speed low
pressure (LP) turbines via high-torque shafts. The LP and IP system shafts passed through the central bores of
the HP spools, imposing minimum bore diameters and limiting HP rotational speeds. Thus the HP
turbomachinery could not be scaled down very much in diameter and it needed to have higher hub/tip radius
ratio blading, giving significantly smaller blade heights and reduced component efficiencies.
This problem was alleviated in a later NEWAC study by having a geared fan driven by a high-speed turbine.
The lower torque and smaller diameter shaft also drove the IP compressor or “booster”, eliminating the need for
a separate IP turbine and its shaft. This enabled a faster-running smaller-diameter HP system with increased
blade heights, lower hub/tip radius ratios and notably improved compressor efficiency [7].
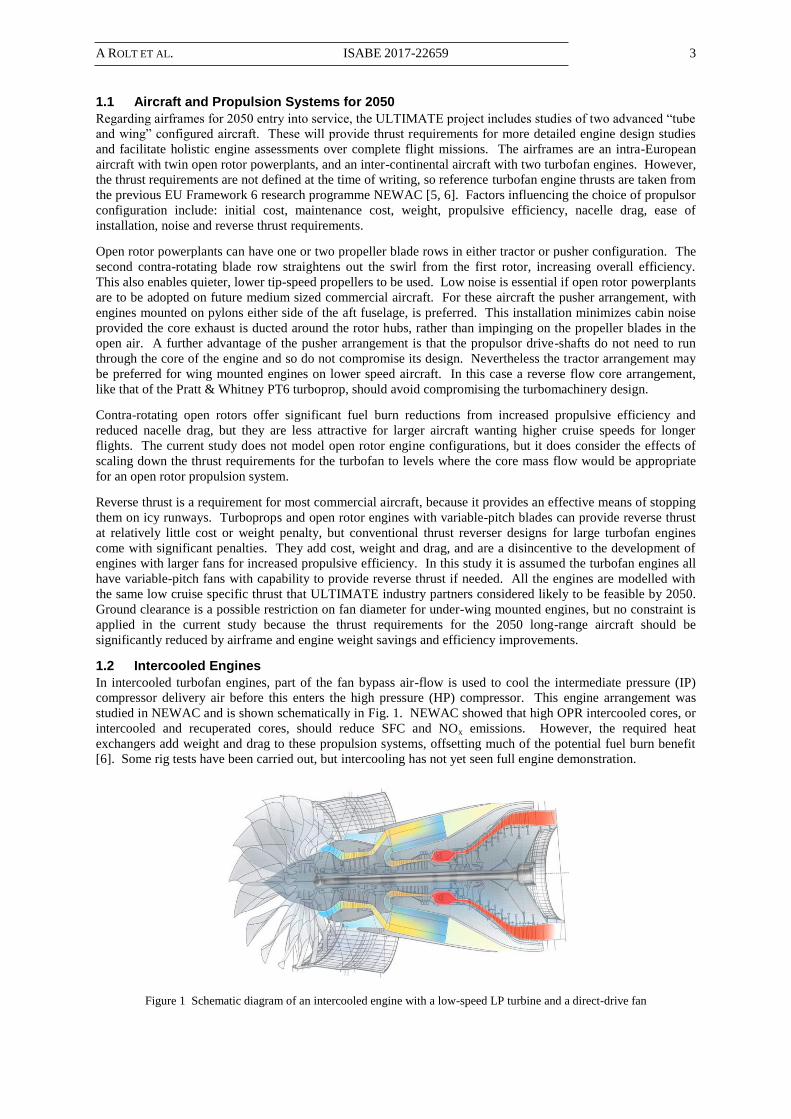
A reverse flow core intercooled turbofan was investigated in the more recent LEMCOTEC programme [8]. This
arrangement is shown schematically in Fig. 2. By placing the fan, IP compressor and turbines in front of the HP
compressor, the HP system no longer needs to have other shafts passing through it [9]. HP compressor
efficiency is improved and the optimum OPR is increased, but following reassessment of the exhaust mixer
performance and ducting losses it was concluded that the improvements in SFC and fuel burn from this
architecture were only about one per cent [10].
Figure 2 Schematic diagram of a reverse flow core intercooled turbofan aero engine arrangement
The reverse flow core arrangement is an option for novel cycles with core components that may not integrate so
well into the more conventional straight-through-flow and front-fan turbofan engine layout, but development of
improved materials for discs and shafts may reduce the small performance benefit that it currently offers. In the
current study it is assumed that smaller core designs will not be penalised by large LP shaft diameters.
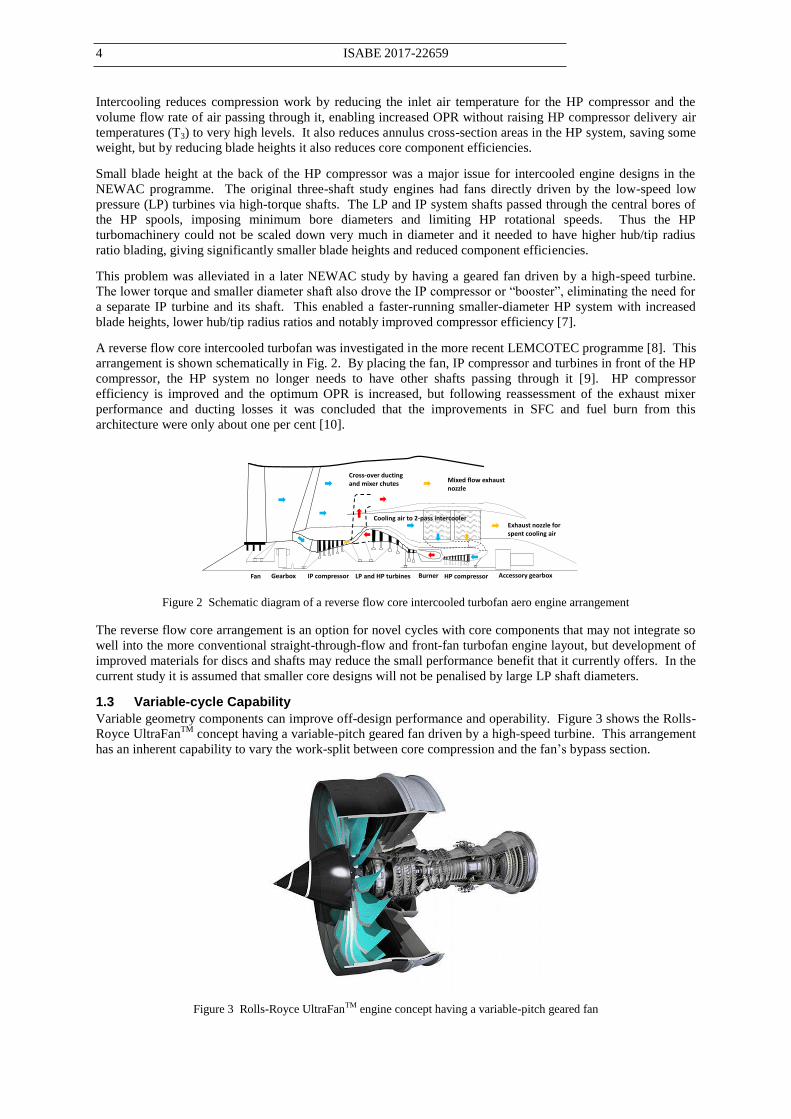
1.3 Variable-cycle Capability
Variable geometry components can improve off-design performance and operability. Figure 3 shows the Rolls-
Royce UltraFanTM
concept having a variable-pitch geared fan driven by a high-speed turbine. This arrangement
has an inherent capability to vary the work-split between core compression and the fan’s bypass section.
Figure 3 Rolls-Royce UltraFanTM engine concept having a variable-pitch geared fan
0
500
1000
1500
2000
2500
0 500 1000 1500 2000 2500 3000 3500 4000 4500 5000 5500 6000 6500 7000
Axial Reference (mm)
HP compressorIP compressorFan
Cooling air to 2-pass intercooler
Burner
Mixed flow exhaust nozzle
Exhaust nozzle for spent cooling air
Gearbox LP and HP turbines
Cross-over ducting and mixer chutes
Accessory gearbox
A ROLT ET AL. ISABE 2017-22659 5
Low specific thrust engines with low fan pressure ratios have un-choked bypass exhaust nozzles at takeoff. This
means fan mass flow is relatively reduced at low flight Mach numbers, risking either fan surge or flutter at
takeoff, or compromising fan efficiency at cruise and top of climb. These problems can be avoided with a
variable-area cold flow exhaust nozzle, or by having variable-pitch fan rotor blades. For the very low specific
thrust turbofan engines anticipated for 2050, one or both of these solutions is likely to be needed. The variable-
pitch fan also holds out the prospect of providing reverse thrust without a conventional thrust reverser, though
an auxiliary intake may be needed to provide reliable thrust reversal at higher forward speeds. Avoiding the
extra weight and extra nacelle drag associated with conventional thrust reversers means that optimised designs
can benefit from lower specific thrust and higher propulsive efficiency.
Part of the benefit from intercooling, or from intercooling and recuperation, also comes from creating variable-
cycle engines. In intercooled engines, maximizing intercooling at takeoff reduces combustor and turbine
temperatures and enables reduced core size and lower NOx emissions. At climb and cruise conditions the
amount of cooling air for the intercooler can be reduced, raising core cycle temperatures to improve thermal
efficiency while also reducing pressure losses on the cold side of the heat exchanger. It may also be possible to
reduce hot side pressure losses at cruise conditions by allowing part of the core flow to bypass the intercooler
[11], though no benefit has been claimed for this in the current performance modelling.
Variable-cycle capability introduces extra degrees of freedom in the optimisation of engine performance and
needs to be taken into consideration when comparing different cycle options at the concept design stage.
1.4 Engine Cycle Studies
The ULTIMATE design studies review combinations of core engine technologies to identify synergies between
them. Engine performance in the current study is compared at typical mid-cruise, max climb and max takeoff
conditions. Consistent rules are applied for component efficiencies, temperature limits and turbine cooling
flows. This paper covers the anticipated performance of conventional and intercooled engines for mid-century
entry into service. Subsequent papers will review other advanced technologies, component designs, and novel
engine architectures to fully realize the potential of advanced cycles to reduce SFC, fuel burn and NOx
emissions. It is assumed that engines in 2050 will still run on kerosene or drop-in replacement bio-fuels. The
use of different fuels may well affect future engine designs, but is beyond the scope of the current studies.
2.0 METHODOLOGY
In this study a simplified approach is taken to cycle modelling, with stream-tube thrust requirements fixed at the
three key flight conditions shown in table 1. The reference thrust levels are based on those used in the previous
EU programmes VITAL and NEWAC for a long-range twin-engined aircraft [6]. Aircraft accessory power is
taken from the HP spool, but no compressed air is supplied to the aircraft. For scaled engines the thrusts and
power offtakes at each condition are scaled by a common thrust scale factor.
Table 1
Initial Long-range Aircraft Thrust Requirements (per engine)
Mid-Cruise Max Climb Max Takeoff
Altitude (ft) 35,000 35,000 0
Altitude (m) 10,668 10,668 0
Mach Number 0.82 0.82 0.25
Deviation from ISA 0°C 10°C 15°C
Net Thrust (kN) 49 67 253
Power Offtake (kW) 260 260 260
The reference engine for the study is a conventional Brayton cycle turbofan with component efficiencies,
materials, OPR and operating temperatures projected forwards to year 2050 entry into service. Similar to Fig. 3,
it has the following key features:
A geared variable-pitch fan and a high speed booster driven by a high-speed turbine
Fixed area separate jet exhaust nozzles
An all-axial HP compressor driven by a two-stage HP turbine
Cooled cooling air for cooling the HP system
High OPR and very low specific thrust, giving bypass ratios in excess of twenty
6 ISABE 2017-22659
The reference engine was sized initially for a long-range aircraft of around 240 tonnes maximum takeoff weight,
and engine performance was assessed with component efficiencies, materials and blade cooling technologies
projected forwards to the year 2050. Takeoff performance is quoted for a hot day end-of-runway case, so the
static takeoff thrust would be higher.
The intercooled engines have the same geared fan arrangement as Fig. 3, but with intercooler modules
positioned as shown in Fig. 1. These modules may now have a two-pass cross-flow arrangement [11]. Their
spent cooling air is assumed to be ducted to separate variable area exhaust nozzles, rather than being mixed back
into the main bypass duct. The reverse flow core and mixed exhaust arrangement of Fig. 2 has not been
modelled in the current study, but remains a future option. It has the potential to further reduce noise and
improve SFC and fuel burn, for both the conventional and intercooled engine cycles.
Spreadsheet performance models are used to compare different cycle options and varying thrust requirements.
The spreadsheets use equations and polynomials for fluid properties taken from Walsh and Fletcher [12], pages
113-119. Component efficiencies are specified at design and off-design conditions. As only high power
conditions are modelled, the turbines are assumed to be choked at inlet, component performance maps are not
needed and cycle optimisation is simplified. Nacelle drags and afterbody drags are not assessed at this stage
because they will depend on engine lengths and nacelle designs that will only be determined in more detailed
design studies later in the ULTIMATE programme.
2.1 Scaled Engine Design Assumptions
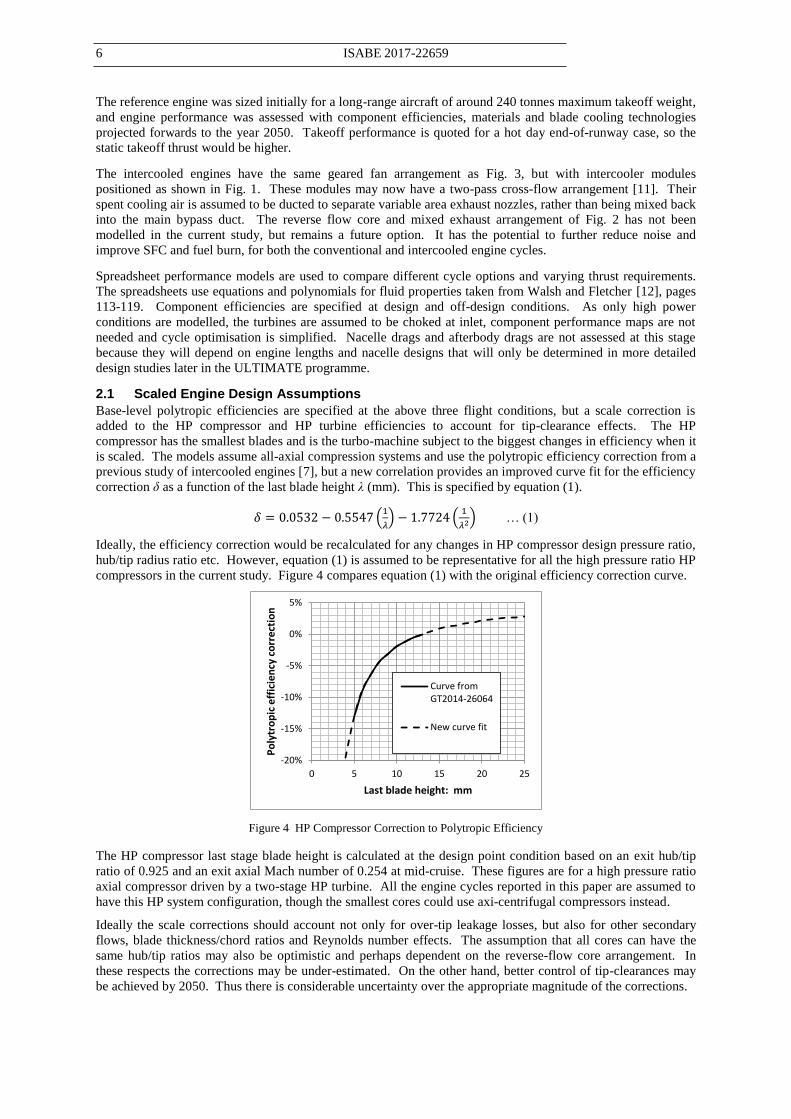
Base-level polytropic efficiencies are specified at the above three flight conditions, but a scale correction is
added to the HP compressor and HP turbine efficiencies to account for tip-clearance effects. The HP
compressor has the smallest blades and is the turbo-machine subject to the biggest changes in efficiency when it
is scaled. The models assume all-axial compression systems and use the polytropic efficiency correction from a
previous study of intercooled engines [7], but a new correlation provides an improved curve fit for the efficiency
correction δ as a function of the last blade height λ (mm). This is specified by equation (1).
𝛿 = 0.0532 − 0.5547 (1
𝜆) − 1.7724 (
1
𝜆2) … (1)
Ideally, the efficiency correction would be recalculated for any changes in HP compressor design pressure ratio,
hub/tip radius ratio etc. However, equation (1) is assumed to be representative for all the high pressure ratio HP
compressors in the current study. Figure 4 compares equation (1) with the original efficiency correction curve.
Figure 4 HP Compressor Correction to Polytropic Efficiency
The HP compressor last stage blade height is calculated at the design point condition based on an exit hub/tip
ratio of 0.925 and an exit axial Mach number of 0.254 at mid-cruise. These figures are for a high pressure ratio
axial compressor driven by a two-stage HP turbine. All the engine cycles reported in this paper are assumed to
have this HP system configuration, though the smallest cores could use axi-centrifugal compressors instead.
Ideally the scale corrections should account not only for over-tip leakage losses, but also for other secondary
flows, blade thickness/chord ratios and Reynolds number effects. The assumption that all cores can have the
same hub/tip ratios may also be optimistic and perhaps dependent on the reverse-flow core arrangement. In
these respects the corrections may be under-estimated. On the other hand, better control of tip-clearances may
be achieved by 2050. Thus there is considerable uncertainty over the appropriate magnitude of the corrections.
-20%
-15%
-10%
-5%
0%
5%
0 5 10 15 20 25
Po
lytr
op
ic e
ffic
ien
cy c
orr
ecti
on
Last blade height: mm
Curve fromGT2014-26064
New curve fit
A ROLT ET AL. ISABE 2017-22659 7
The scale corrections for HP turbine polytropic efficiency are, for simplicity, taken to be half as large as the
compressor efficiency corrections. No corrections are applied to the LP turbomachinery components, which are
expected to show smaller efficiency variations with scaling. Those changes would mostly affect transfer
efficiency and have little effect on the core thermal efficiency that is of greater interest in these studies.
2.2 Cooling Requirements
The 2050 reference turbofan has higher T3 and TET than existing engines, so it uses cooled cooling air (CCA) to
cool the HP system and to reduce the amount of cooling air required. The CCA system is designed such that
sufficient cooled cooling air cooling air (CCACA) is taken from the bypass duct through a heat exchanger to
bring the CCA temperature (Tc) down to 900 K when T3 is hotter than this. Pre-swirling the air ahead of the
first HP turbine rotor is assumed to compensate for heat pick-up prior to blade cooling. Both the CCA heat
exchanger and the intercooler eject spent cooling air overboard through dedicated variable-area exhaust nozzles
that help to recover thrust.
Cooling the CCA is generally unnecessary at cruise, so there the CCACA flow is zero. The intercooled engines
still benefit from CCA at takeoff, but the system is hardly needed for the lowest T3 cycles. For each engine
design, the off-design CCA mass flow, whether pre-cooled or not, is a fixed percentage of the core mass flow.
Detailed modelling of secondary air systems is beyond the scope of this study, but it is recognised that scaling
down the HP core components makes cooling them more difficult. Thus all design point HP CCA mass flows
are scaled from the 6% of core flow assumed for the reference turbofan. Scaling accounts for two factors:
Changes in HP turbine design point mass flow
Temperature differences between the HP turbine first blade row relative inlet gas temperature (Tgrel)
and the blade cooling air temperature (Tc)
The relative gas temperature is calculated as corresponding to 25% of the temperature drop through the two-
stage HP turbine, assuming 50% reaction blading and equal temperature drops through both stages. The HP
cooling air flow for a given design point T3 and TET is assumed to vary with the ratio of core mass flow raised
to the power of 0.65. This figure is a compromise between an index of 0.8, obtained by assuming the
convective heat transfer coefficients are limiting, and an index of 0.5, which applies if the heat flux is
proportional to the thermal gradients in geometrically scaled components. In practice thermal barrier coating
thicknesses etc. will not exactly scale. Smaller engines will also tend to have lower aspect ratio blading, so
engine length and diameter will scale at different rates. The two scaling factors are combined in equation (2):
𝑊𝑐 = 𝑊𝑐𝑟𝑒𝑓(𝑇𝑔𝑟𝑒𝑙−𝑇𝑐𝑟𝑒𝑓)(𝑊4/𝑊4𝑟𝑒𝑓)0.65
(𝑇𝑔𝑟𝑒𝑓−𝑇𝑐) …….……(2)
The same HP cooling air mass flow scaling rule is applied to both conventional and intercooled engine cycles.
Lower pressure cooling and sealing air flows, assumed to be just 2% of core mass flow, are not scaled.
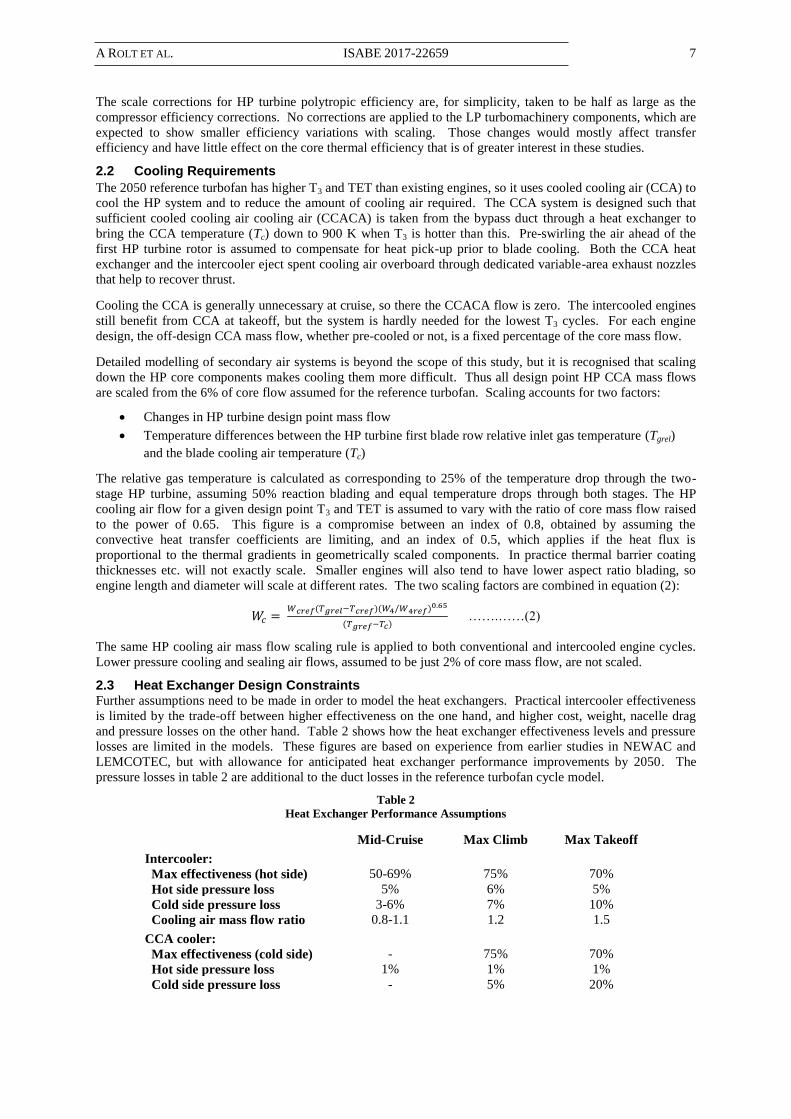
2.3 Heat Exchanger Design Constraints Further assumptions need to be made in order to model the heat exchangers. Practical intercooler effectiveness
is limited by the trade-off between higher effectiveness on the one hand, and higher cost, weight, nacelle drag
and pressure losses on the other hand. Table 2 shows how the heat exchanger effectiveness levels and pressure
losses are limited in the models. These figures are based on experience from earlier studies in NEWAC and
LEMCOTEC, but with allowance for anticipated heat exchanger performance improvements by 2050. The
pressure losses in table 2 are additional to the duct losses in the reference turbofan cycle model.
Table 2
Heat Exchanger Performance Assumptions
Mid-Cruise Max Climb Max Takeoff
Intercooler:
Max effectiveness (hot side) 50-69% 75% 70%
Hot side pressure loss 5% 6% 5%
Cold side pressure loss 3-6% 7% 10%
Cooling air mass flow ratio 0.8-1.1 1.2 1.5
CCA cooler:
Max effectiveness (cold side) - 75% 70%
Hot side pressure loss 1% 1% 1%
Cold side pressure loss - 5% 20%
8 ISABE 2017-22659
Note the heat exchanger effectiveness figures are for “temperature effectiveness”, defined as the difference
between the inlet and outlet temperatures on the side of interest, divided by the difference between the overall
maximum and minimum air temperatures entering and exiting the heat exchanger.
The intercooler cooling air mass flow ratio is the ratio of cold-side to hot-side mass flow. The off-design
cooling air flow is adjusted using the variable-area exhaust nozzles that recover thrust from the spent cooling
air. The intercooler cooling air mass flow is typically kept relatively low at cruise to reduce heat loss from the
core and to minimise pressure losses and thus SFC, but it is increased at takeoff to limit T3 and TET.
The mass flow ratio of CCACA to CCA is adjusted at each condition to ensure that there is sufficient CCACA
mass flow to limit the cold side of the heat exchanger to 75% effectiveness at climb and 70% at takeoff. This
minimises the size of the heat exchanger and limits the temperature of the spent cooling air. The hot side loss in
the CCA heat exchanger is low because this air flow has the highest density and heat transfer coefficients even
at relatively low Mach numbers. Also it does not suffer from any extra diffuser losses.
2.4 Cycle OPR and Temperature Limits
To make a fair comparison between the intercooled cycles and the reference engine, the latter’s hot day takeoff
T3 and TET values are taken as limiting values. The HP compressor pressure ratio is taken to be limited by the
maximum power realistically available from the two-stage HP turbine, or to 26:1 at the max climb condition.
In modelling the scaled and intercooled cycles some trade-offs between the mid-cruise and max climb TET and
T3 are allowed, relative to the original reference engine cycle. When scaling the core, the OPR for a given T3
varies because of the HP compressor efficiency changes. The assumed temperature limits for mid-cruise, max
climb and max takeoff are given in table 3.
Table 3
General Cycle Temperature Limits
Mid-Cruise Max Climb Max Takeoff
TET (K) 1700 1890 1950
T3 (K) 913 993 1063
Deviation from ISA 0°C 10°C 15°C
The larger engines benefit from working up to the maximum T3 and TET. The smaller engines also generally
benefit from this, but see relatively smaller penalties from reducing OPR and T3. Reducing OPR should save
weight. Reducing OPR, T3 or TET will also tend to reduce cost and NOx emissions.
3.0 CYCLE MODELS
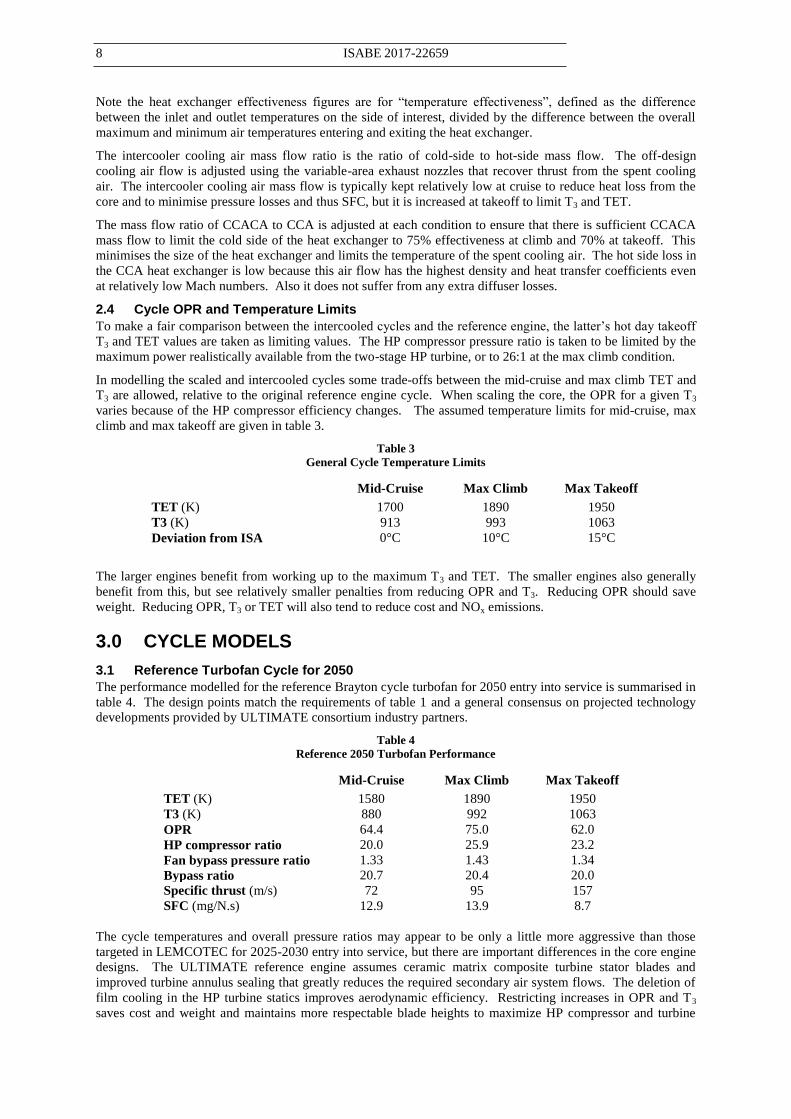
3.1 Reference Turbofan Cycle for 2050
The performance modelled for the reference Brayton cycle turbofan for 2050 entry into service is summarised in
table 4. The design points match the requirements of table 1 and a general consensus on projected technology
developments provided by ULTIMATE consortium industry partners.
Table 4
Reference 2050 Turbofan Performance
Mid-Cruise Max Climb Max Takeoff
TET (K) 1580 1890 1950
T3 (K) 880 992 1063
OPR 64.4 75.0 62.0
HP compressor ratio 20.0 25.9 23.2
Fan bypass pressure ratio 1.33 1.43 1.34
Bypass ratio 20.7 20.4 20.0
Specific thrust (m/s) 72 95 157
SFC (mg/N.s) 12.9 13.9 8.7
The cycle temperatures and overall pressure ratios may appear to be only a little more aggressive than those
targeted in LEMCOTEC for 2025-2030 entry into service, but there are important differences in the core engine
designs. The ULTIMATE reference engine assumes ceramic matrix composite turbine stator blades and
improved turbine annulus sealing that greatly reduces the required secondary air system flows. The deletion of
film cooling in the HP turbine statics improves aerodynamic efficiency. Restricting increases in OPR and T3
saves cost and weight and maintains more respectable blade heights to maximize HP compressor and turbine
A ROLT ET AL. ISABE 2017-22659 9
efficiency. Another benefit of restricting OPR and TET is that it avoids the combination of very high combustor
inlet pressures and temperatures that would tend to increase flame temperatures and NOx emissions at takeoff,
even with advanced lean-burn combustor technology.
Component designs are assumed optimised for the mid-cruise condition, so they are sub-optimal at top of climb
and at takeoff. Table 5 shows the component polytropic efficiency penalties being applied at those off-design
conditions. These are consistent with the thrusts and cycle temperatures given in tables 1 and 3. The basic HP
turbine efficiency is assumed to be constant, but the HP turbine and HP compressor efficiencies change when
the core is scaled. (The combined fan root section and IP compressor is referred to as the LP compressor.)
Table 5
Reference 2050 Turbofan Off-design Component Polytropic Efficiency Variation
Mid-Cruise Max Climb Max Takeoff
Fan bypass stage datum -2.2% -0.7%
LP compressor datum -1.0% -0.4%
HP compressor datum -3.8% -1.7%
LP turbine datum -2.0% -1.0%
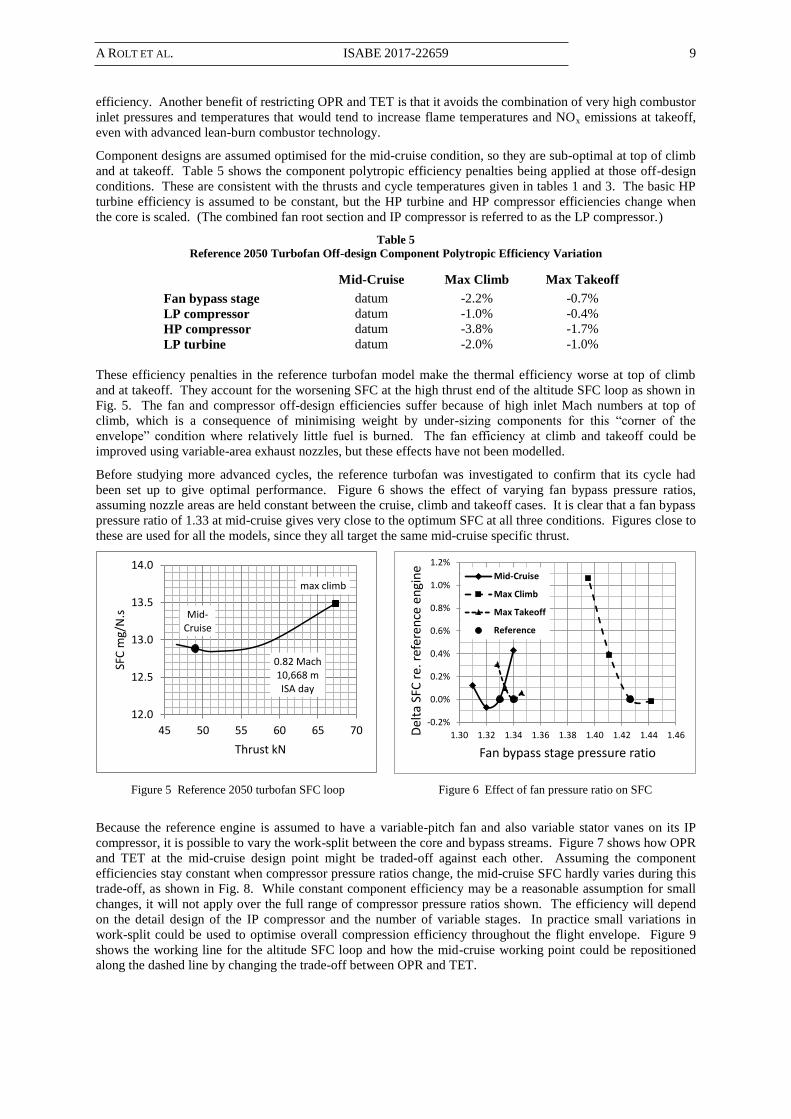
These efficiency penalties in the reference turbofan model make the thermal efficiency worse at top of climb
and at takeoff. They account for the worsening SFC at the high thrust end of the altitude SFC loop as shown in
Fig. 5. The fan and compressor off-design efficiencies suffer because of high inlet Mach numbers at top of
climb, which is a consequence of minimising weight by under-sizing components for this “corner of the
envelope” condition where relatively little fuel is burned. The fan efficiency at climb and takeoff could be
improved using variable-area exhaust nozzles, but these effects have not been modelled.
Before studying more advanced cycles, the reference turbofan was investigated to confirm that its cycle had
been set up to give optimal performance. Figure 6 shows the effect of varying fan bypass pressure ratios,
assuming nozzle areas are held constant between the cruise, climb and takeoff cases. It is clear that a fan bypass
pressure ratio of 1.33 at mid-cruise gives very close to the optimum SFC at all three conditions. Figures close to
these are used for all the models, since they all target the same mid-cruise specific thrust.
Figure 5 Reference 2050 turbofan SFC loop Figure 6 Effect of fan pressure ratio on SFC
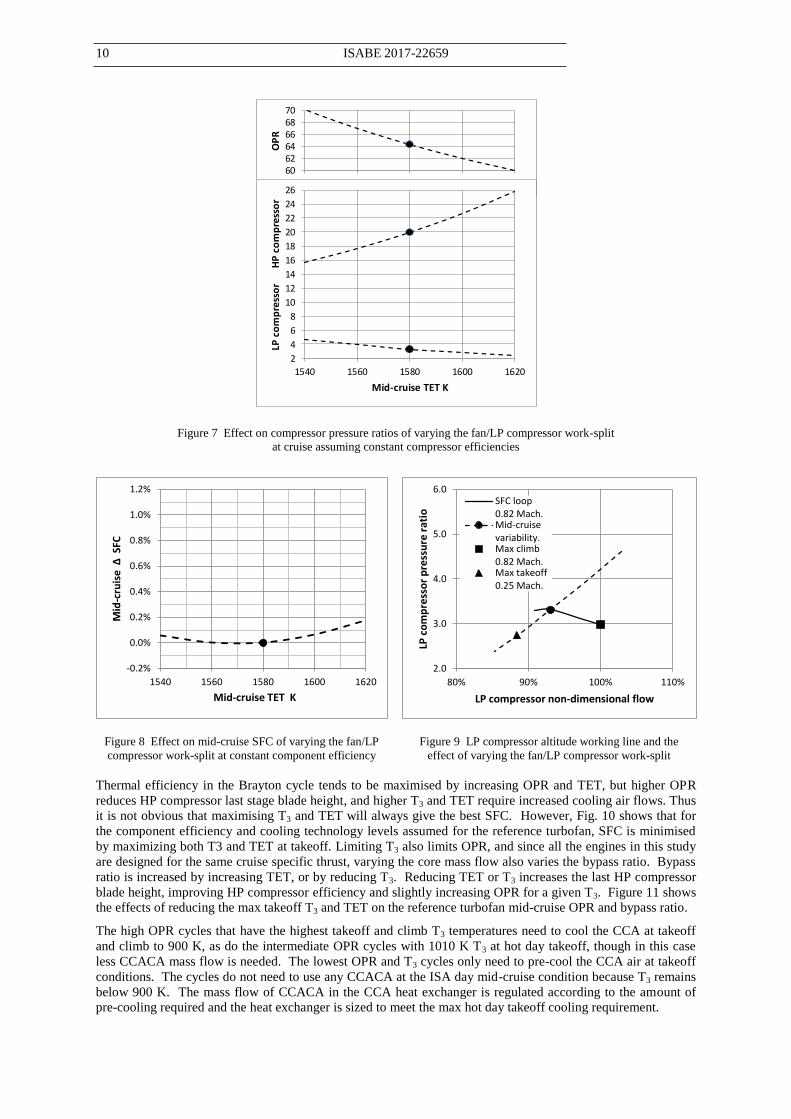
Because the reference engine is assumed to have a variable-pitch fan and also variable stator vanes on its IP
compressor, it is possible to vary the work-split between the core and bypass streams. Figure 7 shows how OPR
and TET at the mid-cruise design point might be traded-off against each other. Assuming the component
efficiencies stay constant when compressor pressure ratios change, the mid-cruise SFC hardly varies during this
trade-off, as shown in Fig. 8. While constant component efficiency may be a reasonable assumption for small
changes, it will not apply over the full range of compressor pressure ratios shown. The efficiency will depend
on the detail design of the IP compressor and the number of variable stages. In practice small variations in
work-split could be used to optimise overall compression efficiency throughout the flight envelope. Figure 9
shows the working line for the altitude SFC loop and how the mid-cruise working point could be repositioned
along the dashed line by changing the trade-off between OPR and TET.
Mid-Cruise
0.82 Mach 10,668 m ISA day
max climb
12.0
12.5
13.0
13.5
14.0
45 50 55 60 65 70
SFC
mg/
N.s
Thrust kN
-0.2%
0.0%
0.2%
0.4%
0.6%
0.8%
1.0%
1.2%
1.30 1.32 1.34 1.36 1.38 1.40 1.42 1.44 1.46Del
ta S
FC r
e. r
efer
ence
en
gin
e
Fan bypass stage pressure ratio
Mid-Cruise
Max Climb
Max Takeoff
Reference
10 ISABE 2017-22659
Figure 7 Effect on compressor pressure ratios of varying the fan/LP compressor work-split
at cruise assuming constant compressor efficiencies
Figure 8 Effect on mid-cruise SFC of varying the fan/LP
compressor work-split at constant component efficiency
Figure 9 LP compressor altitude working line and the
effect of varying the fan/LP compressor work-split
Thermal efficiency in the Brayton cycle tends to be maximised by increasing OPR and TET, but higher OPR
reduces HP compressor last stage blade height, and higher T3 and TET require increased cooling air flows. Thus
it is not obvious that maximising T3 and TET will always give the best SFC. However, Fig. 10 shows that for
the component efficiency and cooling technology levels assumed for the reference turbofan, SFC is minimised
by maximizing both T3 and TET at takeoff. Limiting T3 also limits OPR, and since all the engines in this study
are designed for the same cruise specific thrust, varying the core mass flow also varies the bypass ratio. Bypass
ratio is increased by increasing TET, or by reducing T3. Reducing TET or T3 increases the last HP compressor
blade height, improving HP compressor efficiency and slightly increasing OPR for a given T3. Figure 11 shows
the effects of reducing the max takeoff T3 and TET on the reference turbofan mid-cruise OPR and bypass ratio.
The high OPR cycles that have the highest takeoff and climb T3 temperatures need to cool the CCA at takeoff
and climb to 900 K, as do the intermediate OPR cycles with 1010 K T3 at hot day takeoff, though in this case
less CCACA mass flow is needed. The lowest OPR and T3 cycles only need to pre-cool the CCA air at takeoff
conditions. The cycles do not need to use any CCACA at the ISA day mid-cruise condition because T3 remains
below 900 K. The mass flow of CCACA in the CCA heat exchanger is regulated according to the amount of
pre-cooling required and the heat exchanger is sized to meet the max hot day takeoff cooling requirement.
606264666870
1540 1560 1580 1600 1620
OP
R
2
4
6
8
10
12
14
16
18
20
22
24
26
1540 1560 1580 1600 1620
LP c
om
pre
sso
r
HP
co
mp
ress
or
Mid-cruise TET K
-0.2%
0.0%
0.2%
0.4%
0.6%
0.8%
1.0%
1.2%
1540 1560 1580 1600 1620
Mid
-cru
ise
Δ S
FC
Mid-cruise TET K
2.0
3.0
4.0
5.0
6.0
80% 90% 100% 110%
LP c
om
pre
sso
r p
ress
ure
rat
io
LP compressor non-dimensional flow
SFC loop0.82 Mach.Mid-cruisevariability.Max climb0.82 Mach.Max takeoff0.25 Mach.
A ROLT ET AL. ISABE 2017-22659 11
Figure 10 Effect of reducing hot day takeoff TET
and T3 on the reference engine mid-cruise SFC Figure 11 Effect of reducing hot day takeoff TET and T3
on the reference engine mid-cruise OPR and bypass ratio
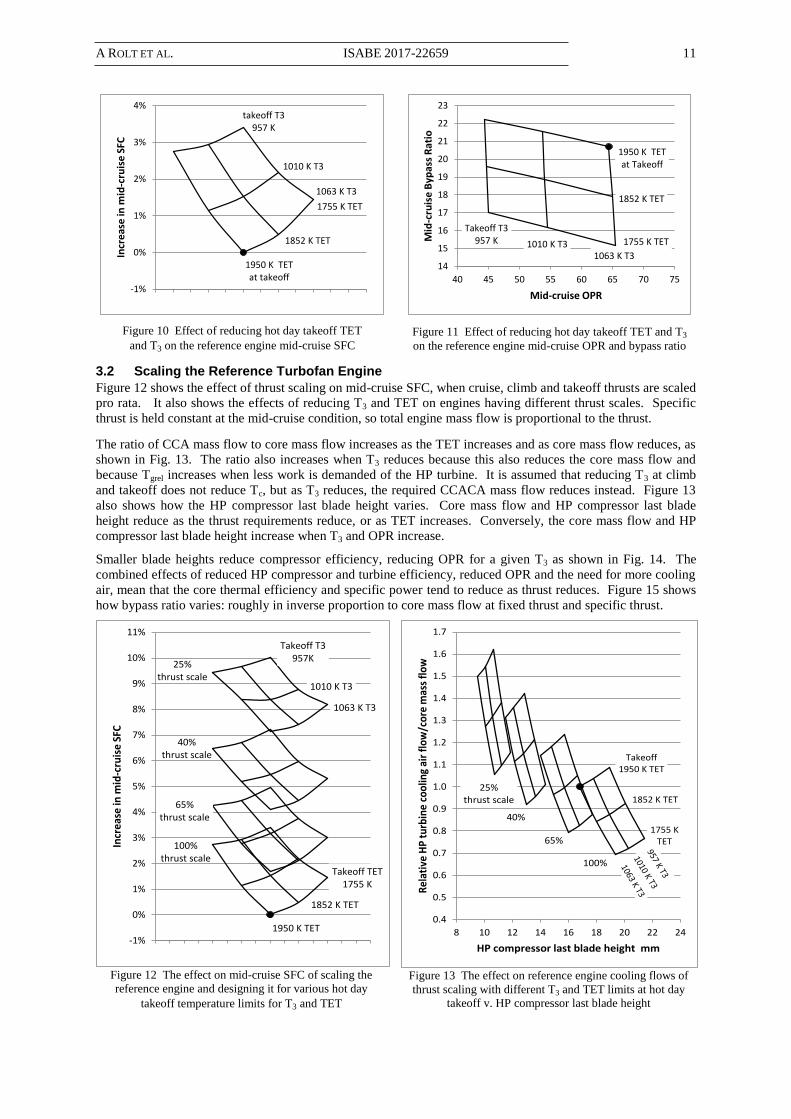
3.2 Scaling the Reference Turbofan Engine
Figure 12 shows the effect of thrust scaling on mid-cruise SFC, when cruise, climb and takeoff thrusts are scaled
pro rata. It also shows the effects of reducing T3 and TET on engines having different thrust scales. Specific
thrust is held constant at the mid-cruise condition, so total engine mass flow is proportional to the thrust.
The ratio of CCA mass flow to core mass flow increases as the TET increases and as core mass flow reduces, as
shown in Fig. 13. The ratio also increases when T3 reduces because this also reduces the core mass flow and
because Tgrel increases when less work is demanded of the HP turbine. It is assumed that reducing T3 at climb
and takeoff does not reduce Tc, but as T3 reduces, the required CCACA mass flow reduces instead. Figure 13
also shows how the HP compressor last blade height varies. Core mass flow and HP compressor last blade
height reduce as the thrust requirements reduce, or as TET increases. Conversely, the core mass flow and HP
compressor last blade height increase when T3 and OPR increase.
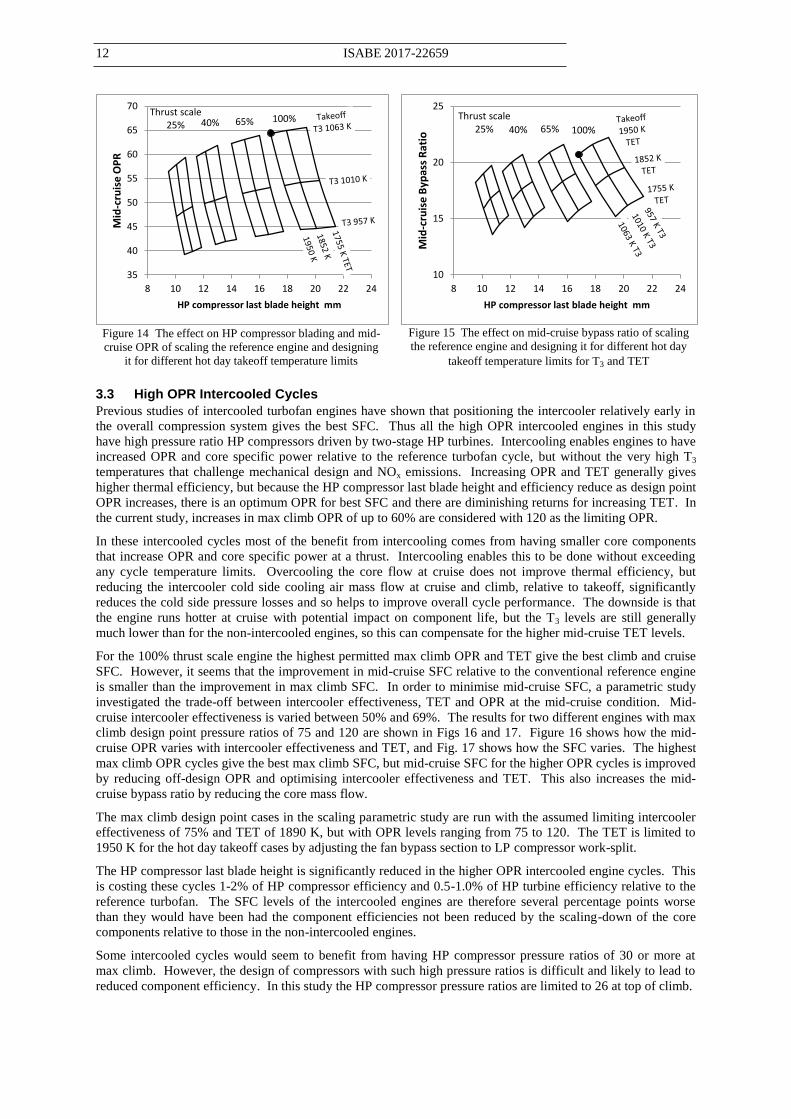
Smaller blade heights reduce compressor efficiency, reducing OPR for a given T3 as shown in Fig. 14. The
combined effects of reduced HP compressor and turbine efficiency, reduced OPR and the need for more cooling
air, mean that the core thermal efficiency and specific power tend to reduce as thrust reduces. Figure 15 shows
how bypass ratio varies: roughly in inverse proportion to core mass flow at fixed thrust and specific thrust.
Figure 12 The effect on mid-cruise SFC of scaling the
reference engine and designing it for various hot day
takeoff temperature limits for T3 and TET
Figure 13 The effect on reference engine cooling flows of
thrust scaling with different T3 and TET limits at hot day
takeoff v. HP compressor last blade height
1950 K TET at takeoff
1852 K TET
1755 K TET
1063 K T3
1010 K T3
takeoff T3 957 K
-1%
0%
1%
2%
3%
4%
0.5 1 1.5 2 2.5 3 3.5 4 4.5 5 5.5 6 6.5
Incr
ease
in m
id-c
ruis
e SF
C
1950 K TET at Takeoff
1852 K TET
1755 K TET
1063 K T31010 K T3
Takeoff T3 957 K
14
15
16
17
18
19
20
21
22
23
40 45 50 55 60 65 70 75
Mid
-cru
ise
Byp
ass
Rat
io
Mid-cruise OPR
100% thrust scale
1950 K TET
1852 K TET
Takeoff TET 1755 K
65% thrust scale
40% thrust scale
25% thrust scale
1063 K T3
1010 K T3
Takeoff T3 957K
-1%
0%
1%
2%
3%
4%
5%
6%
7%
8%
9%
10%
11%
-1 -0.5 0 0.5 1 1.5 2 2.5 3 3.5 4 4.5 5 5.5 6 6.5
Incr
ease
in m
id-c
ruis
e SF
C
100%
Takeoff 1950 K TET
1852 K TET
1755 K TET
25% thrust scale
40%
65%
0.4
0.5
0.6
0.7
0.8
0.9
1.0
1.1
1.2
1.3
1.4
1.5
1.6
1.7
8 10 12 14 16 18 20 22 24
Rel
ativ
e H
P tu
rbin
e co
olin
g ai
r fl
ow/c
ore
mas
s fl
ow
HP compressor last blade height mm
12 ISABE 2017-22659
Figure 14 The effect on HP compressor blading and mid-
cruise OPR of scaling the reference engine and designing
it for different hot day takeoff temperature limits
Figure 15 The effect on mid-cruise bypass ratio of scaling
the reference engine and designing it for different hot day
takeoff temperature limits for T3 and TET
3.3 High OPR Intercooled Cycles
Previous studies of intercooled turbofan engines have shown that positioning the intercooler relatively early in
the overall compression system gives the best SFC. Thus all the high OPR intercooled engines in this study
have high pressure ratio HP compressors driven by two-stage HP turbines. Intercooling enables engines to have
increased OPR and core specific power relative to the reference turbofan cycle, but without the very high T3
temperatures that challenge mechanical design and NOx emissions. Increasing OPR and TET generally gives
higher thermal efficiency, but because the HP compressor last blade height and efficiency reduce as design point
OPR increases, there is an optimum OPR for best SFC and there are diminishing returns for increasing TET. In
the current study, increases in max climb OPR of up to 60% are considered with 120 as the limiting OPR.
In these intercooled cycles most of the benefit from intercooling comes from having smaller core components
that increase OPR and core specific power at a thrust. Intercooling enables this to be done without exceeding
any cycle temperature limits. Overcooling the core flow at cruise does not improve thermal efficiency, but
reducing the intercooler cold side cooling air mass flow at cruise and climb, relative to takeoff, significantly
reduces the cold side pressure losses and so helps to improve overall cycle performance. The downside is that
the engine runs hotter at cruise with potential impact on component life, but the T3 levels are still generally
much lower than for the non-intercooled engines, so this can compensate for the higher mid-cruise TET levels.
For the 100% thrust scale engine the highest permitted max climb OPR and TET give the best climb and cruise
SFC. However, it seems that the improvement in mid-cruise SFC relative to the conventional reference engine
is smaller than the improvement in max climb SFC. In order to minimise mid-cruise SFC, a parametric study
investigated the trade-off between intercooler effectiveness, TET and OPR at the mid-cruise condition. Mid-
cruise intercooler effectiveness is varied between 50% and 69%. The results for two different engines with max
climb design point pressure ratios of 75 and 120 are shown in Figs 16 and 17. Figure 16 shows how the mid-
cruise OPR varies with intercooler effectiveness and TET, and Fig. 17 shows how the SFC varies. The highest
max climb OPR cycles give the best max climb SFC, but mid-cruise SFC for the higher OPR cycles is improved
by reducing off-design OPR and optimising intercooler effectiveness and TET. This also increases the mid-
cruise bypass ratio by reducing the core mass flow.
The max climb design point cases in the scaling parametric study are run with the assumed limiting intercooler
effectiveness of 75% and TET of 1890 K, but with OPR levels ranging from 75 to 120. The TET is limited to
1950 K for the hot day takeoff cases by adjusting the fan bypass section to LP compressor work-split.
The HP compressor last blade height is significantly reduced in the higher OPR intercooled engine cycles. This
is costing these cycles 1-2% of HP compressor efficiency and 0.5-1.0% of HP turbine efficiency relative to the
reference turbofan. The SFC levels of the intercooled engines are therefore several percentage points worse
than they would have been had the component efficiencies not been reduced by the scaling-down of the core
components relative to those in the non-intercooled engines.
Some intercooled cycles would seem to benefit from having HP compressor pressure ratios of 30 or more at
max climb. However, the design of compressors with such high pressure ratios is difficult and likely to lead to
reduced component efficiency. In this study the HP compressor pressure ratios are limited to 26 at top of climb.
100%Thrust scale
25% 40% 65%
35
40
45
50
55
60
65
70
8 10 12 14 16 18 20 22 24
Mid
-cru
ise
OP
R
HP compressor last blade height mm
100%
Thrust scale 25% 40% 65%
10
15
20
25
8 10 12 14 16 18 20 22 24
Mid
-cru
ise
Byp
ass
Rat
io
HP compressor last blade height mm
A ROLT ET AL. ISABE 2017-22659 13
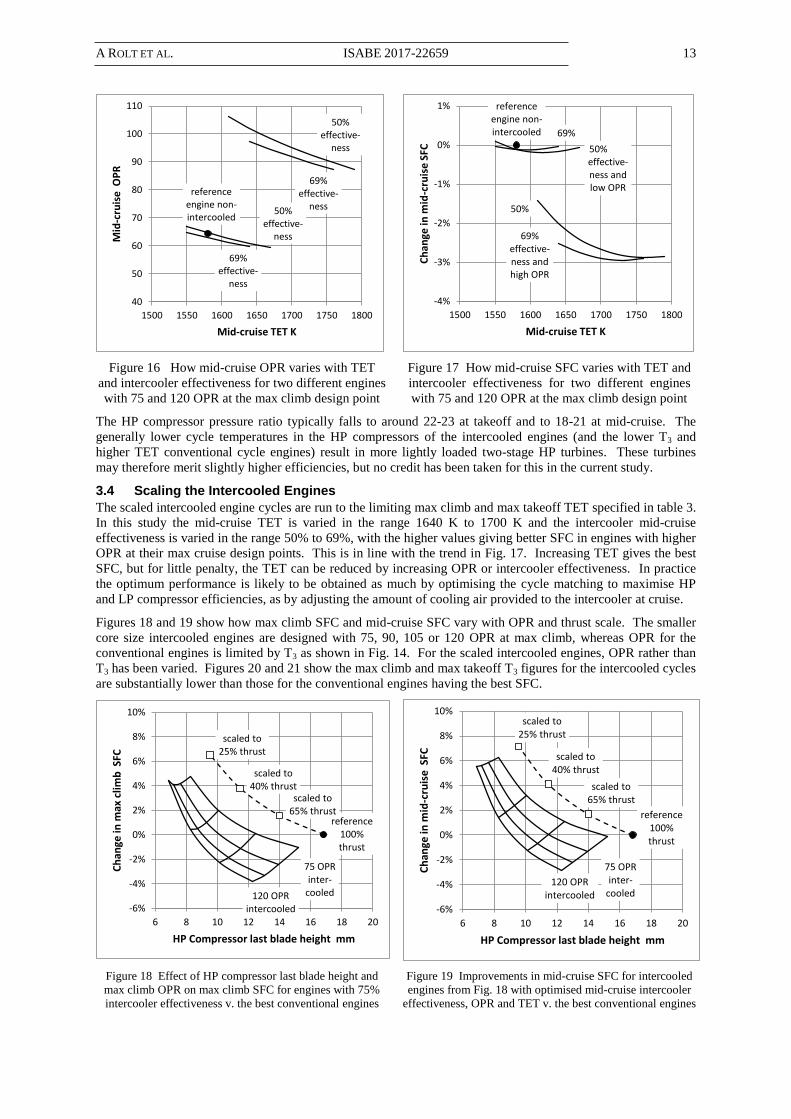
Figure 16 How mid-cruise OPR varies with TET
and intercooler effectiveness for two different engines
with 75 and 120 OPR at the max climb design point
Figure 17 How mid-cruise SFC varies with TET and
intercooler effectiveness for two different engines
with 75 and 120 OPR at the max climb design point
The HP compressor pressure ratio typically falls to around 22-23 at takeoff and to 18-21 at mid-cruise. The
generally lower cycle temperatures in the HP compressors of the intercooled engines (and the lower T3 and
higher TET conventional cycle engines) result in more lightly loaded two-stage HP turbines. These turbines
may therefore merit slightly higher efficiencies, but no credit has been taken for this in the current study.
3.4 Scaling the Intercooled Engines
The scaled intercooled engine cycles are run to the limiting max climb and max takeoff TET specified in table 3.
In this study the mid-cruise TET is varied in the range 1640 K to 1700 K and the intercooler mid-cruise
effectiveness is varied in the range 50% to 69%, with the higher values giving better SFC in engines with higher
OPR at their max cruise design points. This is in line with the trend in Fig. 17. Increasing TET gives the best
SFC, but for little penalty, the TET can be reduced by increasing OPR or intercooler effectiveness. In practice
the optimum performance is likely to be obtained as much by optimising the cycle matching to maximise HP
and LP compressor efficiencies, as by adjusting the amount of cooling air provided to the intercooler at cruise.
Figures 18 and 19 show how max climb SFC and mid-cruise SFC vary with OPR and thrust scale. The smaller
core size intercooled engines are designed with 75, 90, 105 or 120 OPR at max climb, whereas OPR for the
conventional engines is limited by T3 as shown in Fig. 14. For the scaled intercooled engines, OPR rather than
T3 has been varied. Figures 20 and 21 show the max climb and max takeoff T3 figures for the intercooled cycles
are substantially lower than those for the conventional engines having the best SFC.
Figure 18 Effect of HP compressor last blade height and
max climb OPR on max climb SFC for engines with 75%
intercooler effectiveness v. the best conventional engines
Figure 19 Improvements in mid-cruise SFC for intercooled
engines from Fig. 18 with optimised mid-cruise intercooler
effectiveness, OPR and TET v. the best conventional engines
69% effective-
ness
50% effective-
ness
50% effective-
ness
69% effective-
ness
reference engine non-intercooled
40
50
60
70
80
90
100
110
1500 1550 1600 1650 1700 1750 1800
Mid
-cru
ise
OP
R
Mid-cruise TET K
69% effective-ness and high OPR
50%
50% .effective-ness and low OPR
69%
reference engine non-intercooled
-4%
-3%
-2%
-1%
0%
1%
1500 1550 1600 1650 1700 1750 1800
Ch
ange
in m
id-c
ruis
e SF
C
Mid-cruise TET K
75 OPR inter-
cooled120 OPR intercooled
reference 100% thrust
scaled to 65% thrust
scaled to 40% thrust
scaled to 25% thrust
-6%
-4%
-2%
0%
2%
4%
6%
8%
10%
6 8 10 12 14 16 18 20
Ch
ange
in m
ax c
limb
SFC
HP Compressor last blade height mm
75 OPR inter-
cooled120 OPR
intercooled
reference 100% thrust
scaled to 65% thrust
scaled to 40% thrust
scaled to 25% thrust
-6%
-4%
-2%
0%
2%
4%
6%
8%
10%
6 8 10 12 14 16 18 20
Ch
ange
in m
id-c
ruis
e S
FC
HP Compressor last blade height mm
14 ISABE 2017-22659
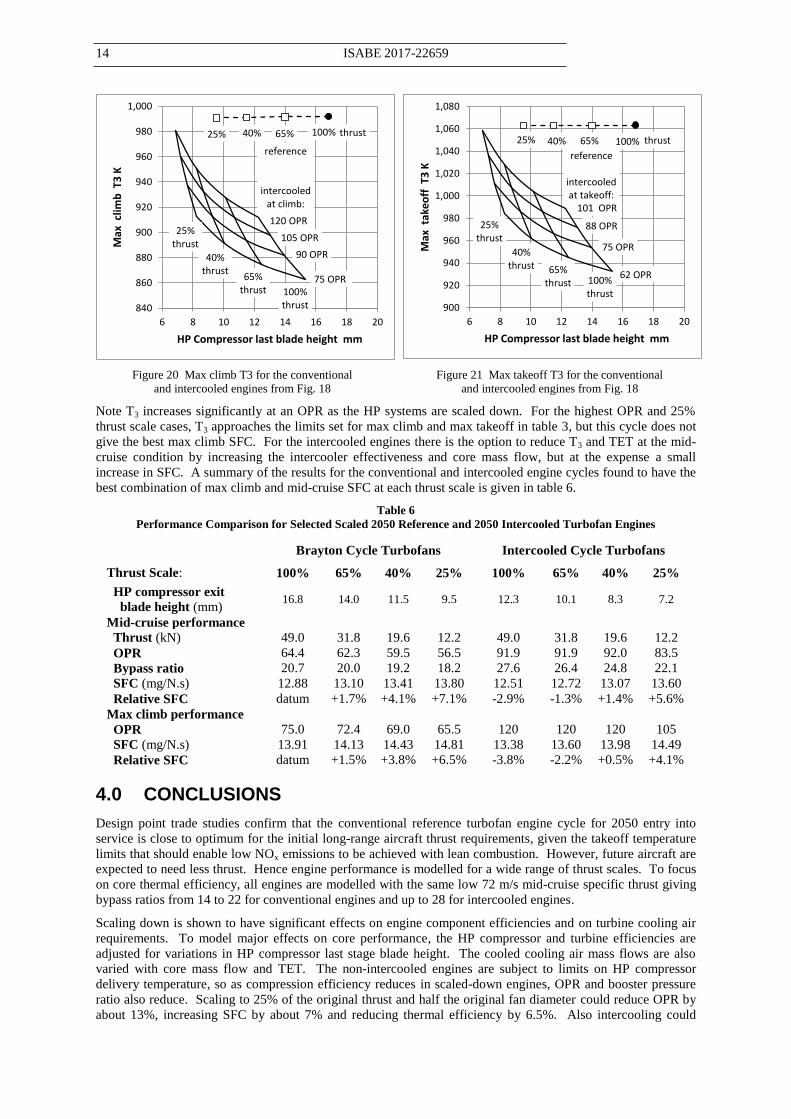
Figure 20 Max climb T3 for the conventional
and intercooled engines from Fig. 18
Figure 21 Max takeoff T3 for the conventional
and intercooled engines from Fig. 18
Note T3 increases significantly at an OPR as the HP systems are scaled down. For the highest OPR and 25%
thrust scale cases, T3 approaches the limits set for max climb and max takeoff in table 3, but this cycle does not
give the best max climb SFC. For the intercooled engines there is the option to reduce T3 and TET at the mid-
cruise condition by increasing the intercooler effectiveness and core mass flow, but at the expense a small
increase in SFC. A summary of the results for the conventional and intercooled engine cycles found to have the
best combination of max climb and mid-cruise SFC at each thrust scale is given in table 6.
Table 6
Performance Comparison for Selected Scaled 2050 Reference and 2050 Intercooled Turbofan Engines
Brayton Cycle Turbofans Intercooled Cycle Turbofans
Thrust Scale: 100% 65% 40% 25% 100% 65% 40% 25%
HP compressor exit
blade height (mm) 16.8 14.0 11.5 9.5 12.3 10.1 8.3 7.2
Mid-cruise performance
Thrust (kN) 49.0 31.8 19.6 12.2 49.0 31.8 19.6 12.2
OPR 64.4 62.3 59.5 56.5 91.9 91.9 92.0 83.5
Bypass ratio 20.7 20.0 19.2 18.2 27.6 26.4 24.8 22.1
SFC (mg/N.s) 12.88 13.10 13.41 13.80 12.51 12.72 13.07 13.60
Relative SFC datum +1.7% +4.1% +7.1% -2.9% -1.3% +1.4% +5.6%
Max climb performance
OPR 75.0 72.4 69.0 65.5 120 120 120 105
SFC (mg/N.s) 13.91 14.13 14.43 14.81 13.38 13.60 13.98 14.49
Relative SFC datum +1.5% +3.8% +6.5% -3.8% -2.2% +0.5% +4.1%
4.0 CONCLUSIONS
Design point trade studies confirm that the conventional reference turbofan engine cycle for 2050 entry into
service is close to optimum for the initial long-range aircraft thrust requirements, given the takeoff temperature
limits that should enable low NOx emissions to be achieved with lean combustion. However, future aircraft are
expected to need less thrust. Hence engine performance is modelled for a wide range of thrust scales. To focus
on core thermal efficiency, all engines are modelled with the same low 72 m/s mid-cruise specific thrust giving
bypass ratios from 14 to 22 for conventional engines and up to 28 for intercooled engines.
Scaling down is shown to have significant effects on engine component efficiencies and on turbine cooling air
requirements. To model major effects on core performance, the HP compressor and turbine efficiencies are
adjusted for variations in HP compressor last stage blade height. The cooled cooling air mass flows are also
varied with core mass flow and TET. The non-intercooled engines are subject to limits on HP compressor
delivery temperature, so as compression efficiency reduces in scaled-down engines, OPR and booster pressure
ratio also reduce. Scaling to 25% of the original thrust and half the original fan diameter could reduce OPR by
about 13%, increasing SFC by about 7% and reducing thermal efficiency by 6.5%. Also intercooling could
75 OPR.
reference
intercooled at climb:
thrust
65% thrust
40% thrust
25% thrust
100%65%40%25%
100% thrust
90 OPR
105 OPR
120 OPR
840
860
880
900
920
940
960
980
1,000
6 8 10 12 14 16 18 20
Max
clim
b T
3 K
HP Compressor last blade height mm
62 OPR
101 OPR
thrust
65% thrust
40% thrust
25% thrust
100%65%40%25%
100% thrust
reference
intercooled at takeoff:
75 OPR
88 OPR
900
920
940
960
980
1,000
1,020
1,040
1,060
1,080
6 8 10 12 14 16 18 20
Max
tak
eoff
T3
K
HP Compressor last blade height mm
A ROLT ET AL. ISABE 2017-22659 15
reduce mid-cruise SFC by about 3% for the larger engines and by 2% for the smaller engines, and reduce max
climb SFC by nearly 4% in the larger engines and by 2% in the smaller engines.
This study considers the potential of future cycles to achieve high overall efficiency and low SFC, but with no
mechanical design or engine operability assessments at this stage. Axi-centrifugal HP compressors might be
substituted for all-axial compressors in smallest cores. The cycles with the lowest mid-cruise SFC may not be
the overall optimum cycles, because geared fan engines with slightly lower OPR and smaller core mass flows
are likely to be lighter. Practical considerations mean that the fuel burn optimum and economic optimum
designs are likely to back-off from cycles with the highest OPR and lowest SFC, made possible by having
cooled cooling air and/or intercooling. This applies particularly to the smaller thrust-scale engines. Very high
OPR cycles pose particular design challenges including, more highly loaded bearings, compressors and turbines
needing extra stages, and more variable stages on each compressor. Without further research and innovative
design these challenges could prevent the ambitious 2050 SFC targets being achieved. However intercooling
and cooled cooling air technologies would provide the core turbomachinery with more benign thermal
environments that should help with other issues including component life, heat to oil, and tip clearance control.
This study provides a foundation for the assessment of SFC and fuel burn in ongoing ULTIMATE studies of
more complex cycles featuring additional combinations of advanced technologies.
ACKNOWLEDGMENTS
This project has received funding from the European Union’s Horizon 2020 research and innovation
programme under Grant Agreement No. 633436. The authors are grateful to Cranfield University, Chalmers
University of Technology, and Rolls-Royce plc for permission to publish this paper. Figures 1 and 3 are
reproduced courtesy of the NEWAC Consortium and Rolls-Royce plc.
REFERENCES
1. PARKER R. Challenges of Advanced Propulsion Systems Development for Future Civil Air Transport,
General Lecture 1, ICAS-2014-0.2 ICAS Conference 2014, St. Petersburg, Russia, 9 September 2014.
2. GRÖNSTEDT T. et al. Ultra Low Emissions Technology Innovations for Mid-century Aircraft Turbine
Engines, GT2016-56123, ASME Turbo Expo 2016, Seoul, Korea, June 2016.
3. ULTIMATE project website: http://www.ultimate.aero
4. ACARE. Realising Europe’s vision for aviation, Strategic Research & Innovation Agenda, Volume 1,
Advisory Council for Aviation Research and Innovation in Europe, 2012.
5. ROLT A. and BAKER N. Intercooled Turbofan Engine Design and Technology Research in the EU Framework
6 NEWAC Programme, ISABE-2009-1278, ISABE 2009 Conference, Montreal, Canada, 2009.
6. ROLT A. and KYPRIANIDIS K. Assessment of New Aeroengine Core Concepts and Technologies in the EU
Framework 6 NEWAC Programme, ICAS-2010-408, ICAS Conference 2010, Nice, France, September 2010.
7. KYPRIANIDIS K. and ROLT A. On the Optimisation of a Geared Fan Intercooled Core Engine Design, Journal
of Engineering for Gas Turbines and Power, 2015, Vol. 137(4) 041201.
8. CAMILLERI W. et al. Performance characteristics and optimisation of a geared intercooled reverse flow core
engine, Proc IMechE Part G; Journal of Aerospace Engineering, 2015, Vol. 229(2) 269-279.
9. CAMILLERI W. et al. Concept description and assessment of the main features of a geared intercooled reversed
flow core engine, Proc IMechE Part G; Journal of Aerospace Engineering, 2015, Vol. 229(9) 1631-1639.
10. ANSELMI E. et al. Assessment of the low pressure turbine exhaust design challenges in a Geared Intercooled
Reversed Flow Core Engine, ISABE-2015-20200, ISABE 2015 Conference, Phoenix, USA, October 2015.
11. ZHAO X. and GRÖNSTEDT T. Conceptual Design of a two-pass cross-flow aeroengine intercooler, Proc
IMechE Part G; Journal of Aerospace Engineering, 2015, Vol. 229(11) 2006-2023.
12. WALSH P. and FLETCHER P. Gas Turbine Performance, second edition 2004, Blackwell Science, ISBN
97806320064342.