
Scale Does Matter - gazprom.ru
69
0 Investor Day 2012 Gazprom Investor Day Scale Does Matter February 2012
Transcript of Scale Does Matter - gazprom.ru

0 Investor Day 2012
Gazprom Investor Day
Scale Does Matter
February 2012

1
Investor Day 2012 1
Disclaimer
This presentation has been prepared by OJSC Gazprom (the “Company”), and comprises the slides for a presentation to investors concerning the Company.
This presentation does not constitute or form part of any offer or invitation to sell or issue, or any solicitation of any offer to purchase or subscribe for, any
shares or other securities representing shares in the Company, nor shall it or any part of it nor the fact of its presentation or distribution form the basis of, or be
relied on in connection with, any contract or investment decision.
No reliance may be placed for any purposes whatsoever on the information contained in this presentation, or any other material discussed at any presentation
or on its completeness, accuracy or fairness. The information in this presentation should not be treated as giving investment advice. Care has been taken to
ensure that the facts stated in this presentation are accurate, and that the opinions expressed are fair and reasonable. However, the contents of this
presentation have not been verified by the Company. Accordingly, no representation or warranty, express or implied, is made or given by or on behalf of the
Company or any of its members, directors, officers or employees or any other person as to the accuracy, completeness or fairness of the information or
opinions contained in or discussed at this presentation. None of the Company or any of their respective members, directors, officers or employees nor any
other person accepts any liability whatsoever for any loss howsoever arising from any use of this presentation or its contents or otherwise arising in connection
therewith.
The information in this presentation includes forward-looking statements. These forward-looking statements include all matters that are not historical facts,
statements regarding the Company’s intentions, beliefs or current expectations concerning, among other things, the Company’s results of operations, financial
condition, liquidity, prospects, growth, strategies, and the industry in which the Company operates. By their nature, forward-looking statements involve risks
and uncertainties, including, without limitation, the risks and uncertainties to be set forth in the prospectus, because they relate to events and depend on
circumstances that may or may not occur in the future. The Company cautions you that forward looking statements are not guarantees of future performance
and that its actual results of operations, financial condition and liquidity and the development of the industry in which the Company operates may differ
materially from those made in or suggested by the forward-looking statements contained in this presentation. In addition, even if the Company’s results of
operations, financial condition and liquidity and the development of the industry in which the Company operates are consistent with the forward-looking
statements contained in this presentation, those results or developments may not be indicative of results or developments in future periods.
The information and opinions contained in this presentation are provided as at the date of this presentation and are subject to change without notice. No
person is under any obligation to update or keep current the information contained herein.
By attending the presentation you agree to be bound by the foregoing limitations.
Investor Day 2012
2
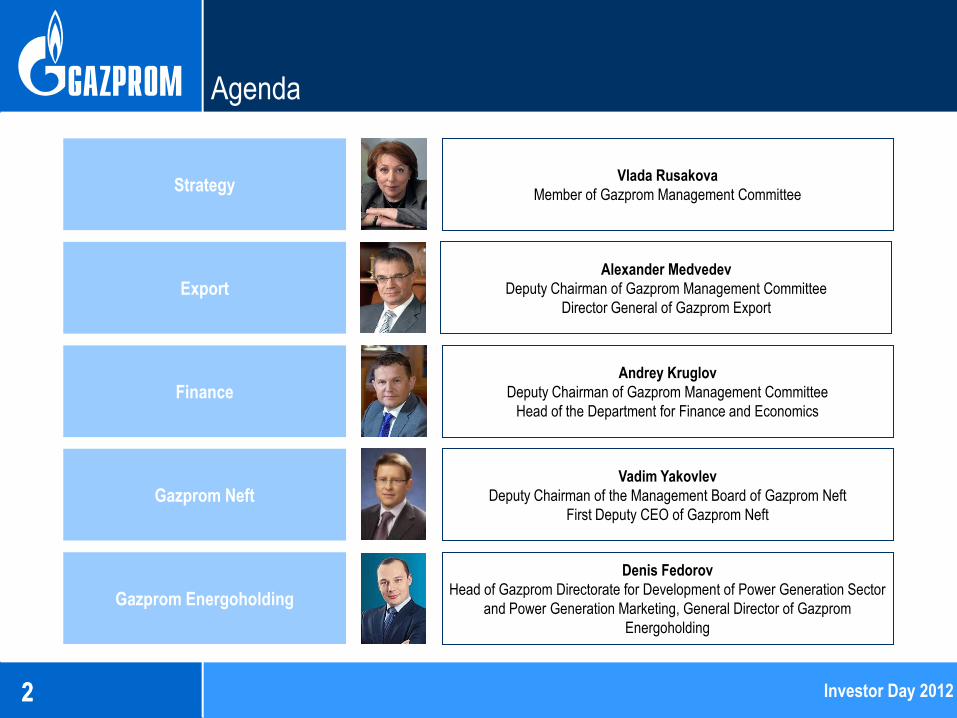
Agenda
Export Alexander Medvedev
Deputy Chairman of Gazprom Management Committee
Director General of Gazprom Export
Strategy
Finance
Vlada Rusakova
Member of Gazprom Management Committee
Andrey Kruglov
Deputy Chairman of Gazprom Management Committee
Head of the Department for Finance and Economics
Gazprom Neft
Gazprom Energoholding
Denis Fedorov
Head of Gazprom Directorate for Development of Power Generation Sector
and Power Generation Marketing, General Director of Gazprom
Energoholding
Vadim Yakovlev
Deputy Chairman of the Management Board of Gazprom Neft
First Deputy CEO of Gazprom Neft
2 Investor Day 2012
3
Investor Day 2012
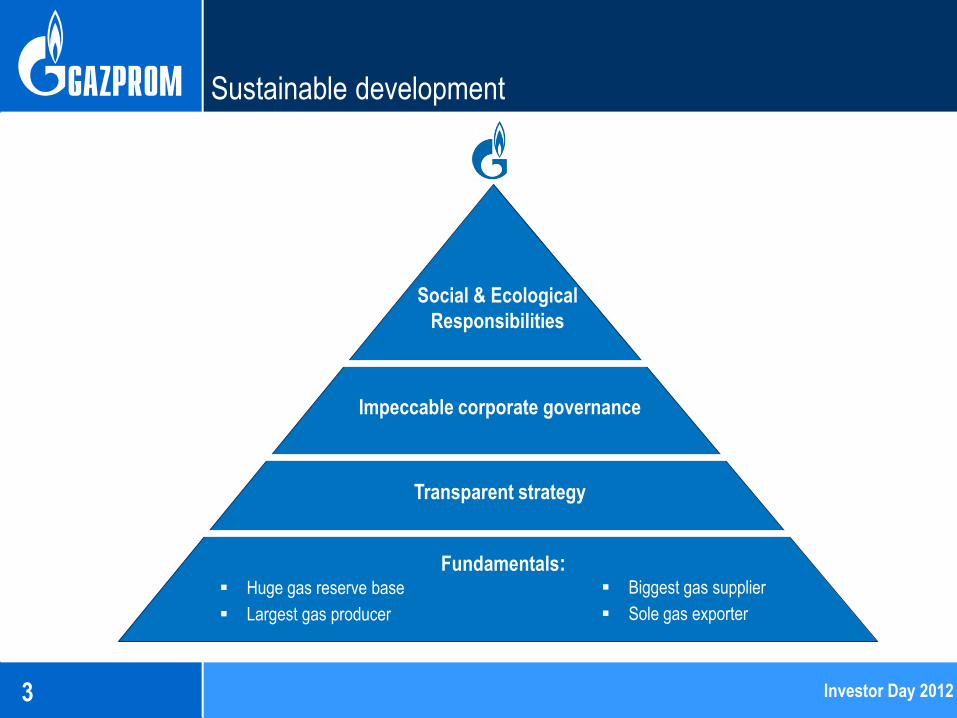
Sustainable development
Investor Day 2012
Fundamentals: Huge gas reserve base
Largest gas producer
Biggest gas supplier
Sole gas exporter
Transparent strategy
Impeccable corporate governance
Social & Ecological
Responsibilities

4
Strategy
Part 1. Vlada Rusakova
Member of Gazprom Management Committee
Investor Day 2012

5
Investor Day 2012
Gas demand 2030
Share of gas in World energy consumption
2009
2030F
21%
26%
– Natural Gas
– Other
Gas consumption by region(1)
– Asia/Oceania
– Latin America
– Europe(2)
– FSU(3)
– Africa
– Middle East
– North America
5.1 tcm
2010 2030F
3.2 tcm
1.1
1.1
0.9
0.8
0.7
0.3 0.2
1. Cubic meter – 8,850 kcal 2. Including Baltic States 3. Excluding Baltic States
Source: Gazprom
Strategy - Investor Day 2012
6
Investor Day 2012
0
1
2
3
4
5
6
2005 2006 2007 2008 2009 2010 2011 2012
1:1 1:2 1:3 1:4 1:5 6:1
5:1
4:1
3:1
2:1
1:1
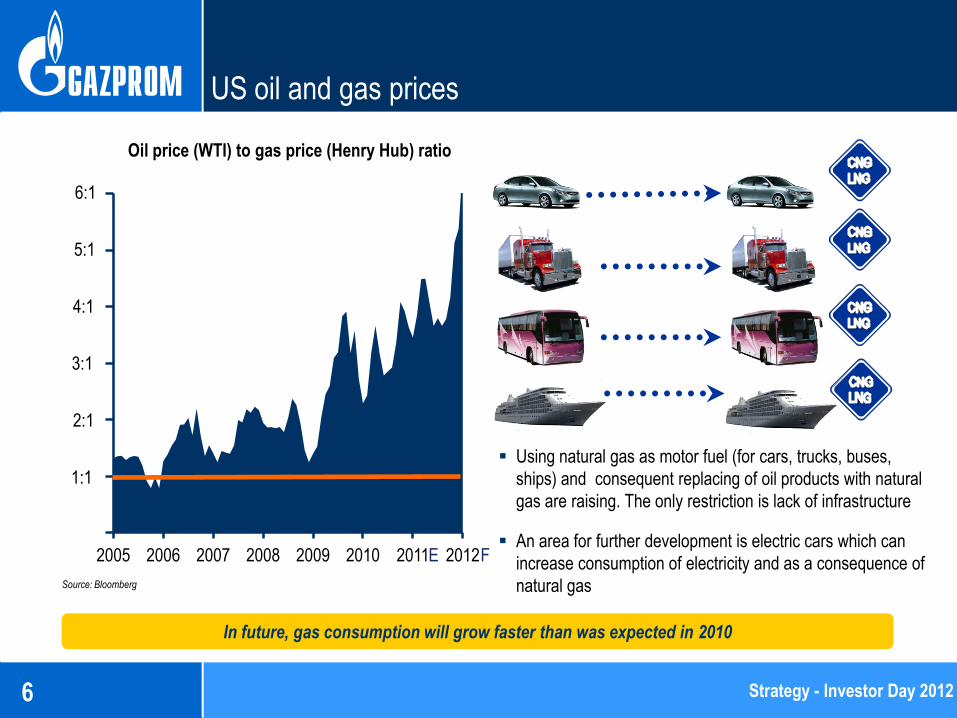
Oil price (WTI) to gas price (Henry Hub) ratio
US oil and gas prices
Source: Bloomberg
In future, gas consumption will grow faster than was expected in 2010
Using natural gas as motor fuel (for cars, trucks, buses,
ships) and consequent replacing of oil products with natural
gas are raising. The only restriction is lack of infrastructure
An area for further development is electric cars which can
increase consumption of electricity and as a consequence of
natural gas
Strategy - Investor Day 2012
E F

7
Investor Day 2012
– Consumption
– Production
Middle East
Global gas balance
Source: Gazprom
bcm
North America
Latin America
Asia/Oceania
FSU
Africa
Europe
0
300
600
900
1200
1500
2010 2020F 2030F
0
300
600
900
1200
1500
2010 2020F 2030F
0
300
600
900
1200
1500
2010 2020F 2030F
0
300
600
900
1200
1500
2010 2020F 2030F
0
300
600
900
1200
1500
2010 2020F 2030F
0
300
600
900
1200
1500
2010 2020F 2030F 0
300
600
900
1200
1500
2010 2020F 2030F
Europe and Asia are two most important markets
Strategy - Investor Day 2012

8
Investor Day 2012
Strategic tasks of gas business
Retain current position in
the Russian market
Gain 32% in the
European market
Diversify markets by
entering into the most
promising North-East
Asian market (13%
market share)
Expand LNG business
(14% of world production)
Exploration &
Production Transportation & UGS
Distribution &
Marketing
Develop new production
regions:
– Yamal peninsula
– Eastern Siberia & the
Far East
– Russian continental
shelf
Prioritize development of
fields located close to
existing UGSS
infrastructure
Reconstruction within
UGSS
Create gas pipelines to
transport gas from new
production regions
Diversify export pipeline
routes:
– Nord Stream
– South Stream
Develop unified gas
supply system in the
East of Russia
Increase UGS capacity
Strategy - Investor Day 2012
Note: UGS is underground gas storage UGSS is unified gas supply system

9
Investor Day 2012
Shtokman
Prospective sources of Gazprom’s gas production
Eastern Siberia and
the Far East New fields in Nadym-
Pur-Taz
bcm
Yamal
0
100
200
300
400
500
600
700
800
2010 2020F 2030F Currently existing projects New fields in Nadym-Pur-Taz Yamal Megaproject Shtokman Project Eastern Siberia and the Far East
0
100
200
300
400
2010 2020F 2030F
0
100
200
300
400
2010 2020F 2030F
0
100
200
300
400
2010 2020F 2030F
0
100
200
300
400
2010 2020F 2030F
bcm
Strategy - Investor Day 2012

10
Investor Day 2012
Gazprom’s priority projects in transportation
Existing Under construction Planned
Project
Length,
km
Linear part Compressor
station
Capacity,
bcmpa km
Ø,
mm
P,
MPa unit MW
UNDER CONSTRUCTION
Nord Stream 1224 1224 + 1224 (2 lines)
1200 22/17 - - 55
Gryazovets – Vyborg
917 891 + 705 (incl. looping)
1420/1220 9.8 5 + 2 538 + 617 59
Pochinki – Gryazovets
650 650 1420 7.4 5 + 1 516 + 64 till 36
Bovanenkovo – Ukhta
1110 2212 (2 lines)
1420 11.8 9 1842 115
SRTO – Torzhok 2200 2200 1420 7.4 10 + 3 728 + 240 28.5
Ukhta – Torzhok (1 stage)
1371 1371 1420 9.8 8 805 45 (1 line)
PLANNED
South Stream 930 930 813 27.5 - - 63
Expand UGSS to enable gas supply via South Stream pipeline
2956 2446 1400-700 11.8/7.4 10 1475 63
Murmansk – Volkhov
1365 1365 1420 9.8 max 5 max 625 22-33
XXXX – already built, XXXX – under construction/planned
Strategy - Investor Day 2012

11
Investor Day 2012
0
10
20
30
40
1999 2002 2005 2008 2010
0
5
10
15
2002-2003 2004-2006 2007-2010 2011E-2013F
Energy efficiency
11
Natural gas savings – 30.6 bcm
Heat energy savings – 2,449 th. Gcal
0
250
500
750
1,000
2002-2003 2004-2006 2007-2010 2011E-2013F
Electricity savings – 3,392 mm kWh
36.2 mm tce total energy savings in 2002-2013F
12%
86%
1% 1%
Production
Transportation & underground gas storage
Processing
Other
Gas consumption of Gazprom’s gas trunking processes
0
500
1,000
1,500
2002-2003 2004-2006 2007-2010 2011E-2013F
Strategy - Investor Day 2012
Cm/ mm cm*km
th. Gcal
mm kWh
bcm

12
Investor Day 2012
Development of Gazprom’s business in East Siberia and the Far East
GAS RESERVES (А+В+С1+С2), bcm
Onshore 177 3,756
Offshore - 1,021(1)
Total: 177 4,777
1. Including Gazprom’s 50% share in Sakhalin-2 project
CAPACITY OF GAS TRANSPORTATION SYSTEMS, bcm
Sakhalin — Khabarovsk — Vladivostok (the first start-up complex) - 6
Sakhalin-2 fields — LNG plant - 15
Sobolevo — Petropavlovsk-Kamchatsky - 1
Total: - 22
LNG CAPACITIES, mm t
Sakhalin-2 - 9.6
Strategy - Investor Day 2012
01.01.2007 01.01.2012

13
Investor Day 2012
Potential economic effect as result of innovation
13
Implementation of technological priorities ensures an extra potential economic effect of 450 bln RR
15.7
83.1
55.6
54.6
45.9
18.7
159.2
16.9
NPV, bln RR
Technology to improve gas transportation efficiency
Technology to develop hydrocarbon resources in continental shelf
Gas processing and petrochemical technology
Technology for developing hydrocarbon resources in permafrost areas
Gas sale and utilization technology
Technology to improve gas storage efficiency Hydrocarbon production technology on existing fields
Hydrocarbon fields exploration technology, including
development of alternative resources
450
Strategy - Investor Day 2012

14
Investor Day 2012
Gas CAPEX 2012-2030F
Structure of CAPEX by business segment
(average annual) Structure of CAPEX by major project
(2012F-2030F in total)
EXPLORATION
PRODUCTION
TRANSPORT
(incl. UGS)
PROCESSING
OTHER
47%
31%
6%
8%
8%
700-900 bln RR p.a.
Shtokman project
Yamal Megaproject
Eastern Siberia and the Far East
Transport System Development (incl. UGS)
Reconstruction in Transport
Currently existing projects in Production
Other projects within UGSS
14%
29%
8% 8%
15%
6%
20%
(exploration; new production and drilling
(excl. Yamal and Shtokman); processing;
others)
Strategy - Investor Day 2012
Note: UGS is underground gas storage UGSS is unified gas supply system

Export
Part 2. Alexander Medvedev
Deputy Chairman of Gazprom Management Committee
Director General of Gazprom Export
15 Investor Day 2012

Департамент стратегического развития 16
-10.0%
-6.0%
-2.0%
2.0%
6.0%
10.0%
2000
2001
2002
2003
2004
2005
2006
2007
2008
2009
2010
2011
E
European natural gas market dynamics
European gas consumption and imports in 2011E
2008 2009 2010 2011E 2011E/10,
bcm
2011E/10,
%
Consumption (bcm) 600.7 565.2 609.8 563.5 -46.4 -7.6%
Domestic production (bcm) 320.0 307.0 311.6 293.8 -17.8 -5.7%
Imports(1) (bcm) 280.3 258.2 298.2 269.7 -28.5 -9.6%
Source: International Energy Agency, Eurostat, Gazprom Export. Gas calorific value: 1cm = 37 MJ
0
10
20
30
40
50
60
70
80
90
0 5,000 10,000 15,000 20,000
Co
nsu
mp
tio
n (m
on
thly
), b
cm
Monthly Weather Index
Net heating & cooling degree days
Source: Gazprom Export (based upon annualized HDD/CDD for Europe)
110 115 120 125 130 135 140 145 150 155 160
95 100 105 110 115 120 125 Co
nsu
mp
tio
n(1
) (q
uar
terl
y), b
cm
Sea
son
ally
Ad
just
ed
GDP SA Index (2001Q1=100)
Natural gas consumption correlates primarily to weather conditions, not GDP
11 Year
Average
Export - Investor Day 2012
+5%
-5%
+10%
-10%
Source: Gazprom Export (based upon monthly HDD/CDD for Europe) 1. Including balance of gas storage

Департамент стратегического развития 17
77
101 97 97
57 70 71 75
$61 $89 $111
$159 $202
$232
$301 $320
0
50
100
150
200
250
300
350
0
20
40
60
80
100
120
2005 2006 2007 2008 2009 2010 2011E 2012F
Volumes Average FSU Price
154 156 153 160 141 139
150 154
156 162 169 168
148 148 160
164
$192
$262 $269
$407
$297 $302
$384 $415
0
150
300
450
600
0
50
100
150
2005 2006 2007 2008 2009 2010 2011E 2012F
Export Volumes Other Deliveries Average European Price
27%
73%
30%
70%
Gazprom Other Suppliers
32%
68%
17
Gazprom sales to European and FSU markets
USD/mcm
Gazprom Group gas deliveries to Europe
Projected Gazprom European market share
Gazprom Group gas deliveries to FSU
Gazprom’s portfolio includes long term
contracts ensuring Minimum Annual
Quantities (MAQ) of 4 trillion cubic meters
of gas to Europe over the period
2012 - 2030
Source: Gazprom estimates
bcm bcm USD/mcm
2011E 2020F 2030F
Export - Investor Day 2012

Департамент стратегического развития 18
0
100
200
300
400
500
600
700
800
900
2010
2011
E
2012
F
2013
F
2014
F
2015
F
2016
F
2017
F
2018
F
2019
F
2020
F
2021
F
2022
F
2023
F
2024
F
2025
F
2026
F
2027
F
2028
F
2029
F
2030
F
bcm
Range of production forecasts Range of consumption forecasts Production consensus forecast Consumption consensus forecast
270
bcm
370
bcm
400
bcm
The gap is widening between European indigenous production and consumption
The gap is widening…
Source: Consensus projections derived from EIA, CERA, Greenpeace, IEA, EuroGas, PIRA, EC, Cedigaz
Export - Investor Day 2012

Департамент стратегического развития 19
800
529
1,154
756
986
831
1,653 1,517
0
500
1000
1500
2000
2010 2030 Average IEA HIS CERA EGAF Eurogas Eurelectric
TW
h
965
625
Electricity produced from natural gas in 2030 carbon reduction road maps
Anticipated market - Marine bunkering sector Anticipated market - Automotive sector
Natural gas demand growth potential by sector
bcm bcm
217
90
49
191
80
28 24
-50
50
150
250
2010
2011
E
2012
F
2013
F
2014
F
2015
F
2016
F
2017
F
2018
F
2019
F
2020
F
2021
F
2022
F
2023
F
2024
F
2025
F
2026
F
2027
F
2028
F
2029
F
2030
F
Global consumption, CERA Global consumption, Pace Global
European consumption, Pace Global
-50
50
150
250
2010
2011
E
2012
F
2013
F
2014
F
2015
F
2016
F
2017
F
2018
F
2019
F
2020
F
2021
F
2022
F
2023
F
2024
F
2025
F
2026
F
2027
F
2028
F
2029
F
2030
F
Global consumption, CERA European consumption, Pace Global
European consumption, CERA European consumption, Eurogas
2010 2030F
Export - Investor Day 2012
Update: December 2011
1,000

Департамент стратегического развития 20
180 mm t
coal (1)
20
Renewable subsidies and other
incentives are equal to €820 bln
or 53% of the total All-In cost of
renewable generation over the
next 20 years.
Cumulative cost advantages of gas-optimized scenario, Euro bln
Subsidies 53%
€820 bln
€1550 bln
Source: Pace Global
700 1650
1200 2500
850
capital expenditures
350- 400
operational expenditures
450- 500 total
savings 150 bcm
natural gas
135 mm t
fuel oil (1)
Exp
ort
vo
lum
es i
n 2
011E
= =
1. by calorific value
CO2 emissions
278 m t 525 m t 415 m t
Gas is the best fossil fuel and the cheapest path to reach EU CO2 reduction targets
Gas-optimized
scenario
Renewables
60%
Source: McKinsey for the European Gas Advocacy Forum
2030F 2050F
Export - Investor Day 2012

Департамент стратегического развития 21
Hub and contract prices
Sources: BMWi, Bloomberg, European Central Bank
Hybrid pricing - cornerstone of the European market
USD per mcm
Importers are disadvantaged by reforms, not Gazprom
USD per mcm
Hub Prices
Contract Prices
Churn ratio remains below 5 at all continental hubs
A large portion of natural gas traded at the hubs is
derived from long term oil-indexed contracts
Hybrid pricing mechanism should be adjusted to
facilitate synergies and fairness in competition
“Free riders” produce no gas and have no import
contracts. They do not pay full cost for gas storage
and structuring of deliveries
Export - Investor Day 2012
! Only for small volumes
0
100
200
300
400
500
600
Jan-08 Jun-08 Nov-08 Apr-09 Sep-09 Feb-10 Jul-10 Dec-10 May-11 Oct-11
NWE long-term contracts proxy (Platts) BAFA TTF month ahead LNG import price, Japan

Департамент стратегического развития 22
174.9
184.4
220.6
247.1 257.3 264.5 266.0
280.6
0
50
100
150
200
250
300
2008 2009 2010 2011E 2012F 2013F 2014F 2015F
4%
6%
8%
10%
12%
14%
16%
18%
2001-2005 Headline slopes as low as 4-6%,
S-curves
2005-2006 Discussions on
S-curve eliminations
Late 2006-2008 Record high
slopes agreed: 16-17%
2009-2010 14.85% - benchmark slope
for conventional LNG, 14-14.5% for CBM/FLNG
with S-curve
2011E-2012F Market remains tight as
nuclear situation in Japan takes time to
resolve
Long term contracts - oil parity level development in
the Asia-Pacific region
The Asia-Pacific region is a main source of growth: demand is strong with
prices continuing to rise, boosted by the earthquake in Japan
Asia attracts spare LNG volumes, including those redirected from Europe
LNG supply growth is limited in the next few years: the situation is unlikely
to change dramatically
Lack of excess LNG volumes will support European long-term contracts
pricing mechanisms
Asian market – Key pillar for LNG growth
Global LNG production volume
Source: Woodmac
Source: Bloomberg, Platts Source: Gas Strategies, Platts, Poten
CAGR
2011E-2015F
12%
CAGR
2011E-2015F
3%
0
2
4
6
8
10
12
14
16
18
20
22
0
2
4
6
8
10
12
14
16
18
20
22
Sep 10
Oct 10
Nov 10
Dec 10
Jan 11
Feb 11
Mar 11
Apr 11
May 11
Jun 11
Jul 11
Aug 11
Sep 11
Oct 11
Nov 11
Dec 11
Jan 12
Feb 12
Mar 12
Apr 12
May 12
Forward curves
USD/mm btu
Brent HH NBP JKM
Oil Parity
Kashiwazaki-
Kariwa power
plant
shutdown
Fears about LNG
demand surge in
the US
New LNG
projects
announced
Earthquake in
Japan, nuclear
power plants
shutdowns
Export - Investor Day 2012
mm t
+$14
+$5

Департамент стратегического развития 23
Russia
Nigeria
Egypt
Qatar
Australia
USA
Japan
India
China
Korea
Taiwan
Thailand
Dubai
Kuwait
UK
Portfolio supply sources and destinations (2011E)
Gazprom LNG portfolio shows steady growth
Geographic diversification increases, both in terms of supply sources and marketing destinations – presence in both
Atlantic and Pacific basins
Access to shipping capacity supports portfolio flexibility
Long-term charter agreements for two newly build LNG carriers signed in addition to existing fleet of chartered
LNG vessels
Gazprom – growing presence in LNG market
Traded volume dynamics (1)
Export - Investor Day 2012
1.2
2.1
1.2
0.2 0.3 0.4 0.5
0.7
0.4 1.8
0.2 0.3 0.4 0.5
1.8
2.4
3.0
2005 2006 2007 2008 2009 2010 2011E
Russia Non-Russia
1. Totals may not sum due to rounding
bcm delivered

Investor Day 2012
25
Finance
Part 3. Andrey Kruglov
Deputy Chairman of Gazprom Management Committee
Head of the Department for Finance and Economics
Investor Day 2012

25
Investor Day 2012
70%
85%
100%
115%
130%
J F M A M J J A S O N D
Gazprom MICEX
Investing in Gazprom should be viewed as safe and liquid
2%
4%
6%
8%
J F M A M J J A S O N D J Gazprom 6.51% due 2022 Russia 5% due 2020
6.8
9.0
11.8 11.1
7.3
4.9 4.4 4.0
12.7
10.3 9.4
11.2
9.3 10.0 8.7 8.3
0
5
10
15
2004 2005 2006 2007 2008 2009 2010 2011E
Gazprom Oil&Gas Majors median
4.9
6.2
8.0 7.4
5.1 4.2
3.7 3.2
5.7 5.0
4.6 5.6
4.6 4.7 4.3 4.1
0
2
4
6
8
10
2004 2005 2006 2007 2008 2009 2010 2011E
Gazprom Oil&Gas Majors median
Gazprom shares and bonds: liquid Russian securities
Gazprom share price performance (2011) Bonds YTM (2011)
Source: Gazprom data, Bloomberg, FactSet 1. Average 1-year forward multiples. Oil & Gas Majors are the top 10 oil and gas companies by market capitalization as of the beginning of 2012,excluding Gazprom
EV/EBITDA multiple evolution(1) P/E multiple evolution(1)
Theoretical
potential
Theoretical
potential
Finance - Investor Day 2012

26
Investor Day 2012
Strong financials: potential for future growth
11%
7% 9%
8%
3% 1%
0%
5%
10%
15%
Revenue EBITDA Net income
CAGR Gazprom for 2006-2010 CAGR of oil & gas majors’(1) on average for 2006-2010
1. Oil & Gas Majors are the top 10 oil and gas companies by market capitalization as of the beginning of 2012,excluding Gazprom 2. Converted using the annual average exchange rate as of the respecting period 3. Adjusted EBITDA is defined as operating profit before depreciation and changes in assets, impairment provision (impairment of accounts receivable and prepayments, assets under construction, investments and
other long-term assets, inventory) 4. Data are converted in USD using exchange rate USD 1 = 30.24 RR at the end of 2009, USD 1 = 30.48 RR at the end of 2010, USD 1 = 30.40 at the end of 9m2010, USD 1 = 31.88 at the end of 9m2011 5. Net of custom duties and VAT
2009 2010 9m 2010 9m 2011 2011E
Total sales revenue(2)(5)
USD bln 94.2 118.4 82.5 114.6 155
Adj. EBITDA(2)(3), USD bln 34.3 44.7 31.7 47.9 63
Adj. EBITDA margin 36% 38% 38.4% 41.8% 41%
Gazprom’s net income —
the highest in the industry
2009 2010 9m 2010 9m 2011 2011E
Net Debt(4), USD bln 45.4 28.6 32.0 32.8 34
Total debt(4), USD bln 53.8 43.2 42.5 44.9 48
T. Debt / Adj. EBITDA (LTM) 1.49x 0.97x 1.0x 0.8x 0.8x
(1)
Comparative 5Y CAGR
Gazprom’s financials
Finance - Investor Day 2012
High net income is expected to deliver increased dividend payout

27
Investor Day 2012
Well-managed CAPEX
.
1. Data are converted in USD using exchange rate USD 1 = 30.36 RR in 2010; USD 1 = 28.3 RR in 2011 and Gazprom’s budget exchange rate forecast for 2012 (USD 1 = 28.7 RR in 2012)
0
10
20
30
40
50
60
2010 2011E 2012F
34 USD bln (1) 35 USD bln (1)
50 USD bln (1)
USD bln
Transportation
Production
Other segments
(Including gas storage,
gas processing and
Gas distribution)
Power & heat
generation
Gazprom Neft
CAPEX structure to provide:
– Production growth, depending on market
requirements
– Flexible company strategy in the future
Meticulous project prioritization allows rational
fund allocation
Cash CAPEX wholly financed with operating CF
Finance - Investor Day 2012
Gazprom Group cash CAPEX breakdown
Investment policy will allow Gazprom to respond to future market requirements and gas demand

28
Investor Day 2012
33.6 38.6
40.2 43.0 45.7
21.4%
-7.2%
12.2% 18.7% 10.7%
0
10
20
30
40
50
60
2008 2009 2010 2011E 2012F
Unit cost of gas production Producer price index
459.2
528.5
532.5
582.6 702.1
90.0(3)
272.0(3)
672.6
974.1
21.4%
-7.2%
12.2%
18.7% 10.7%
0
200
400
600
800
1,000
2008 2009 2010 2011E 2012F
Unit cost of gas production Mineral Extraction Tax (MET)
Producer price index
Effective cost management
Unit cost of gas production (1) Unit cost of gas transportation (2)
RR/1000 cm RR* 1000 cm/100km
1. Unit cost of gas production per 1000 cm of sale gas among 7 majors Gazprom ‘s subsidiaries . Excludes cost of OAO Gazprom 2. Unit cost of gas transportation includes cost per1000 cm of gas transported 100 km by Gazprom’s gas transportation subsidiaries. Excludes cost of OAO Gazprom. 3. Unit cost increase of gas production due to MET growth
Increase in cost of gas production and transportation (excluding one-off MET increase) is in line with current
inflation rate
Finance - Investor Day 2012

29
Investor Day 2012
0
500
1000
1500
2000
2500
3000
3500
4000
0
50
100
150
200
250
300
350
400
450
500
2000 2001 2002 2003 2004 2005 2006 2007 2008 2009 2010 2011E 2012E 2013E
Consumption in Russia Gazprom's account receivables turnover, days Gazprom's average domestic gas price
179d
98d 98d
48d
42d 36d 35d 38d
40d 49d
+16%
58d 59d +29%
In 2009 obligatory prepayments
for gas deliveries on the
domestic market were cancelled
Development of Russian gas market
+3% +2% -1% -7%
+7%
0%
+3%
+22% +2%
+4% +4%
+27% +31% +20%
+23% +11% +15%
+26%
+16%
+26%
+15% +8%
Average price,
RR/mcm
Consumption,
bcm +1%
Improvement of payment discipline
Sustainability of gas supply
Price liberalization
Recovery of gas consumption in Russian market
Finance - Investor Day 2012
2012F 2013F
-1%
Revenue growth due to price increase and volume recovery

30
Investor Day 2012
Impeccable credit history
45.4
28.6 32.8 34
8.4
14.6 12.1 12
48
0
10
20
30
40
50
60
2009 2010 9m2011LTM 2011E 2012F
Net debt Cash and equivalents Total debt
1.5
1.0 0.8 0.8 0.8
0.0
0.4
0.8
1.2
1.6
2009 2010 9m2011LTM 2011E 2012F
Total debt / adjusted EBITDA
Total and net debt(1)
USD bln
Main debt ratios
11.6
24.4 14.7
35.1
64.7
52.2
0
20
40
60
80
2007 2008 2009 2010 9m2011 2012F
Adjusted EBITDA/Gross interest
1%
3%
5%
7%
9%
2003 2004 2005 2006 2007 2008 2009 2010 9m2011
Weighted average fixed interest rate
Weighted average floating interest rate
Weighted average interest rate
Cost of debt financing
Finance - Investor Day 2012
Gazprom maintains a comfortable level of debt
(2)
1. Data are converted in USD using exchange rate USD 1 = 30.24 RR at the end of 2009, USD 1 = 30.48 RR at the end of 2010, USD 1 = 31.88 at the end of 9m2011 2. Gross interest is calculated as Interest expenses from Operating activities.
Max level 1.5-1.7

31
Investor Day 2012
Gazprom’s credit strength
1. S&P/Moody’s/ Fitch 2. Rating reflects bond ratings and not company ratings 3. Interpolated secondary curve spread to mid-swaps (MS) 4. Difference between 5Y MS-spread and interpolated Sovereign secondary MS-spread 5. The spreads are as of closing 7-February 6. Estimation, as Sovereign USD curve does not exist
Baa1/BBB/BBB
Baa1/BBB/BBB
Yes
+371bps
+140bps
Baa1/BBB/BBB
Baa1/BBB/BBB
Baa1/BBB/BBB
Yes
+204bps
+81bps
Baa1/BBB/BBB
A1/A+/A+
Aa3/AA-/A+
Yes
+141bps
-2bps(6)
Aa3/AA-/A+
Bond ratings(1)(2):
Sovereign rating:
State-controlled:
5Y MS-spread(3)(5):
Spread to
Sovereign(4)(5):
Company ratings:
A3/BBB/BBB
Baa2/BBB/BBB
Yes
+232bps
+137bps
A3/BBB/BBB
Finance - Investor Day 2012
Despite Gazprom’s strong credit ratings our bonds are trading at higher spreads than the international debt
capital market peers
32
Investor Day 2012
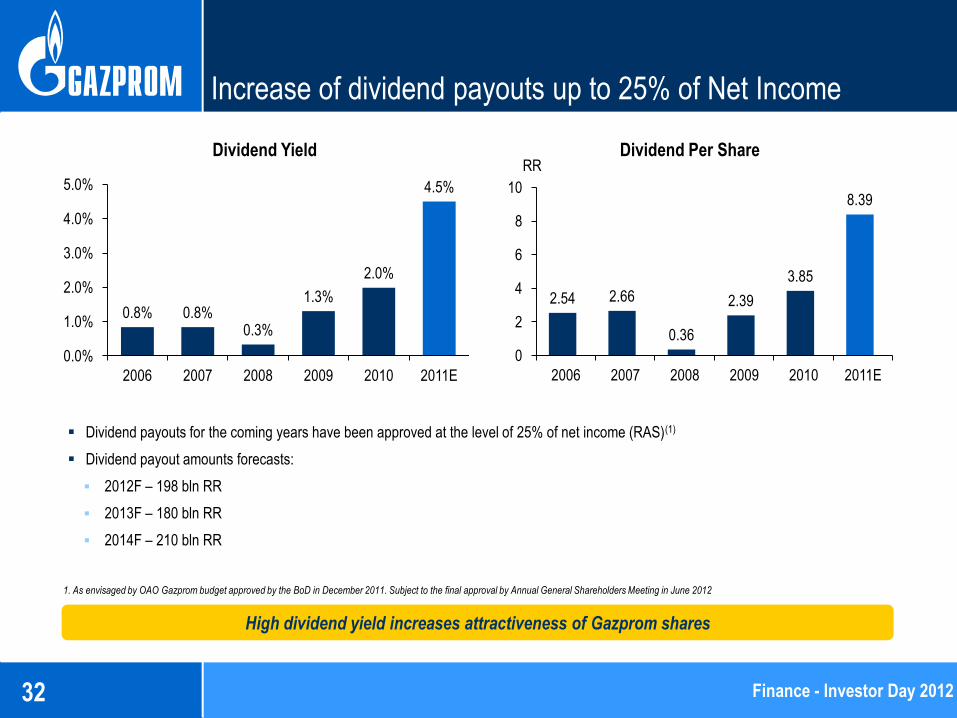
0.8% 0.8% 0.3%
1.3%
2.0%
4.5%
0.0%
1.0%
2.0%
3.0%
4.0%
5.0%
2006 2007 2008 2009 2010 2011E
Increase of dividend payouts up to 25% of Net Income
Dividend payouts for the coming years have been approved at the level of 25% of net income (RAS)(1)
Dividend payout amounts forecasts:
2012F – 198 bln RR
2013F – 180 bln RR
2014F – 210 bln RR
2.54 2.66
0.36
2.39
3.85
8.39
0
2
4
6
8
10
2006 2007 2008 2009 2010 2011E
1. As envisaged by OAO Gazprom budget approved by the BoD in December 2011. Subject to the final approval by Annual General Shareholders Meeting in June 2012
Finance - Investor Day 2012
Dividend Per Share Dividend Yield
High dividend yield increases attractiveness of Gazprom shares
RR

33
Investor Day 2012
Social and ecological responsibility
Social Initiatives
Gazprom to Children Program
Sponsorships and charity
Gasification Program for
Russian Regions
Social projects and cultural
projects
Ecological Developments
Environmental
Management System
Emissions Reduction
Program
Energy saving Program
Finance - Investor Day 2012
Social and ecological activities provide for sustainable long-term development of Gazprom and Russia

34
Investor Day 2012 Finance - Investor Day 2012
Conclusion
Gazprom’s strategy responds to the global trend of growing gas demand
Natural gas – the future of world energy
Conservative financial strategy ensures Gazprom’s stable financial position
Gazprom’s securities should be viewed as defensive investments on Emerging markets
Gazprom’s operating and financial performance continue to grow
Core values, flexibility and consistent development – our key to strengthening our export position
35
Investor Day 2012
Contacts for investors
Department for Finance & Economics
Capital Markets Directorate
Fax: (007) (495) 719-35-41
Oleg NAGOVITSYN
Deputy Head of Capital Markets Directorate
Phone: (007) (495) 719-26-25
E-mail: [email protected]
Andrei BARANOV
Investor Relations
Phone: (007) (495) 719-25-89
E-mail: [email protected]
Finance - Investor Day 2012

Investor Day 2012
36
Gazprom Neft
Part 4. Vadim Yakovlev
Deputy Chairman of the Management Board of Gazprom Neft
First Deputy CEO of Gazprom Neft
Investor Day 2012

Investor Day 2012 37
1. Gazprom Neft estimates 2. Including GPN share in EBITDA of joint ventures 3. Adjusted foe one-off items
Strong financial performance while advancing on 2020 strategic goals
2011 estimated results(1)
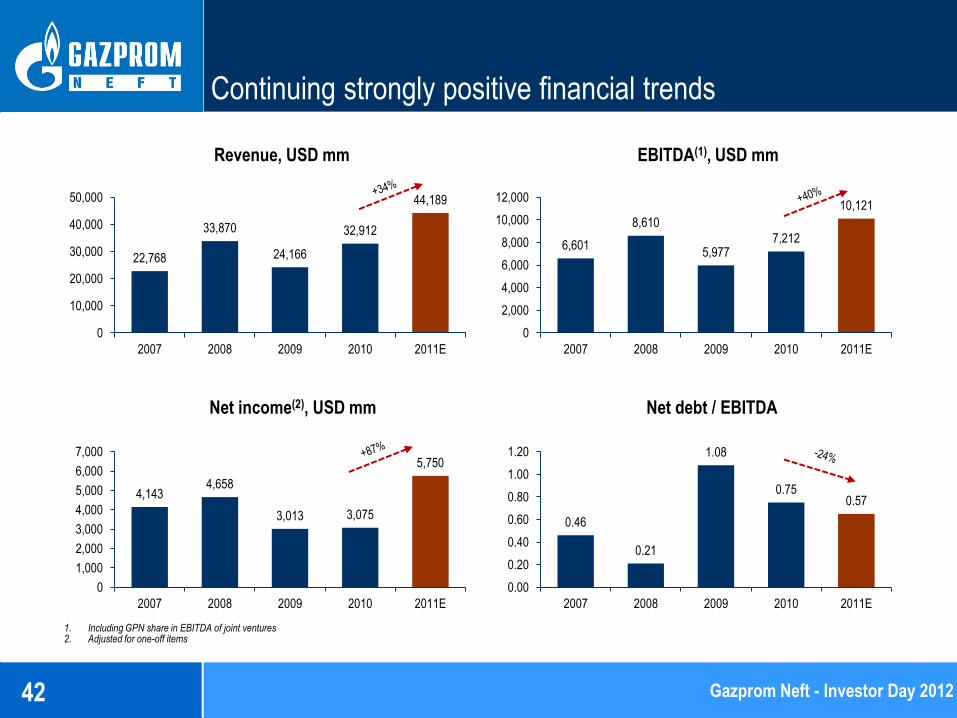
– Revenue: USD 44,189 mln (+34.3% Y-o-Y)
– EBITDA(2) : USD 10,121 mln (+40.3% Y-o-Y)
– Net Income (3) : USD 5,750 mln (+87.0% Y-o-Y)
Continued operational progress(1)
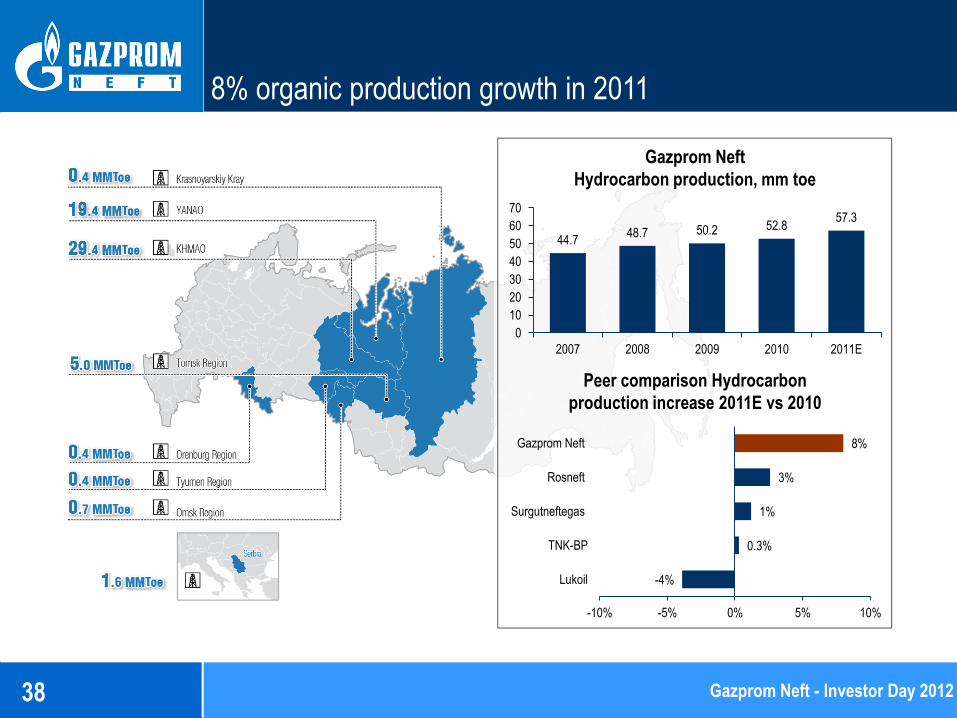
– Production up 8% Y-o-Y (toe) due to continued rise at Priobskoye field and
Orenburg consolidation
– Refining volumes up 6.8% Y-o-Y
– Substantial gains in premium channels sales (+37.2 Y-o-Y)
– Average retail site throughput up 41.5% Y-o-Y
Strategic advances
– New Orenburg oil production cluster combines eastern Orenburg field (transferred
from Gazprom) and two new acquisitions - Kapitonovskoye and Tsarichanskoye
– Increased Sibir Energy share to 100% and effective share in Moscow refinery to
77.7%
– Launch of Europe’s largest Isomalk isomerization units at Omsk and Yaroslavl
refineries
– Began Euro-4 production at Omsk and Moscow refineries
– Retail expansion via acquisitions in Krasnodar, Chelyabinsk, Nizhniy Novgorod and
Novosibirsk
– Reduced average interest rate by 0.6 p.p. to 3.37%; increased average debt maturity
by 27% Y-o-Y
Gazprom Neft - Investor Day 2012
Investor Day 2012 38
8% organic production growth in 2011
Gazprom Neft
Hydrocarbon production, mm toe
Peer comparison Hydrocarbon
production increase 2011E vs 2010
Gazprom Neft - Investor Day 2012
44.7 48.7 50.2 52.8
57.3
0
10
20
30
40
50
60
70
2007 2008 2009 2010 2011E
-4%
0.3%
1%
3%
8%
-10% -5% 0% 5% 10%
Lukoil
TNK-BP
Surgutneftegas
Rosneft
Gazprom Neft

Investor Day 2012 39
1. Domestic refining only for all companies
Downstream: well positioned for profitable growth, maximum utilization of high refining margins
Gazprom Neft - Investor Day 2012
Gazprom Neft
Refining throughput, mm t
Peer comparison
Throughput increase 2011 vs 2010
26.2 28.4
33.4 37.9
40.5
0
9
18
27
36
45
2007 2008 2009 2010 2011E
0.2%
0.3%
0.3%
2.6%
8.9%
-10% -5% 0% 5% 10%
Lukoil
Surgutneftegas
Rosneft
TNK-BP
Gazprom Neft
(1)

Investor Day 2012 40
Focus on high margin retail sales and network growth
Gazprom Neft - Investor Day 2012
Retail sales, mm t
4.3 5.9
8.2
11.6
15.7
0
3
6
9
12
15
18
2007 2008 2009 2010 2011E
783 865
1,546 1,596 1,689
8.0
9.1
7.1 7.7
10.9
-1.0
1.0
3.0
5.0
7.0
9.0
11.0
0
500
1,000
1,500
2,000
2,500
3,000
2007 2008 2009 2010 2011E
Filling sations (LHS) Av. daily throughput (RHS)
Retail Network
units tonnes

Investor Day 2012 41
- Bunkering
- Aviation
- Lubricants
2011E premium sales growth
Continued development of other high margin channels
Gazprom Neft - Investor Day 2012
51%
53%
51%
35%
0% 30% 60% 90% 120%
Retail
Bunkering
Lubricants
Aviation
Investor Day 2012 42
Revenue, USD mm EBITDA(1), USD mm
Net income(2), USD mm Net debt / EBITDA
Continuing strongly positive financial trends
1. Including GPN share in EBITDA of joint ventures 2. Adjusted for one-off items
Gazprom Neft - Investor Day 2012
22,768
33,870
24,166
32,912
44,189
0
10,000
20,000
30,000
40,000
50,000
2007 2008 2009 2010 2011E
6,601
8,610
5,977 7,212
10,121
0
2,000
4,000
6,000
8,000
10,000
12,000
2007 2008 2009 2010 2011E
4,143 4,658
3,013 3,075
5,750
0
1,000
2,000
3,000
4,000
5,000
6,000
7,000
2007 2008 2009 2010 2011E
0.46
0.21
1.08
0.75 0.57
0.00
0.20
0.40
0.60
0.80
1.00
1.20
2007 2008 2009 2010 2011E

Investor Day 2012 43
19.6 21.1
17.9
14.0
26.3 25.8 24.9
20.3
0
5
10
15
20
25
30
Lukoil Rosneft Gazprom Neft TNK-BP
9M10 9M11
Growth and operating performance deliver industry-leading results
EBITDA USD / boe
ROACE 12M trailing, % Total Shareholder Return(1) 2011 %
EBITDA growth 9M11vs. 9M10
1. TSR = (Price end of the period – Price beginning of the period + Dividends per share)/Price beginning of the period
Gazprom Neft - Investor Day 2012
50% 48%
28% 25%
0%
10%
20%
30%
40%
50%
60%
Gazprom Neft TNK-BP Lukoil Rosneft
25.1
14.3 14.2 13.6
37.1
20.3 17.3 16.4
0
10
20
30
40
TNK-BP Gazprom Neft Rosneft Lukoil
2010 2011E
16%
2%
-2% -2%
3%
9%
3% 1%
19.0%
10.6%
1.7%
-0.9% -5%
0%
5%
10%
15%
20%
-5%
0%
5%
10%
15%
20%
Gazprom Neft TNK-BP Lukoil Rosneft
Capital gain Dividend yield TSR
Investor Day 2012 44
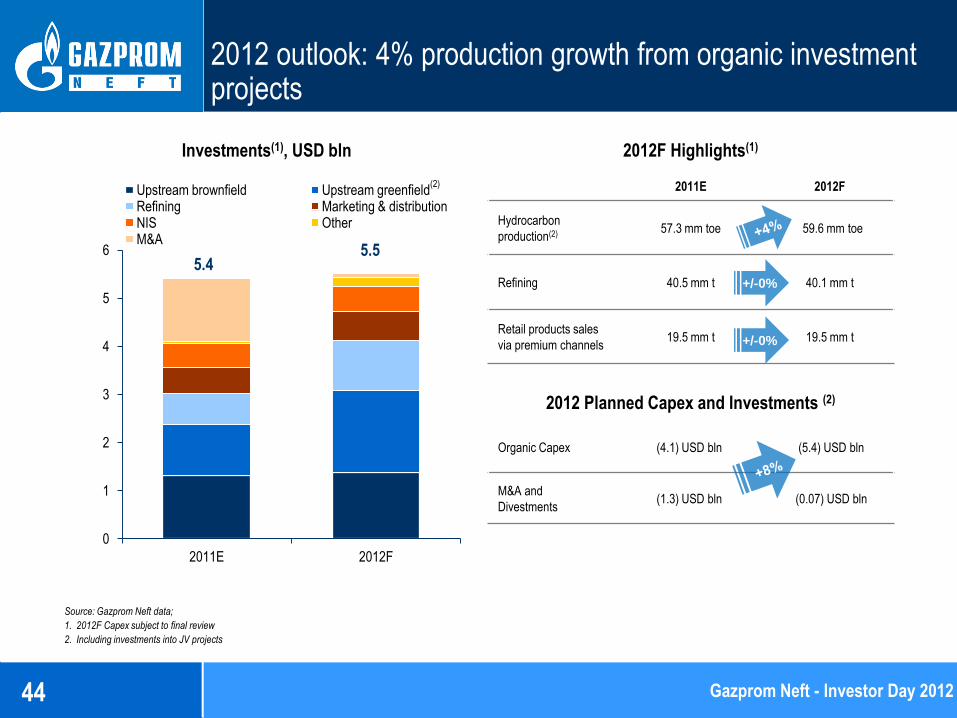
2012 outlook: 4% production growth from organic investment projects
2012F Highlights(1) Investments(1), USD bln
Organic Capex (4.1) USD bln (5.4) USD bln
M&A and
Divestments (1.3) USD bln (0.07) USD bln
2011E 2012F
Hydrocarbon
production(2) 57.3 mm toe 59.6 mm toe
Refining 40.5 mm t 40.1 mm t
Retail products sales
via premium channels 19.5 mm t 19.5 mm t
Source: Gazprom Neft data;
1. 2012F Capex subject to final review
2. Including investments into JV projects
+/-0%
2012 Planned Capex and Investments (2)
Gazprom Neft - Investor Day 2012
5.5 5.4
(2)
0
1
2
3
4
5
6
2011E 2012F
Upstream brownfield Upstream greenfield Refining Marketing & distribution NIS Other M&A
+/-0%

Investor Day 2012 45
expected production
I stage Production growth
II stage Stabilization
III stage 10-30% annual decline
0 stage Preparation for development
Priobskoye
Zymnee
Orenburg
SeverEnergy
Vyngapurovskoye
IV stage 2-3% annual decline
Messoykha
Novoport
Value growth
Upstream project pipeline will deliver substantial oil production growth
Gazprom Neft - Investor Day 2012

Investor Day 2012 46
1
2
3
Prirazlomnoye (offshore)
Dolginskoye (offshore)
Novoport (YANAO)
3
The Arctic
Ocean
Kara
Sea
Rotterdam
Long term project pipeline includes synergistic offshore Arctic developments
▪ Oil field license transfers underway from Gazprom
▪ Gazprom Neft offshore production would reach 6.6 mm t of oil
by 2020, with an 8 year plateau
▪ Consolidation of Prirazlomnoye and Dolginskoye oil fields
▪ Synergy with Novoport project in the Northern Sea route
logistics
Barents Sea
Novaya
Zemlya
Prirazlomnoye Dolginskoye
Reserves (Recoverable С1, mm t)
74.4 68.5
Production start up (year)
2012 2018-2020
Peak production (oil, mm t)
6.6 6.2
Platforms 1 1
Yamal
peninsula
Gazprom Neft - Investor Day 2012

Investor Day 2012 47
Analyst target prices imply a 20% undervaluation of Gazprom Neft stock
Broker
Date
EBITDA (USD mm)
Recommendation
Target price (rubles) 2011E 2012F
Alfa Bank 09/07/11 7,392 6,679 overweight 165.0
Citi Investments 06/30/11 9,277 7,176 buy 175.5
Deutsche Bank 12/02/11 8,022 7,108 buy 195.1
Goldman Sachs 05/23/11 8,848 9,417 neutral 169.4
IC Otkritye 02/06/12 6,957 3,499 sell 105.4
JP Morgan 01/31/12 8,441 7,701 overweight 175.7
Troika Dialog 10/11/11 8,034 7,491 buy 165.6
UniCredit 09/15/11 8,302 8,137 buy 182.5
Uralsib Capital 02/03/12 8,391 7,978 buy 175.0
VTB Capital 01/26/12 7,497 7,596 buy 269.4
Average 178
Gazprom Neft - Investor Day 2012
Consensus
SELL BUY
150
178
Current price Av. target price

Investor Day 2012 48
Current valuations do not fully reflect new and growth businesses
Gazprom Neft Valuation(1)
1. Based on average Broker estimates on Gazprom Neft SOP valuation
Analysts estimate New upstream projects, NIS and Downstream premium channels value ~10% of total
Company value vs. Gazprom Neft estimate of 40%
Analyst estimates Company valuation
~10% ~40% Value
upside
Gazprom Neft - Investor Day 2012

Investor Day 2012 49
New projects and other positives provide additional valuation upside
Gazprom Neft valuation vs Market capitalization, USD bln
Source: Gazprom Neft estimates
23
37
28 27
1 3
8
3
Market cap 31.12.2011 Russian multiples NIS New upstream projects Downstream premium channels
Estimated value Analyst consensus
Value upside
+ 61%
Gazprom Neft - Investor Day 2012
Investor Day 2012 50
Operational performance, financial discipline, long term growth and unrecognized value
Leading Russian company in 2011 by production growth
Strong mid-term and long-term Upstream project pipelines
Incremental opportunities to optimize natural gas use
Most advantaged Russian refining portfolio
Diverse and fast growing premium products channels
Continuous operating improvement and financial discipline
Strongly positive financial trends and valuation upside
Gazprom Neft - Investor Day 2012

Investor Day 2012 51
Gazprom Neft - Investor Day 2012
Contacts for investors
Department of Corporate Finance
Investor Relations
Tel: (007) (812) 385-9548
Alexey Kokorev
Head of Corporate Finance Department
Phone: (007) (812) 648-3117
E-mail: [email protected]
Anna Sidorkina
Head of Investor Relations
Phone: (007) (812) 385-9548
E-mail: [email protected]

Investor Day 2012 52
Gazprom Energoholding
Part 5. Denis Fedorov
Head of Gazprom Directorate for Development of Power Generation Sector and
Power Generation Marketing, General Director of Gazprom Energoholding

Investor Day 2012 53
Russian Electricity Market
Gazprom presence Organization
OGK’s
TGC’s
Russian thermal power sector
corporate structure
Power & Heat
Power (primarily)
Russian power plants installed
electric capacity
Source: System operator of the UES data as of 01.12. 2011
Source: company data, Minenergo 1. Industrial enterprises’ power plants, including thermal and hydro
Relatively small local combined
heat and power plants located in
particular region
Relatively large thermal power
plants located in distinct regions
To cover variable costs
Capacity price
Heat price
Free pricing
Comment
Power price
Regulation is through price caps and special tariffs for non-
competitive producers. About 50% of market is under
regulation. Higher margin for the most effective producers
Power market is a liberalized wholesale market (excluding
individuals - about 20% of the total consumption).
Heat market so far remains fully regulated. Base
principles of expected RAB: return on investment, long-
term tariffs and unchanged regulation base.
Gas (fuel) Gas market is expected to be liberalized after
2014
Common use
To cover fixed costs
and CAPEX
Regulatory assets base
(RAB) regulation
expected
Russian power market
liberalization
Gazprom Energoholding - Investor Day 2012
Thermal 63%
Hydro 20%
Nuclear 11%
Other(1) 6%

Investor Day 2012 54
St. Petersburg
Moscow
Krasnoyarsk
Surgut
Installed electric capacity 37.0 GW
Installed heat capacity 54.015 GCal/h
Installed electric capacity 12.3 GW
Installed heat capacity 35.083 GCal/h
Market capitalization USD 2.5 bln(2)
53.5%
Installed electric capacity 6.8 GW
Installed heat capacity 14.616 GCal/h
Market capitalization USD 1.2 bln(2)
51.8%
Installed electric capacity 17.9 GW
Installed heat capacity 4.316 GCal/h
Market capitalization USD 1.6 bln(3)
57.6% (1)
GEH fuel mix
Key Assets Overview
Gazprom Energoholding - Investor Day 2012
Gas
88%
Coal
11%
Oil-fuel
1%
1. Since OGK-2 and OGK-6 merged at November 1st, 2011 2. As of 01.02.2012 3. As of 01.02.2012 (Includes the additional issue (1-02-65105-D-004D), traded since 22.12.2011)
Gazprom Energoholding is a leading power and heat generator in Russia operating through the wholesale market

Investor Day 2012 55
Other 83% Other 92%
Leading Positions in Electricity and Heat Generation
Installed capacity 2011E, GW Heat capacity 2011E, Gcal/h ths
Source: company data
Electricity generation, 2011E Heat generation, 2011E
Source: companies’ data as of 31.12.2011
172.7 bln
kWh (Е)
17%
98.8 mm
Gcal
8%
Gazprom Energoholding - Investor Day 2012
37 35 29
24 20
16 10 9
Rus
Hyd
ro
Inte
r R
AO
Ros
atom
Eur
oSib
Ene
rgo
IES
Hol
ding
E.O
N
Ene
l
67
54
21 16 16 14 10
IES
Hol
ding
GE
H
Inte
r R
AO
SU
EK
Qua
dra
LUK
OIL
FO
RT
UM

Investor Day 2012 56
15
Electricity consumption
Cooperation of Gas and Electricity Business
Gazprom share(1) of total electricity consumption in
Russia, 2010
GEH share in total gas consumption by Russia power
plants, 2010 15 bln kWh
Source: Rosstat, company data 1. Energy consumption of key Gazprom subsidiaries operating in gas extraction, transportation, storage and refining businesses
Source: company data
Product
cooperation
Project
cooperation
Strategy
cooperation
Electricity supply for Gazprom investment projects
Gazprom
investment projects
Gazprom power sector
investment project
Shtokman field
development Power plant in Teriberka
Astrakhan gas refinery
reconstruction Astrakhan TPP
North-East
Asia
Europe
Cooperation in possible geographic expansion
Gazprom Energoholding - Investor Day 2012
29% Other 71%
2% Other 98%

Investor Day 2012 57
65.4 69.9 66.4
26.9 28.8 26.1
6.8 6.7 6.3
2009 2010 2011E 2009 2010 2011E 2009 2010 2011E
61.7 65.0 64.6
26.8 27.2 28.4
76.1 82.5 79.7
2009 2010 2011E 2009 2010 2011E 2009 2010 2011E
Operating Results
Electricity
Generation,
kWh bln
Heat
Generation,
Gcal mm
+5.3% -0.6%
+1.5% +4.4%
+8.4% -3.4%
+6.9% -5.0%
+7.1% -9.4%
-1.5% -6.0%
+6.1% -1.1%
+6.4% -6.3%
(¹)
Source: company data 1. Management reporting data. 12m2011 of consolidated OGK-2 and 10m2011 of OGK-6 included
Gazprom Energoholding - Investor Day 2012
2009 2010 2011E
2009 2010 2011E
105.4 99.1 98.8
174.7 164.6 172.7
Investor Day 2012 58
12.4
17.2 14.9
2009 2010 2011E
4.5
7.6
10.4
3.4 3.6 3.6 4.5 6.0
0.9(2)
2009 2010 2011E 2009 2010 2011E 2009 2010 2011E
17.8 21.0
24.6
7.9 9.3 9.4 8.7 10.8
5.3
2009 2010 2011E 2009 2010 2011E 2009 2010 2011E
112.2 143.8 160.8
38.4 50.6 57.7 82.6
103.9 105.0
2009 2010 2011E 2009 2010 2011E 2009 2010 2011E 2009 2010 2011E
34.4 41.1 39.3
2009 2010 2011E
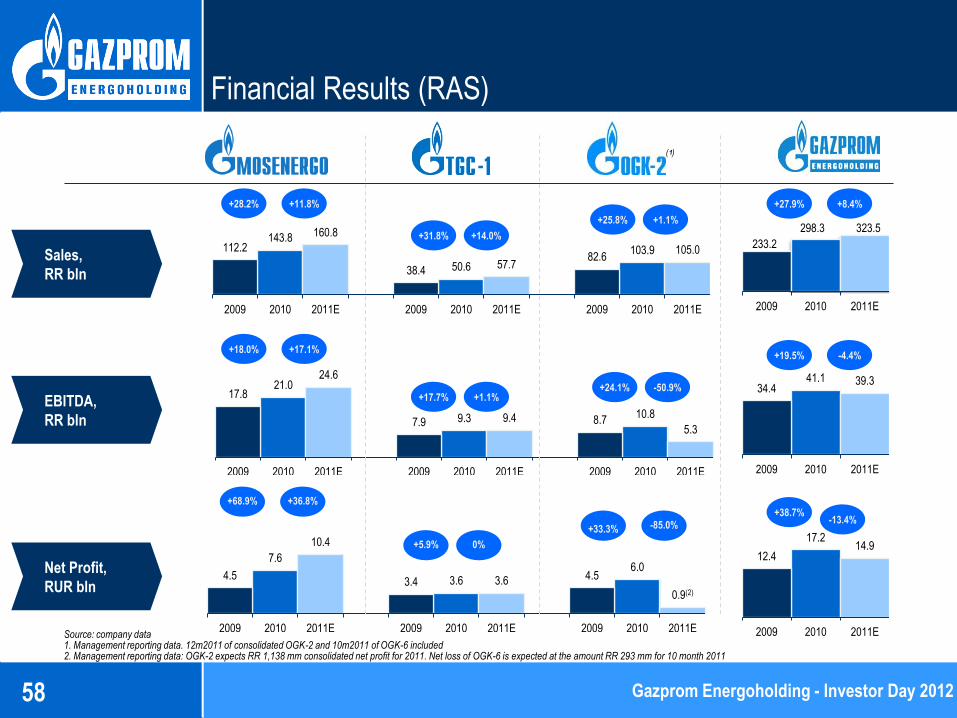
Financial Results (RAS)
Sales,
RR bln
EBITDA,
RR bln
+28.2% +11.8%
+31.8% +14.0%
+25.8% +1.1%
+27.9% +8.4%
+18.0% +17.1%
+17.7% +1.1% +24.1% -50.9%
-4.4% +19.5%
Source: company data 1. Management reporting data. 12m2011 of consolidated OGK-2 and 10m2011 of OGK-6 included 2. Management reporting data: OGK-2 expects RR 1,138 mm consolidated net profit for 2011. Net loss of OGK-6 is expected at the amount RR 293 mm for 10 month 2011
Gazprom Energoholding - Investor Day 2012
298.3
233.2
323.5
(¹)
Net Profit,
RUR bln
+68.9% +36.8%
+5.9% 0%
+33.3% -85.0% -13.4%
+38.7%

Investor Day 2012 59
Key Investment Projects
Innovative projects (CSA included)
Key projects, 2012-2014
Serovskaya GRES
(OGK-2) 420 MW
Troitskaya GRES
(OGK-2) 660 MW
Stavropolskaya GRES
(OGK-2)
420 MW
Cherepovetskaya
GRES
(OGK-2)
420 MW
TPP-16
(Mosenergo) 420 MW
TPP-20
(Mosenergo) 420 MW
TPP-12
(Mosenergo) 220 MW
Central TPP
(TGC-1)
100 MW
Novocherkasskaya
GRES (OGK-2) 330 MW
800MW combined cycle gas turbine power
facility based on existing steam turbine using
modern Siemens gas-turbine power unit
Novocherkasskaya GRES (OGK-2)
First Russian 330 MW modern
power facility with circulating boiling
layer equipment
Kirishskaya GRES (OGK-2)
Key projects, 2010-2011
Ryazanskaya GRES
(OGK-2) 420 MW
Yuzhnaya TPP-22
(TGC-1) 450 MW
TPP-26 (Mosenergo) 420 MW
Pervomayskaya TPP-14
(TGC-1) 180 MW
Kirishskaya GRES
(OGK-2) 800 MW
Investment program status
Total investment
Program 9 GW
42.2%
Adlerskaya TPP
(OGK-2) 360 MW
51(1)
48(1)
11m 2011 2012E
RR bln
Source: company data, media 1. Net of Adlerskaya TPP investments
Gazprom Energoholding - Investor Day 2012
Commissioned
capacity 3.8 GW

Investor Day 2012 60
Completion of the OGK2 and OGK6 Merger: Creation of a Leading Thermal Generation Company
Installed capacity
8.7 GW Installed capacity
9.2 GW
Synergy effect
Creation of a leading heat generating
company in Russia
Total installed capacity 17.9 GW.
Consolidated revenue in 2011 is expected to exceed RR 100 bln
Efficiency increase in electricity production and sales Electricity production in 2011 is estimated at 79.7 bln KW∙h
Centralized procurement and optimization
of management structure
‘Scale effect’ implementation in the process of operating and management costs decrease
Optimization of investment
program funding
Investment program is over 4 GW, guaranteed by Capacity Supply
Agreements. Investment Program equals to RR 165 bln
Potential merger synergies are expected to be at RR 7.8 bln in 2011-2015
Total installed
capacity
17.9 GW +
Gazprom Energoholding - Investor Day 2012

Investor Day 2012 61
Value Drivers Summary
Capacity supply agreements
Prices growth potential
Gazprom Energoholding investment program
Current market undervaluation
Efficiency increase
Gazprom Energoholding - Investor Day 2012
The undervaluation, completed investment projects and expected price trends provide solid upside relative to
Gazprom Energoholding’s current valuation

Investor Day 2012 62
50%
60%
70%
80%
90%
100%
110%
120%
130%
140%
150%
Dec
-04
Jun-
05
Dec
-05
Jun-
06
Dec
-06
Jun-
07
Dec
-07
Jun-
08
Dec
-08
Jun-
09
Dec
-09
Jun-
10
Dec
-10
Jun-
11
Dec
-11
Value Drivers [1/5]: Undervaluation due to Current Market Uncertainty
Multiples
Developed markets(1)
Russian market(2)
Gazprom Energoholding
Government opposes
the sector reformations
The sector’s reformations get
government support
Chubais declares
the intention to
leave the sector Tariffs curb declared
by the government
Market liberalization is
supported
Potential
industry
upside
Source: Bloomberg, JP Morgan Cazenove 1. European top-5 multiples average 2. Average Russian power generation sector multiples
Relative dynamics of MICEX Power Index versus MICEX Index
EV/Sales 0.9x
0.7x
0.5x
EV/IC 1.1x
>0.2x
<0.2x
Gazprom Energoholding - Investor Day 2012

Investor Day 2012 63
Mcap - 5.3
12.1 Net debt - 1.3
6.7
1.7
3.7
Current EV Old capacity valuation Capacity under construction New installed capacity Total
Value Drivers [2/5]: Undervaluation of Significant Progress in Investment Program Completion
Source: company data 1. According to construction costs of USD 1,100/kW for gas consuming capacities and USD 1,800/kW for coal consuming 2. Valuation according USD 200/kW EV/IC multiple which is consistent with 4.0x EV/EBITDA for Russian energy sector
Costs based valuation shows upside
1.8x
USD bln
Gazprom Energoholding - Investor Day 2012
According to current investments, the company’s existing capacity is priced too low which implies solid
potential for unlocking the company’s value
(2) (1)

Investor Day 2012 64
120(2)
440(2)
Regular capacity New capactiy under capacity supply agreements
491
661
Spark spread: old power plants Spark spread: power plants with new blocks
Value Drivers [3/5]: Capacity Supply Agreements
Over 95% of the investment program is associated with Capacity Supply Agreements program, assuming increased
tariffs after power plants commissioning, which provides basis for increasing the company’s value
Increased new capacity profitability
+35%
Increased price for new capacity
RR/ KW month
3.6x price
increase for
CSA capacities
Source: company data and analysis
RR/ KW year
Source: company data and analysis 1. Spark spread = revenue from electricity sales per 1 KW – fuel expense per 1 KW 2. Average price for Mosenergo, TGC-1 and OGK-2 in 2011
Gazprom Energoholding - Investor Day 2012
Russia existing
capacity average
price
(1) (1)

Investor Day 2012 65
2.9%
3.0%
4.3%
5.7%
5.9%
70 - 80
93
108
128
138
140
152
153
165
190
Russia
France
Sweden
Portugal
Poland
UK
Austria
Spain
Germany
Italy
Value Drivers [4/5]: Expected Price Growth
Electricity prices for industrial consumers Margins: Gazprom Energoholding vs. European Top-5
USD/MWh Net income margin(1)
USD 141
Source: European Energy Portal, Russian Energy Trade System Administrator, company data and analysis 1. IFRS data
Source: Bloomberg, company data
Expected price growth
will likely add up to
Gazprom
Energoholding’s
margins
Gazprom Energoholding - Investor Day 2012
Russian industrial
electricity price is
43% below
European average
Russian electricity prices are >40% below European averages which implies further growth potential through gradual
increase in coal and gas prices
Given existing prices Gazprom Energoholding operates with margins which are in line with the top European peers

Investor Day 2012 66
Value Drivers [5/5]: Efficiency Increase
I. Expected efficiency increase
for new capacity
II. Heat sales III. Operating expenses
optimization
Moscow Government
negotiations for load
capacities optimization and
optimization of heat
transmission
Development of Advanced
Health Safety Environment
System (HSE)
Further optimization
Consolidation of heat
network of Saint Petersburg
and heat load capacities
optimization
Hydro power assets utilization
Increase efficiency of variable
cost
Interest payments economy
Synergy effect of consolidation
OGK-2 and OGK-6
Development infrastructure for
different coal-type acceptance
<not applicable>
Fuel consumption, gfe/kW
Fuel consumption, gfe/kW
Fuel consumption, gfe/kW
1. Indicative estimate of yearly economy on fuel consumption decrease on new blocks assuming 74% capacity load for new capacities and following 3% capacity price decrease
Gazprom Energoholding - Investor Day 2012
265 219
896
Old capacity New blocks Effect , RR mm
341 245
1,127
Old capacity New blocks Effect , RR mm
368 322
621
Old capacity New blocks Effect , RR mm
(1)
(1)
(1)
Focus on increasing operational efficiency, which is expected to save over RR2.6bln annually after 2012
provides an additional value driver

Investor Day 2012 67
7.1 39.0
Current EV Potential EV
Further Steps in Business Development
Consolidation of current assets
Investment program
completion
Expansion through organic growth and
M&A
Gazprom Energoholding has
completed the second stage at
this point
IPO
OGK-2 and OGK-6 merger
Achievements in blueprinted goals and electricity prices growth
will allow Gazprom Energoholding to reach developed countries
multiples:
5.5x
1. Indicative EV estimate based on post-CSA installed capacity of 39 GW and current top-5 European generating companies EV/IC multiple
EV, USD bln
… turning Gazprom
Energoholding into a
“blue chip” company
with robust growth
opportunities Further optimization of corporate governance and
operational efficiency
Gazprom Energoholding - Investor Day 2012
(1)

Investor Day 2012 68
Contacts for investors
Gazprom Energoholding
Investor Relations
Tel: (007) (495) 428 47 83
Sergey Fil
Director of Corporate and Legal Development Gazprom Energoholing
Phone: (007) (495) 428 47 83 (ext.: 46-32)
E-mail: [email protected]
Ekaterina Pavlova
Head of IR Gazprom Energoholding
Phone: (007) (495) 428 47 83 (ext.: 46-07)
E-mail: [email protected]
Gazprom Energoholding - Investor Day 2012