Scalable performance analysis of large-scale parallel ... · Scalable performance analysis of...
92
Scalable performance analysis of large-scale parallel applications Brian Wylie Jülich Supercomputing Centre [email protected] June 2009
Transcript of Scalable performance analysis of large-scale parallel ... · Scalable performance analysis of...

Scalable performance analysisof large-scale parallel applications
Brian WylieJülich Supercomputing Centre
[email protected] 2009

2
Performance analysis, tools & techniques
● Profile analysis■ Summary of aggregated metrics
► per function/call-path and/or per process/thread■ Most tools (can) generate and/or present such profiles
► but they do so in very different ways, often from event traces!■ e.g., mpiP, ompP, Tau, Scalasca, Sun Studio, Vampir, ...
● Time-line analysis■ Visual representation of the space/time sequence of events■ Requires an execution trace■ e.g., Vampir, Paraver, Sun Studio Performance Analyzer, ...
● Pattern analysis■ Search for characteristic event sequences in event traces■ Can be done manually, e.g., via visual time-line analysis■ Can be done automatically, e.g., KOJAK, Scalasca

3
Automatic trace analysis
● Idea■ Automatic search for patterns of inefficient behaviour■ Classification of behaviour & quantification of significance
■ Guaranteed to cover the entire event trace■ Quicker than manual/visual trace analysis■ Parallel replay analysis exploits memory & processors
to deliver scalability
Callpath
Pro
pert
y
Location
Low-levelevent trace
High-levelresult
Analysis ≡

4
The Scalasca project
● Overview■ Helmholtz Initiative & Networking Fund project started in 2006■ Headed by Prof. Felix Wolf (RWTH Aachen University & FZJ)■ Follow-up to pioneering KOJAK project (started 1998)
► Automatic pattern-based trace analysis
● Objective■ Development of a scalable performance analysis toolset■ Specifically targeting large-scale parallel applications
► such as those running on BlueGene/P or Cray XTwith 10,000s to 100,000s of processes
■ Latest release in November 2008: Scalasca v1.1► Available on VI-HPS Tuning Workshop Live-DVD► Scalasca 1.2β currently in testing

5
Scalasca features
● Open source, New BSD license● Portable■ BG/P, BG/L, IBM SP & blade clusters, Cray XT, SGI Altix,
SiCortex, Solaris & Linux clusters, ...● Supports parallel programming paradigms & languages■ MPI, OpenMP & hybrid OpenMP/MPI■ Fortran, C, C++
● Integrated measurement & analysis toolset■ Runtime summarization (aka profiling)■ Automatic event trace analysis

6
programsources
application+EPIKapplication+EPIKapplication+EPIKapplication + MPI library
compiler
executable
● Application code compiled & linked into executable using MPICC/CXX/FC
● Launched with MPIEXEC
● Application processes interact via MPI library
Generic MPI application build & run

7
programsources
application+EPIKapplication+EPIKapplication+EPIKapplication + measurement lib
instrumentercompiler
instrumented executable
● Automatic/manualcode instrumenter
● Program sourcesprocessed to add instrumentation and measurement library into application executable
● Exploits MPI standard profiling interface (PMPI) to acquire MPI events
Application instrumentation

8
programsources
application+EPIKapplication+EPIKapplication+EPIKapplication + measurement lib
summaryanalysis
instrumentercompiler
instrumented executable expt config
● Measurement library manages threads& events producedby instrumentation
● Measurements summarized bythread & call-path during execution
● Analysis report unified & collated at finalization
● Presentation of summary analysis
Measurement runtime summarization
analysis report examiner

9
programsources
unifieddefs+maps
trace Ntrace ..trace 2trace 1
application+EPIKapplication+EPIKapplication+EPIKapplication + measurement lib
traceanalysis
instrumentercompiler
instrumented executable
SCOUTSCOUTSCOUT parallel trace analyzer
expt config
● During measurementtime-stampedevents bufferedfor each thread
● Flushed to files along with unified definitions & maps at finalization
● Follow-up analysis replays events and produces extended analysis report
● Presentation of analysis report
Measurement event tracing & analysis
analysis report examiner

10
programsources
unifieddefs+maps
trace Ntrace ..trace 2trace 1
application+EPIKapplication+EPIKapplication+EPIKapplication + measurement lib
traceanalysis
summaryanalysis
instrumentercompiler
instrumented executable
SCOUTSCOUTSCOUT parallel trace analyzer
expt config
● Automatic/manual code instrumenter
● Measurement library for runtime summary & event tracing
● Parallel (and/or serial)event trace analysis when desired
● Analysis report examiner for interactive exploration of measured execution performance properties
Generic parallel tools architecture
analysis report examiner

11
programsources
unifieddefs+maps
trace Ntrace ..trace 2trace 1
application+EPIKapplication+EPIKapplication+EPIKapplication + measurement lib
traceanalysis
summaryanalysis
analysis report examiner
instrumentercompiler
instrumented executable
SCOUTSCOUTSCOUT parallel trace analyzer
expt config
● Scalasca instrumenter= SKIN
● Scalasca measurement collector & analyzer= SCAN
● Scalasca analysisreport examiner= SQUARE
Scalasca toolset components

12
scalasca
● One command for everything% scalascaScalasca 1.2Toolset for scalable performance analysis of large-scale appsusage: scalasca [-v][-n] {action}1. prepare application objects and executable for measurement: scalasca -instrument <compile-or-link-command> # skin2. run application under control of measurement system: scalasca -analyze <application-launch-command> # scan3. interactively explore measurement analysis report: scalasca -examine <experiment-archive|report> # square
[-h] show quick reference guide (only)
13
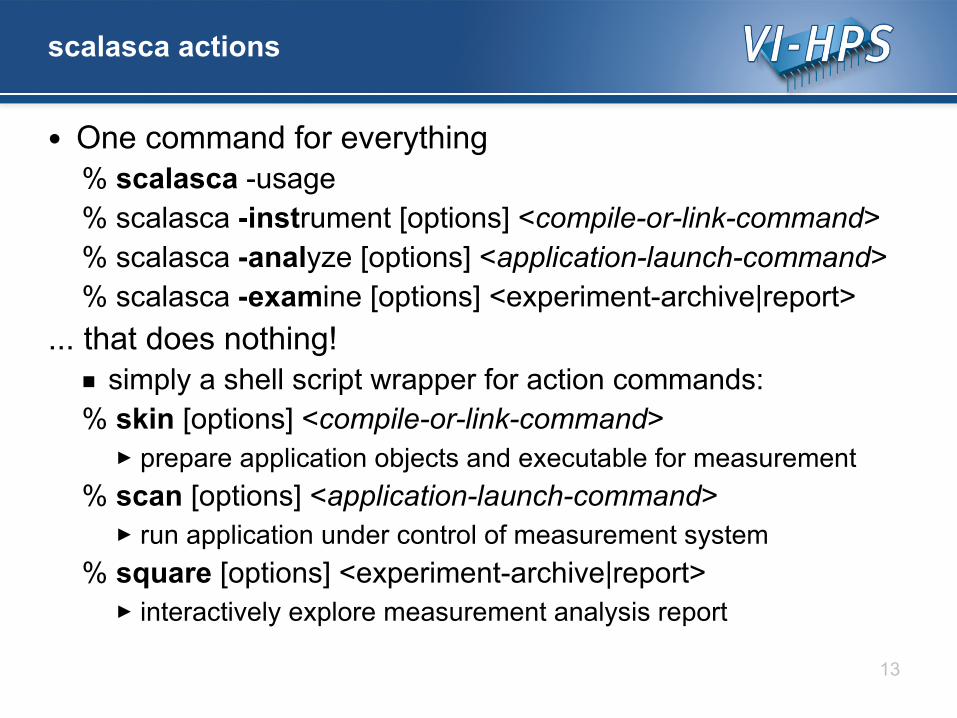
scalasca actions
● One command for everything% scalasca -usage% scalasca -instrument [options] <compile-or-link-command>% scalasca -analyze [options] <application-launch-command>% scalasca -examine [options] <experiment-archive|report>
... that does nothing!■ simply a shell script wrapper for action commands:% skin [options] <compile-or-link-command>
► prepare application objects and executable for measurement
% scan [options] <application-launch-command>► run application under control of measurement system
% square [options] <experiment-archive|report>► interactively explore measurement analysis report

14
EPIK
● Measurement & analysis runtime system■ Manages runtime configuration and parallel execution■ Configuration specified via EPIK.CONF file or environment
► epik_conf reports current measurement configuration■ Creates experiment archive (directory): epik_<title>■ Optional runtime summarization report■ Optional event trace generation (for later analysis)■ Optional filtering of (compiler instrumentation) events■ Optional incorporation of HWC measurements with events
► via PAPI library, using PAPI preset or native counter names
● Experiment archive directory■ Contains (single) measurement & associated files (e.g., logs)■ Contains (subsequent) analysis reports

15
OPARI
● Automatic instrumentation of OpenMP & POMP directives via source pre-processor■ Parallel regions, worksharing, synchronization■ Currently limited to OpenMP 2.5
► No special handling of guards, dynamic or nested thread teams■ Configurable to disable instrumentation of locks, etc.■ Typically invoked internally by instrumentation tools
● Used by Scalasca/Kojak, ompP, TAU, VampirTrace, etc.■ Provided with Scalasca, but also available separately

16
CUBE3
● Parallel program analysis report exploration tools■ Libraries for XML report reading & writing■ Algebra utilities for report processing■ GUI for interactive analysis exploration
► requires Qt4 or wxGTK widgets library► can be installed independently of Scalasca instrumenter and
measurement collector/analyzer, e.g., on laptop or desktop
● Used by Scalasca/Kojak, Marmot, ompP, PerfSuite, etc.■ Provided with Scalasca, but also available separately

17
Analysis presentation and exploration
● Representation of values (severity matrix)on three hierarchical axes■ Performance property (metric)■ Call-tree path (program location)■ System location (process/thread)
● Three coupled tree browsers
● CUBE3 displays severities■ As value: for precise comparison■ As colour: for easy identification of hotspots■ Inclusive value when closed & exclusive value when expanded■ Customizable via display mode
Callpath
Pro
pert
y
Location

18
Scalasca analysis report explorer (summary)
How is itdistributed acrossthe processes?
What kind ofperformance
problem?Where is it in the
source code?In what context?

19
Scalasca analysis report explorer (trace)
Additionalmetrics
determinedfrom trace

20
ZeusMP2/JUMP case study
● Computational astrophysics■ (magneto-)hydrodynamic simulations on 1-, 2- & 3-D grids■ part of SPEC MPI2007 1.0 benchmark suite (132.zeusmp2)■ developed by UCSD/LLNL■ >44,000 lines Fortran90 (in 106 source modules)■ provided configuration scales to 512 MPI processes
● Run with 512 processes on JUMP■ IBM p690+ eServer cluster with HPS at JSC
● Scalasca summary and trace measurements■ ~5% measurement dilation (full instrumentation, no filtering)■ 2GB trace analysis in 19 seconds■ application's 8x8x8 grid topology automatically captured from
MPI Cartesian

21
Scalasca summary analysis: zeusmp2 on jump
● 12.8% of time spent in MPI point-to-point communication
● 45.0% of which is on program callpath transprt/ct/hsmoc
● With 23.2% std dev over 512 processes
● Lowest values in 3rd and 4th planes of the Cartesian grid

22
Scalasca trace analysis: zeusmp2 on jump
● MPI point-to-point communication time separated into transport and Late Sender fractions
● Late Sender situations dominate (57%)
● Distribution of transport time (43%) indicates congestion in interior of grid

23
Scalasca 1.1 functionality
● MPI measurement & analyses■ scalable runtime summarization & event tracing■ only requires application executable re-linking■ limited analyses of non-blocking point-to-point, RMA, ...
● OpenMP measurement & analysis■ serial event trace analysis (of merged traces)
► runtime summarization limited to master thread only■ requires (automatic) application source instrumentation■ restricted to fixed OpenMP thread teams
● Hybrid OpenMP/MPI measurement & analysis■ combined requirements/capabilities■ automatic trace analysis is scalable but incomplete
► can repeat analysis with serial analyzer when desired

24
Scalasca 1.2β additional functionality
● OpenMP measurement & analysis■ run-time summaries include OpenMP metrics (for all threads)
► not all threads need to participate in parallel regions■ trace collection & analysis unchanged
● Hybrid OpenMP/MPI measurement & analysis■ run-time summaries include OpenMP metrics (for all threads)
► not all threads need to participate in parallel regions■ trace collection complemented with hybrid trace analysis
► requires all threads to participate in parallel regions
● MPI File I/O analysis■ collective read/write time■ file operations (reads/writes)
● Improved support for PGI compilers (including filtering)

Demonstration / Tutorial ExerciseNPB-MPI BT
Brian WylieJülich Supercomputing Centre
[email protected] 2009

Performance analysis steps
0. Reference preparation for validation1. Program instrumentation: skin2. Summary measurement collection & analysis: scan [-s]3. Summary analysis report examination: square4. Summary experiment scoring: square -s5. Event trace collection & analysis: scan -t6. Event trace analysis report examination: square
● Configuration & customization■ Instrumentation, Measurement, Analysis, Presentation

● Load the module
● Cray XT modules support different compilers■ 1.2b-pgi supports PrgEnv-pgi (PGI compilers v7.2 & v8.0)■ 1.2b-gnu supports PrgEnv-gnu, pathscale, and pgi (v8.0 only!)■ PrgEnv-cray expected to be supported by a later release
► likely to require CCE 7.1
● Tutorial sources are located under SCALASCA_ROOT
● ... and should be copied to your working directory
Local Scalasca setup
% module avail scalascascalasca/1.2b-gnu scalasca/1.2b-pgi(default)% module load scalasca
% ls $SCALASCA_ROOT/tutorialNPB3.3-MPI jacobi smg2000 sweep3d

NPB-BT
● Intermediate-level tutorial example● Available in MPI, OpenMP, hybrid OpenMP/MPI variants■ also MPI File I/O variants (collective & individual)
● Summary measurement collection & analysis■ Automatic instrumentation
► OpenMP, MPI & application functions■ Summary analysis report examination
● Trace measurement collection & analysis■ Filter determination, specification & configuration■ Automatic trace analysis report patterns
● (Analysis report algebra)

NPB-MPI suite
● The NAS Parallel Benchmark suite (sample MPI version)■ Available from http://www.nas.nasa.gov/Software/NPB■ 9 benchmarks (7 in Fortran77, 2 in C)■ Configurable for various sizes & classes
● Move into the NPB3.3-MPI root directory
● Subdirectories contain source code for each benchmark■ plus additional configuration and common code
● The provided distribution has already been configured for the tutorial, such that it's ready to “make” one or more of the benchmarks and install them into the “bin” subdirectory
% cd NPB3.3-MPI; lsBT/ CG/ DT/ EP/ FT/ IS/ LU/ MG/ SP/bin/ common/ config/ Makefile README README.install sys/

Building an NPB benchmark
● Specify the benchmark configuration■ benchmark name: bt, cg, dt, ep, ft, is, lu, mg, sp■ the number of MPI processes: NPROC=16■ the benchmark class (S, W, A, B, C, D, E, F): CLASS=W
% make bt NPROCS=16 CLASS=Wcd BT; make NPROCS=16 CLASS=W SUBTYPE= VERSION=gmake: Entering directory 'BT'cd ../sys; cc -o setparams setparams.c../sys/setparams bt 16 Wmpif77 -c -O bt.f...mpif77 -c -O setup_mpi.fcd ../common; mpif77 -c -O print_results.fcd ../common; mpif77 -c -O timers.fmpif77 -c -O btio.fmpif77 -O -o ../bin/bt.W.16 \bt.o make_set.o initialize.o exact_solution.o exact_rhs.o \set_constants.o adi.o define.o copy_faces.o rhs.o solve_subs.o \x_solve.o y_solve.o z_solve.o add.o error.o verify.o setup_mpi.o \../common/print_results.o ../common/timers.o btio.ogmake: Leaving directory 'BT'

NPB-MPI BT (Block Tridiagonal solver)
● What does it do?■ Solves a discretized version of unsteady, compressible
Navier-Stokes equations in three spatial dimensions■ Performs 200 time-steps on a regular 3-dimensional grid
● Can be configured to include various forms of parallel I/O■ e.g., MPI collective file I/O: SUBTYPE=full
● Implemented in 20 or so Fortran77 source modules
● Needs a square number of processes■ bt.W.4 should run in around 5 seconds with 4 processes■ bt.A.4 should take around 16-20x longer (90 seconds)■ bt.W.16 may also run in around 5 seconds with 16 processes

BT-MPI reference execution
● Launch as an MPI application% mpiexec -np 16 bin/bt.W.16 NAS Parallel Benchmarks 3.3 -- BT Benchmark Size: 24x 24x 24 Iterations: 200 dt: 0.0008000 Number of active processes: 16
Time step 1 Time step 20 Time step 40 Time step 60 Time step 80 Time step 100 Time step 120 Time step 140 Time step 160 Time step 180 Time step 200 Verification Successful
BT Benchmark Completed. Time in seconds = 4.70
Hint: rename the executableand save the benchmarkoutput (or note the run time)to be able to refer tothem later

● Load the module
● ... and run scalasca for brief usage information
Load the Scalasca module
% module load UNITEUNITE loaded% module load scalascascalasca/1.2 loaded
% scalascaScalasca 1.2Toolset for scalable performance analysis of large-scale applicationsusage: scalasca [-v][-n] {action} 1. prepare application objects and executable for measurement: scalasca -instrument <compile-or-link-command> # skin 2. run application under control of measurement system: scalasca -analyze <application-launch-command> # scan 3. interactively explore measurement analysis report: scalasca -examine <experiment-archive|report> # square
-v: enable verbose commentary -n: show actions without taking them -h: show quick reference guide (only)

NPB-MPI-BT instrumented build
● Return to root directory and clean-up
● Re-build specifying Scalasca instrumenter as PREP
% make clean
% make bt NPROCS=16 CLASS=W PREP=”scalasca -instrument”cd BT; make NPROCS=16 CLASS=W SUBTYPE= VERSION=gmake: Entering directory 'BT'cd ../sys; cc -o setparams setparams.c../sys/setparams bt 16 Wscalasca -instrument mpif77 -c -O bt.f...scalasca -instrument mpif77 -c -O setup_mpi.fcd ../common; scalasca -instrument mpif77 -c -O print_results.fcd ../common; scalasca -instrument mpif77 -c -O timers.fscalasca -instrument mpif77 -c -O btio.fscalasca -instrument mpif77 -O -o ../bin/bt.W.16 \bt.o make_set.o initialize.o exact_solution.o exact_rhs.o \set_constants.o adi.o define.o copy_faces.o rhs.o solve_subs.o \x_solve.o y_solve.o z_solve.o add.o error.o verify.o setup_mpi.o \../common/print_results.o ../common/timers.o btio.oINFO: Instrumented executable for MPI measurementgmake: Leaving directory 'BT'

● PREP macro in Makefile definitions (config/make.def) canbe used as a preparator prefix for compile/link commands
● By default, PREP macro is not set and no instrumentation is performed for a regular “production” build
● Specifying a PREP value in the Makefile or on the make command line uses it as a prefix, e.g., for instrumentation■ make PREP=”scalasca -instrument”
NPB instrumentation
MPIF77 = $(PREP) mpif77FLINK = $(MPIF77)FFLAGS = -O
mpi-bt: $(OBJECTS) $(FLINK) $(FFLAGS) -o mpi-bt $(OBJECTS).f.o: $(MPIF77) $(FFLAGS) -c $<

BT-MPI summary measurement
● Run the application using the Scalasca measurement collection & analysis nexus prefixed to launch command
● Produces experiment directory ./epik_bt_16_sum
% scalasca -analyze mpiexec -np 16 ./bt.W.mpiS=C=A=N: Scalasca 1.2 runtime summarizationS=C=A=N: ./epik_bt_16_sum experiment archiveS=C=A=N: Sun Mar 29 16:36:31 2009: Collect startmpiexec -np 16 ./bt.A.mpi[00000]EPIK: Created new measurement archive ./epik_bt_16_sum[00000]EPIK: Activated ./epik_bt_16_sum [NO TRACE] (0.006s)
[... Application output ...]
[00000]EPIK: Closing experiment ./epik_bt_16_sum[00000]EPIK: 102 unique paths (102 max paths, 4 max frames, 0 unknown)[00000]EPIK: Unifying... done (0.023s)[00000]EPIK: Collating... done (0.049s)[00000]EPIK: Closed experiment ./epik_bt_16_sum (0.073s)S=C=A=N: Sun Mar 29 16:36:45 2009: Collect done (status=0) 14sS=C=A=N: ./epik_bt_16_sum complete.

BT-MPI measurement archive
● Experiment archive directory produced by measurement■ Created when measurement starts, to contain artifact files
associated with measurement and subsequent analyses■ Measurement blocked if directory already exists!
► Prevents inadvertent overwriting and corruption■ Titled automatically (by SCAN) with type of measurement,
name of target, number of processes (and threads), etc.► Can be specified if desired (e.g., via “-e” or EPK_TITLE)
or simply renamed (with “mv”) after measurement complete
■ Contents depend on type/stage of measurement & analysis
% ls epik_bt_16_sumepik.conf epik.log epik.path epitome.cube

BT-MPI summary analysis report examination
● Interactive exploration with Scalasca GUI
● Report scoring as textual output
% scalasca -examine epik_bt_16_sumINFO: Post-processing runtime summarization result...INFO: Displaying ./epik_bt_16_sum/summary.cube...
[GUI showing summary analysis report]
% scalasca -examine -s epik_bt_16_sumcube3_score ./epik_bt_16_sum/summary.cubeReading ./epik_bt_16_sum/summary.cube... done.Estimated aggregate size of event trace (total_tbc): 513,823,960 bytesEstimated size of largest process trace (max_tbc): 32,528,680 bytes(When tracing set ELG_BUFFER_SIZE to avoid intermediate flushes or reduce requirements using filter file listing names of USR regions.)
flt type max_tbc time % region ANY 32528680 220.22 100.00 (summary) ALL MPI 642712 194.57 88.35 (summary) MPI USR 31688040 24.62 11.18 (summary) USR COM 197928 1.03 0.47 (summary) COM

Analysis report exploration (opening view)

Analysis report exploration (system tree)
Distribution of selected metricfor call path by process/thread

Analysis report exploration (call tree)
Distribution of selected metric
across the call tree
Selection updatesmetrics shown incolumns to right

Analysis report exploration (metric tree)
Split base metrics into more specific metrics

Analysis report exploration (source browser)
Split base metrics into more specific metrics

BT-MPI summary analysis score
● Summary measurement analysis score reveals■ Total size of event trace would be over 500MB■ Maximum trace buffer size would be over 30MB per process
► smaller buffer would require flushes to disk during measurement resulting in substantial perturbation
■ 97% of the trace requirements are for USR regions► purely computational routines never found on COM call-paths
common to communication routines■ These USR regions contribute around 10% of total time
► however, much of that is very likely to be measurement overhead for frequently-executed small routines
● Advisable to tune measurement configuration■ Specify an adequate trace buffer size■ Specify a filter file listing (USR) regions not to be measured

BT-MPI summary analysis report breakdown
● Report scoring with region breakdown% cube3_score -r ./epik_bt_16_sum/summary.cube
flt type max_tbc time % region ANY 32528680 220.22 100.00 (summary) ALL MPI 642712 194.57 88.35 (summary) MPI USR 31688040 24.62 11.18 (summary) USR COM 197928 1.03 0.47 (summary) COM
USR 10231704 4.44 2.02 binvcrhs_ USR 10231704 3.06 1.39 matvec_sub_ USR 10231704 3.53 1.60 matmul_sub_ USR 492048 0.16 0.07 binvrhs_ USR 360576 0.12 0.05 exact_solution_ MPI 241500 0.27 0.12 MPI_Isend MPI 222180 0.12 0.06 MPI_Irecv MPI 173664 173.02 78.57 MPI_Wait USR 57888 0.06 0.03 lhsabinit_ USR 19296 3.53 1.60 y_solve_cell_ USR 19296 3.45 1.56 x_solve_cell_ USR 19296 3.54 1.61 z_solve_cell_ USR 19296 0.35 0.16 z_backsubstitute_...
USR
USR
COM
COM USR
USR MPI

BT-MPI summary analysis report filtering
● Report scoring with prospective filter listing 6 USR regions% cube3_score -r -f npb.filt ./epik_bt_16_sum/summary.cubeApplying filter "./npb.filt":Estimated aggregate size of event trace (total_tbc): 16,852,888 bytesEstimated size of largest process trace (max_tbc): 1,053,304 bytes
flt type max_tbc time % region + FLT 31475376 11.37 5.16 (summary) FLT * ANY 1053328 208.85 94.84 (summary) ALL-FLT - MPI 642712 194.57 88.35 (summary) MPI-FLT * USR 212688 13.25 6.02 (summary) USR-FLT * COM 197928 1.03 0.47 (summary) COM-FLT
+ USR 10231704 4.44 2.02 binvcrhs_ + USR 10231704 3.06 1.39 matvec_sub_ + USR 10231704 3.53 1.60 matmul_sub_ + USR 492048 0.16 0.07 binvrhs_ + USR 360576 0.12 0.05 exact_solution_ - MPI 241500 0.27 0.12 MPI_Isend - MPI 222180 0.12 0.06 MPI_Irecv - MPI 173664 173.02 78.57 MPI_Wait + USR 57888 0.06 0.03 lhsabinit_...
% cat npb.filt# filter for btbinvcrhs_matvec_sub_matmul_sub_binvrhs_exact_solution_lhsabinit_timer_*

BT-MPI filtered summary measurement
● Rename former measurement archive directory,set new filter configuration and re-run the measurement% mv epik_bt_16_sum epik_bt_16_sum.nofilt% export EPK_FILTER=npb.filt% scalasca -analyze mpiexec -np 16 ./bt.W.16S=C=A=N: Scalasca 1.2 runtime summarizationS=C=A=N: ./epik_bt_16_sum experiment archiveS=C=A=N: Sun Mar 29 16:58:34 2009: Collect startmpiexec -np 16 ./bt.W.16[00000]EPIK: Created new measurement archive ./epik_bt_16_sum[00000]EPIK: EPK_FILTER “npb.filt” filtered 6 of 96 functions[00000]EPIK: Activated ./epik_bt_16_sum [NO TRACE] (0.071s)
[... Application output ...]
[00000]EPIK: Closing experiment ./epik_bt_16_sum[00000]EPIK: 84 unique paths (84 max paths, 4 max frames, 0 unknowns)[00000]EPIK: Unifying... done (0.014s)[00000]EPIK: Collating... done (0.059s)[00000]EPIK: Closed experiment ./epik_bt_16_sum (0.075s)S=C=A=N: Sun Mar 29 16:58:41 2009: Collect done (status=0) 7sS=C=A=N: ./epik_bt_16_sum complete.

BT-MPI tuned summary analysis report score
● Scoring of new analysis report as textual output
● Significant reduction in runtime (measurement overhead)■ Not only reduced time for USR regions, but MPI reduced too!
● Further measurement tuning (filtering) may be appropriate■ e.g., use “timer_*” to filter timer_start_, timer_read_, etc.
% scalasca -examine -s epik_bt_16_sumINFO: Post-processing runtime summarization result...cube3_score ./epik_bt_16_sum/summary.cubeEstimated aggregate size of event trace (total_tbc): 16,852,888 bytesEstimated size of largest process trace (max_tbc): 1,053,328 bytes(When tracing set ELG_BUFFER_SIZE to avoid intermediate flushes or reduce requirements using filter file listing names of USR regions.)
flt type max_tbc time % region ANY 1053328 98.39 100.00 (summary) ALL MPI 642712 86.83 88.25 (summary) MPI USR 212688 9.88 10.04 (summary) USR COM 197928 1.68 1.71 (summary) COM

Summary analysis report exploration (filtered)
Same message statistics, but times greatly reduced

BT-MPI trace measurement collection ...
● Re-run the application using Scalasca nexus with “-t” flag
● Separate trace file per MPI rank written straight into new experiment directory ./epik_bt_16_trace
% scalasca -analyze -t mpiexec -np 16 ./bt.W.16S=C=A=N: Scalasca 1.2 trace collection and analysisS=C=A=N: ./epik_bt_16_trace experiment archiveS=C=A=N: Sun Apr 5 18:50:57 2009: Collect startmpiexec -np 16 ./bt.W.16[00000]EPIK: Created new measurement archive ./epik_bt_16_trace[00000]EPIK: EPK_FILTER "npb.filt" filtered 6 of 96 functions[00000]EPIK: Activated ./epik_bt_16_trace [10000000 bytes] (0.051s)
[... Application output ...]
[00000]EPIK: Closing experiment ./epik_bt_16_trace [0.016GB] (max 1053310)[00000]EPIK: Flushed 1053330 bytes to file ./epik_bt_16_trace/ELG/00000[00000]EPIK: 84 unique paths (84 max paths, 4 max frames, 0 unknowns)[00000]EPIK: Unifying... done (0.021s)[00013]EPIK: Flushed 1053306 bytes to file ./epik_bt_16_trace/ELG/00013...[00001]EPIK: Flushed 1053306 bytes to file ./epik_bt_16_trace/ELG/00001[00000]EPIK: [email protected]/s, [email protected]/s[00000]EPIK: Closed experiment ./epik_bt_16_trace (0.178s)S=C=A=N: Sun Apr 5 18:51:05 2009: Collect done (status=0) 8s [.. continued ...]

BT-MPI trace measurement ... analysis
● Continues with automatic (parallel) analysis of trace files
● Produces trace analysis report in experiment directory
S=C=A=N: Sun Apr 5 18:51:05 2009: Analyze startmpiexec -np 16 scout ./epik_bt_16_traceSCOUT Copyright (c) 1998-2009 Forschungszentrum Juelich GmbH
Analyzing experiment archive ./epik_bt_16_trace
Reading definitions file ... done (0.563s).Reading event trace files ... done (0.495s).Preprocessing ... done (0.134s).Analyzing event traces ... done (2.186s).Writing CUBE report ... done (0.160s).
Total processing time : 3.737sMax. memory usage : 7.000MB
S=C=A=N: Sun Apr 5 18:51:09 2009: Analyze done (status=0) 4sS=C=A=N: ./epik_bt_16_trace complete.
% scalasca -examine epik_bt_16_traceINFO: Post-processing runtime summarization result...INFO: Post-processing trace analysis report ...INFO: Displaying ./epik_bt_16_sum/trace.cube...
[GUI showing trace analysis report]

Trace analysis report exploration
Additional trace-based metrics in metric hierarchy

Further information
● Consult quick reference guide for further information
● CUBE GUI provides context sensitive help and on-line metric descriptions
● EPIK archive directories contain analysis report(s), measurement collection & analysis logs, etc.
● Instrumentation, measurement, analysis & presentation can all be extensively customized■ covered in more detailed presentation
● Visit www.scalasca.org or mail [email protected]
% scalasca -hScalasca 1.2 – quick reference guidepdfview /UNITE/packages/scalasca/1.2/doc/manuals/quickref.pdf
[PDF viewer showing quick reference guide]

EPIK user instrumentation API
● EPIK user instrumentation API■ #include “epik_user.h”■ EPIK_USER_REG(epik_solve, “<<Solve>>”)■ EPIK_USER_START(epik_solve)■ EPIK_USER_END(epik_solve)
● Can be used to mark initialization, solver & other phases■ Annotation macros ignored by default■ Instrumentation enabled with “-user” flag■ Also available for Fortran
► #include “epik_user.inc” and use C preprocessor
● Appear as additional regions in analyses■ Distinguishes performance of important phase from rest

EPIK measurement configuration
● Via ./EPIK.CONF file
● Via environment variables
● Via command-line flags (partially)
● To show current/default configuration
● Actual Scalasca measurement configuration saved in experiment archive as epik.conf
EPK_FILTER=npb.filtELG_BUFFER_SIZE=40000000
% export EPK_FILTER=npb.filt% export ELG_BUFFER_SIZE=40000000
% scalasca -analyze -f npb.filt ...
% epik_conf

CUBE algebra utilities
● Extracting solver sub-tree from analysis report
● Calculating difference of two reports
● Additional utilities for merging, calculating mean, etc.■ Default output of cube3_utility is a new report utility.cube
● Further utilities for report scoring & statistics● Run utility with “-h” (or no arguments) for brief usage info
% cube3_cut -r '<<Solve>>' epik_bt_16_trace/trace.cubeWriting cut.cube... done.
% cube3_diff epik_bt_16_trace/trace.cube cut.cubeWriting diff.cube... done.

Scalasca usage recap
0. Reference preparation for validation1. Program instrumentation: skin2. Summary measurement collection & analysis: scan [-s]3. Summary analysis report examination: square4. Summary experiment scoring: square -s5. Event trace collection & analysis: scan -t6. Event trace analysis report examination: square● General usage/help: scalasca [-h]● Instrumentation, measurement, analysis & presentation can
all be extensively customized■ covered in more detailed presentation
● Visit www.scalasca.org or mail [email protected]

58
skin – Scalasca application instrumenter
● Prepares application objects & executables for measurement■ skin = scalasca -instrument■ skin [options] <compile-or-link-command>
► defaults to automatic function instrumentation by compiler▬ available for most compilers, but not all
► for OpenMP, includes source-level pre-processing of directives to insert POMP instrumentation
■ [-pomp]► source-level pre-processing of OpenMP & POMP directives
instead of automatic compiler instrumentation■ [-user]
► additionally enable EPIK user instrumentation API► offers complementary program structure information for analyses
via user-provided annotations (e.g., phases, loops, ...)

59
scan – Scalasca measurement collection/analysis
● Runs application under control of measurement system to collect and analyze an execution experiment■ scan = scalasca -analyze■ scan [options] <application-launch-command>
► e.g., scan [options] [$MPIEXEC [mpiexec-options]] [target [args]]■ [-s] collect summarization experiment [default]■ [-t] collect event traces and then analyze them automatically■ Additional options
► [-e] experiment archive (directory) name► [-f filter] specify file listing routines to ignore during measurement► [-m metric1:metric2:...] include hardware counter metrics► [-n] preview scan and perform checks but don't execute► [-q] quiesce (disable most) measurement collection► [-a] (re-)analyze a previously collected experiment

60
square – Scalasca analysis report examiner
● Prepares and presents measurement analysis report(s) for interactive exploration■ square = scalasca -examine■ square [options] <experiment-archive|report>
► e.g., square epik_title■ Post-processes intermediate measurement analysis reports■ Launches GUI and presents default analysis report
(if multiple reports available)► trace analysis given precedence over summary analysis► select other reports via File/Open menu
■ [-s] skip display and output textual score report► estimate total trace size and maximum rank trace size► breakdown of USR vs. MPI/OMP vs. COM region requirements

Performance analysis & tuningcase studies
Brian WylieJülich Supercomputing Centre
[email protected] 2009

Case studies
● Example experiments:■ PEPC-B
► 1,024 MPI process comparison between BG/P & Cray XT4■ jubl_xns
► scalability study on BG/L up to 4,096 MPI processes► remediation of scalability problems with P2P synch & MPI_Scan
■ jugene_sweep3d► 65,536 MPI processes on BG/P (trace)
■ jump_zeusmp2► 512 MPI processes on p690 cluster (summary & trace)
■ marenostrum_wrf-nmm► 1600 MPI processes on JS21 blade cluster, solver extract► summary analysis with 8 PowerPC hardware counters► trace analysis showing NxN completion problem on some blades

PEPC-B on BG/P & Cray XT case study
● Coulomb solver used for laser-plasma simulations■ Developed by Paul Gibbon (JSC)■ Tree-based particle storage with dynamic load-balancing
● MPI version■ PRACE benchmark configuration, including file I/O
● Run on BlueGene/P in dual mode with 1024 processes■ 2 processes per quad-core PowerPC node, 1100 seconds
● Run on Cray XT in VN (4p) mode with 1024 processes■ 4 processes per quad-core Opteron node, 360 seconds

PEPC@1024 on BlueGene/P: Wait at NxN time
Time waiting for last rankto enter MPI_Allgather

PEPC@1024 on Cray XT4: Wait at NxN time
Time waiting for last rankto enter MPI_Allgather

PEPC-B on BG/P & Cray XT experience
● Despite very different processor and network performance, measurements and analyses can be easily compared■ different compilers affect function naming & in-lining
● Both spend roughly two-thirds of time in computation■ tree_walk has expensive computation & communication
● Both waste 30% of time waiting to enter MPI_Barrier■ not localized to particular processes, since particles are
regularly redistributed● Most of collective communication time is also time waiting
for last ranks to enter MPI_Allgather & MPI_Alltoall■ imbalance for MPI_Allgather twice as severe on BlueGene/P,
however, almost 50x less for MPI_Alltoall■ collective completion times also notably longer on Cray XT

Hæmodynamic flowpressure distributionPartitioned finite-element mesh
XNS on BlueGene/L case study
● CFD simulation of unsteady flows■ developed by RWTH CATS group of Marek Behr■ exploits finite-element techniques, unstructured 3D meshes,
iterative solution strategies● MPI parallel version (Dec-2006)■ >40,000 lines of Fortran & C■ DeBakey blood-pump dataset (3,714,611 elements)

XNS-DeBakey on jubl@4096 summary analysis
Masses ofP2P synchoperations
Processesall equally
responsible
Point-to-point msgsw/o data
Primarilyin scatter& gather
Primarilyin scatter& gather

XNS-DeBakey scalability on BG/L
Originalperformancepeaked at 132 ts/hr
3.5x overallimprovementto 461 ts/hr

XNS on BlueGene/L experience
● Globally synchronized high-resolution clock facilitates efficient measurement & analysis
● Restricted compute node memory limits trace buffer size and analyzable trace size
● Summarization identified bottleneck due to unintended P2P synchronizations (messages with zero-sized payload)
● 4x solver speedup after replacing MPI_Sendrecv operations with size-dependant separate MPI_Send and MPI_Recv
● Significant communication imbalance remains due to mesh partitioning and mapping onto processors
● MPI_Scan implementation found to contain implicit barrier■ responsible for 6% of total time with 4096 processes■ decimated when substituted with simultaneous binomial tree

Sweep3d on BlueGene/P case study
● 3D neutron transport simulation■ ASC benchmark■ direct order solve uses diagonal sweeps through grid cells
● MPI parallel version 2.2b using 2D domain decomposition■ ~2,000 lines (12 source modules), mostly Fortran77
● Run on IBM BlueGene/P in VN mode with 64k processes■ 175GB trace written in 17 minutes, analyzed in 160 seconds
► 16 minutes just to create 64k files (one per MPI rank)► SIONlib reduces this to a couple of seconds
■ Mapping of 256x256 grid of processes onto 3D physical torus results in regular performance artifacts

72
sweep3d on jugene@64k trace analysis
Computation timedistribution likely dueto mapping onto torus

73
sweep3d on jugene@64k trace (wait) analysis
Late Receiver timedistribution likely dueto mapping onto torus

WRF/MareNostrum case study
● Numerical weather prediction■ public domain code developed by US NOAA■ flexible, state-of-the-art atmospheric simulation■ Non-hydrostatic Mesoscale Model (NMM)
● MPI parallel version 2.1.2 (Jan-2006)■ >315,000 lines (in 480 source modules): 75% Fortran, 25% C
● Eur-12km dataset configuration■ 3-hour forecast (360 timesteps) with checkpointing disabled
● Run with 1600 processes on MareNostrum■ IBM BladeCenter cluster at BSC
● Scalasca summary and trace measurements■ 15% measurement dilation with 8 hardware counters■ 23GB trace analysis in 5 mins

75
WRF on MareNostrum@1600 with HWC metrics
Distribution ofdata load hits inlevel 2 cache onapplication MPI2D grid topology

76
WRF on MareNostrum@1600 trace analysis
Imbalanceat exit fromAllreduce
MareNostrumJS21 topologyshows blades

77
WRF on MareNostrum@1600 time-line extract
Some ranks require extra 1.75sto complete 51st MPI_Allreduce

WRF/MareNostrum experience
● Limited system I/O requires careful management■ Selective instrumentation and measurement filtering
● PowerPC hardware counter metrics included in summary● Automated trace analysis quantified impact of imbalanced
exit from MPI_Allreduce in “NxN completion time” metric■ Intermittent but serious MPI library/system problem,
that restricts application scalability■ Only a few processes directly impacted, however,
communication partners also quickly blocked● Presentation using logical and physical topologies ■ MPI Cartesian topology provides application insight■ Hardware topology helps localize system problems

AMMP on Altix case study
● Molecular mechanics simulation■ original version developed by Robert W. Harrison (GeorgiaSU)
● SPEC OMP benchmark parallel version■ ~14,000 lines (in 28 source modules): 100% C
● Run with 32 threads on SGI Altix 4700 at TUD-ZIH■ Built with Intel compilers■ 333 simulation timesteps for 9582 atoms
● Scalasca summary measurement■ Minimal measurement dilation■ 60% of total time lost in synchronization with lock API■ 12% thread management overhead

80
ammp on jupiter@32 OpenMP lock analysis
OpenMPmetricsreworkedwith v1.2β
Lots of explicit locksynchronization is ascalability inhibitor

81
ammp on jupiter@32 OpenMP fork analysis
OpenMPmetricsreworkedwith v1.2β
Thread managementcosts vary by parallelregion & num_threads

NPB-MZ-BT on Louhi
● NPB-MZ-BT class B on Cray XT5 (8-core compute nodes)■ Part of NASA NAS Parallel Benchmark suite■ Hybrid OpenMP+MPI “multi-zone” parallelization■ 32 MPI processes with OMP_NUM_THREADS=8
► More threads created on some processes (and fewer on others) as application attempts to balance work distribution
■ Scalasca (1.2β) summary measurements (PrgEnv-pgi)► Testing of early prototype

32x8 summary analysis: Excl. execution time
Generally good processand thread load balance

32x8 summary analysis: Limited parallelism
Even through a numberof threads are never used

32x8 summary analysis: Idle threads time
However, serial executionsections are prevalent ...

32x8 summary analysis: MPI communication time
... typically while masterthread communicating

32x8 summary analysis: Implicit barrier time
Thread imbalance alsoresults in substantial loss

32x8 summary analysis: Thread management
Thread management costhigh with over-subscription

32x8 summary analysis: Critical section time
Atomic statements duringverification are efficient

Acknowledgements
● The application and benchmark developers who provided their codes and/or measurement archives
● The facilities who made their HPC resources available■ ALCF, BSC, CSC, CSCS, EPCC, JSC, HLRS, ICL, LRZ,
NCCS/ORNL, RWTH, RZG, TeraGrid/TACC, TUD/ZIH

91
Further information
Scalable performance analysis of large-scale parallel applications■ toolset for scalable performance measurement & analysis
of MPI, OpenMP & hybrid parallel applications■ supporting most popular HPC computer systems■ available under New BSD open-source license■ sources, documentation & publications:
► http://www.scalasca.org►mailto: [email protected]

Virtual Institute – High Productivity Supercomputing
Goal: Improve the quality and accelerate the development process of complex simulation codes running on highly-parallel computer systems
● Funded by Helmholtz Associationof German Research Centres
● Activities■ Development and integration of HPC programming tools
► Correctness checking & performance analysis■ Training workshops■ Service
► Support email lists► Application engagement
■ Academic workshops
www.vi-hps.org