SCALABLE GRAPH ANALYTICS - uni-leipzig.de · ... (dynamically changing graph data) veracity (high...
73
www.scads.de SCALABLE GRAPH ANALYTICS ERHARD RAHM
Transcript of SCALABLE GRAPH ANALYTICS - uni-leipzig.de · ... (dynamically changing graph data) veracity (high...
www.scads.de
SCALABLE GRAPH ANALYTICS
ERHARD RAHM
2
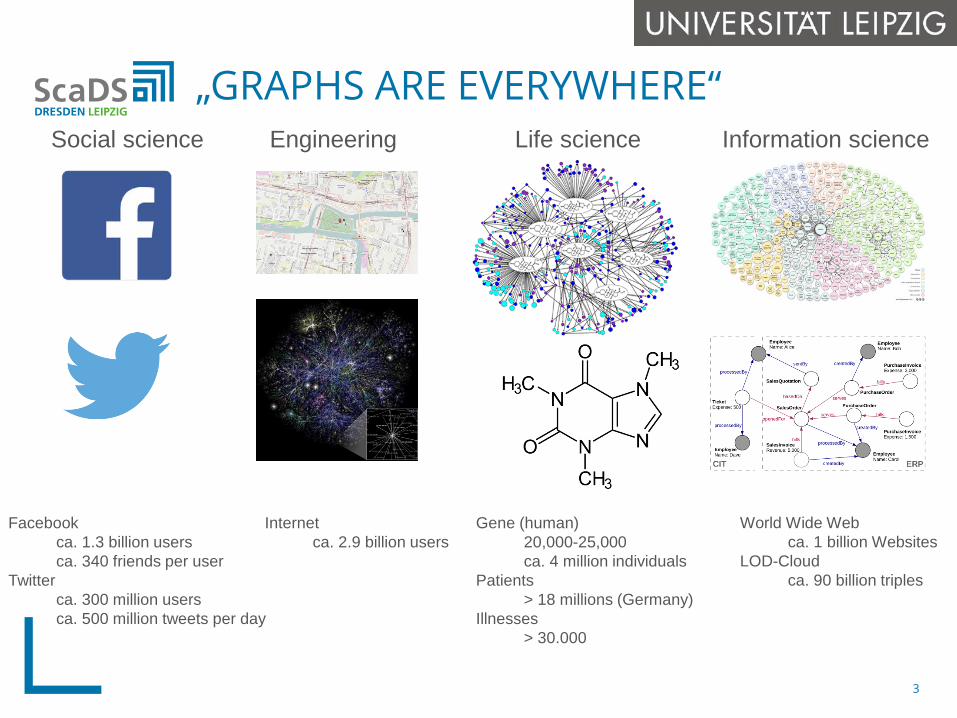
„GRAPHS ARE EVERYWHERE“
3
Facebookca. 1.3 billion usersca. 340 friends per user
Twitterca. 300 million usersca. 500 million tweets per day
Internetca. 2.9 billion users
Gene (human)20,000-25,000ca. 4 million individuals
Patients> 18 millions (Germany)
Illnesses> 30.000
World Wide Webca. 1 billion Websites
LOD-Cloudca. 90 billion triples
Social science Engineering Life science Information science
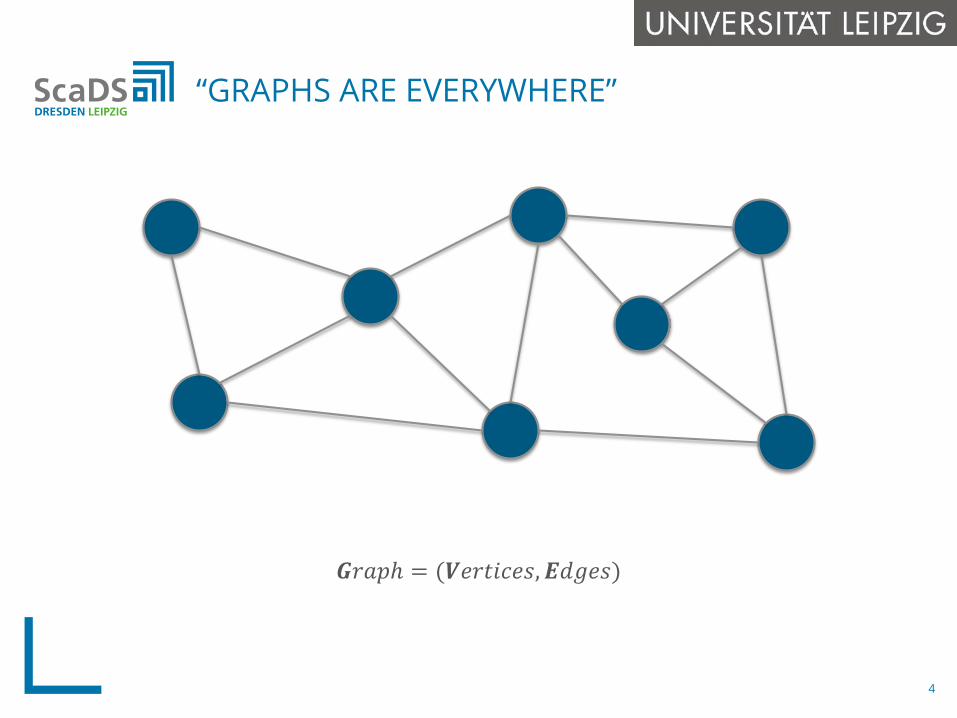
𝑮𝑮𝑟𝑟𝑟𝑟𝑟𝑟𝑟 = (𝑽𝑽𝑒𝑒𝑟𝑟𝑒𝑒𝑒𝑒𝑒𝑒𝑒𝑒𝑒𝑒,𝑬𝑬𝑑𝑑𝑑𝑑𝑒𝑒𝑒𝑒)
“GRAPHS ARE EVERYWHERE”
4
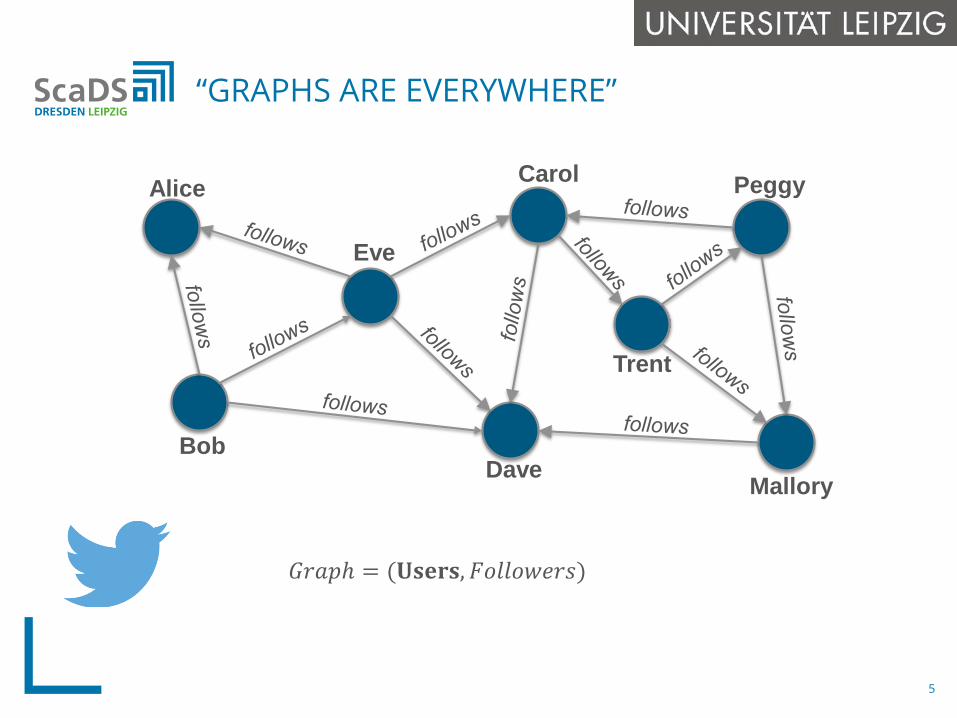
𝐺𝐺𝑟𝑟𝑟𝑟𝑟𝑟𝑟 = (𝐔𝐔𝐔𝐔𝐔𝐔𝐔𝐔𝐔𝐔,𝐹𝐹𝐹𝐹𝐹𝐹𝐹𝐹𝐹𝐹𝐹𝐹𝑒𝑒𝑟𝑟𝑒𝑒)
“GRAPHS ARE EVERYWHERE”
Alice
Bob
Eve
Dave
Carol
Mallory
Peggy
Trent
5
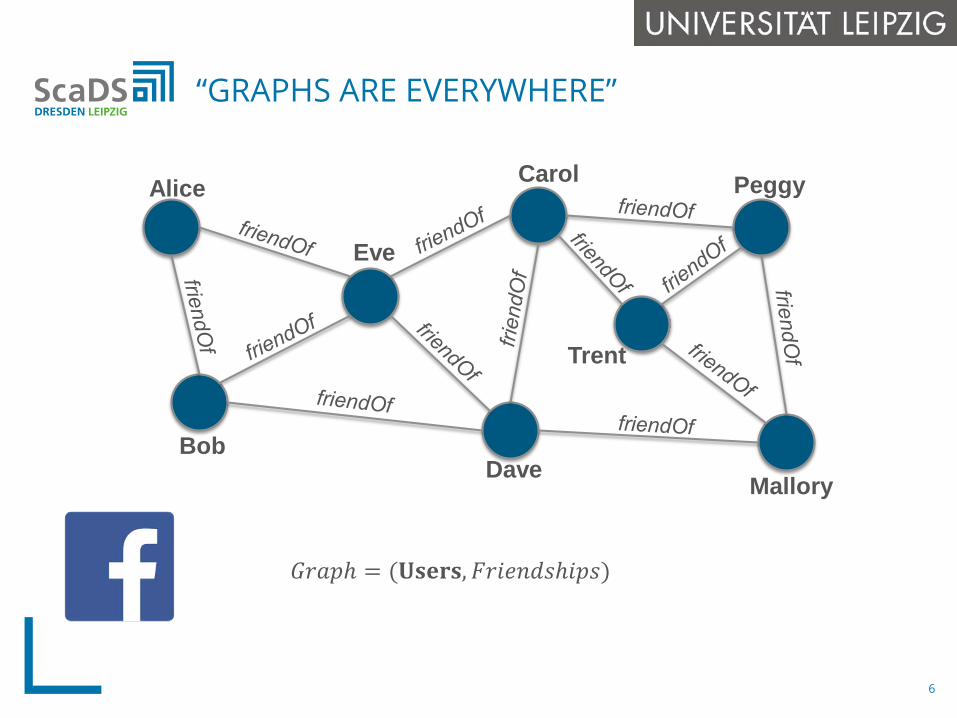
𝐺𝐺𝑟𝑟𝑟𝑟𝑟𝑟𝑟 = (𝐔𝐔𝐔𝐔𝐔𝐔𝐔𝐔𝐔𝐔,𝐹𝐹𝑟𝑟𝑒𝑒𝑒𝑒𝐹𝐹𝑑𝑑𝑒𝑒𝑟𝑒𝑒𝑟𝑟𝑒𝑒)
“GRAPHS ARE EVERYWHERE”
Alice
Bob
Eve
Dave
Carol
Mallory
Peggy
Trent
6
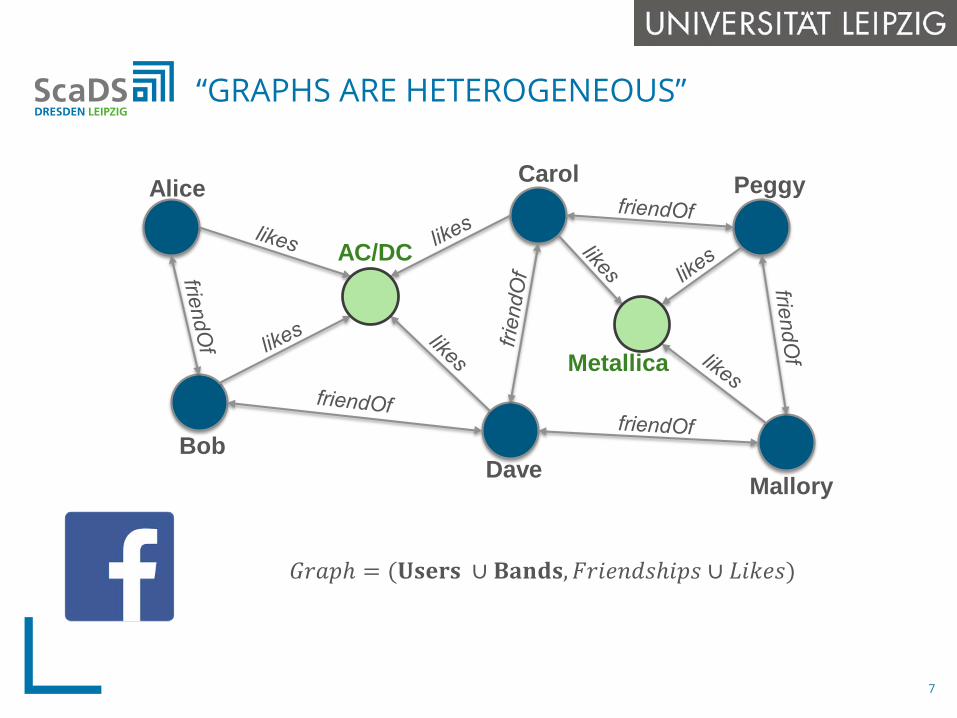
“GRAPHS ARE HETEROGENEOUS”
Alice
Bob
AC/DC
Dave
Carol
Mallory
Peggy
Metallica
𝐺𝐺𝑟𝑟𝑟𝑟𝑟𝑟𝑟 = (𝐔𝐔𝐔𝐔𝐔𝐔𝐔𝐔𝐔𝐔 ∪ 𝐁𝐁𝐁𝐁𝐁𝐁𝐁𝐁𝐔𝐔,𝐹𝐹𝑟𝑟𝑒𝑒𝑒𝑒𝐹𝐹𝑑𝑑𝑒𝑒𝑟𝑒𝑒𝑟𝑟𝑒𝑒 ∪ 𝐿𝐿𝑒𝑒𝐿𝐿𝑒𝑒𝑒𝑒)
7
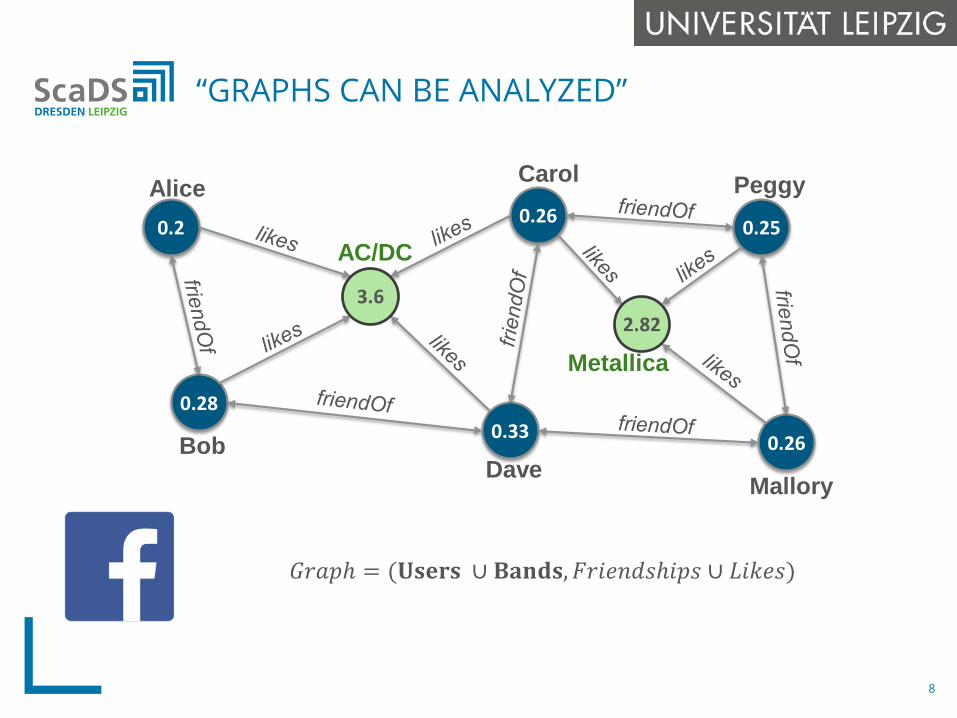
0.2
0.28
0.26
0.33
0.25
0.26
“GRAPHS CAN BE ANALYZED”
Alice
Bob
AC/DC
Dave
Carol
Mallory
Peggy
Metallica
3.62.82
𝐺𝐺𝑟𝑟𝑟𝑟𝑟𝑟𝑟 = (𝐔𝐔𝐔𝐔𝐔𝐔𝐔𝐔𝐔𝐔 ∪ 𝐁𝐁𝐁𝐁𝐁𝐁𝐁𝐁𝐔𝐔,𝐹𝐹𝑟𝑟𝑒𝑒𝑒𝑒𝐹𝐹𝑑𝑑𝑒𝑒𝑟𝑒𝑒𝑟𝑟𝑒𝑒 ∪ 𝐿𝐿𝑒𝑒𝐿𝐿𝑒𝑒𝑒𝑒)
8
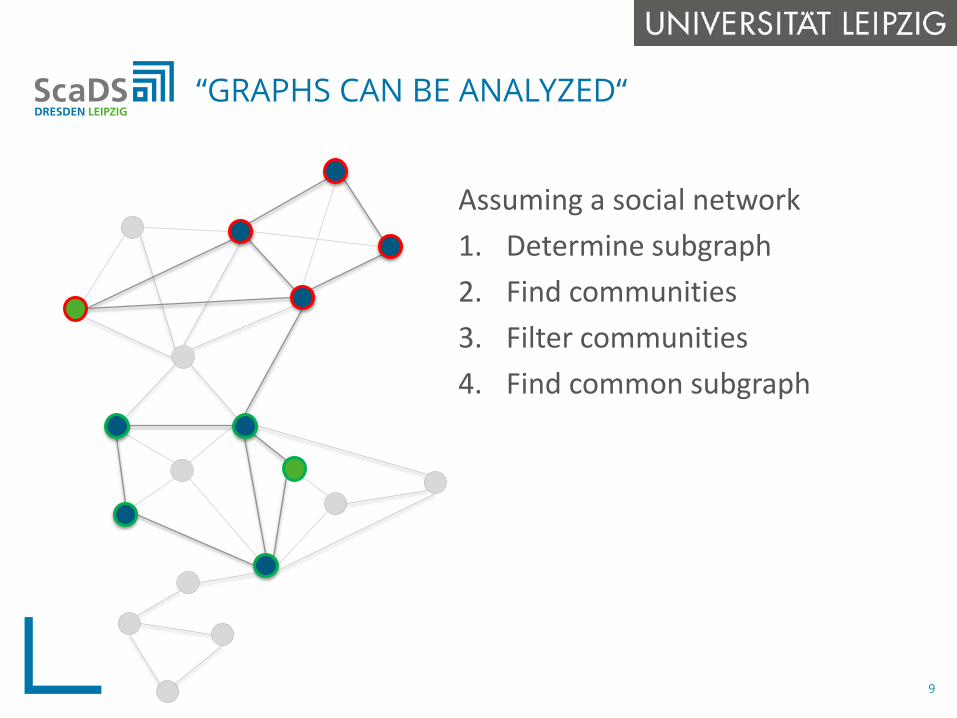
“GRAPHS CAN BE ANALYZED“
Assuming a social network1. Determine subgraph2. Find communities3. Filter communities4. Find common subgraph
9
all „V“ challenges volume (scalability) Variety (support for heterogenous data / data
integration) Velocity (dynamically changing graph data) veracity (high data quality) value (improved business value)
ease-of-use
high cost-effectiveness
GRAPH DATA ANALYTICS: HIGH-LEVEL REQUIREMENTS
10
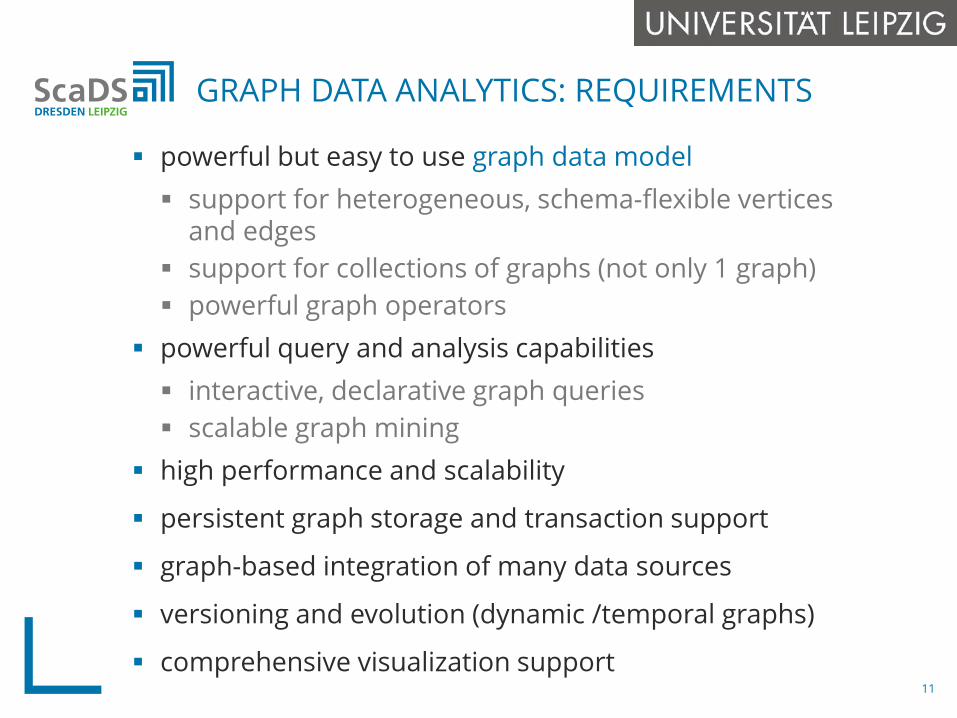
powerful but easy to use graph data model support for heterogeneous, schema-flexible vertices
and edges support for collections of graphs (not only 1 graph) powerful graph operators
powerful query and analysis capabilities interactive, declarative graph queries scalable graph mining
high performance and scalability
persistent graph storage and transaction support
graph-based integration of many data sources
versioning and evolution (dynamic /temporal graphs)
comprehensive visualization support
GRAPH DATA ANALYTICS: REQUIREMENTS
11
Motivation graph data requirements
Graph data systems graph database systems distributed graph processing systems (Pregel, etc.) distributed graph dataflow systems (GraphX, Gelly)
Gradoop architecture Extended Property Graph Model (EPGM) implementation and performance evaluation
Open challenges
AGENDA
12
First Generation: research prototypes only peak popularity in early 90s
Second Generation: NoSQL movement commercial systems
GRAPH DATABASES
graph data model mostly property graphs, RDF or generic graphs different vertex and edge data graph operators (traversal, pattern matching) /
queries
application scope mostly queries/OLTP on small graph portions some support for analytical queries/computations
(analyze whole graph, e.g., page rank)
RECENT GRAPH DATABASE SYSTEMS
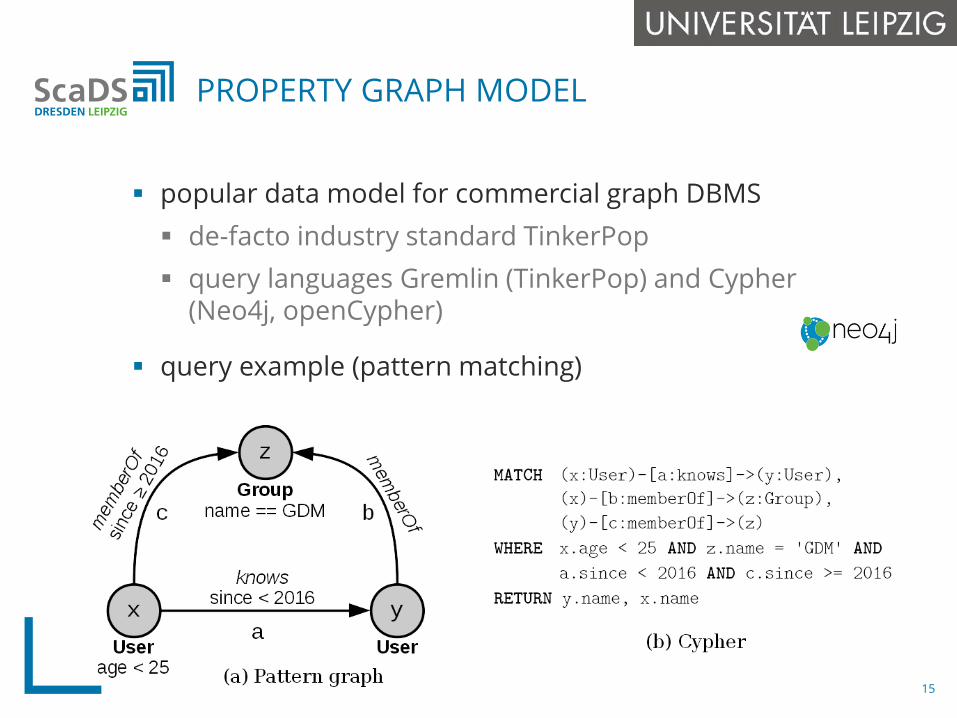
popular data model for commercial graph DBMS de-facto industry standard TinkerPop query languages Gremlin (TinkerPop) and Cypher
(Neo4j, openCypher)
query example (pattern matching)
PROPERTY GRAPH MODEL
15
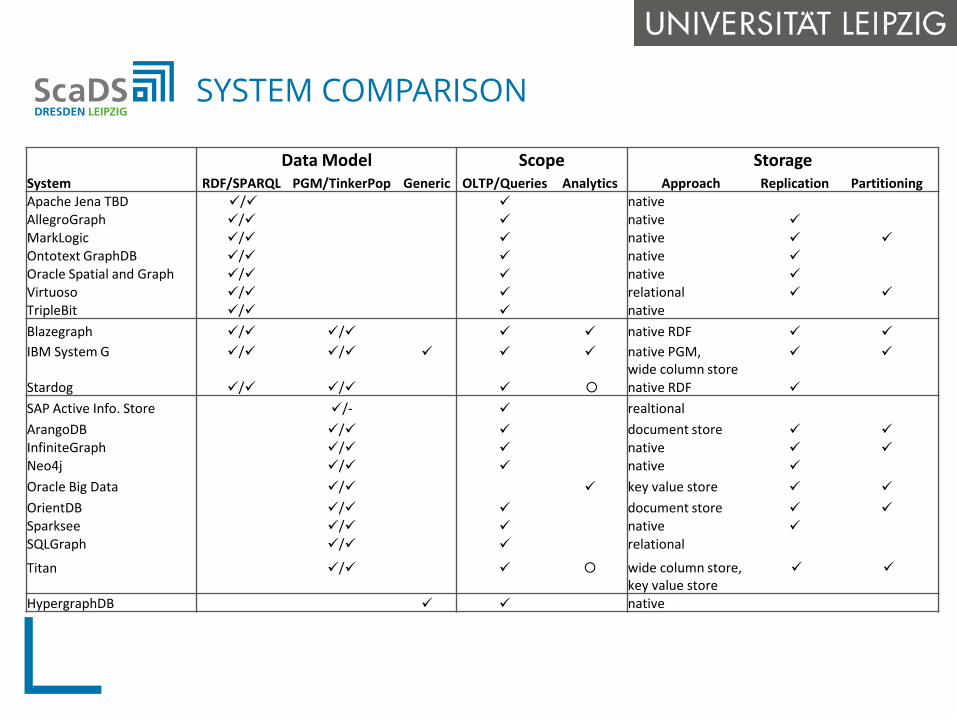
Data Model Scope StorageSystem RDF/SPARQL PGM/TinkerPop Generic OLTP/Queries Analytics Approach Replication PartitioningApache Jena TBD / native AllegroGraph / native MarkLogic / native Ontotext GraphDB / native Oracle Spatial and Graph / native Virtuoso / relational TripleBit / nativeBlazegraph / / native RDF IBM System G / / native PGM,
wide column store
Stardog / / native RDF SAP Active Info. Store /- realtionalArangoDB / document store InfiniteGraph / native Neo4j / native Oracle Big Data / key value store OrientDB / document store Sparksee / native SQLGraph / relational
Titan / wide column store, key value store
HypergraphDB native
SYSTEM COMPARISON
COMPARISON
17
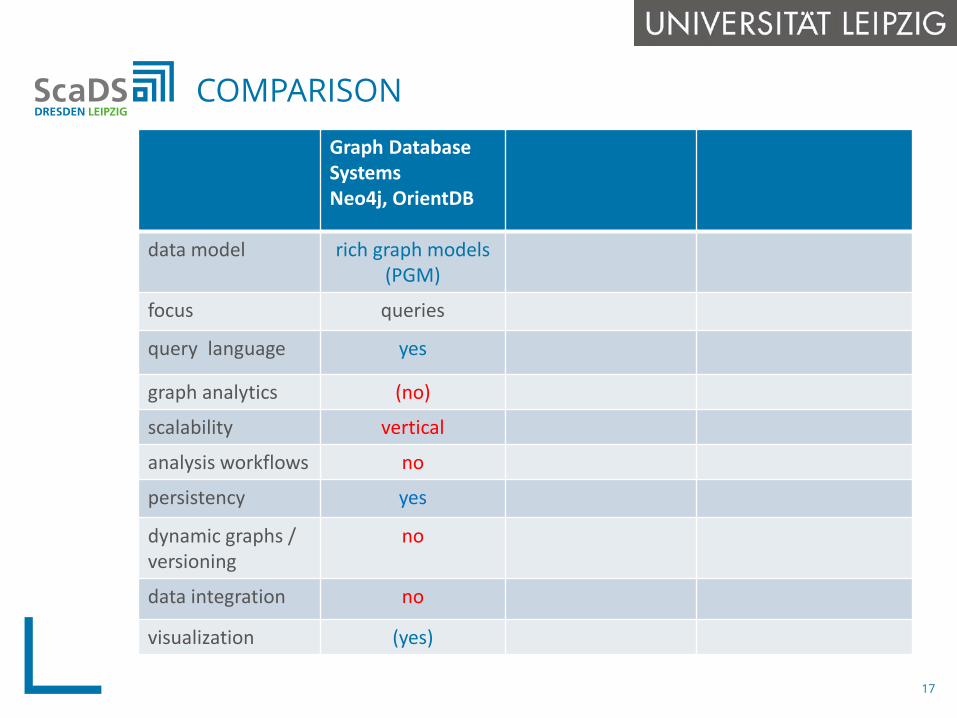
Graph Database SystemsNeo4j, OrientDB
data model rich graph models(PGM)
focus queries
query language yes
graph analytics (no)
scalability vertical
analysis workflows no
persistency yes
dynamic graphs / versioning
no
data integration no
visualization (yes)
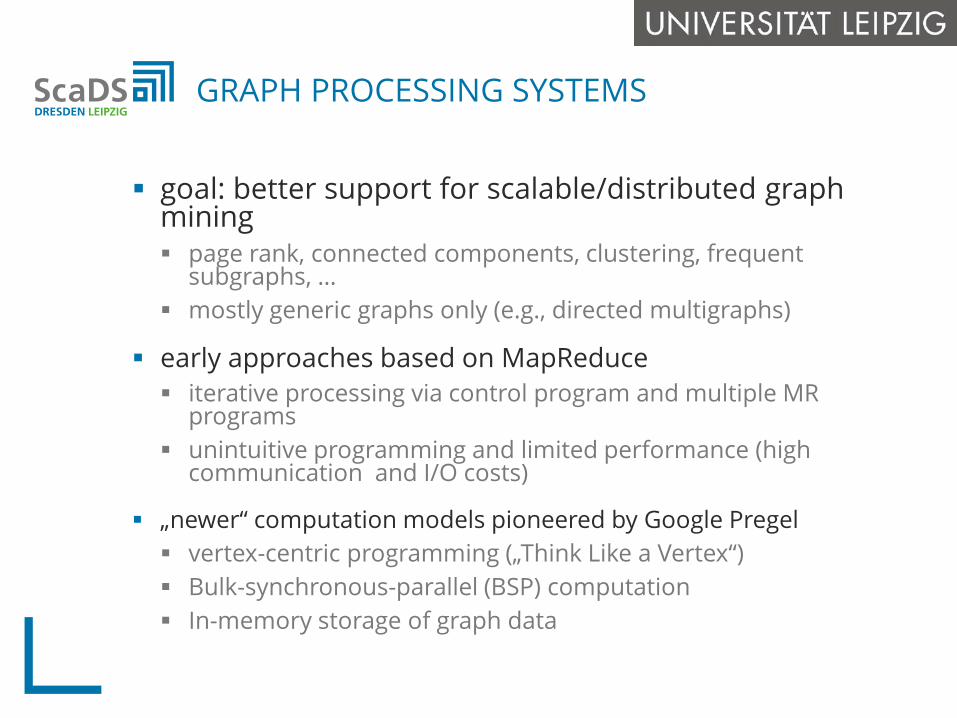
goal: better support for scalable/distributed graphmining page rank, connected components, clustering, frequent
subgraphs, … mostly generic graphs only (e.g., directed multigraphs)
early approaches based on MapReduce iterative processing via control program and multiple MR
programs unintuitive programming and limited performance (high
communication and I/O costs)
„newer“ computation models pioneered by Google Pregel vertex-centric programming („Think Like a Vertex“) Bulk-synchronous-parallel (BSP) computation In-memory storage of graph data
GRAPH PROCESSING SYSTEMS
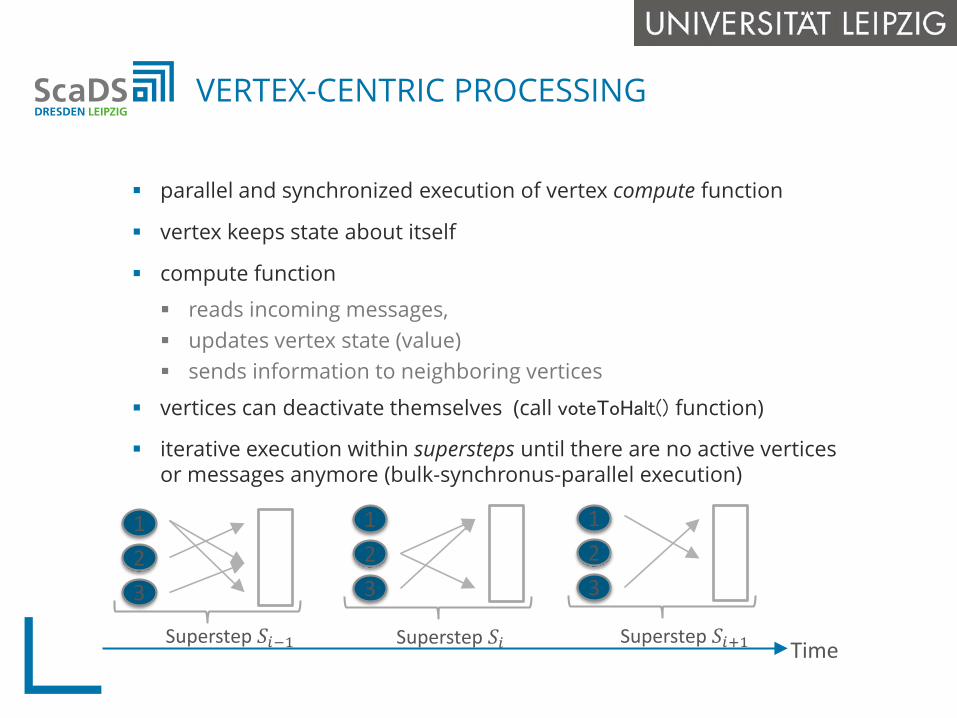
parallel and synchronized execution of vertex compute function
vertex keeps state about itself
compute function
reads incoming messages, updates vertex state (value) sends information to neighboring vertices
vertices can deactivate themselves (call voteToHalt() function)
iterative execution within supersteps until there are no active verticesor messages anymore (bulk-synchronus-parallel execution)
VERTEX-CENTRIC PROCESSING
Time
123
Superstep 𝑆𝑆𝑖𝑖−1
123
Superstep 𝑆𝑆𝑖𝑖
123
Superstep 𝑆𝑆𝑖𝑖+1
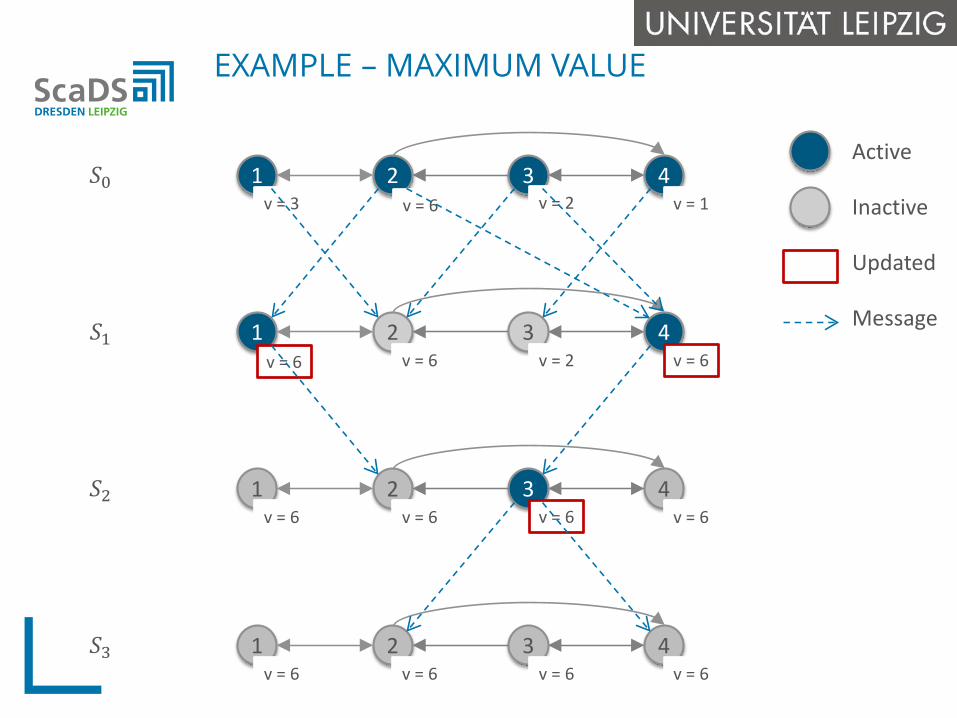
EXAMPLE – MAXIMUM VALUE
1 2 3 4v = 3 v = 6 v = 2 v = 1
𝑆𝑆0
1 2 3 4v = 6 v = 6 v = 2 v = 6
1 2 3 4v = 6 v = 6 v = 6 v = 6
1 2 3 4v = 6 v = 6 v = 6 v = 6
𝑆𝑆1
𝑆𝑆2
𝑆𝑆3
Active
Inactive
Updated
Message
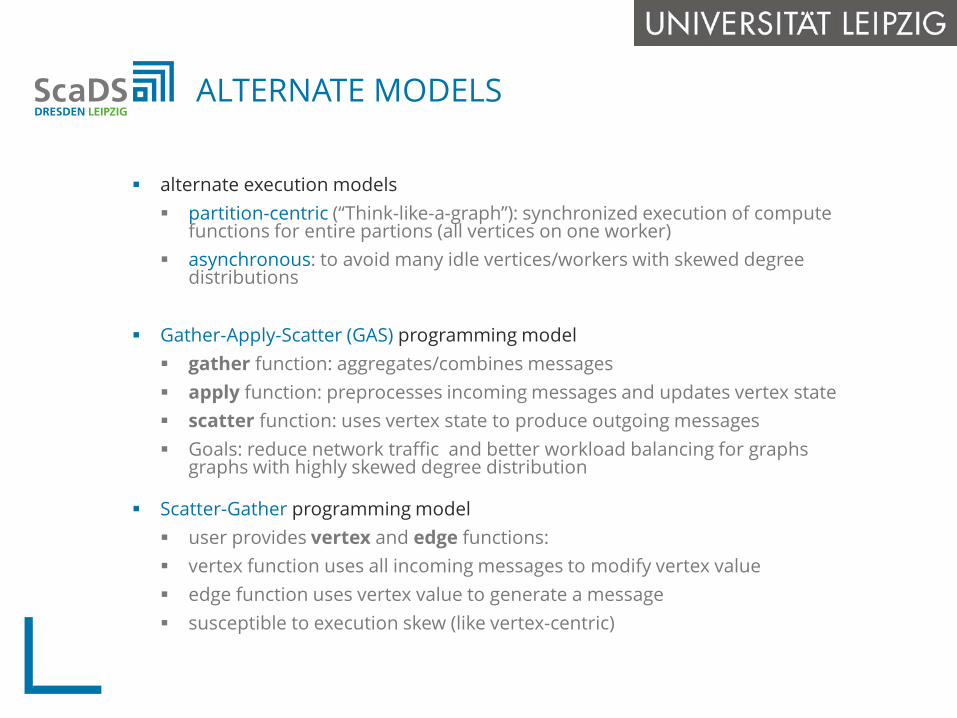
alternate execution models partition-centric (“Think-like-a-graph”): synchronized execution of compute
functions for entire partions (all vertices on one worker) asynchronous: to avoid many idle vertices/workers with skewed degree
distributions
Gather-Apply-Scatter (GAS) programming model gather function: aggregates/combines messages apply function: preprocesses incoming messages and updates vertex state scatter function: uses vertex state to produce outgoing messages Goals: reduce network traffic and better workload balancing for graphs
graphs with highly skewed degree distribution
Scatter-Gather programming model user provides vertex and edge functions: vertex function uses all incoming messages to modify vertex value edge function uses vertex value to generate a message susceptible to execution skew (like vertex-centric)
ALTERNATE MODELS
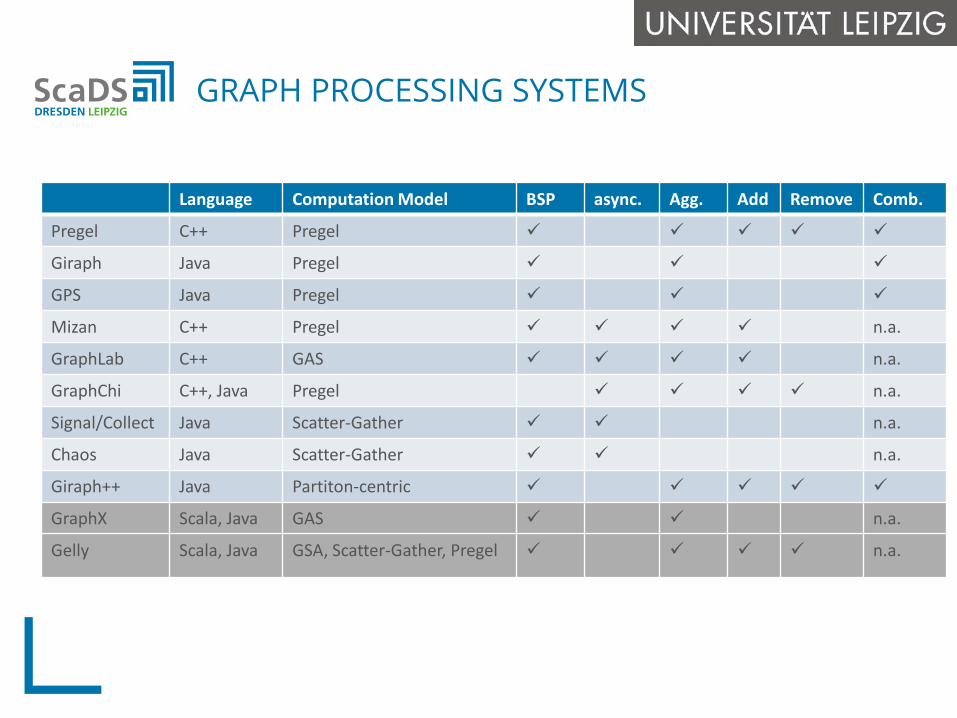
GRAPH PROCESSING SYSTEMS
Language Computation Model BSP async. Agg. Add Remove Comb.
Pregel C++ Pregel
Giraph Java Pregel
GPS Java Pregel
Mizan C++ Pregel n.a.
GraphLab C++ GAS n.a.
GraphChi C++, Java Pregel n.a.
Signal/Collect Java Scatter-Gather n.a.
Chaos Java Scatter-Gather n.a.
Giraph++ Java Partiton-centric
GraphX Scala, Java GAS n.a.
Gelly Scala, Java GSA, Scatter-Gather, Pregel n.a.
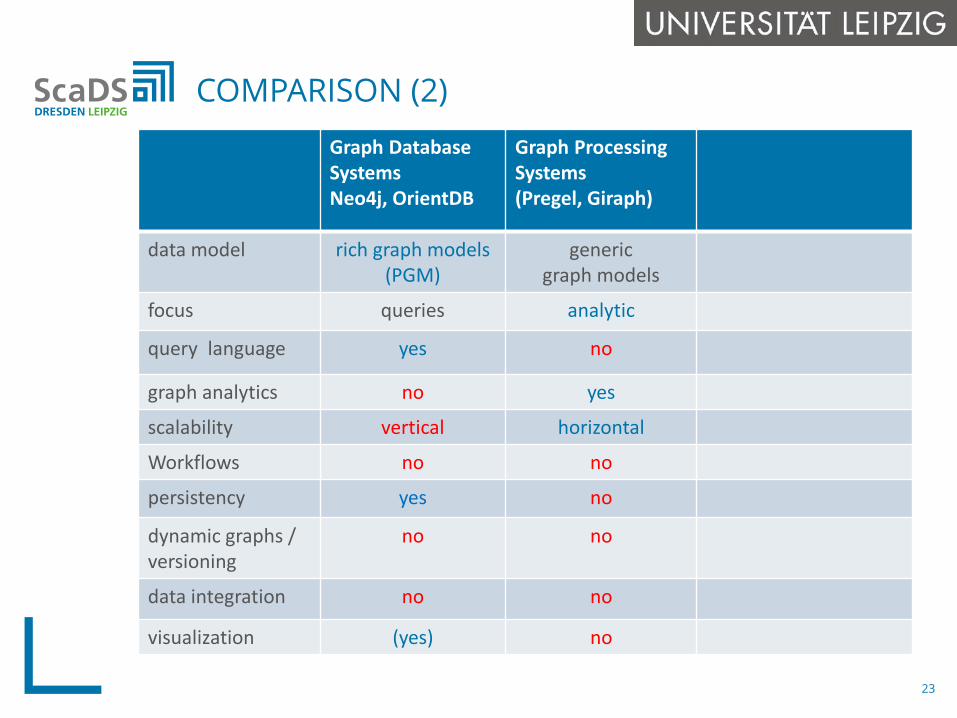
COMPARISON (2)
23
Graph Database SystemsNeo4j, OrientDB
Graph Processing Systems(Pregel, Giraph)
data model rich graph models(PGM)
genericgraph models
focus queries analytic
query language yes no
graph analytics no yes
scalability vertical horizontal
Workflows no no
persistency yes no
dynamic graphs / versioning
no no
data integration no no
visualization (yes) no
Graph processing systems are specialized systems tailored programming abstractions for fast execution of
a single iterative graph algorithm
complex analytical problems often require the combination of multiple techniques, e.g.: creation of combined graph structures from different
sources (data extraction, transformation and integration)
different analysis steps: queries, iterative graph processing, machine learning, …
Dataflow systems can combine such tasks within dataflow programs/workflows/scripts for distributed execution 1st generation: MapReduce workflows Apache Spark/Flink: in-memory dataflow systems
GRAPH DATAFLOW SYSTEMS
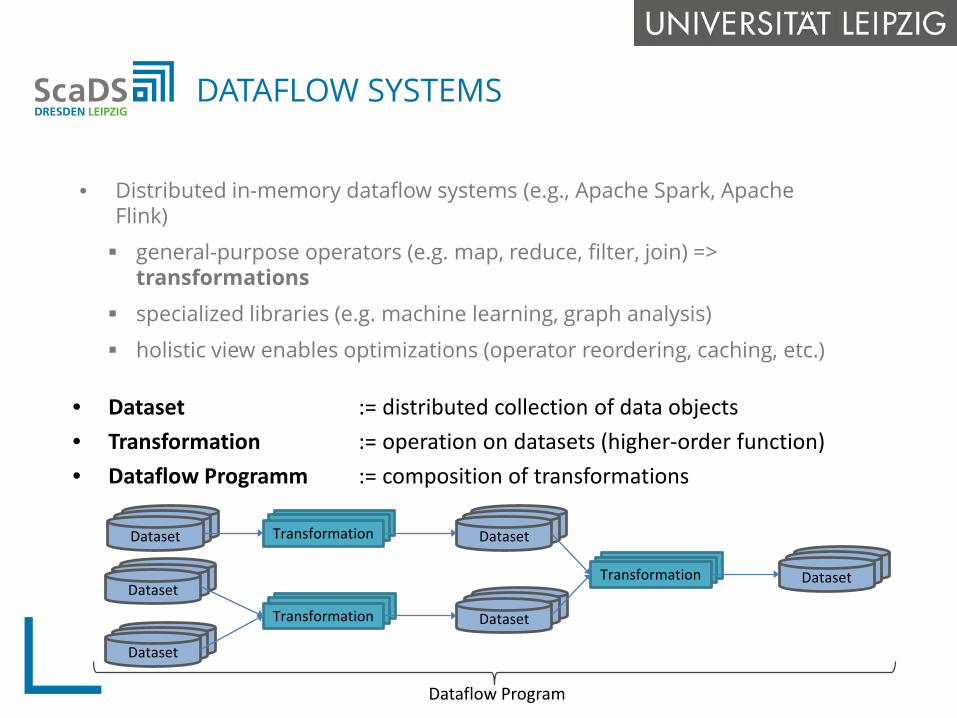
• Distributed in-memory dataflow systems (e.g., Apache Spark, Apache Flink)
general-purpose operators (e.g. map, reduce, filter, join) => transformations
specialized libraries (e.g. machine learning, graph analysis)
holistic view enables optimizations (operator reordering, caching, etc.)
DATAFLOW SYSTEMS
• Dataset := distributed collection of data objects• Transformation := operation on datasets (higher-order function)• Dataflow Programm := composition of transformations
Dataset
Dataset
Dataset
Transformation
Transformation
Dataset
Dataset
Transformation Dataset
Dataflow Program
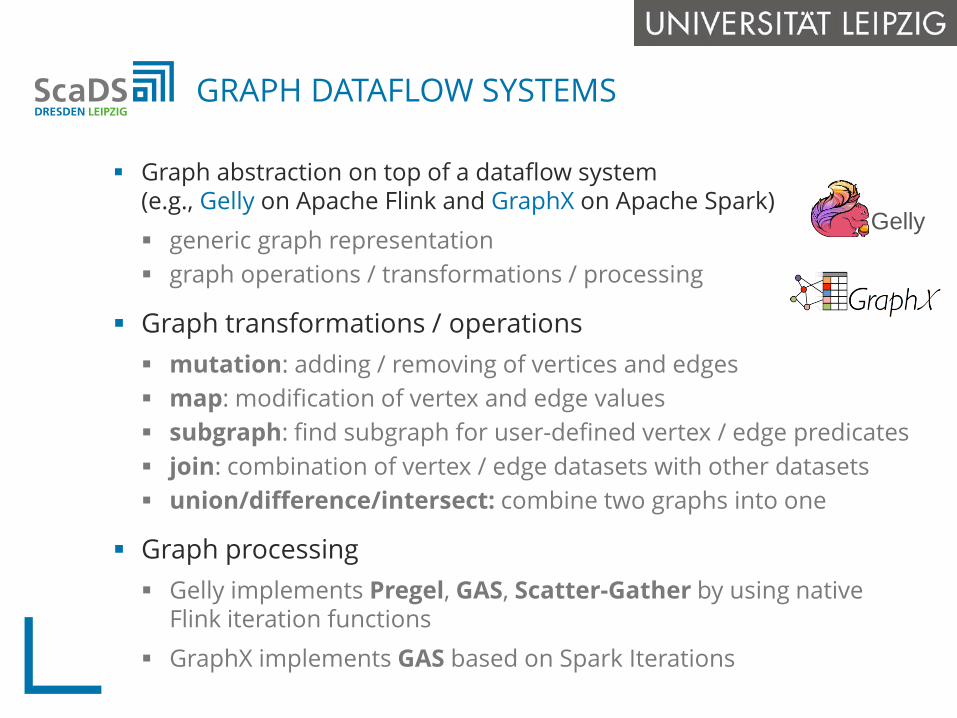
Graph abstraction on top of a dataflow system (e.g., Gelly on Apache Flink and GraphX on Apache Spark) generic graph representation graph operations / transformations / processing
Graph transformations / operations mutation: adding / removing of vertices and edges map: modification of vertex and edge values subgraph: find subgraph for user-defined vertex / edge predicates join: combination of vertex / edge datasets with other datasets union/difference/intersect: combine two graphs into one
Graph processing Gelly implements Pregel, GAS, Scatter-Gather by using native
Flink iteration functions GraphX implements GAS based on Spark Iterations
GRAPH DATAFLOW SYSTEMS
Gelly

COMPARISON (3)
27
Graph Database SystemsNeo4j, OrientDB
Graph Processing Systems(Pregel, Giraph)
Graph DataflowSystems (Flink Gelly, Spark GraphX)
data model rich graph models(PGM)
genericgraph models
genericgraph models
focus queries analytic analytic
query language yes no no
graph analytics no yes yes
scalability vertical horizontal horizontal
Workflows no no yes
persistency yes no no
dynamic graphs / versioning
no no no
data integration no no no
visualization (yes) no no
An end-to-end framework for scalable(distributed) graph data managementand analytics supporting a rich graph
data model and queries
WHAT‘S MISSING?
28
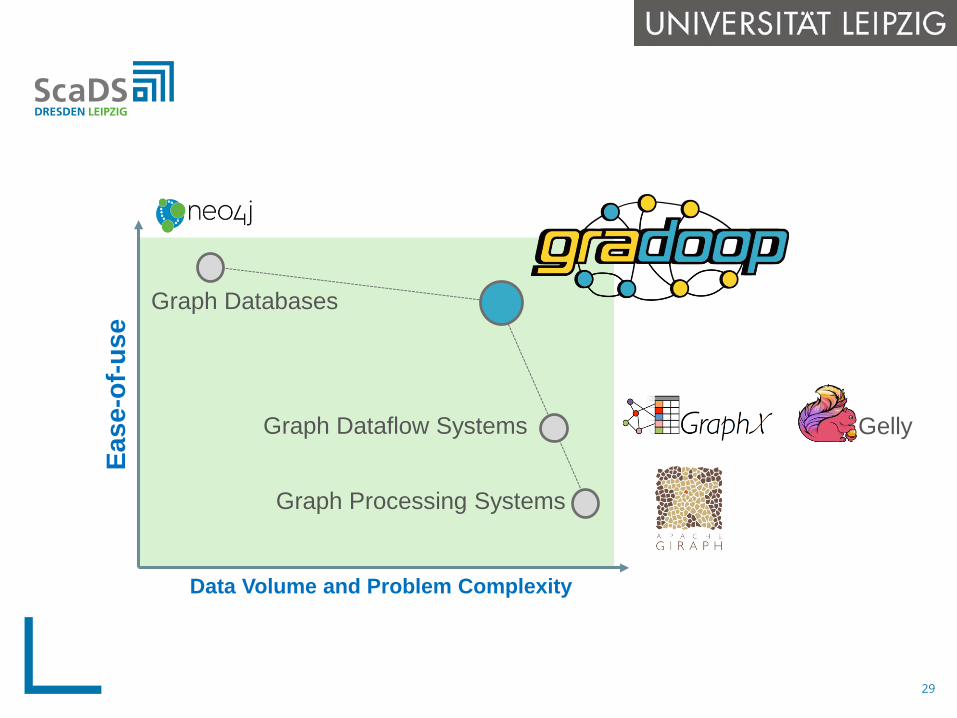
Data Volume and Problem Complexity
Ease
-of-u
se
Graph Processing Systems
Graph Databases
Graph Dataflow Systems Gelly
29
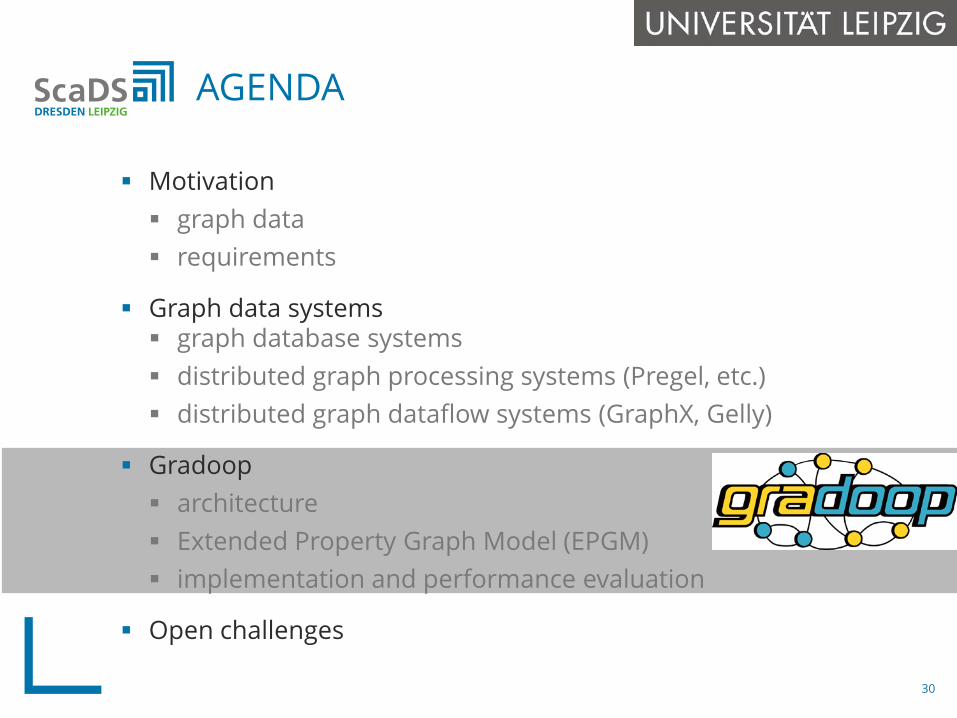
Motivation graph data requirements
Graph data systems graph database systems distributed graph processing systems (Pregel, etc.) distributed graph dataflow systems (GraphX, Gelly)
Gradoop architecture Extended Property Graph Model (EPGM) implementation and performance evaluation
Open challenges
AGENDA
30
Hadoop-based framework for graph data management and analysis persistent graph storage in scalable distributed store (Hbase) utilization of powerful dataflow system (Apache Flink) for
parallel, in-memory processing
Extended property graph data model (EPGM) operators on graphs and sets of (sub) graphs support for semantic graph queries and mining
declarative specification of graph analysis workflows Graph Analytical Language - GrALa
end-to-end functionality graph-based data integration, data analysis and visualization
open-source implementation: www.gradoop.org
GRADOOP CHARACTERISTICS
31
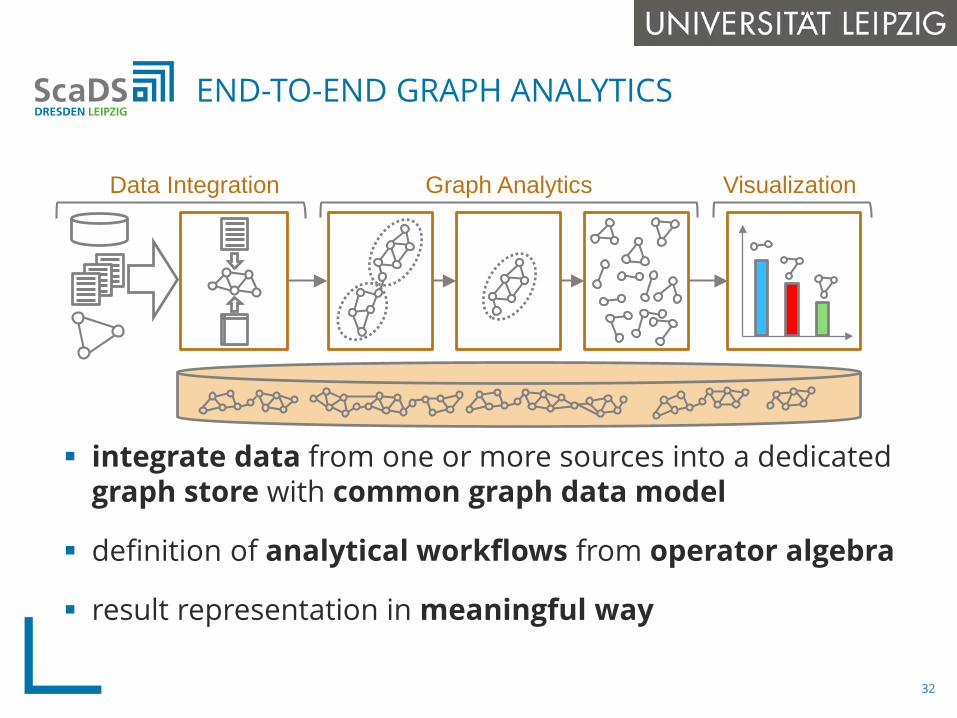
integrate data from one or more sources into a dedicatedgraph store with common graph data model
definition of analytical workflows from operator algebra
result representation in meaningful way
END-TO-END GRAPH ANALYTICS
Data Integration Graph Analytics Visualization
32
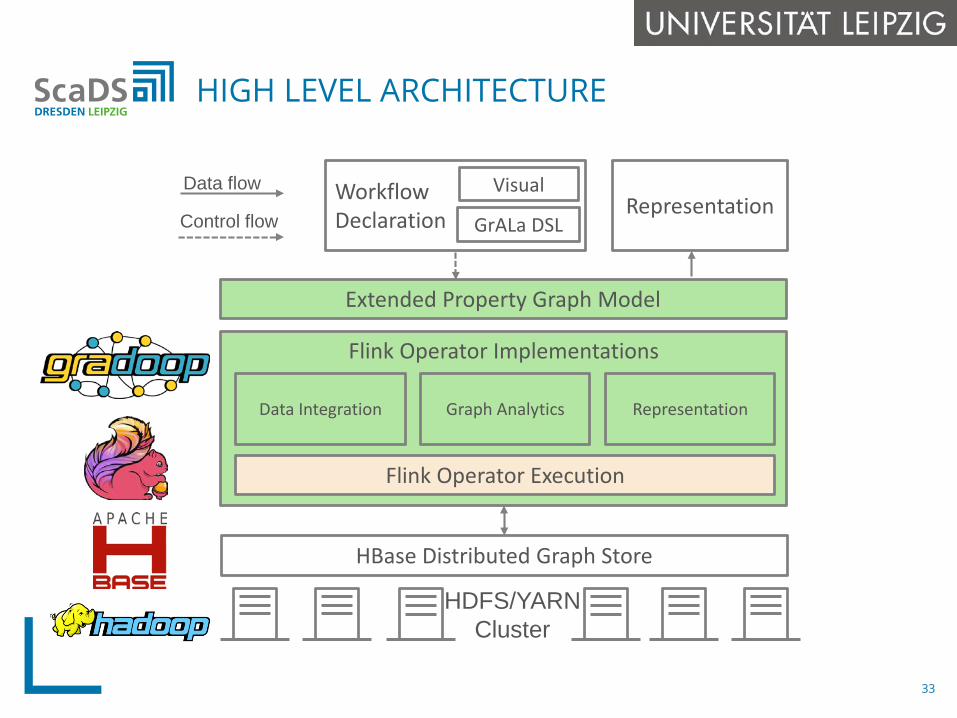
HIGH LEVEL ARCHITECTURE
HDFS/YARNCluster
HBase Distributed Graph Store
Extended Property Graph Model
Flink Operator Implementations
Data Integration
Flink Operator Execution
Workflow Declaration
Visual
GrALa DSLRepresentation
Data flow
Control flow
Graph Analytics Representation
33
includes PGM as special case
support for collections of logical graphs / subgraphs can be defined explicitly can be result of graph algorithms / operators
support for graph properties
powerful operators on both graphs and graph collections
Graph Analytical Language – GrALa domain-specific language (DSL) for EPGM flexible use of operators with application-specific UDFs plugin concept for graph mining algorithms
EXTENDED PROPERTY GRAPH MODEL (EPGM)
34
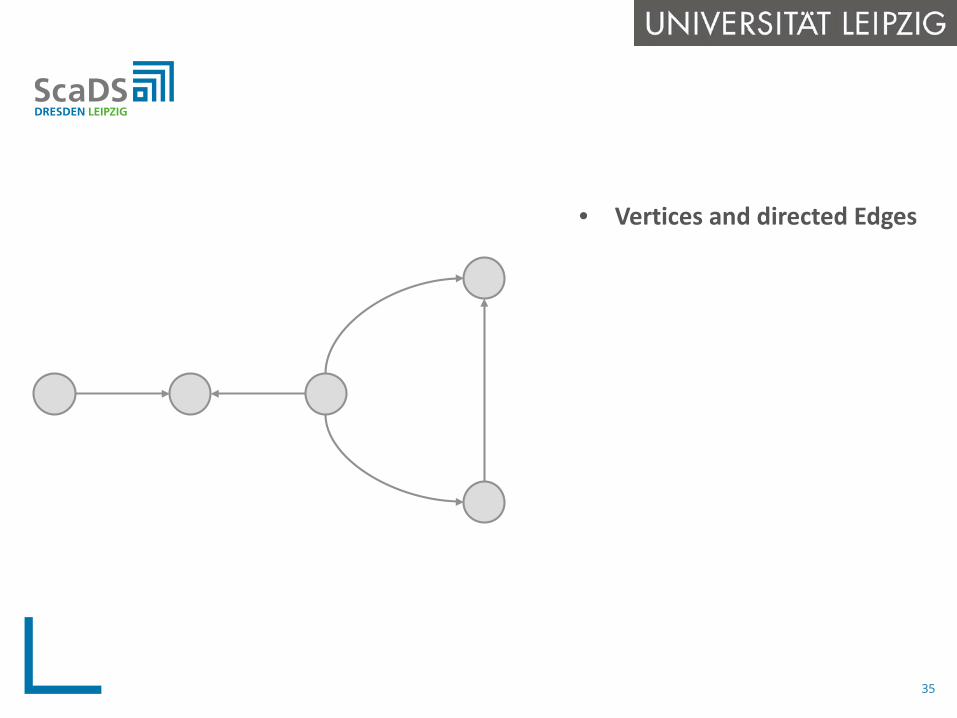
• Vertices and directed Edges
35
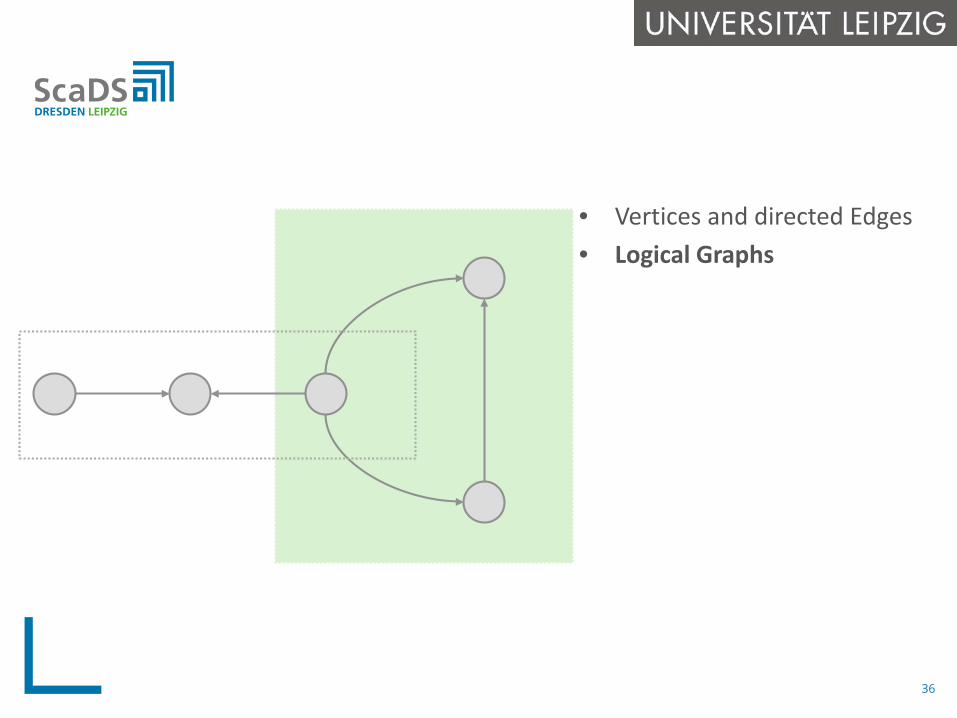
• Vertices and directed Edges• Logical Graphs
36
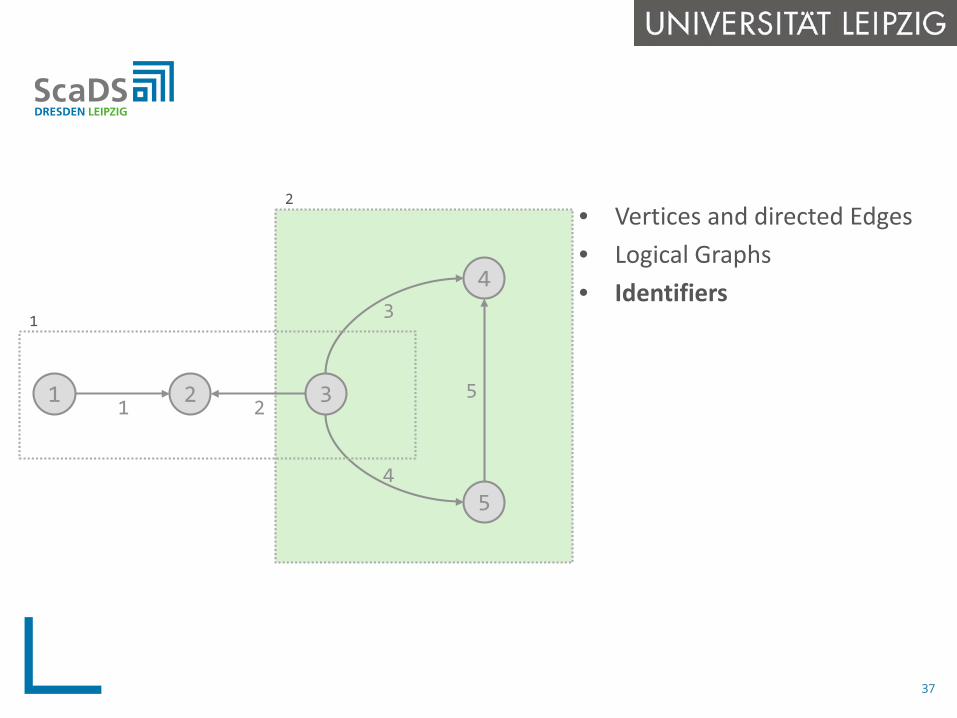
• Vertices and directed Edges• Logical Graphs• Identifiers
1 3
4
5
21 2
3
4
5
1
2
37
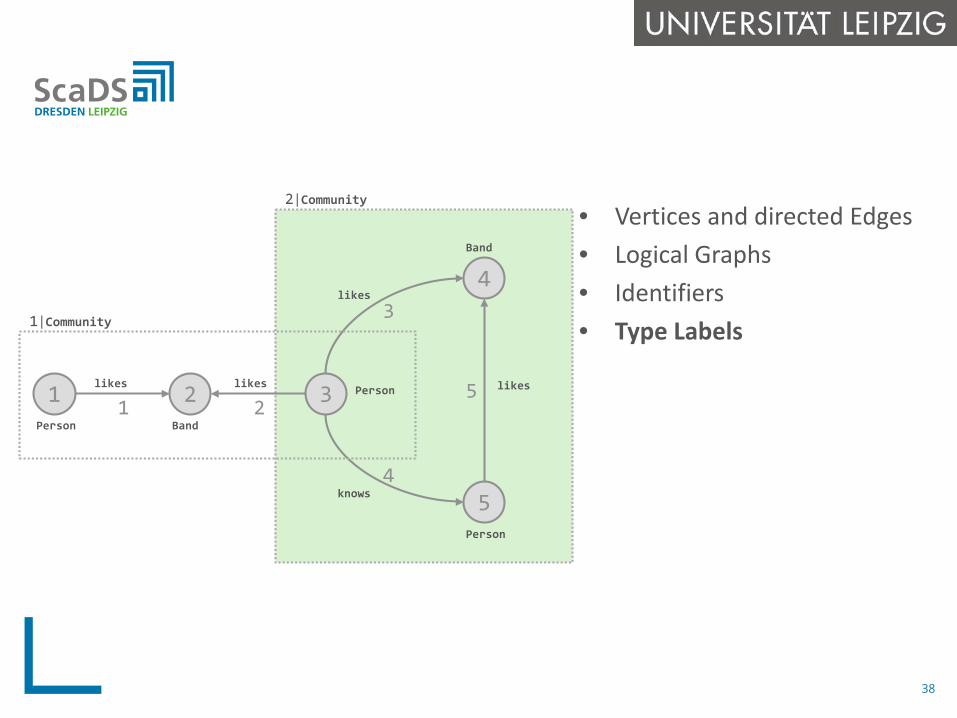
• Vertices and directed Edges• Logical Graphs• Identifiers• Type Labels
1 3
4
5
21 2
3
4
5Person Band
Person
Person
Band
likes likes
likes
knows
likes
1|Community
2|Community
38
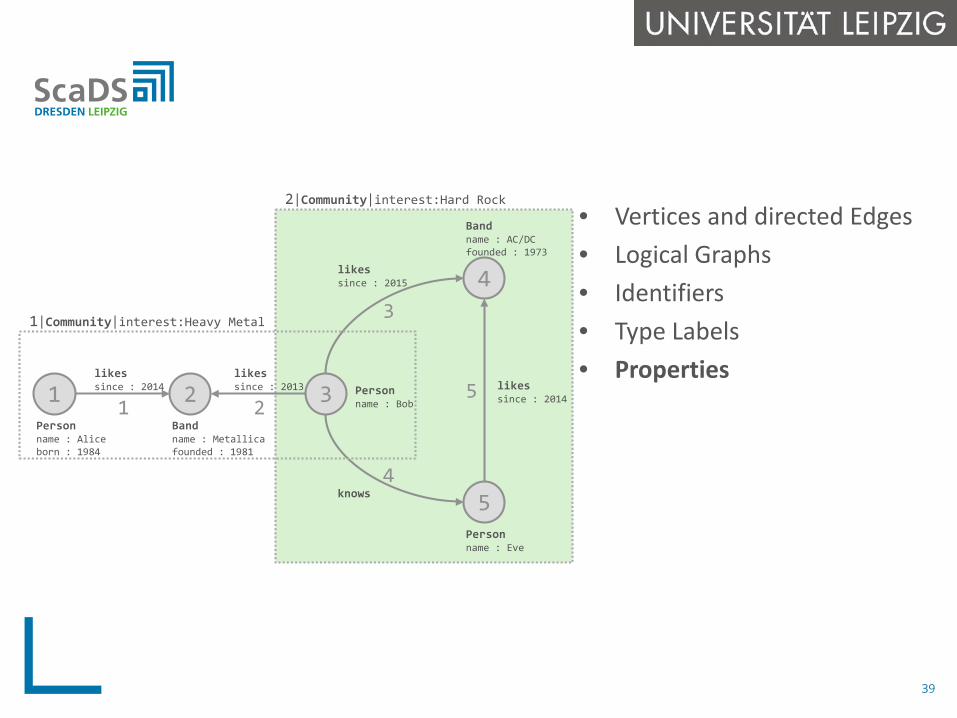
• Vertices and directed Edges• Logical Graphs• Identifiers• Type Labels• Properties
1 3
4
5
21 2
3
4
5Personname : Aliceborn : 1984
Bandname : Metallicafounded : 1981
Personname : Bob
Personname : Eve
Bandname : AC/DCfounded : 1973
likessince : 2014
likessince : 2013
likessince : 2015
knows
likessince : 2014
1|Community|interest:Heavy Metal
2|Community|interest:Hard Rock
39
Operators
40
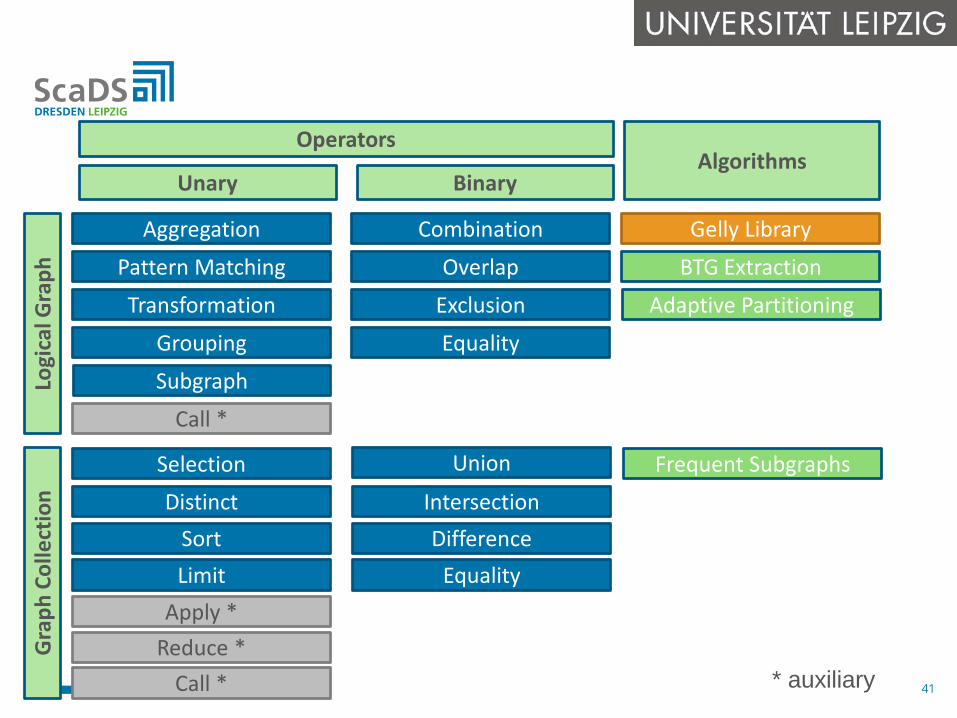
Operators
Unary BinaryAlgorithms
* auxiliary
Gra
ph C
olle
ctio
nLo
gica
lGra
ph
Aggregation
Pattern Matching
Transformation
Grouping Equality
Call *
Combination
Overlap
Exclusion
Equality
Union
IntersectionDifference
Gelly Library
BTG Extraction
Frequent Subgraphs
Limit
SelectionDistinct
Sort
Apply *Reduce *
Call *
Adaptive Partitioning
Subgraph
41
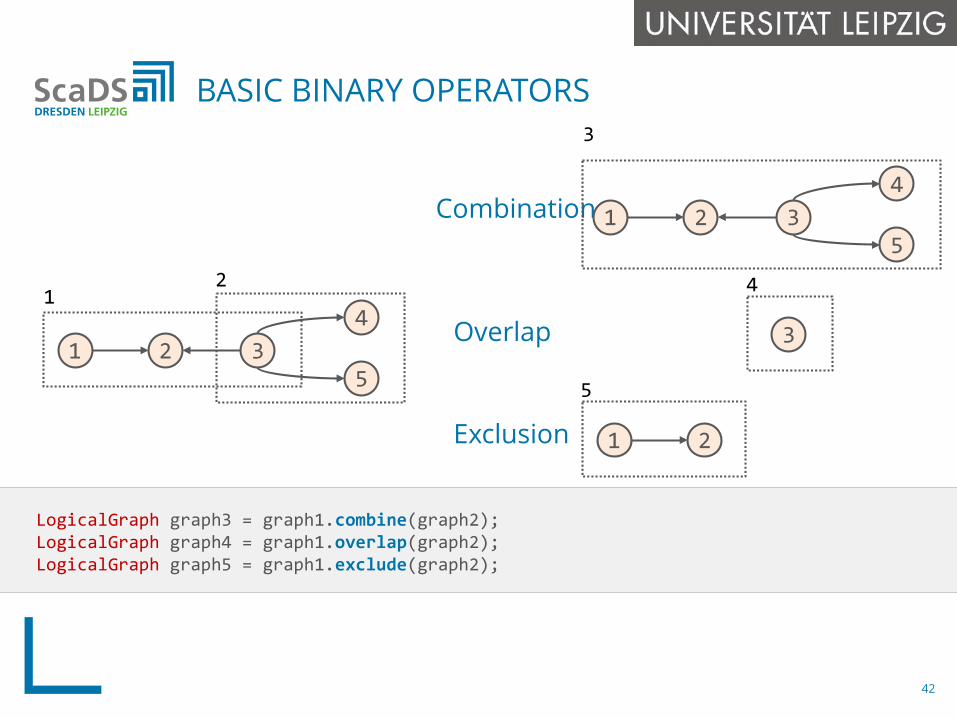
Combination
Overlap
Exclusion
LogicalGraph graph3 = graph1.combine(graph2);LogicalGraph graph4 = graph1.overlap(graph2);LogicalGraph graph5 = graph1.exclude(graph2);
BASIC BINARY OPERATORS
1 34
52
3
1 2
1 34
52
12 4
5
3
42
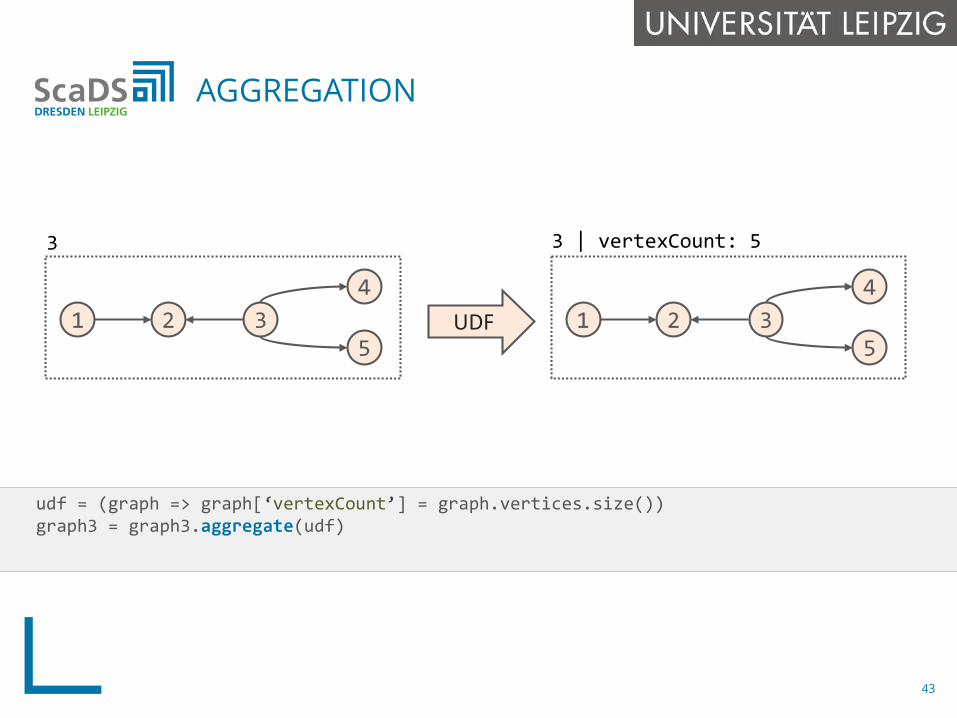
udf = (graph => graph[‘vertexCount’] = graph.vertices.size())graph3 = graph3.aggregate(udf)
AGGREGATION
1 34
52
3
1 34
52
3 | vertexCount: 5
UDF
43
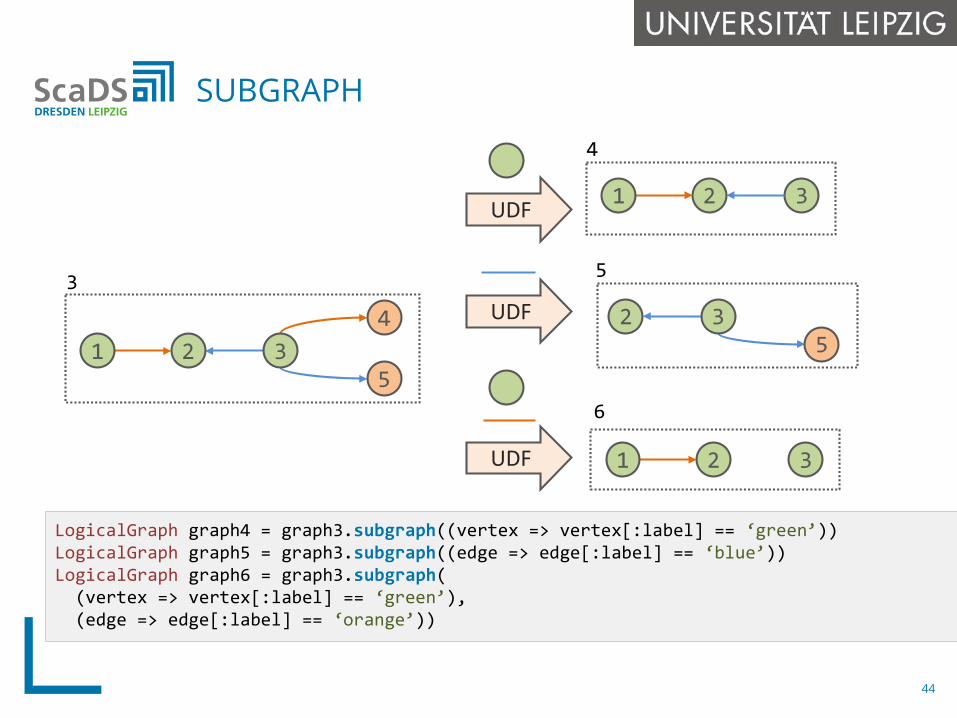
LogicalGraph graph4 = graph3.subgraph((vertex => vertex[:label] == ‘green’))LogicalGraph graph5 = graph3.subgraph((edge => edge[:label] == ‘blue’))LogicalGraph graph6 = graph3.subgraph(
(vertex => vertex[:label] == ‘green’),(edge => edge[:label] == ‘orange’))
SUBGRAPH
3
1 34
52
3
4
1 2
5
35
2UDF
UDF
UDF 3
6
1 2
44
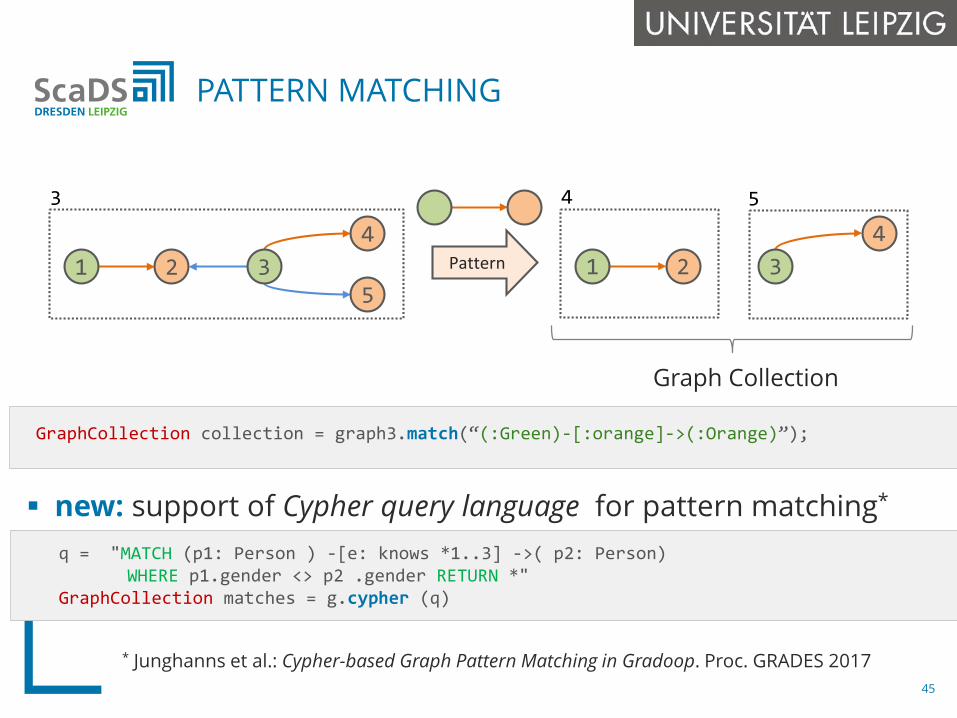
GraphCollection collection = graph3.match(“(:Green)-[:orange]->(:Orange)”);
PATTERN MATCHING
3
1 34
52 Pattern
4 5
1 34
2
Graph Collection
45
new: support of Cypher query language for pattern matching*
* Junghanns et al.: Cypher-based Graph Pattern Matching in Gradoop. Proc. GRADES 2017
q = "MATCH (p1: Person ) -[e: knows *1..3] ->( p2: Person)WHERE p1.gender <> p2 .gender RETURN *"
GraphCollection matches = g.cypher (q)
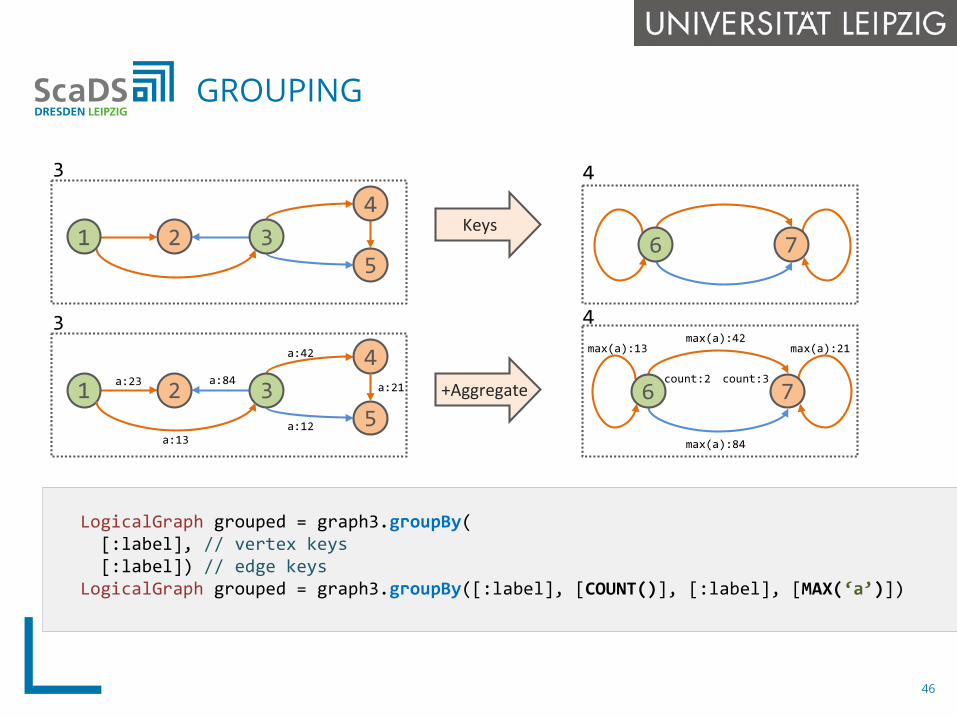
LogicalGraph grouped = graph3.groupBy([:label], // vertex keys[:label]) // edge keys
LogicalGraph grouped = graph3.groupBy([:label], [COUNT()], [:label], [MAX(‘a’)])
GROUPING
Keys
3
1 34
52
+Aggregate
3
a:23 a:84
a:42
a:12
1 34
52
a:13
a:21
4
count:2 count:3
max(a):42
max(a):84
max(a):13 max(a):21
6 7
4
6 7
46
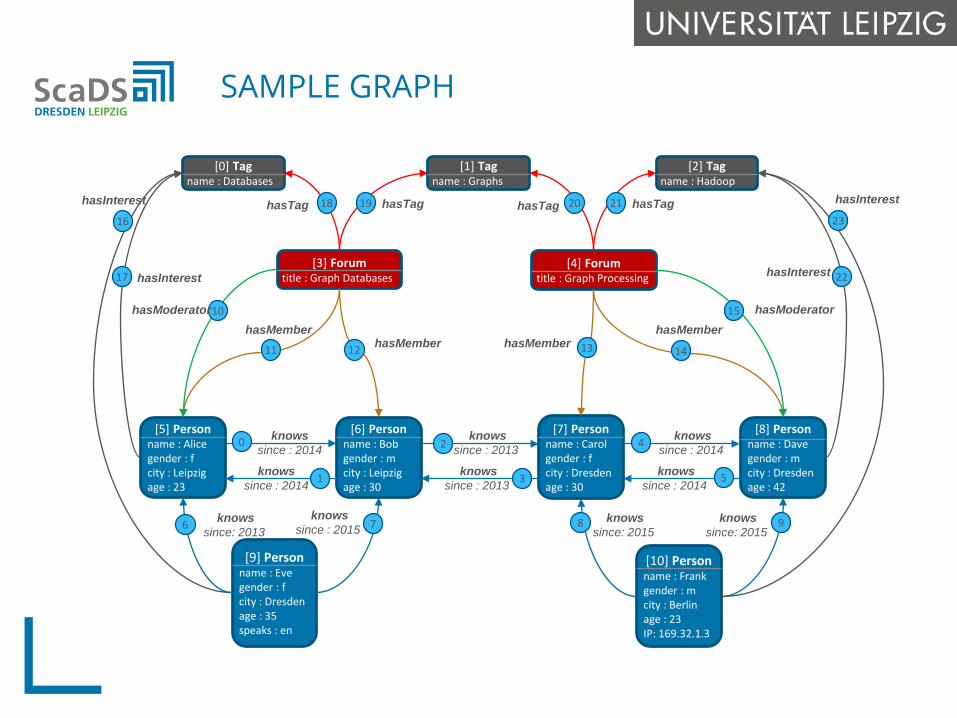
SAMPLE GRAPH
[0] Tagname : Databases
[1] Tagname : Graphs
[2] Tagname : Hadoop
[3] Forumtitle : Graph Databases
[4] Forumtitle : Graph Processing
[5] Personname : Alicegender : fcity : Leipzigage : 23
[6] Personname : Bobgender : mcity : Leipzigage : 30
[7] Personname : Carolgender : fcity : Dresdenage : 30
[8] Personname : Davegender : mcity : Dresdenage : 42
[9] Personname : Evegender : fcity : Dresdenage : 35speaks : en
[10] Personname : Frankgender : mcity : Berlinage : 23IP: 169.32.1.3
0
1
2
3
4
5
6 7 8 9
10
11 12 13 14
15
16
17
18 19 20 21
22
23
knowssince : 2014
knowssince : 2014
knowssince : 2013
hasInterest
hasInterest hasInterest
hasInterest
hasModeratorhasModeratorhasMember hasMember
hasMember hasMember
hasTag hasTaghasTag hasTag
knowssince : 2013
knowssince : 2014
knowssince : 2014
knowssince: 2015
knowssince: 2015
knowssince : 2015
knowssince: 2013
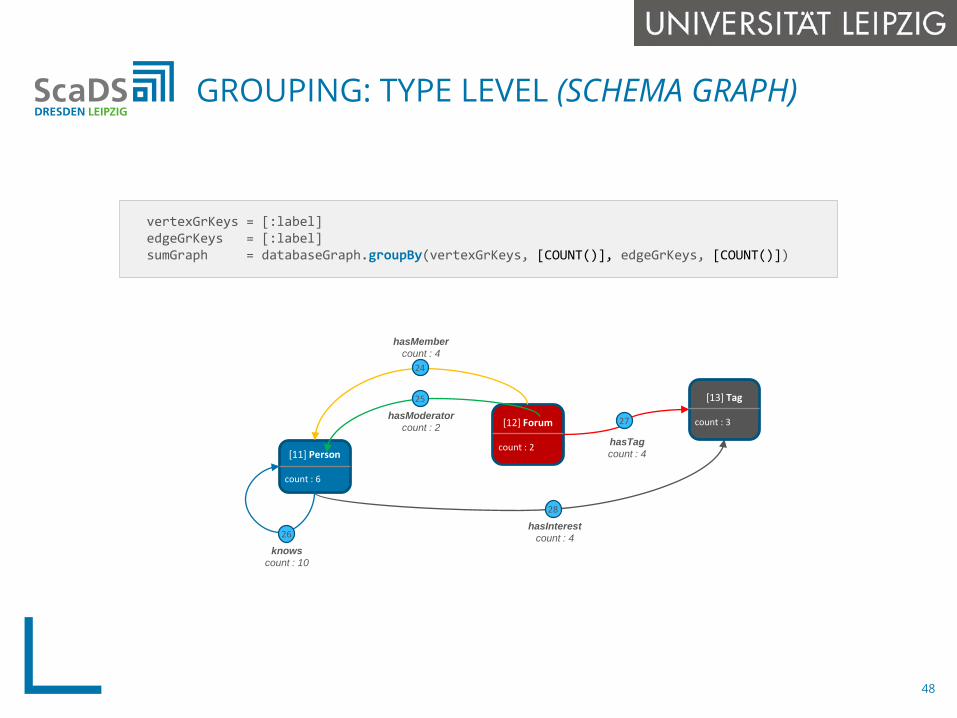
GROUPING: TYPE LEVEL (SCHEMA GRAPH)
vertexGrKeys = [:label]edgeGrKeys = [:label]sumGraph = databaseGraph.groupBy(vertexGrKeys, [COUNT()], edgeGrKeys, [COUNT()])
[11] Person
count : 6
[12] Forum
count : 2
[13] Tag
count : 3
hasMembercount : 4
knowscount : 10
hasInterestcount : 4
hasTagcount : 4
hasModeratorcount : 2
24
26
28
27
25
48
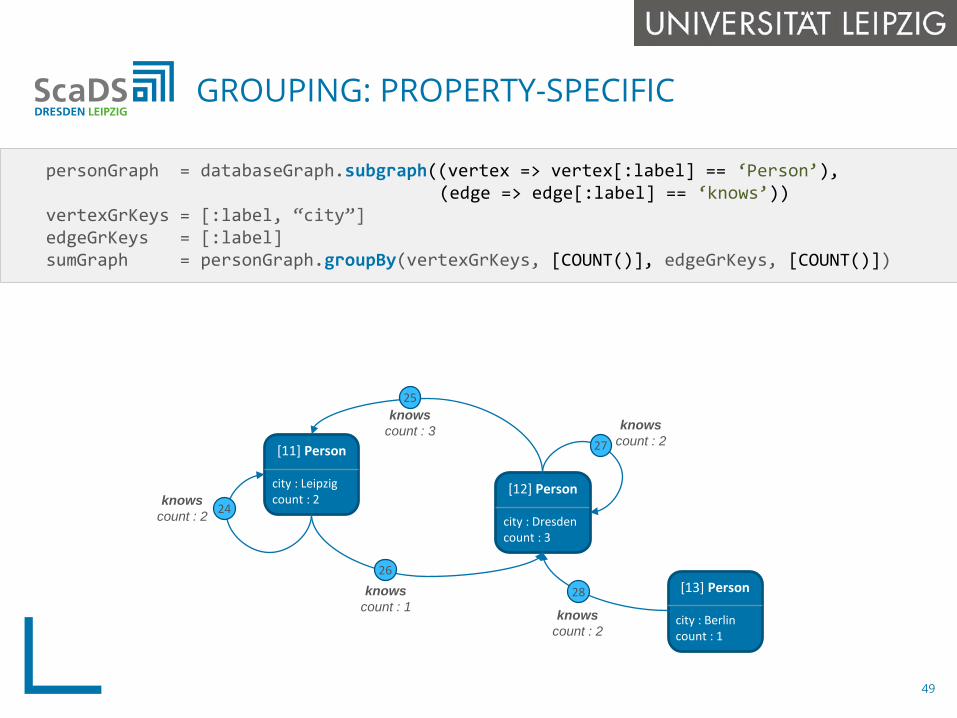
personGraph = databaseGraph.subgraph((vertex => vertex[:label] == ‘Person’),(edge => edge[:label] == ‘knows’))
vertexGrKeys = [:label, “city”]edgeGrKeys = [:label]sumGraph = personGraph.groupBy(vertexGrKeys, [COUNT()], edgeGrKeys, [COUNT()])
GROUPING: PROPERTY-SPECIFIC
1 3
[11] Person
city : Leipzigcount : 2
[12] Person
city : Dresdencount : 3
[13] Person
city : Berlincount : 1
24
25
26
27
28
knowscount : 3
knowscount : 1 knows
count : 2
knowscount : 2
knowscount : 2
49
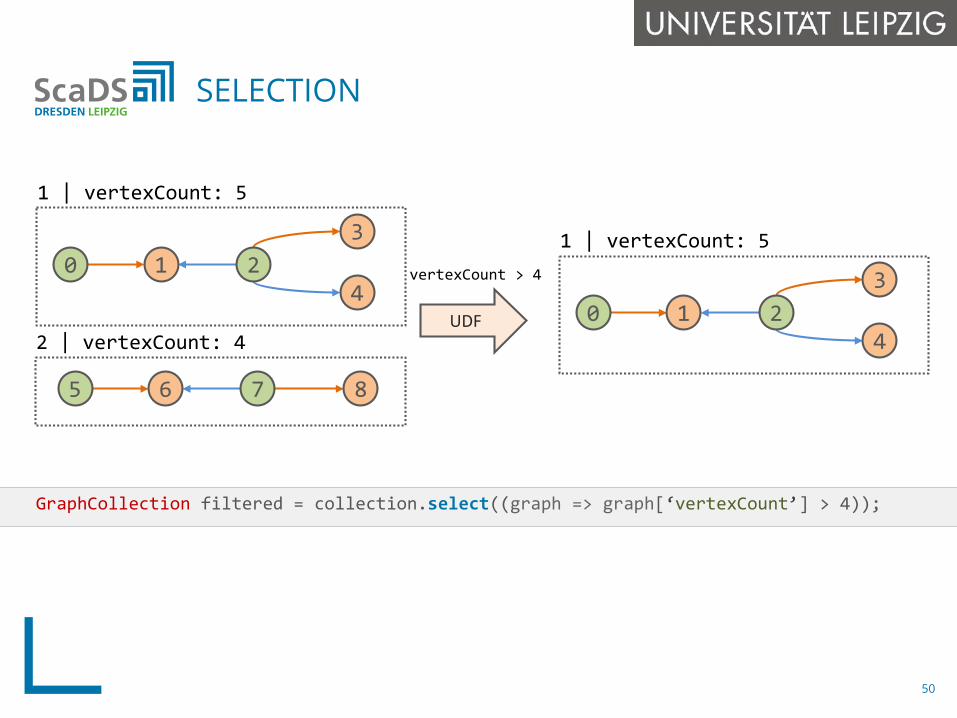
GraphCollection filtered = collection.select((graph => graph[‘vertexCount’] > 4));
SELECTION
UDF
vertexCount > 4
1 | vertexCount: 5
2 | vertexCount: 4
0 23
41
5 7 86
1 | vertexCount: 5
0 23
41
50
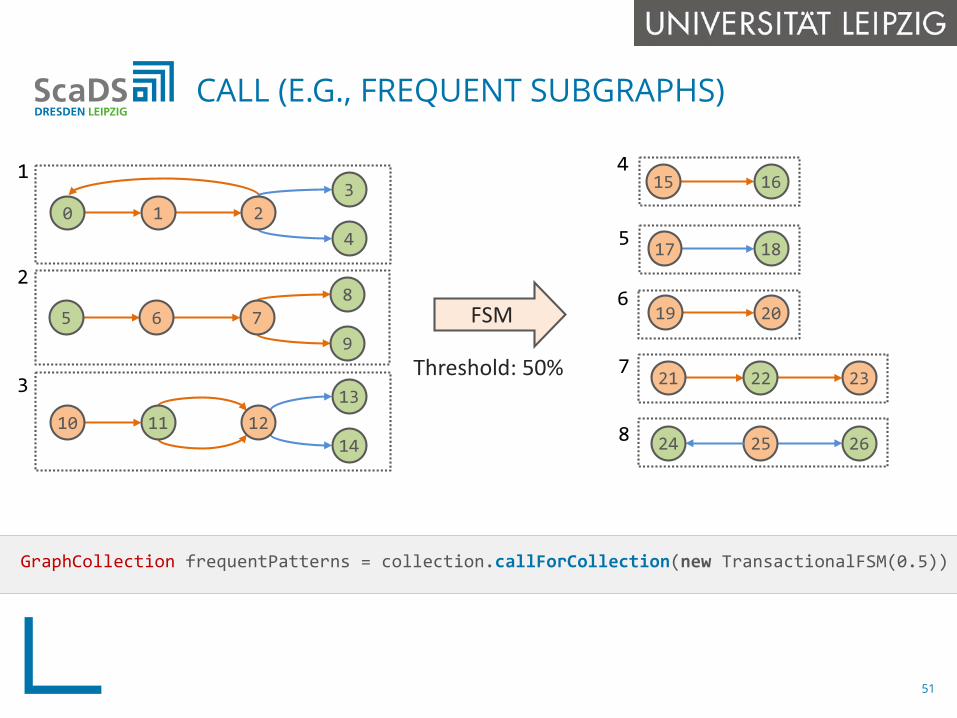
GraphCollection frequentPatterns = collection.callForCollection(new TransactionalFSM(0.5))
CALL (E.G., FREQUENT SUBGRAPHS)
FSM
Threshold: 50%
1
0 1 23
4
5 6 78
9
1013
14
2
3
11 12
15 16
17 18
19 20
4
5
6
21 2322
25 2624
7
8
51
Implementation and evaluation
52
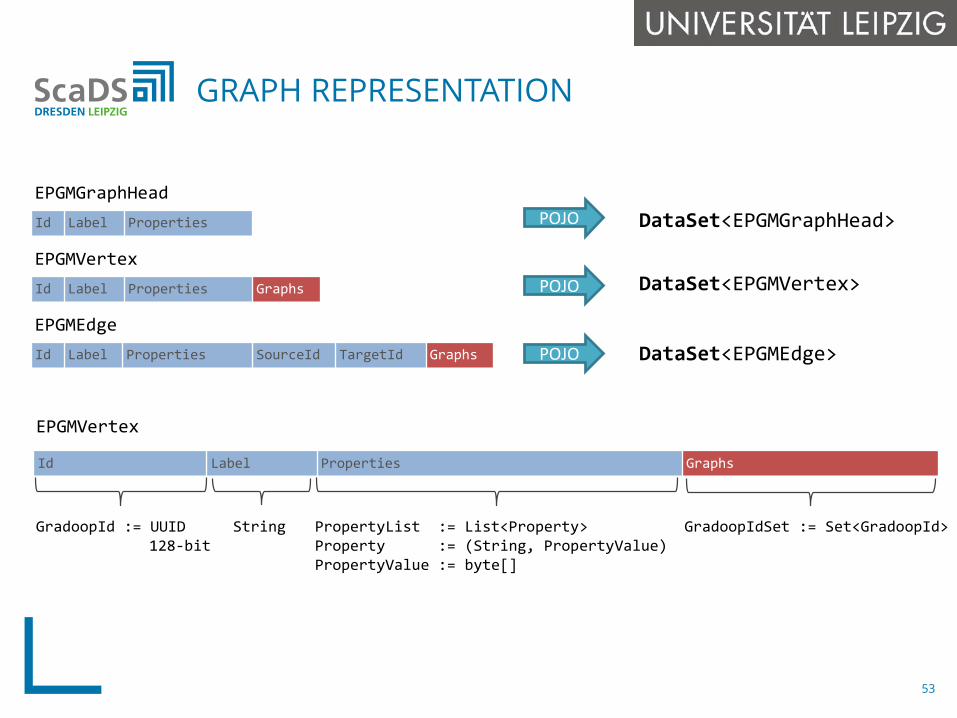
GRAPH REPRESENTATION
Id Label Properties Graphs
Id Label Properties SourceId TargetId Graphs
EPGMGraphHead
EPGMVertex
EPGMEdge
Id Label Properties POJO
POJO
POJO
DataSet<EPGMGraphHead>
DataSet<EPGMVertex>
DataSet<EPGMEdge>
Id Label Properties Graphs
EPGMVertex
GradoopId := UUID128-bit
String PropertyList := List<Property>Property := (String, PropertyValue)PropertyValue := byte[]
GradoopIdSet := Set<GradoopId>
53
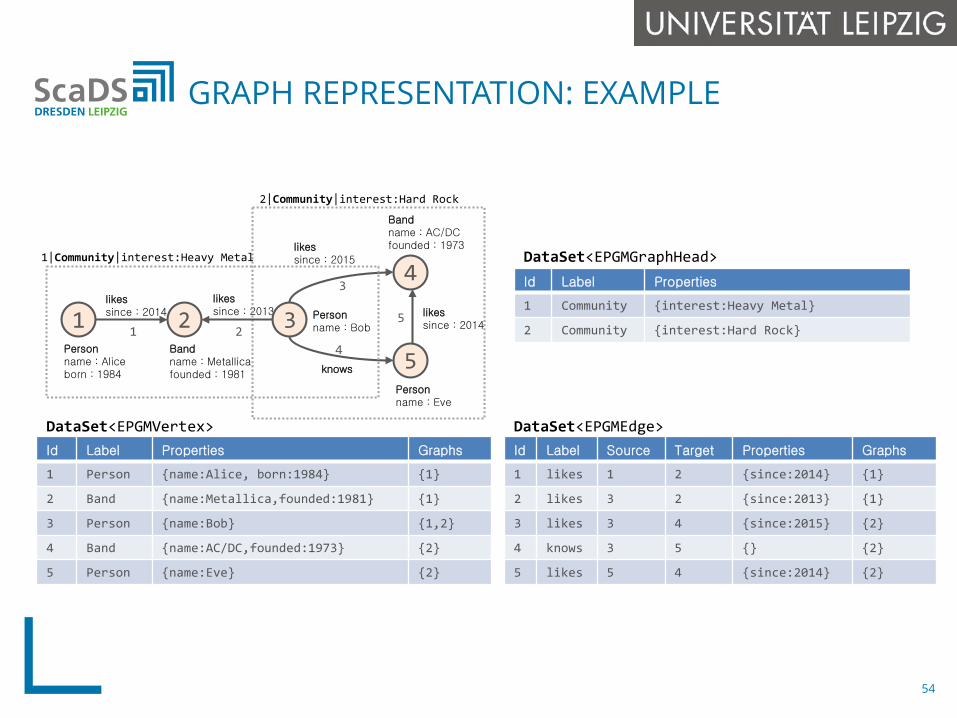
Id Label Properties
1 Community {interest:Heavy Metal}
2 Community {interest:Hard Rock}
Id Label Properties Graphs
1 Person {name:Alice, born:1984} {1}
2 Band {name:Metallica,founded:1981} {1}
3 Person {name:Bob} {1,2}
4 Band {name:AC/DC,founded:1973} {2}
5 Person {name:Eve} {2}
Id Label Source Target Properties Graphs
1 likes 1 2 {since:2014} {1}
2 likes 3 2 {since:2013} {1}
3 likes 3 4 {since:2015} {2}
4 knows 3 5 {} {2}
5 likes 5 4 {since:2014} {2}
likessince : 2014
likessince : 20131 3
4
5
2
1|Community|interest:Heavy Metal
2|Community|interest:Hard Rock
Personname : Aliceborn : 1984
Bandname : Metallicafounded : 1981
Personname : Bob
Personname : Eve
Bandname : AC/DCfounded : 1973likes
since : 2015
knows
likessince : 20141 2
3
4
5
DataSet<EPGMGraphHead>
DataSet<EPGMVertex> DataSet<EPGMEdge>
GRAPH REPRESENTATION: EXAMPLE
54
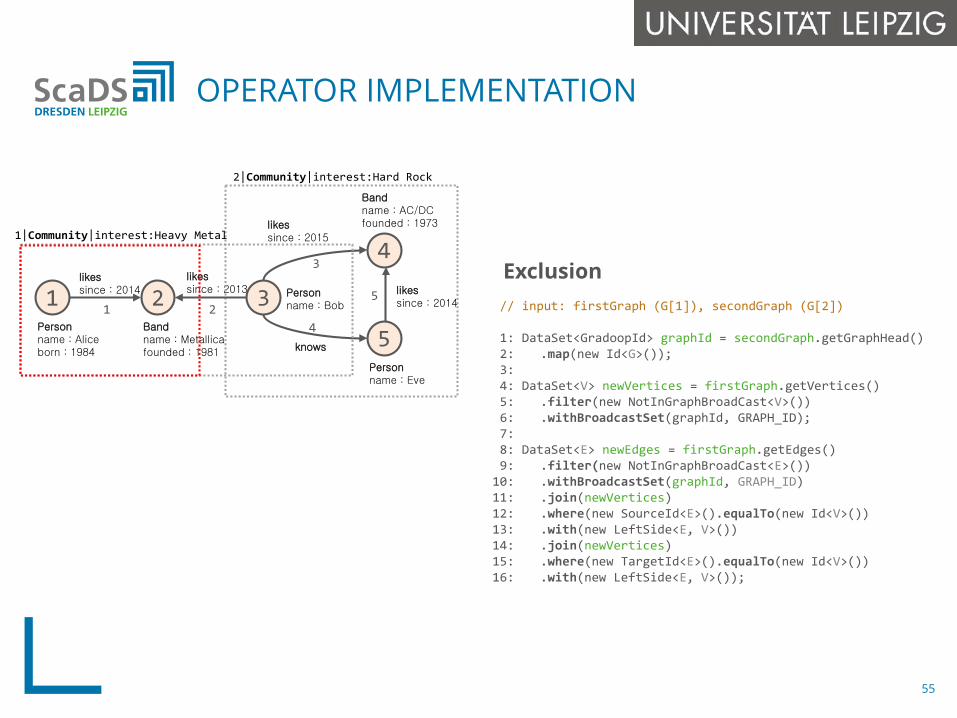
// input: firstGraph (G[1]), secondGraph (G[2])
1: DataSet<GradoopId> graphId = secondGraph.getGraphHead()2: .map(new Id<G>());3: 4: DataSet<V> newVertices = firstGraph.getVertices()5: .filter(new NotInGraphBroadCast<V>())6: .withBroadcastSet(graphId, GRAPH_ID);7:8: DataSet<E> newEdges = firstGraph.getEdges()9: .filter(new NotInGraphBroadCast<E>())
10: .withBroadcastSet(graphId, GRAPH_ID)11: .join(newVertices)12: .where(new SourceId<E>().equalTo(new Id<V>())13: .with(new LeftSide<E, V>())14: .join(newVertices)15: .where(new TargetId<E>().equalTo(new Id<V>())16: .with(new LeftSide<E, V>());
Exclusion
OPERATOR IMPLEMENTATION
likessince : 2013
likessince : 20141 3
4
5
2
1|Community|interest:Heavy Metal
2|Community|interest:Hard Rock
Personname : Aliceborn : 1984
Bandname : Metallicafounded : 1981
Personname : Bob
Personname : Eve
Bandname : AC/DCfounded : 1973likes
since : 2015
knows
likessince : 20141 2
3
4
5
55
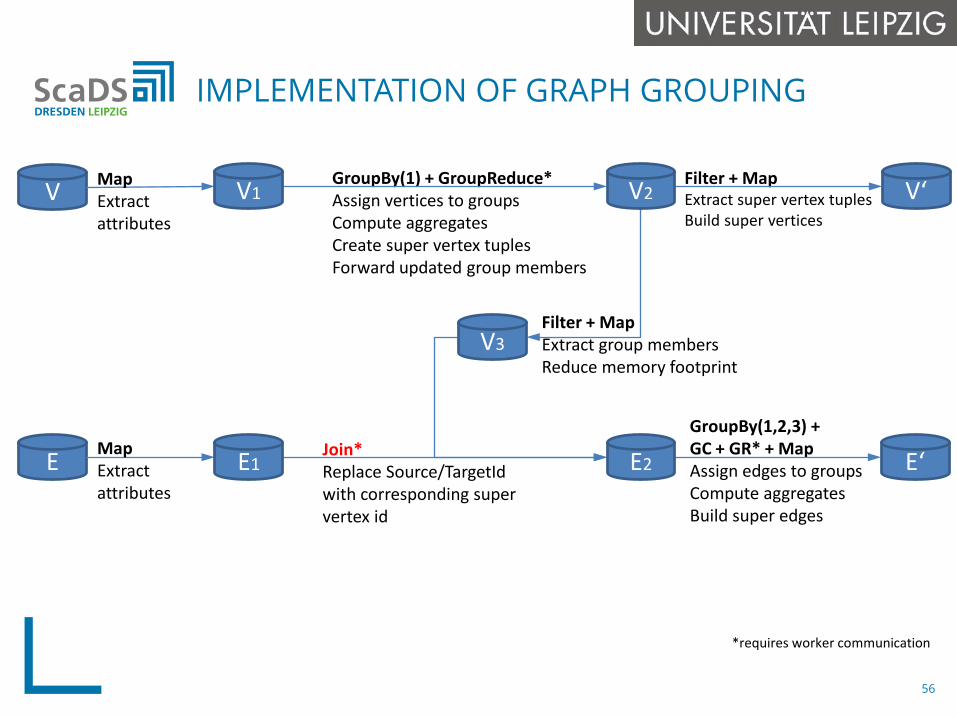
IMPLEMENTATION OF GRAPH GROUPING
GroupBy(1,2,3) +GC + GR* + MapAssign edges to groupsCompute aggregatesBuild super edges
Filter + MapExtract super vertex tuplesBuild super vertices
GroupBy(1) + GroupReduce*Assign vertices to groupsCompute aggregatesCreate super vertex tuplesForward updated group members
V
E
MapExtractattributes
Filter + Map Extract group membersReduce memory footprint
Join*Replace Source/TargetIdwith corresponding super vertex id
MapExtractattributes
*requires worker communication
V1 V2
V3
V‘
E1 E2 E‘
56
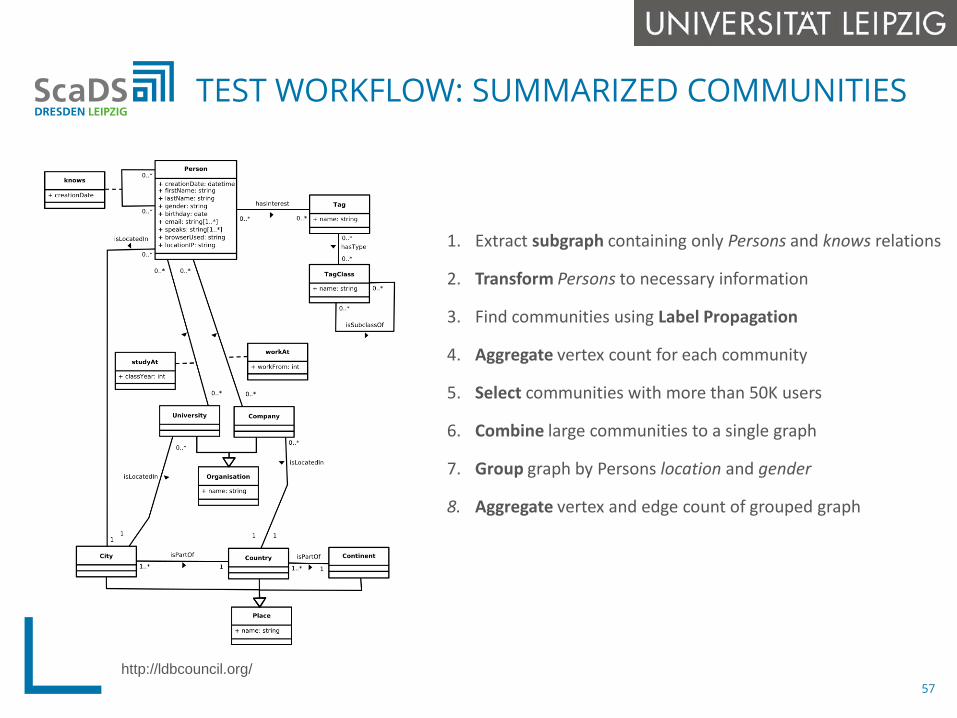
TEST WORKFLOW: SUMMARIZED COMMUNITIES
http://ldbcouncil.org/
1. Extract subgraph containing only Persons and knows relations
2. Transform Persons to necessary information
3. Find communities using Label Propagation
4. Aggregate vertex count for each community
5. Select communities with more than 50K users
6. Combine large communities to a single graph
7. Group graph by Persons location and gender
8. Aggregate vertex and edge count of grouped graph
57
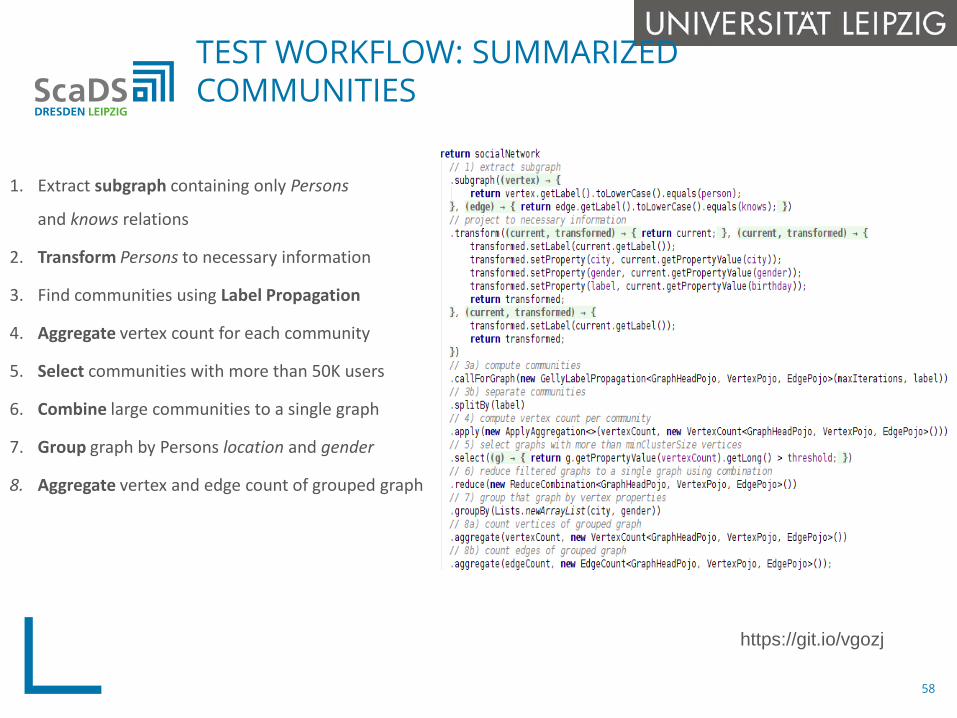
TEST WORKFLOW: SUMMARIZEDCOMMUNITIES
https://git.io/vgozj
1. Extract subgraph containing only Persons
and knows relations
2. Transform Persons to necessary information
3. Find communities using Label Propagation
4. Aggregate vertex count for each community
5. Select communities with more than 50K users
6. Combine large communities to a single graph
7. Group graph by Persons location and gender
8. Aggregate vertex and edge count of grouped graph
58
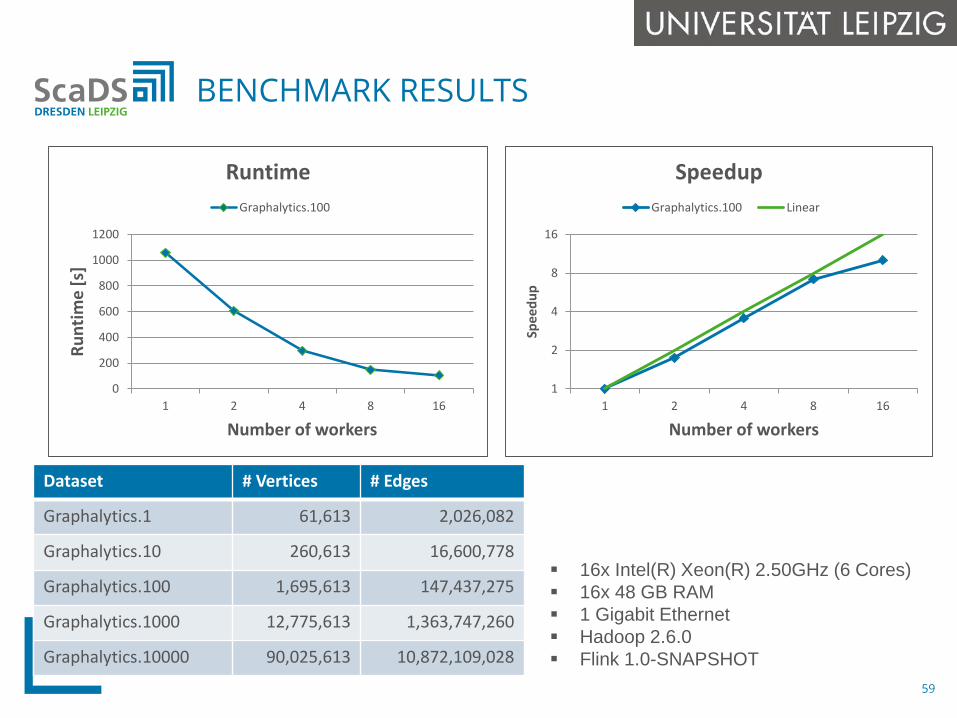
BENCHMARK RESULTS
Dataset # Vertices # Edges
Graphalytics.1 61,613 2,026,082
Graphalytics.10 260,613 16,600,778
Graphalytics.100 1,695,613 147,437,275
Graphalytics.1000 12,775,613 1,363,747,260
Graphalytics.10000 90,025,613 10,872,109,028
16x Intel(R) Xeon(R) 2.50GHz (6 Cores) 16x 48 GB RAM 1 Gigabit Ethernet Hadoop 2.6.0 Flink 1.0-SNAPSHOT
0
200
400
600
800
1000
1200
1 2 4 8 16
Runt
ime
[s]
Number of workers
RuntimeGraphalytics.100
1
2
4
8
16
1 2 4 8 16
Spee
dup
Number of workers
SpeedupGraphalytics.100 Linear
59
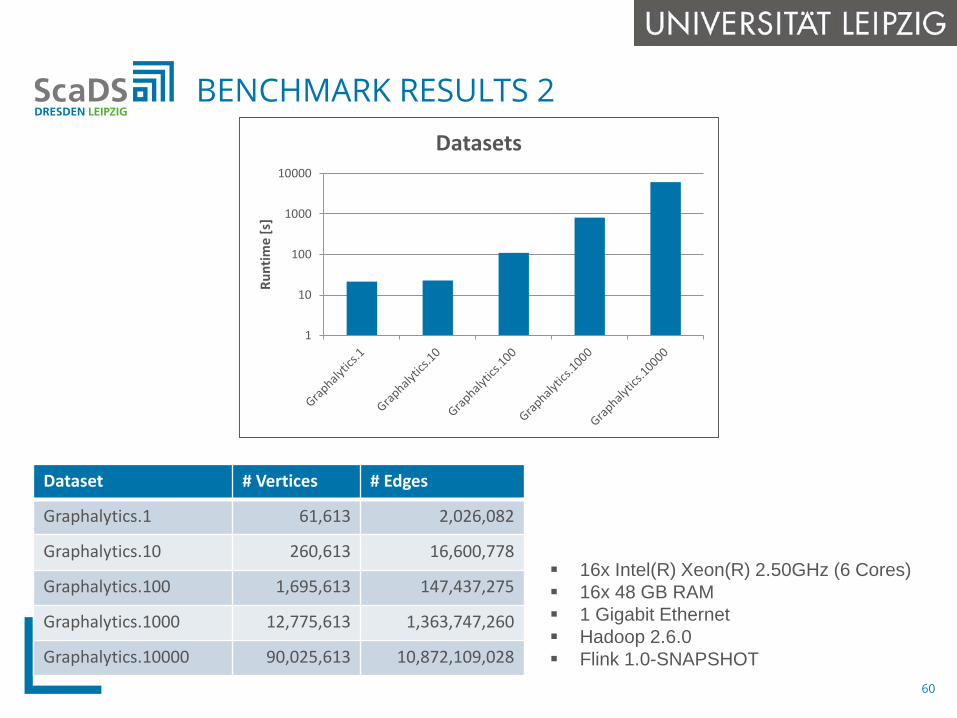
BENCHMARK RESULTS 2
Dataset # Vertices # Edges
Graphalytics.1 61,613 2,026,082
Graphalytics.10 260,613 16,600,778
Graphalytics.100 1,695,613 147,437,275
Graphalytics.1000 12,775,613 1,363,747,260
Graphalytics.10000 90,025,613 10,872,109,028
1
10
100
1000
10000
Runt
ime
[s]
Datasets
16x Intel(R) Xeon(R) 2.50GHz (6 Cores) 16x 48 GB RAM 1 Gigabit Ethernet Hadoop 2.6.0 Flink 1.0-SNAPSHOT
60
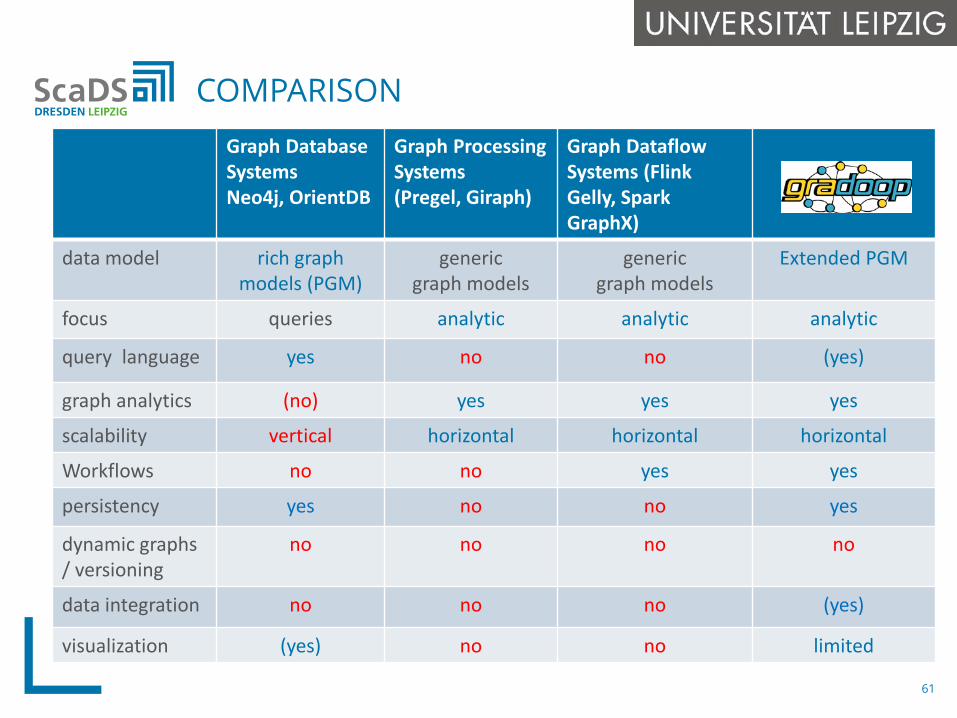
COMPARISON
61
Graph Database SystemsNeo4j, OrientDB
Graph Processing Systems(Pregel, Giraph)
Graph DataflowSystems (Flink Gelly, Spark GraphX)
data model rich graphmodels (PGM)
genericgraph models
genericgraph models
Extended PGM
focus queries analytic analytic analytic
query language yes no no (yes)
graph analytics (no) yes yes yes
scalability vertical horizontal horizontal horizontal
Workflows no no yes yes
persistency yes no no yes
dynamic graphs / versioning
no no no no
data integration no no no (yes)
visualization (yes) no no limited
Motivation graph data requirements
Graph data systems graph database systems distributed graph processing systems (Pregel, etc.) distributed graph dataflow systems (GraphX, Gelly)
Gradoop architecture Extended Property Graph Model (EPGM) implementation and performance evaluation
Open challenges
AGENDA
62
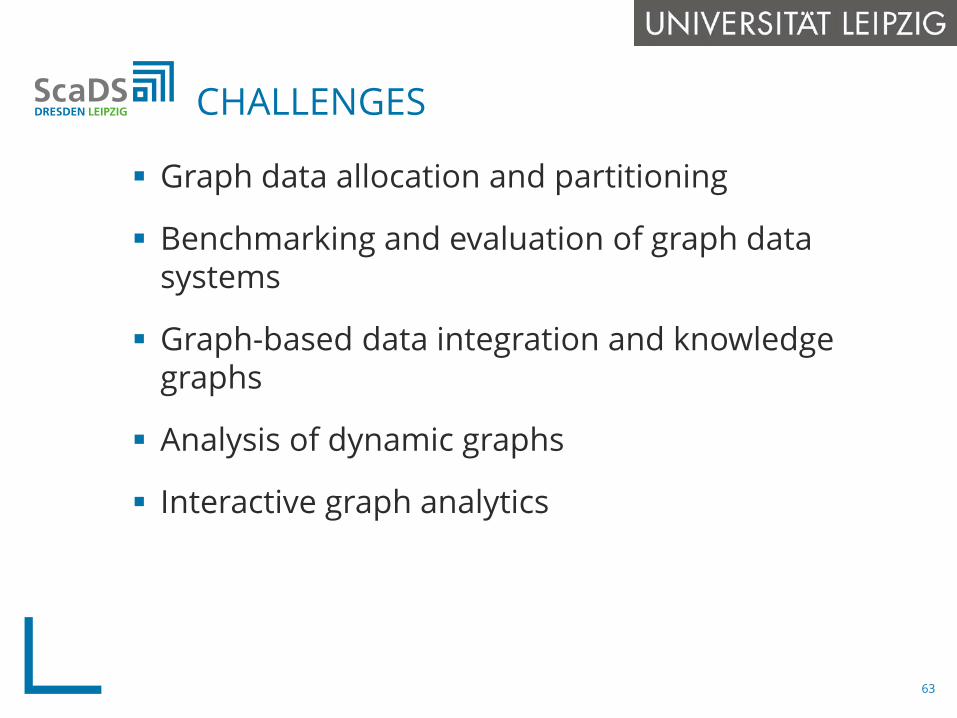
Graph data allocation and partitioning
Benchmarking and evaluation of graph datasystems
Graph-based data integration and knowledge graphs
Analysis of dynamic graphs
Interactive graph analytics
CHALLENGES
63
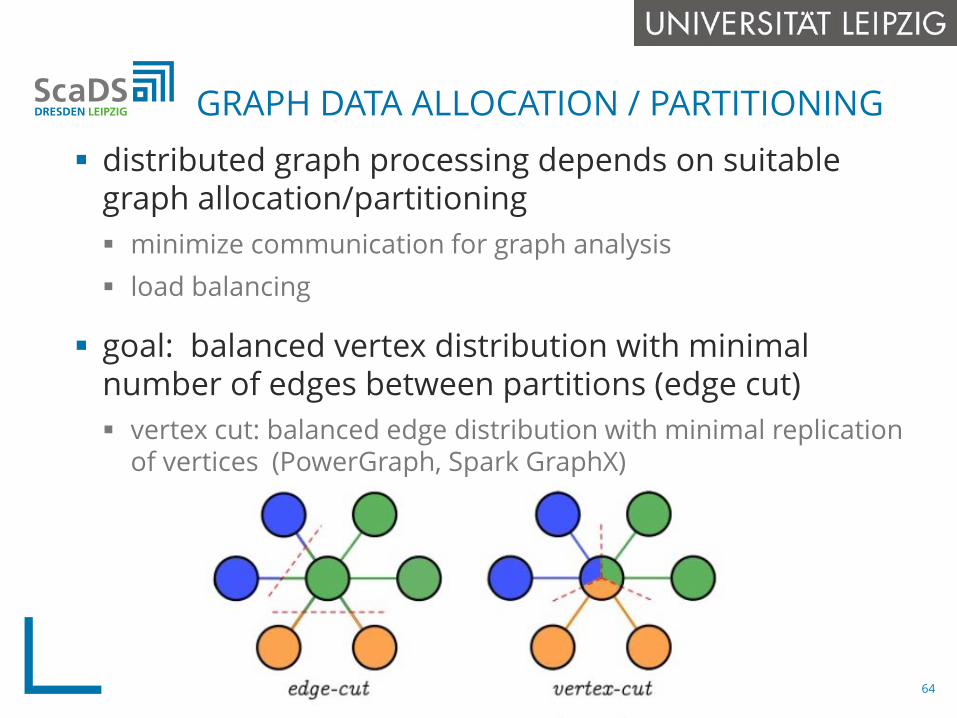
distributed graph processing depends on suitablegraph allocation/partitioning minimize communication for graph analysis load balancing
goal: balanced vertex distribution with minimal number of edges between partitions (edge cut) vertex cut: balanced edge distribution with minimal replication
of vertices (PowerGraph, Spark GraphX)
GRAPH DATA ALLOCATION / PARTITIONING
64
hash-based vertex partitioning prevalent but not optimal vertex neighbors frequently in different
partitions -> high communication overhead
multilevel graph partitioning (e.g., METIS) expensive to determine / static
newer approaches for adaptive allocation Stanton/Kliot (KDD2012), Mondal/Deshpande
(Sigmod2012), Huang/Abadi (VLDB2016)
GRAPH DATA ALLOCATION / PARTITIONING (2)
65
many comparative evaluations between graphDBMS and graph processing systems (Han -VLDB14, Lu -VLDB14, …) many differences in considered systems. workloads,
configurations, etc early systems using Map/reduce or Giraph are
outperformed by newer graph processing systems few results for Spark GraphX, Flink Gelly
Benchmark efforts for graph data analysis e.g., LinkBench, LDBC, gMark only few results so far
BENCHMARKING AND EVALUATION
66
need to integrate diverse data from different sources (or from data lake) into semanticallyexpressive graph representation for later graph analysis for representing background knowledge
(knowledge graphs)
traditional tasks for data acquisition, datatransformation, data cleaning, schema / entitymatching, entity fusion, data enrichment / annotation
most previous work for RDF data, but not forproperty graphs
GRAPH-BASED DATA INTEGRATION
67
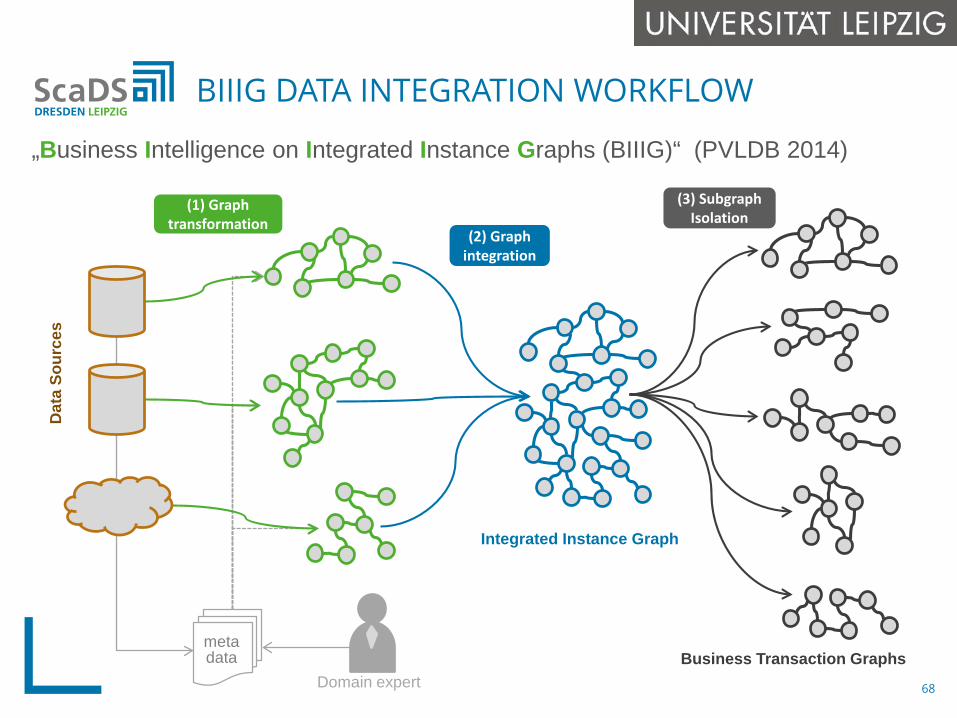
BIIIG DATA INTEGRATION WORKFLOW
68
„Business Intelligence on Integrated Instance Graphs (BIIIG)“ (PVLDB 2014)
Business Transaction Graphs
(3) SubgraphIsolation
(2) Graph integration
Integrated Instance Graph
Domain expert
metadata
(1) Graph transformation
Dat
a So
urce
s
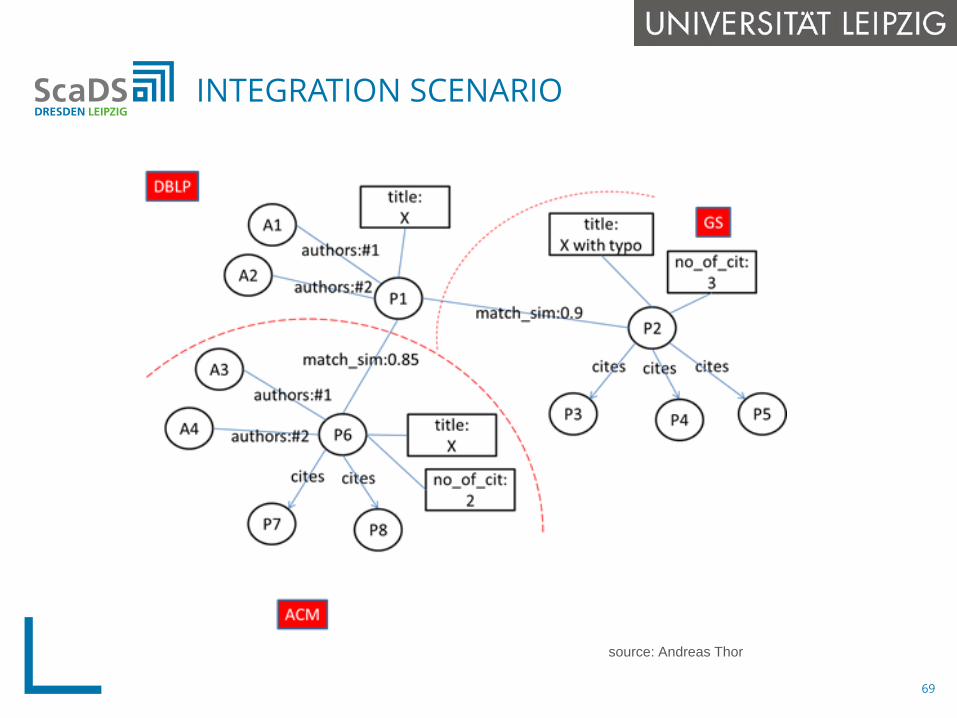
INTEGRATION SCENARIO
69
source: Andreas Thor
graphs like social networks, citation networks, road networks etc change over time need to efficiently update/refresh analysis results
(graph metrics, communities/clusters, …) streaming networks vs slowly evolving networks fast stream analysis vs. analysis of series of graph
snapshots
many initial studies on specific aspects but nocomprehensive system for analysis of dynamic graphs
DYNAMIC GRAPHS
70
need to support both interactive graphqueries / exploration + graph mining
OLAP-like graph analysis functionality Multi-level, multidimensional grouping and
aggregation need for extended (nested) graph model?
visual analytics for big graphs data reduction techniques for visualization
(sampling, multi-level grouping, …)
INTERACTIVE GRAPH ANALYTICS
71
Motivation graph data requirements
Graph data systems graph database systems distributed graph processing systems (Pregel, etc.) distributed graph dataflow systems (GraphX, Gelly)
Gradoop architecture Extended Property Graph Model (EPGM) implementation and performance evaluation
Open challenges
AGENDA
72
Thankyou!
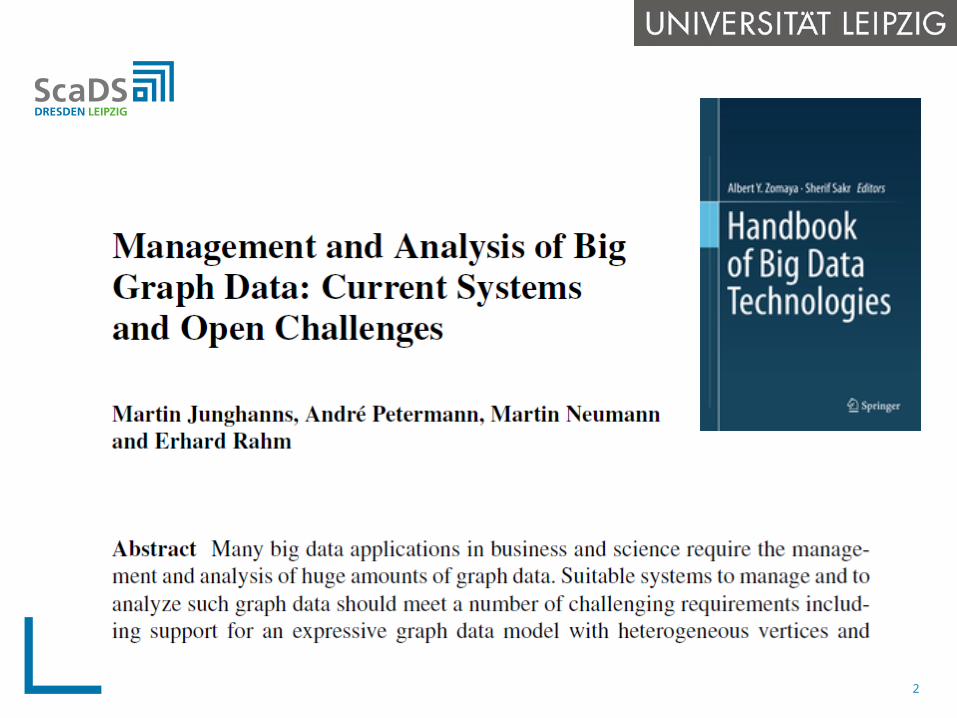
M. Junghanns, A. Petermann, M. Neumann, E. Rahm: Management and Analysis of Big Graph Data: Current Systems and Open Challenges. In: Big Data Handbook (eds.: S. Sakr, A. Zomaya) , Springer, 2017
Gradoop M. Junghanns, M. Kießling, A. Averbuch, A. Petermann, E. Rahm: Cypher-based Graph Pattern Matching in Gradoop.
Proc. ACM SIGMOD workshop on Graph Data Management Experiences and Systems (GRADES), 2017
M. Junghanns, A. Petermann, K. Gomez, E. Rahm: GRADOOP - Scalable Graph Data Management and Analytics with Hadoop. Tech. report (Arxiv), Univ. of Leipzig, 2015
M. Junghanns, A. Petermann, N. Teichmann, K. Gomez, E. Rahm: Analyzing Extended Property Graphs with Apache Flink. Proc. ACM SIGMOD workshop on Network Data Analytics (NDA), 2016
M. Junghanns, A. Petermann, E. Rahm: Distributed Grouping of Property Graphs with GRADOOP. Proc. BTW, 2017
A. Petermann; M. Junghanns: Scalable Business Intelligence with Graph Collections. it - Information Technology Special Issue: Big Data Analytics, 2016
A. Petermann, M. Junghanns, S. Kemper, K. Gomez, N. Teichmann, E. Rahm: Graph Mining for Complex Data Analytics. Proc. ICDM 2016 (Demo paper)
A. Petermann, M. Junghanns, R. Müller, E. Rahm: BIIIG : Enabling Business Intelligence with Integrated Instance Graphs. Proc. 5th Int. Workshop on Graph Data Management (GDM 2014)
A. Petermann, M. Junghanns, R. Müller, E. Rahm: Graph-based Data Integration and Business Intelligence with BIIIG. Proc. VLDB Conf., 2014
A. Petermann, M. Junghanns, R. Müller, E. Rahm: FoodBroker - Generating Synthetic Datasets for Graph-Based Business Analytics. Proc. 5th Int. Workshop on Big Data Benchmarking (WBDB), 2014
A. Petermann, M. Junghanns, E. Rahm: DIMSpan - Transactional Frequent Subgraph Mining with Distributed In-Memory Dataflow Systems. arXiv 2017
REFERENCES
73