SCA User Manual inVia version - 140605 - UCI Department of ...dmitryf/manuals/inVia user...
57
Structural and chemical analyser - user guide 1 Contents 1. Preface ...................................................................................................... 4 1.1. Purpose of the user guide.......................................................................... 4 1.2. Structure of the user guide ........................................................................ 4 1.3. Associated documentation ........................................................................ 4 1.4. Recommended reading material................................................................ 5 1.5. Trademarks and patents ............................................................................ 5 1.6. Disclaimer .................................................................................................. 6 2. System overview........................................................................................ 7 2.1. System architecture ................................................................................... 7 2.1.1. System Layout ..................................................................................7 2.2. SEM interface (SCA).................................................................................. 8 2.2.1. Description of parts ...........................................................................8 2.2.2. Dimensions & weights ....................................................................10 2.2.3. Serial number .................................................................................10 2.3. Spectrometer interface ............................................................................ 10 2.4. Software................................................................................................... 11 2.5. Installation requirements ......................................................................... 11 2.6. Safety information .................................................................................... 12 2.6.1. Laser safety ....................................................................................13 2.6.2. Electrical safety...............................................................................15 2.6.3. Mechanical safety ...........................................................................16 2.6.4. Handling and lifting .........................................................................17 2.6.5. X-ray safety.....................................................................................17 2.7. Maintenance and Servicing ..................................................................... 17 2.2.1. Manual retraction of optic transfer tube ..........................................18 2.2.2. Spare parts and consumables ........................................................18 2.2.3. Service and technical assistance ...................................................19 3. Operating instructions .............................................................................. 20 3.1. Introduction .............................................................................................. 20 3.2. Spectrometer set-up ................................................................................ 21 3.3. SEM set-up .............................................................................................. 23 3.4. Structural and chemical analyser set-up.................................................. 26 3.4.1. Motor control and status indication panel .......................................26 3.4.2. Shuttering and attenuating the laser ...............................................27 3.4.3. Initialising the VCFOP software ......................................................28
-
Upload
trinhtuyen -
Category
Documents
-
view
220 -
download
0
Transcript of SCA User Manual inVia version - 140605 - UCI Department of ...dmitryf/manuals/inVia user...

Structural and chemical analyser - user guide 1
Contents
1. Preface ...................................................................................................... 4
1.1. Purpose of the user guide.......................................................................... 4
1.2. Structure of the user guide ........................................................................ 4
1.3. Associated documentation ........................................................................ 4
1.4. Recommended reading material................................................................ 5
1.5. Trademarks and patents............................................................................ 5
1.6. Disclaimer.................................................................................................. 6
2. System overview........................................................................................ 7
2.1. System architecture ................................................................................... 7
2.1.1. System Layout ..................................................................................7
2.2. SEM interface (SCA).................................................................................. 8
2.2.1. Description of parts...........................................................................8
2.2.2. Dimensions & weights ....................................................................10
2.2.3. Serial number .................................................................................10
2.3. Spectrometer interface ............................................................................ 10
2.4. Software................................................................................................... 11
2.5. Installation requirements ......................................................................... 11
2.6. Safety information.................................................................................... 12
2.6.1. Laser safety ....................................................................................13
2.6.2. Electrical safety...............................................................................15
2.6.3. Mechanical safety ...........................................................................16
2.6.4. Handling and lifting .........................................................................17
2.6.5. X-ray safety.....................................................................................17
2.7. Maintenance and Servicing ..................................................................... 17
2.2.1. Manual retraction of optic transfer tube ..........................................18
2.2.2. Spare parts and consumables........................................................18
2.2.3. Service and technical assistance ...................................................19
3. Operating instructions.............................................................................. 20
3.1. Introduction.............................................................................................. 20
3.2. Spectrometer set-up ................................................................................ 21
3.3. SEM set-up .............................................................................................. 23
3.4. Structural and chemical analyser set-up.................................................. 26
3.4.1. Motor control and status indication panel .......................................26
3.4.2. Shuttering and attenuating the laser...............................................27
3.4.3. Initialising the VCFOP software ......................................................28

2
3.5. Collecting a spectrum ..............................................................................30
3.5.1. Setting the sample height .............................................................. 30
3.5.2. Moving the sample to the analysis position ................................... 34
3.5.3. Setting spectrometer & SCA acquisition conditions....................... 35
3.6. Changing Laser wavelengths...................................................................38
3.6.1. Spectrometer set-up ...................................................................... 38
3.6.2. SCA set-up..................................................................................... 39
3.7. Set-up for VIS/UV-CL and PL spectroscopy ............................................39
3.7.1. Spectrometer set-up ...................................................................... 40
3.7.2. SCA set-up..................................................................................... 40
3.8. Procedure for VIS/UV-CL mapping ..........................................................41
3.8.1. Spectrometer set-up ...................................................................... 42
3.8.2. SCA set-up..................................................................................... 43
3.8.3. SEM and MICA software set-up ..................................................... 43
4. Calibration................................................................................................46
4.1. Silicon signal check (system "health check") ...........................................46
4.2. Setting the analytical WD.........................................................................46
4.3. Setting the analytical position ..................................................................48
Appendix A - Specifications...................................................................................52
Appendix B - SEM implementation notes ..............................................................53
Appendix C – Troubleshooting ..............................................................................54
Appendix D – Weights and dimensions.................................................................57

Structural and chemical analyser - user guide 3
List of figures
Figure 1 - SEM-SCA system architecture .................................................................7
Figure 2 - The structural and chemical analyser SEM interface ...............................8
Figure 3 - front panel of SCA ....................................................................................9
Figure 4 - End panel of SCA (showing power switch location) .................................9
Figure 5 - Position of safety and compliance labels on the SCA ............................12
Figure 6 - Laser Safety Warning Label fitted to removable panels .........................14
Figure 7 - Class 3B laser advisory label .................................................................14
Figure 8 - Laser compliance label...........................................................................15
Figure 9 - Label declaring compliance with EMC/EMI regulations..........................16
Figure 10 - Moving machinery warning label ..........................................................16
Figure 11 - Warning label fitted to SCA casing.......................................................18
Figure 12 - Overview of SCA operation and set-up procedures .............................20
Figure 13 - The WiRE2.0 spectrum acquisition dialog box.....................................21
Figure 14 – The WiRE 2.0 sample review dialog box .............................................21
Figure 15 - inVia rear arm laser paths (514 SEM + Ship path selected).................22
Figure 16 - Flowchart showing SEM set-up ............................................................23
Figure 17 - Control panel for SCA motorised retraction mechanism ......................26
Figure 18 - Figure showing the laser shutter control...............................................27
Figure 19 - ND filter control icon and toolbar ..........................................................28
Figure 20 - Video viewer properties dialog..............................................................28
Figure 21 - Video source dialog ..............................................................................29
Figure 22 - Capture Pin Properties dialog box........................................................29
Figure 23 - Direct method for setting sample height (analytical WD) .....................31
Figure 24 - Indirect method for setting sample height (analytical WD) ...................32
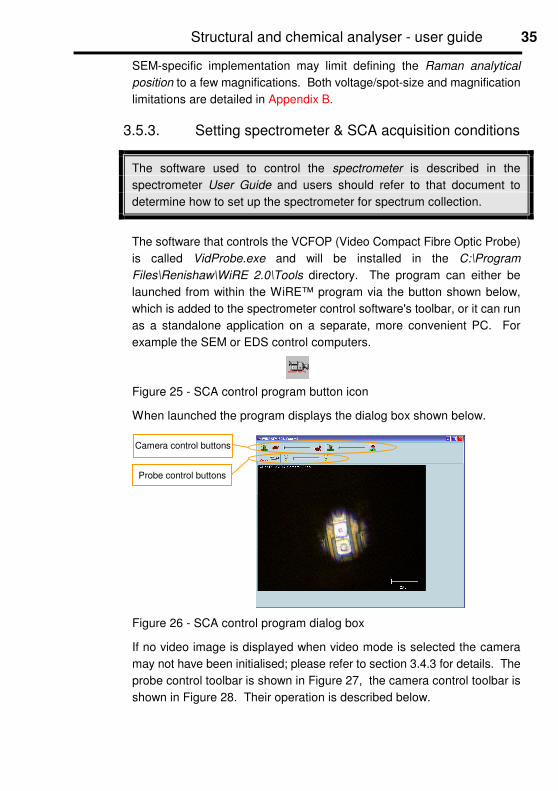
Figure 25 - SCA control program button icon .........................................................35
Figure 26 - SCA control program dialog box...........................................................35
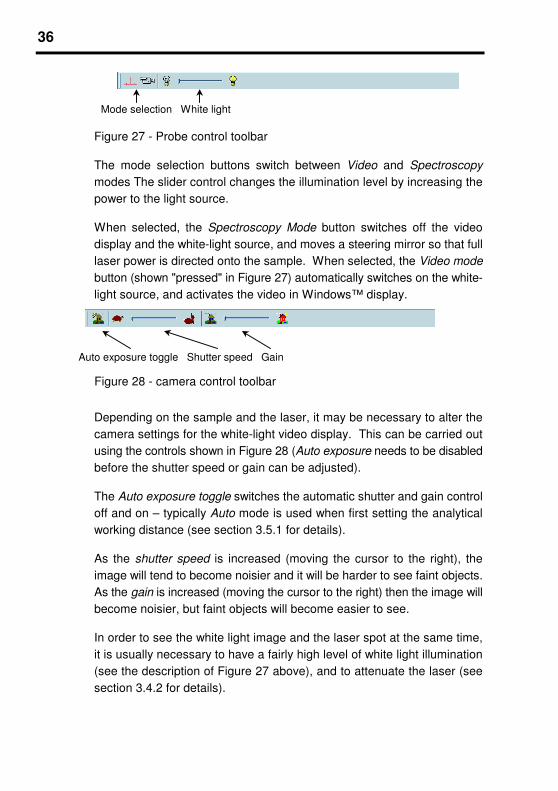
Figure 27 - Probe control toolbar ............................................................................36
Figure 28 - camera control toolbar..........................................................................36
Figure 29 - Video Source dialog .............................................................................37
Figure 30 - Image Control dialog ............................................................................37
Figure 31 - Camera Controls dialog........................................................................37
Figure 32 - inVia rear arm showing position of steering mirrors .............................39
Figure 33 - The three-position technique selection mechanism .............................41
Figure 34 – CCD arm - detector cover in position...................................................42
Figure 35 – CCD arm - auxiliary detector in position (lock-screw circled in red).....42
Figure 36 – The MICA imaging and mapping control dialog box ............................44
Figure 37 - Flowchart showing indirect positioning of laser spot ............................49

4
1. Preface
1.1. Purpose of the user guide
The purpose of this User Guide is to provide information for the safeuse of the Renishaw structural and chemical analyser.
Whilst every effort has been made to ensure the safety of theequipment at the design stage, there are still circumstances underwhich residual risks to the user exist. The risks are highlighted inthis user guide.
1.2. Structure of the user guide
This User Guide comprises four principal sections:
1. The preface gives a brief introduction to this guide as well as some
background information
2. The System Overview provides more general details about the system
including, layouts, annotated drawings of the equipment, installation
requirements, safety, and maintenance information
3. The Operating Instructions uses a combination of flowcharts and
notes, and conventional written instructions to provide a rapid and
easy-to-use reference for system operation
4. The Calibration section describes how to check that the system is
operating nominally, and how to determine the position of the laser
spot with respect to the SEM image and the analytical working
distance
1.3. Associated documentation
This user guide describes only operations that are specific to the structural
and chemical analyser; the following documents should be used for
operations relating to the inVia spectrometer and SEM control:
• [Online] inVia Raman Microscope User Guide (M-9836-0797)
• SEM operation manual (provided by SEM manufacturer)

Structural and chemical analyser - user guide 5
1.4. Recommended reading material
It is strongly suggested that some basic background material on Raman
spectroscopy, both theory and experimental is available to users of the
instrument. Suitable texts include:
1. Modern Spectroscopy J M Hollas (Wiley 1992)
2. Introductory Raman Spectroscopy J R Ferraro and K Nakamoto
(Academic Press 1994)
3. Practical Raman Spectroscopy D J Gardiner and P R Graves
(Springer-Verlag 1989)
4. Analytical Raman Spectroscopy J G Grasselli and B J Bulkin (Wiley
1991)
5. Infrared and Raman Spectroscopy: Methods and Applications B
Schrader (VCH 1995)
6. Introduction to Infrared and Raman Spectroscopy N B Colthrup, L H
Daley and S E Wiberley (Academic Press 1990)
7. Infrared and Raman Spectra of Inorganic and Co-ordination
Compounds K Nakamoto (Wiley 1994)
8. The Handbook of Infrared and Raman Characteristic Frequencies of
Organic Compounds Du-Lin-Vien, N B Colthrup, W G Fatley, J G
Grasselli (Academic Press 1991)
9. Raman\Infrared Atlas of Organic Compounds B Schrader (VCH)
10. The Raman Spectra of Polymers P J Hendra, J K Agbenyega (J Wiley)
1.5. Trademarks and patents
WINDOWS® and Microsoft
® are registered trademarks of Microsoft
Corporation.
WiRE™ and inVia™ are trademarks of Renishaw plc.
The following patents and patent applications relate to variousfeatures of Renishaw's structural and chemical analyser, thenumbers are correct at the time of printing:
EP 0995086WO 03/014794
US 2003-0053048 JP 2002-514,747
Renishaw’s spectrometers are also protected by patents – please

6
refer to the appropriate documentation for details
1.6. Disclaimer
The contents of this document are valid at the time of issue, butRenishaw plc reserves the right to change the contents andspecification without notice.

Structural and chemical analyser - user guide 7
2. System overview
2.1. System architecture
Figure 1 below shows the overall system architecture for the structural and
chemical analyser. The standard length for the armoured conduit that runs
from the SCA to the spectrometer and laser is 5 metres or 6 metres,
although longer conduits are optionally available.
Laser 2 (option)
SCASpectrometer
SEM
Remote controller (option)
Laser 1
USB camera
Vacuum interlock
PC
Figure 1 - SEM-SCA system architecture
2.1.1. System Layout
From an operational perspective, it is preferable that the SEM and the
Raman spectrometer are located relatively close to each other, but the final
layout of the system will depend on the type of spectrometer chosen, and
existing SEM laboratory space constraints.
The inVia™ spectrometer can be used as standalone unit, and is supplied
with an optical table (the dimensions of which are normally 5’ x 3’ x 8” –
1524 mm x 896 mm x 203.2 mm); the "footprint" of the Raman system is
defined by the optical table. The spectrometer may require class 3B laser
safety measures (see section 2.6.1). It is possible to locate the SEM and
spectrometer in adjacent laboratories, but this requires a feed-through for
the conduit and cables, and under these conditions we would recommend

8
a second PC with a KVM (keyboard, video, mouse) switch to control the
spectrometer remotely from the SEM room.
2.2. SEM interface (SCA)
The structural and chemical analyser (SCA) is principally the SEM
interface. Inside the casing there is a motor-driven three-position retraction
mechanism, and a video probe, which can have one or two confocal single
mode compact fibre optic probes (CSMCFOP) attached to it. Externally
there are connections to the spectrometer, computer, and to the SEM
electronics for the vacuum interlock.
There is also an armoured conduit (two for a dual-channel configuration)
that carries optical fibres for the laser excitation and the Raman signal, and
electrical cables for the laser safety interlock. This conduit connects to the
spectrometer interface (see section 2.3).
2.2.1. Description of parts
Figure 2 - The structural and chemical analyser SEM interface
Conduit tospectrometer
Connector panel
Manual opticstransfer tube retract
Motor control &status indication
Laser shutter

Structural and chemical analyser - user guide 9
Figure 3 - front panel of SCA
Figure 4 - End panel of SCA (showing power switch location)
The power switch for the system is located in the position shown - the unit
should normally be left on so that the safety features remain operational
The operation and function of the motor control and status indication panel
is described in section 3.4
The operation and function of the Laser shutter is described in section 3.5.4
The armoured conduit to the spectrometer interface protects two optical
fibres; one for the laser excitation, the other for the Raman signal. The
conduit also contains wires for the laser interlock - in the unlikely event that
the conduit and the fibres and wires within it were severed, the laser would
be shut off.
The functions of the sockets on the Connector panel are as follows:
Power switch
10
• REMOTE - for the optional remote controller which duplicates the
functions of the motor control and status indication panel (see section
3.4 for operational information)
• USB - for the WebCam that displays the white-light image with the
laser spot
• COM - for the computer control that controls the intensity of the white
light illumination, and the operation of the flip-mirror to switch between
Raman spectroscopy and white light imaging
• POWER - for the SCA power supply
• VACUUM INTERLOCK - for the connection to the SEM vacuum logic
which ensures that the SCA cannot be accidentally damaged by
improper use (details of the vacuum interlock are given in section 3.4)
The operation and function of the Manual retraction for the optic transfer
tube is described in section 2.7.1.1
2.2.2. Dimensions & weights
The drawing (G-9838-0284-01-B) in Appendix D gives the dimensions of
the system and its centre of gravity. The weight of a single channel system
is approximately 15.0 kg, and a dual channel system weighs 15.5 kg.
2.2.3. Serial number
The serial number of the system is located to the right of the manual optic
transfer tube retraction mechanism, please quote this number in any
communications with Renishaw plc.
2.3. Spectrometer interface
For inVia Reflex and Standard models, both the laser and signal fibre
connections are made internally and are set-up by the installation Engineer
during commissioning. SCA-input (single or dual channel) is simply
selected from within the WiRE™2.0 software (see section 3.2.1 for further
details), and this drives filters, gratings, and mirrors to reconfigure inVia
automatically for the SCA beam paths.
For further information please refer to section 3.2

Structural and chemical analyser - user guide 11
2.4. Software
The software that controls the SCA – specifically switching between white-
light imaging and Raman spectrometry, and controlling the SCA video
viewer and illumination control, can either be launched from an icon in the
Renishaw WiRE software, or can run as a standalone application running
on another more convenient PC (e.g. the SEM control PC). The WiRE
software that controls the spectrometer, or the SEM control software is
otherwise unaltered, and the relevant sections of the inVia spectrometer
user guide should be referred to for its operation.
Detailed information about the operation of the SCA software is given in the
relevant parts of section 3.0
2.5. Installation requirements
All local regulations regarding installation of Class 3B (IIIB) laser system
must be followed.
The SCA requires a single electrical supply connection. Please refer to the
User Guide supplied with the spectrometer to determine how many
additional connections are needed.
The room in which the system is installed should be capable of being
blacked-out during operation (that is, the internal room lighting and any
external light sources should be capable of being extinguished and
excluded respectively). Extraneous light may contaminate the data
acquired during operation. It is recommended that low-wattage
incandescent lamps are available in addition to fluorescent strip lighting,
and that any windows are permanently blacked-out and sealed.
In addition to local Health and Safety regulations, the system should be
situated so that mechanical vibration and acoustic noise do not affect the
system stability - SEM installation requirements are satisfactory in this
respect.
The system should be situated such that air-borne particles (dust) do not
heavily contaminate the system optics, resulting in a possible reduction of
the operational efficiency of the system. Keep the spectrometer door
closed (or the covers in place) to keep the optics clean. Do not attempt
to clean any optics before contacting Renishaw (or authorised dealer,
agent, distributor or subsidiary).

12
Operating conditions: 20-30ºC (stable to ±2ºC)
<90% RH (non-condensing)
The SCA drive mechanism does not generate sufficient heat to require
venting or cooling (even for a duty-cycle close to 100%). The spectrometer
and laser, however, will generate moderate amounts of heat so air-
conditioning may be necessary to maintain room temperature stability.
2.6. Safety information
Under normal operating conditions the SCA itself presents no hazards to
the operator. The SCA, however, is designed for use with a spectrometer
that uses a Class 3B laser (as defined by International Standard IEC
825:1993, CENELEC Standard EN60825:1994, and US Standard 21 CFR
1040.10), and for this reason the SCA is a class 3B laser product.
The SCA is powered by a third party (and hence fully certified) power
supply unit, which delivers the 36V used by the SCA. This low operating
voltage means that the SCA falls into the same category as battery
powered devices.
Although the SCA has moving parts, these are enclosed during normal
operation, and are only potentially hazardous when the mechanism is
exposed during installation and maintenance. These safety considerations
are reflected in the labelling of the SCA; the figure below shows the
positions of the safety and compliance labels.
Figure 5 - Position of safety and compliance labels on the SCA
Laser safety label
Compliance label
Manufacture details
Safety warning
Compliance labelSerial number
Laser safety label
Structural and chemical analyser - user guide 13
2.6.1. Laser safety
The spectrometer will normally be supplied with the laser, although the
type, model, and characteristics of the laser may vary among different
systems/applications or at different times. Lasers other than those
provided by Renishaw may be suitable for use with the system, but
this must be confirmed through Renishaw plc before installation. If
a high-power laser (not provided by Renishaw) is used, additional
risks will arise; in particular the laser power visible through an SEM
viewport may exceed Class 1 AEL (Accessible Emission Limit) which
would contravene the above standards and introduce a significant risk
of laser damage to the eyes of the operator.
For details of the maximum output power and emitted wavelengths of your
laser, refer to the user instructions/manual issued with the laser in use with
the spectrometer.
Class 3B lasers are potentially hazardous if a direct beam or specular
reflection is viewed by the unprotected eye. Precautions should be
taken to avoid direct beam viewing, and to control specular
reflections.
When the SCA is operated under standard conditions, the laser beam is
completely enclosed within the system except as it leaves the parabolic
mirror in the SEM. The risk of exposure will therefore only occur under the
following circumstances:
•••• As specular reflection from the beam as it leaves the laser and enters
the back of the spectrometer (unless the laser path is fully enclosed).
Access to this region, particularly of reflective objects should be
strictly controlled.
•••• As specular reflection from the sample if the SEM has a viewport with
line of sight to the sample. The beam will be focused by the parabolic
mirror to a point just below the optic transfer tube and will rapidly
diverge thereafter. This divergence means that any laser radiation
visible through a viewport is at least an order of magnitude below the
Class 1 AEL (Accessible Emission Limit).
•••• If the user defeats the interlock switches on the spectrometer door or
if the user removes the various access covers or blanking plugs on
the SCA unit whilst the laser is turned on. Warning labels as shown
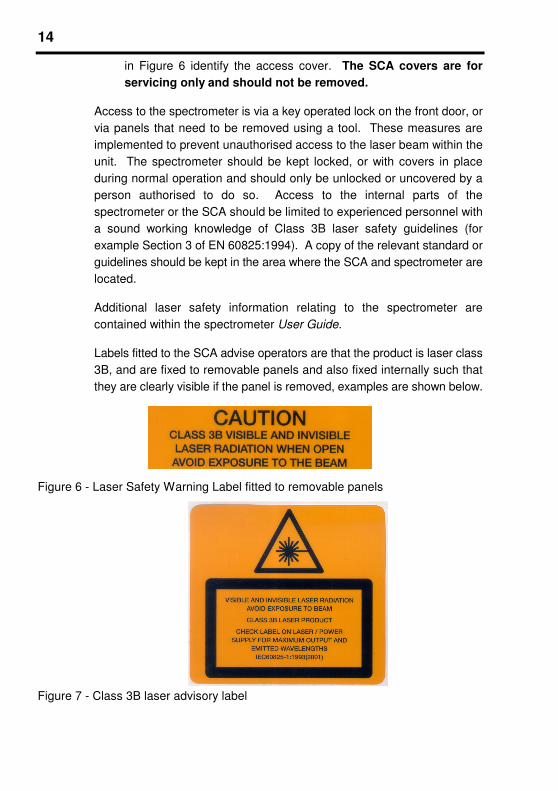
14
in Figure 6 identify the access cover. The SCA covers are for
servicing only and should not be removed.
Access to the spectrometer is via a key operated lock on the front door, or
via panels that need to be removed using a tool. These measures are
implemented to prevent unauthorised access to the laser beam within the
unit. The spectrometer should be kept locked, or with covers in place
during normal operation and should only be unlocked or uncovered by a
person authorised to do so. Access to the internal parts of the
spectrometer or the SCA should be limited to experienced personnel with
a sound working knowledge of Class 3B laser safety guidelines (for
example Section 3 of EN 60825:1994). A copy of the relevant standard or
guidelines should be kept in the area where the SCA and spectrometer are
located.
Additional laser safety information relating to the spectrometer are
contained within the spectrometer User Guide.
Labels fitted to the SCA advise operators are that the product is laser class
3B, and are fixed to removable panels and also fixed internally such that
they are clearly visible if the panel is removed, examples are shown below.
Figure 6 - Laser Safety Warning Label fitted to removable panels
Figure 7 - Class 3B laser advisory label
Structural and chemical analyser - user guide 15
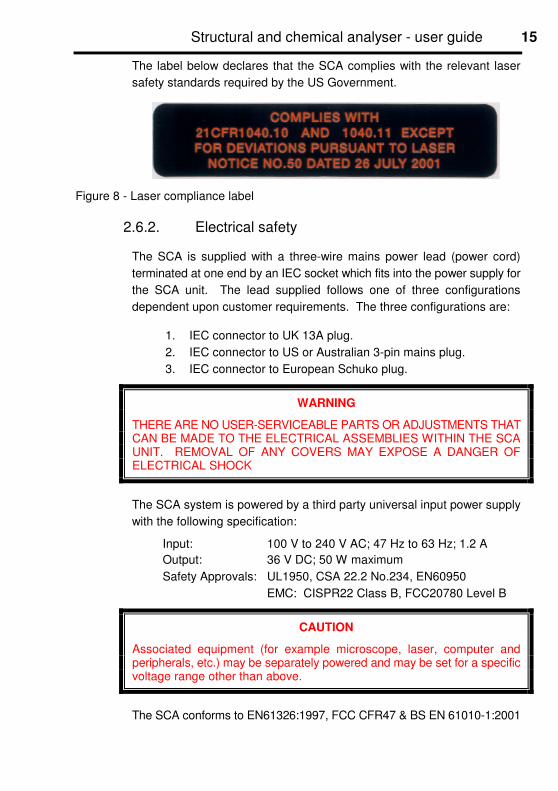
The label below declares that the SCA complies with the relevant laser
safety standards required by the US Government.
Figure 8 - Laser compliance label
2.6.2. Electrical safety
The SCA is supplied with a three-wire mains power lead (power cord)
terminated at one end by an IEC socket which fits into the power supply for
the SCA unit. The lead supplied follows one of three configurations
dependent upon customer requirements. The three configurations are:
1. IEC connector to UK 13A plug.
2. IEC connector to US or Australian 3-pin mains plug.
3. IEC connector to European Schuko plug.
WARNING
THERE ARE NO USER-SERVICEABLE PARTS OR ADJUSTMENTS THATCAN BE MADE TO THE ELECTRICAL ASSEMBLIES WITHIN THE SCAUNIT. REMOVAL OF ANY COVERS MAY EXPOSE A DANGER OFELECTRICAL SHOCK
The SCA system is powered by a third party universal input power supply
with the following specification:
Input: 100 V to 240 V AC; 47 Hz to 63 Hz; 1.2 A
Output: 36 V DC; 50 W maximum
Safety Approvals: UL1950, CSA 22.2 No.234, EN60950
EMC: CISPR22 Class B, FCC20780 Level B
CAUTION
Associated equipment (for example microscope, laser, computer andperipherals, etc.) may be separately powered and may be set for a specificvoltage range other than above.
The SCA conforms to EN61326:1997, FCC CFR47 & BS EN 61010-1:2001

16
Figure 9 - Label declaring compliance with EMC/EMI regulations
2.6.3. Mechanical safety
When the SCA panels are attached, no mechanical hazard is presented to
the user. There are, however, moving powered parts within the
spectrometer, which pose a crushing hazard (for example, to fingers).
Under normal operating conditions, the SCA should never be used with any
covers removed.
During alignment the SCA must be operated with the panels removed,
during this process great care should be taken to keep fingers etc. away
from moving parts. Alignment should only be carried out by trained
Renishaw Engineers.
When the covers are removed the label below indicates that there are
moving parts that might be hazardous.
Figure 10 - Moving machinery warning label
WARNING
IN THE PERIOD IMMEDIATELY FOLLOWING POWER ON, THE SCAFIRMWARE INITIALISES, AND THE MOTORS MAY UNDERGO A RAPIDPRE-PROGRAMMED MOVEMENT LASTING A FEW SECONDS. IF THEPANELS ARE REMOVED, GREAT CARE MUST BE TAKEN TO KEEPFINGERS ETC. AWAY FROM THE MOVING PARTS.

Structural and chemical analyser - user guide 17
2.6.4. Handling and lifting
The SCA may only be installed by Renishaw Engineers or installation
Engineers trained and approved by Renishaw. Any subsequent movement
or lifting of the unit is done at the user’s risk.
WARNING
IF THE SCA IS DETACHED FROM THE SEM, ITS WEIGHT MUST NEVERBE SUPPORTED BY THE IN-SEM OPTICS TRANSFER TUBE. THISWILL IRREPARABLY DAMAGE THE OPTICS REQUIRING EXCHANGEOF THE ENTIRE COLLECTION OPTICS ASSEMBLY. NOTE: ONCE THEUNIT HAS BEEN MOVED, IT WILL ALSO NEED TO BE REALIGNED.
2.6.5. X-ray safety
The Ionising Radiation Regulations 1999 (ISBN 0 7176 1746 7) state that
the maximum permissible annual dose for X-rays is 20 milli-Sieverts (this
translates to 3.805 x 10⁻⁸ Sieverts per hour, or 0.038 micro-Sieverts per
hour). In practice it is not expected that persons would be exposed to the
radiation source 24 hours per day 365 days per year, and so a maximum
dose rate is set at 7.5 micro-Sieverts per hour [HSE Information Sheet:
Industrial radiography – managing radiation risks].
Calculations and experimental measurements1 show that even under worst
case experimental conditions, X-ray emissions from the SCA (even with
covers removed) are below harmful levels.
2.7. Maintenance and Servicing
WARNING
DO NOT REMOVE COVERS, THE SCA CONTAINS NO USER
SERVICEABLE PARTS - REFER SERVICING TO QUALIFIED
PERSONNEL. UNAUTHORISED REMOVAL OF COVERS INVALIDATES
THE WARRANTY AND CALIBRATION
1 Tests carried out by JEOL Technics Ltd., and Nanotechsys PTY

18
This warning is echoed by the label shown below that is fitted to the SCA
casing
Figure 11 - Warning label fitted to SCA casing
2.2.1. Manual retraction of optic transfer tube
Pressing the control buttons on the front panel or remote (see section 3.4
for details) normally activates insertion and retraction of the optic transfer
tube. In the event of power failure, however, the tube can be retracted
manually using a flat-bladed screwdriver. This operation should only be
carried out if absolutely necessary (i.e. if the SEM chamber is to be vented)
since it works against the mechanism's braking system.
2.2.2. Spare parts and consumables
Spare parts for the SCA include the following items:
• In-SEM touch-alarm mechanism
• In-SEM vacuum mirror
• Complete factory-aligned optics transfer tube assembly
Users should not attempt to exchange these parts themselves, and under
no circumstances should any attempt ever be made to clean either the
vacuum-side or air-side mirrors.
There are a number of consumable items associated with the SCA, the
most significant of which is the edge-welded vacuum bellows which has a
projected lifetime of 6000 full insertion and retraction cycles. The bellows
assembly can be quickly exchanged by qualified Renishaw service
personnel without affecting the system alignment, and will be combined
with preventative maintenance to exchange motor drive belts. The LED
that provides white-light illumination for the VCFOP has a design lifetime
of 60,000 hours, but this can also be replaced if necessary.

Structural and chemical analyser - user guide 19
2.2.3. Service and technical assistance
In the event that there are any difficulties or problems with the SCA, please
contact your local Renishaw office or agent - names and addresses for
which can be found on our website at www.renishaw.com. The SCA
contains no user-serviceable parts, and any adjustments to the
mechanisms within the unit will dramatically compromise its performance.
20
3. Operating instructions
3.1. Introduction
The operating instructions for the structural and chemical analyser are a
combination of conventional written instructions, and a series of flowcharts
with notes, which are intended to provide a quick and easy-to-follow
overview of various procedures, and also to provide a rapid means of
accessing the more detailed information.
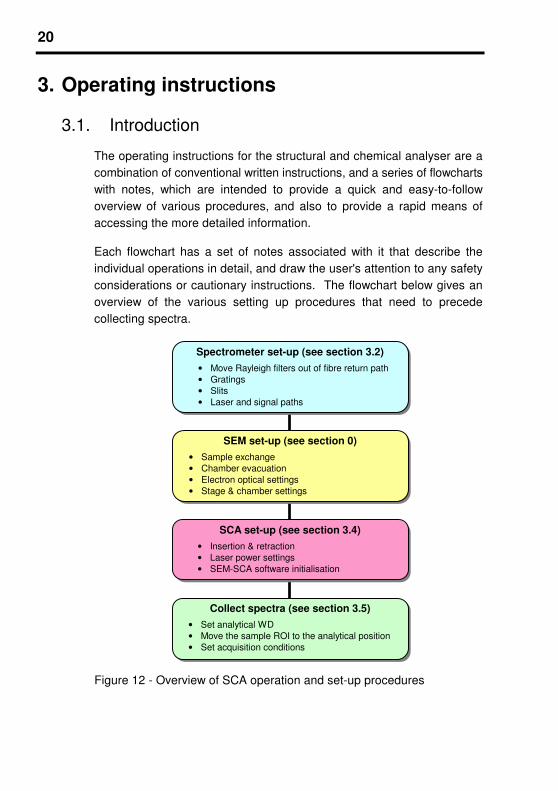
Each flowchart has a set of notes associated with it that describe the
individual operations in detail, and draw the user's attention to any safety
considerations or cautionary instructions. The flowchart below gives an
overview of the various setting up procedures that need to precede
collecting spectra.
Figure 12 - Overview of SCA operation and set-up procedures
Spectrometer set-up (see section 3.2)
• Move Rayleigh filters out of fibre return path
• Gratings
• Slits
• Laser and signal paths
Collect spectra (see section 3.5)
• Set analytical WD
• Move the sample ROI to the analytical position
• Set acquisition conditions
SCA set-up (see section 3.4)
• Insertion & retraction
• Laser power settings
• SEM-SCA software initialisation
SEM set-up (see section 0)
• Sample exchange
• Chamber evacuation
• Electron optical settings
• Stage & chamber settings

Structural and chemical analyser - user guide 21
3.2. Spectrometer set-up
Setting up inVia Standard or Reflex spectrometer models for use with the
SCA is very straightforward. During SCA installation, the laser and signal
fibres are connected to the spectrometer, and the laser and fibre-probe light
path(s) are aligned and programmed into the spectrometer configuration.
The inVia software treats the SCA as a different laser type (or different
laser types for dual-channel systems). When one of these is selected from
within the WiRE™2.0 Sspectral acquisition set-up dialog box (shown in
Figure 13 below) or the Sample Review dialog box (shown in Figure 14
below), then the appropriate beam paths and default spectrometer
acquisition conditions are set up automatically (remove Rayleigh filters from
beam path, and select the appropriate grating). The system may prompt
for exchange of lens sets. Please also refer to the inVia spectrometer User
Guide for further details
Figure 13 - The WiRE2.0 spectrum acquisition dialog box
Figure 14 – The WiRE 2.0 sample review dialog box
The spectrometer slit will automatically be set to 70 micrometres for
Raman probes, and 350 micrometres for CL probes (refer to the inVia
spectrometer [online] User Guide for further details) for optimum
performance. At the beginning of a series of SCA measurements, it is
recommended that a system "health check" be carried out using the silicon

22
calibration sample (see 4.1 for details).
It is also necessary to ensure that the correct laser paths are selected on
the inVia rear arm (this is the grey square-section box behind the main
spectrometer and placed perpendicular to the laser paths.
Depending on the laser wavelength selected, the appropriate kinematic
mirror assembly should be set to the SEM + Ship position (see Figure 15
for details).
Figure 15 - inVia rear arm laser paths (514 SEM + Ship path selected)
VIS SCA position
VIS inVia positionNIR inVia position
NIR SCA position

Structural and chemical analyser - user guide 23
3.3. SEM set-up
The basic operating procedure is shown in Figure 16. This procedure
assumes that the SEM has not been previously used with the SCA.
Figure 16 - Flowchart showing SEM set-up
Switch HT off1
Move stage to exchange position2
VENT chamber3
Exchange sample4
PUMP chamber3
Move stage to long WD5
Switch HT on1
Select low magnification6
Set objective lens WD7
Move stage to focus sample8
Move stage to zero tilt9

24
The precise set-up of the SEM will always be specific to the manufacturers'
make and model, details of which may be found in their SEM user guide
and also Appendix B. Nevertheless, there are basic set-up requirements
that are generic, some of these are hardware operations, some are driven
by software, and some can be adjusted either manually or by computer
control. The following notes relate to the steps above; users should pay
particular attention to notes 5, 7, and 9.
1. The SEM HT needs to be switched off before samples can be
exchanged unless the column and chamber are pumped separately
(as is common for FEG-SEMs). Further information will be found in the
User Guide provided by the SEM vendor.
2. If the SEM has a fast entry lock for exchanging samples, then the
stage must be moved to a particular exchange position - this position
may be pre-programmed into the memory of a motorised stage, or may
have to be set manually. Further information will be found in the User
Guide provided by the SEM vendor.
3. The SCA includes a vacuum interlock, which, if implemented, prevents
the chamber from being VENTED unless the collection optics are fully
retracted. Similarly, the SCA retraction mechanism controls are
deactivated until the chamber is fully pumped (see section 3.4.1 for
more details). Details regarding the VENT and PUMP operations of
the SEM will be found in the User Guide provided by the SEM vendor.
4. For certain SEM models, Renishaw may provide a custom sample
holder or insert - this will include calibration samples, and positions for
standard SEM sample stubs. The use of other sample holders
means that special attention must be paid to the sample height
with respect to the holder to avoid damaging the SCA collection
optics. IMPORTANT: If the sample is in too high a position,
damage to the SCA collection optics may be caused on their
insertion. The SEM stage may have a working distance (WD)
indication marked upon it, but this is normally referenced to the top
surface of a standard sample holder - if samples protrude above the
top surface of the sample holder, the stage markings cannot be used.
The SCA collection optics are designed to work at one analytical WD
- the WD referred to here is the objective lens WD, specifically the
distance from an in-focus surface (normally the sample) to the
objective lens. Typically the analytical WD is 15-20mm depending on

Structural and chemical analyser - user guide 25
the SEM model (see Appendix B for more details). When exchanging
samples it is important that the sample is not positioned so that it is
higher than the analytical WD (i.e. the actual WD is less than the
analytical WD) otherwise there is the risk that when the SCA collection
optics are inserted they will hit the sample causing possible damage.
To prevent the possibility of damage the stage Z control should be set
to a long WD so that there is minimal danger of hitting the sample
when inserting the collection optics - see Appendix B for more details.
5. Step 5 above will mean that the sample is likely to be out of focus, so
a low magnification (< x100) should be set so that it is easy to see
when the sample is coming into focus.
6. This step is the "coarse Z" setting of the WD, and is designed to get
the sample close to the analytical WD. All modern SEMs have an
indication of the WD (specifically the distance from an in-focus surface
- normally the sample - to the objective lens), and some enable it to be
set directly - further information will be found in the User Guide
provided by the SEM vendor. If the WD cannot be set directly, the
focus control of the SEM should be adjusted until the correct WD
setting is indicated. The objective lens (OL) WD should be set to a
value 2 mm greater than the analytical WD (for example if the
analytical WD is 15 mm, set the OL WD to 17 mm).
7. Once the OL WD has been set, simply move the stage Z to focus the
sample - do not change the focus settings of the SEM since this will
change the effective WD.
8. IMPORTANT - Move the stage to zero tilt otherwise damage may
be caused to the collection optics.
It is recommended that unless the samples to be analysed are similar in
size and shape, that they be introduced separately into the SEM chamber.
This is to prevent the possibility that tall samples will interfere with the
collection optics when attempting to analyse short ones.
26
3.4. Structural and chemical analyser set-up
This section describes the controls associated with the structural and
chemical analyser and relates principally to inserting and retracting the
collection optics, and shuttering or attenuating the laser.
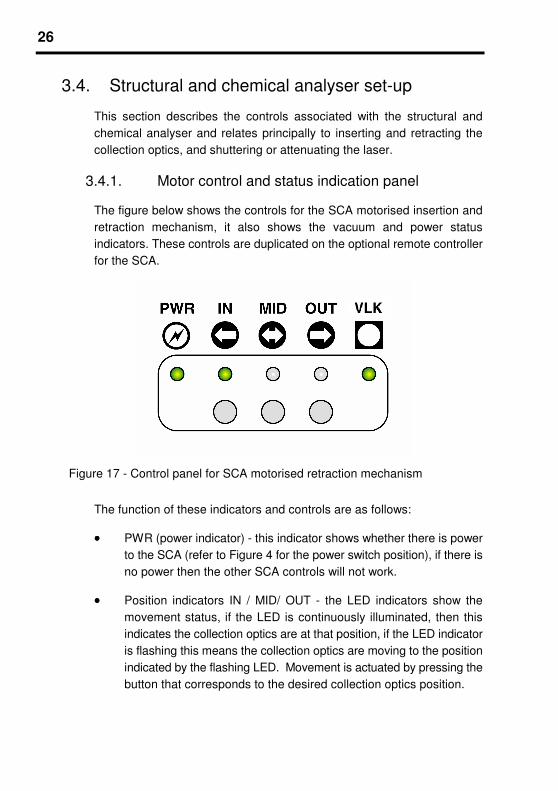
3.4.1. Motor control and status indication panel
The figure below shows the controls for the SCA motorised insertion and
retraction mechanism, it also shows the vacuum and power status
indicators. These controls are duplicated on the optional remote controller
for the SCA.
Figure 17 - Control panel for SCA motorised retraction mechanism
The function of these indicators and controls are as follows:
•••• PWR (power indicator) - this indicator shows whether there is power
to the SCA (refer to Figure 4 for the power switch position), if there is
no power then the other SCA controls will not work.
•••• Position indicators IN / MID/ OUT - the LED indicators show the
movement status, if the LED is continuously illuminated, then this
indicates the collection optics are at that position, if the LED indicator
is flashing this means the collection optics are moving to the position
indicated by the flashing LED. Movement is actuated by pressing the
button that corresponds to the desired collection optics position.
Structural and chemical analyser - user guide 27
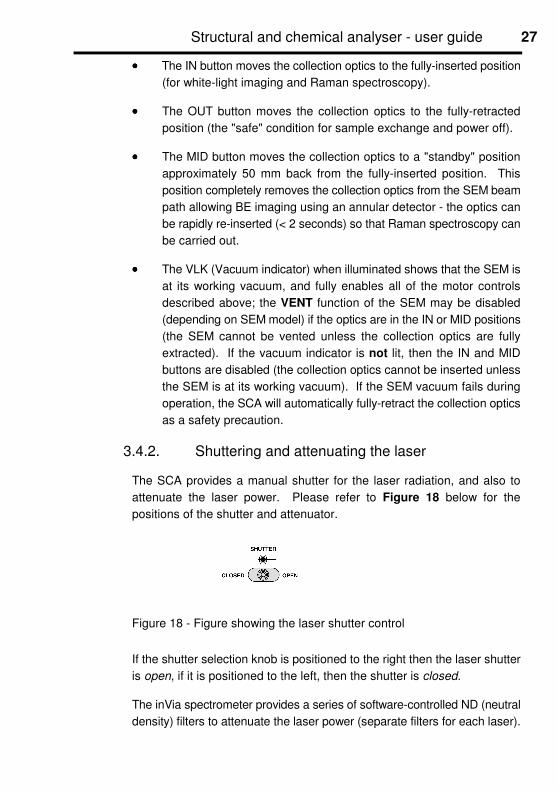
•••• The IN button moves the collection optics to the fully-inserted position
(for white-light imaging and Raman spectroscopy).
•••• The OUT button moves the collection optics to the fully-retracted
position (the "safe" condition for sample exchange and power off).
•••• The MID button moves the collection optics to a "standby" position
approximately 50 mm back from the fully-inserted position. This
position completely removes the collection optics from the SEM beam
path allowing BE imaging using an annular detector - the optics can
be rapidly re-inserted (< 2 seconds) so that Raman spectroscopy can
be carried out.
•••• The VLK (Vacuum indicator) when illuminated shows that the SEM is
at its working vacuum, and fully enables all of the motor controls
described above; the VENT function of the SEM may be disabled
(depending on SEM model) if the optics are in the IN or MID positions
(the SEM cannot be vented unless the collection optics are fully
extracted). If the vacuum indicator is not lit, then the IN and MID
buttons are disabled (the collection optics cannot be inserted unless
the SEM is at its working vacuum). If the SEM vacuum fails during
operation, the SCA will automatically fully-retract the collection optics
as a safety precaution.
3.4.2. Shuttering and attenuating the laser
The SCA provides a manual shutter for the laser radiation, and also to
attenuate the laser power. Please refer to Figure 18 below for the
positions of the shutter and attenuator.
Figure 18 - Figure showing the laser shutter control
If the shutter selection knob is positioned to the right then the laser shutter
is open, if it is positioned to the left, then the shutter is closed.
The inVia spectrometer provides a series of software-controlled ND (neutral
density) filters to attenuate the laser power (separate filters for each laser).

28
During installation of the WiRE™ 2.0 software an icon is set up to activate
the ND filter control utility. The icon, and the toolbar it displays are shown
in Figure 19 – pressing the appropriate button selects the filter.
Figure 19 - ND filter control icon and toolbar
3.4.3. Initialising the VCFOP software
The VCFOP program is either called from WiRE™2.0, or can run as a
standalone application on another PC. Software initialisation is required
the first time the software is used after the PC running WiRE™ (or the
standalone application) has been switched off, or if the USB camera cable
to the PC or the SCA has been or become disconnected for any reason.
Press the SCA software button (shown left) to start the VCFOP
control program, the image area will be represented by a white
rectangle, right click the mouse inside this area and then left click the
mouse on properties which will display the dialog box shown below.
Figure 20 - Video viewer properties dialog
Click on the Video Source tab (circled orange in Figure 20) to display the
dialog shown in Figure 21.
Toolbar icon 100% 10% 1% 0.1% Blocked

Structural and chemical analyser - user guide 29
Figure 21 - Video source dialog
Click on the camera identifier (circled in orange in Figure 21) to highlight it
then click on the Apply button (which will not be greyed) circled in blue in
Figure 21, finally click on the Video Capture Pin button (circled in magenta
in Figure 21) to display the dialog box shown in Figure 22.
Figure 22 - Capture Pin Properties dialog box
Click on the Output Size drop-down box (circled in orange in Figure 22),
and select 640x480 resolution (320x240 is the start-up default), click on OK
and finally click on OK in the Video Viewer Properties dialog (circled in blue
in Figure 22) - the VCFOP software is now initialised.

30
3.5. Collecting a spectrum
Preparations to collect a spectrum involves three principal operations:
• Positioning the sample at the analytical height
• Moving the point of interest on the sample to the analytical position
• Setting the spectrometer acquisition conditions
Once these operations have been carried out, a spectrum can be collected.
If the sample is flat, then the first operation need only be carried out at the
beginning of the analytical procedure, similarly, if the signal levels from the
sample are comparable, then the third operation need not be repeated.
Once the preparations have been completed, subsequent spectra can be
collected far more quickly.
3.5.1. Setting the sample height
This operation is critical to the effectiveness of the spectrum
collection process. The aim of this operation is to set the point on the
sample that is to be analysed at the focal point of the collection optics. The
depth of field of the collection optics is in the order of 10 micrometres to 20
micrometres so this operation must be carried out accurately in order to get
a good Raman spectrum.
There are two methods that can be used to set the sample height - the
direct method uses the white-light image to view the sample and the laser
spot projected onto it, whereas the indirect method uses the SEM objective
lens to define the analytical working distance. Which of the two methods
that is most suitable will often depend on the nature of the sample, but also
the nature of the SEM implementation.
Generally the direct method is easier and quicker to set-up, but highly
topographic, transparent, or low-contrast samples can be difficult to image
using white light, or the laser spot may be too diffuse to focus accurately.
The indirect method will work for any sample and can be highly accurate,
but may be cumbersome for certain SEM implementations (see Appendix
B for specific information).

Structural and chemical analyser - user guide 31
The flowchart below show the steps involved for the direct method.
Figure 23 - Direct method for setting sample height (analytical WD)
1. Use the SCA control program (see section 3.5.3) to select video mode
for the VCFOP.
2. A bright area should be visible, then slowly move the stage upwards
until the white-light image is focussed. Alternatively, the laser spot can
be used to determine how far the sample is from the analytical WD -
the spot size will decrease to a minimum when the analytical WD is
reached (thereafter it will get bigger again). If at this stage, either the
white light image cannot be focussed, or the laser spot is not visible,
the indirect method should be used.
3. If the sample is very reflective, the image of the laser spot may
overwhelm the white-light image. Refer to section 3.4.2 (Shuttering
Switch VCFOP to white-light imaging1
Move Z to focus white-light image2
Move Z to minimise laser spot size4
Attenuate laser (section 3.4.2)3
Is the laser spot visible?
yes
noUse indirect
method
Is the laser spot too bright?
yes
no
Select ROI(section 3.5.2)
32
and attenuating the laser) for details about how to reduce the laser
intensity. Once the laser intensity is acceptable move to step 4.
4. Carefully make fine adjustments to the stage Z control to minimise the
laser spot. The sample is now at the analytical WD and the region of
interest on the sample can be moved to the analysis position (3.5.2).
IF THE TOUCH ALARM SOUNDS
This indicates that the sample (or some part of the sample holder or stage)
has contacted the touch sensor on the bottom of the collection optics. DO
NOT MOVE THE STAGE ANY HIGHER otherwise the collection optics may
be permanently damaged. Move the stage down - if the sample caused the
alarm to sound, it is approximately 0.5 mm above the analytical WD.
The flowchart below show the steps involved for the indirect method.
Figure 24 - Indirect method for setting sample height (analytical WD)
Set OL excitation (focal length)1
Clear lens hysteresis2
Move Z to focus SEM image4
Set SEM magnification to x10003
Select ROI(section 3.5.2)
Set SEM magnification to x10,0005
Move Z to focus SEM image4

Structural and chemical analyser - user guide 33
1. The objective lens (OL) of the SEM may be thought of as a variable
focal length lens, and the indirect method simply sets the focal length
equal to at analytical WD. The focal length of the SEM OL is
commonly referred to as the working distance and is normally equal to
the physical distance between the bottom of the objective lens and the
in-focus part of the sample. The working distance of the OL is
adjusted using the focus control.
For some SEMs the OL excitation (focal length) can be set directly via
a set WD function, or by setting directly the coarse and fine DAC
(digital to analogue converters) values that drive the lens. If no such
function exists, then the focal length must be set-up using a sample for
which the direct method works (e.g. bare silicon), and then without
touching the SEM focus control move to the sample for analysis and
continue to the next step.
Specific information about which of the methods above are used for a
particular make and model of SEM may be found in Appendix B
2. Electromagnetic lenses can become slightly magnetised over a short
time, especially if the lens excitation is frequently ramped from
maximum to minimum. As a result, the focussing effect becomes non-
linear, and a given excitation may not result in the desired focal length.
This phenomenon is known as hysteresis, and to remove it the lens
is temporarily grounded - the Lens Clear operation. The SEM Users'
Guide will give information about how to clear the lenses.
3. The SEM magnification should be set to an "intermediate"
magnification (for example x1000) that is suitable for coarse focus
adjustment - the error in Z setting is in the order of 20 micrometres to
30 micrometres.
4. Without touching the SEM focus control the stage Z should be carefully
adjusted to bring the SEM image into focus - this is the coarse focus
adjustment.
5. The SEM magnification should be set to a "high" magnification (for
example x10,000) that is suitable for fine focus adjustment - the error
in Z setting is in the order of 2 micrometres to 3 micrometres.

34
6. Without touching the SEM focus control the stage Z should be carefully
adjusted to bring the SEM image into focus - this is the fine focus
adjustment.
IF THE TOUCH ALARM SOUNDS
This indicates that the sample (or some part of the sample holder or stage)
has contacted the touch sensor on the bottom of the collection optics. DO
NOT MOVE THE STAGE ANY HIGHER otherwise permanent damage may
be caused to the collection optics. Move the stage down - if the sample
has caused alarm to sound, it is approximately 0.5 mm above the analytical
WD.
The analytical WD has now been set, now the region of interest on the
sample to be analysed needs to be moved to the analytical position, this is
described in the section that follows.
3.5.2. Moving the sample to the analysis position
The SCA projects a small laser spot to a precise position in X, Y, and Z in
the SEM chamber. This position can be restored repeatedly when the SCA
optic transfer tube is inserted into the beam path.
Unlike EDS analysis, however, the Raman analytical position (where the
laser spot is incident on the sample) cannot be moved with respect to the
image. The sample has to be physically moved using the X, Y, and Z
controls of the SEM stage so that the region of interest is bought to the
Raman analytical position. How the Raman analytical position is indicated
on the SEM image depends on the type of SEM to which the SCA is fitted,
SEM-specific details are given in Appendix B.
For any SEM, however, it is important to note that the SEM image can
move for a number of reasons. In particular the image position is sensitive
to probe current and accelerating voltage; the SEM-specific implementation
may limit defining the Raman analytical position to a few specific
accelerating voltage/spot size (probe current) conditions.
According to the SCA specification, the Raman analytical position will be
within 15 micrometres of the electron optical axis (i.e. the centre of the SEM
image display provided no beam shift is present). This means that the
Raman analytical position will appear to move as the magnification is
changed; unless this shift can be programmed into the SEM display, the
Structural and chemical analyser - user guide 35
SEM-specific implementation may limit defining the Raman analytical
position to a few magnifications. Both voltage/spot-size and magnification
limitations are detailed in Appendix B.
3.5.3. Setting spectrometer & SCA acquisition conditions
The software used to control the spectrometer is described in the
spectrometer User Guide and users should refer to that document to
determine how to set up the spectrometer for spectrum collection.
The software that controls the VCFOP (Video Compact Fibre Optic Probe)
is called VidProbe.exe and will be installed in the C:\Program
Files\Renishaw\WiRE 2.0\Tools directory. The program can either be
launched from within the WiRE™ program via the button shown below,
which is added to the spectrometer control software's toolbar, or it can run
as a standalone application on a separate, more convenient PC. For
example the SEM or EDS control computers.
Figure 25 - SCA control program button icon
When launched the program displays the dialog box shown below.
Figure 26 - SCA control program dialog box
If no video image is displayed when video mode is selected the camera
may not have been initialised; please refer to section 3.4.3 for details. The
probe control toolbar is shown in Figure 27, the camera control toolbar is
shown in Figure 28. Their operation is described below.
Camera control buttons
Probe control buttons
36
Mode selection White light
Figure 27 - Probe control toolbar
The mode selection buttons switch between Video and Spectroscopy
modes The slider control changes the illumination level by increasing the
power to the light source.
When selected, the Spectroscopy Mode button switches off the video
display and the white-light source, and moves a steering mirror so that full
laser power is directed onto the sample. When selected, the Video mode
button (shown "pressed" in Figure 27) automatically switches on the white-
light source, and activates the video in Windows™ display.
Auto exposure toggle Shutter speed Gain
Figure 28 - camera control toolbar
Depending on the sample and the laser, it may be necessary to alter the
camera settings for the white-light video display. This can be carried out
using the controls shown in Figure 28 (Auto exposure needs to be disabled
before the shutter speed or gain can be adjusted).
The Auto exposure toggle switches the automatic shutter and gain control
off and on – typically Auto mode is used when first setting the analytical
working distance (see section 3.5.1 for details).
As the shutter speed is increased (moving the cursor to the right), the
image will tend to become noisier and it will be harder to see faint objects.
As the gain is increased (moving the cursor to the right) then the image will
become noisier, but faint objects will become easier to see.
In order to see the white light image and the laser spot at the same time,
it is usually necessary to have a fairly high level of white light illumination
(see the description of Figure 27 above), and to attenuate the laser (see
section 3.4.2 for details).
Structural and chemical analyser - user guide 37
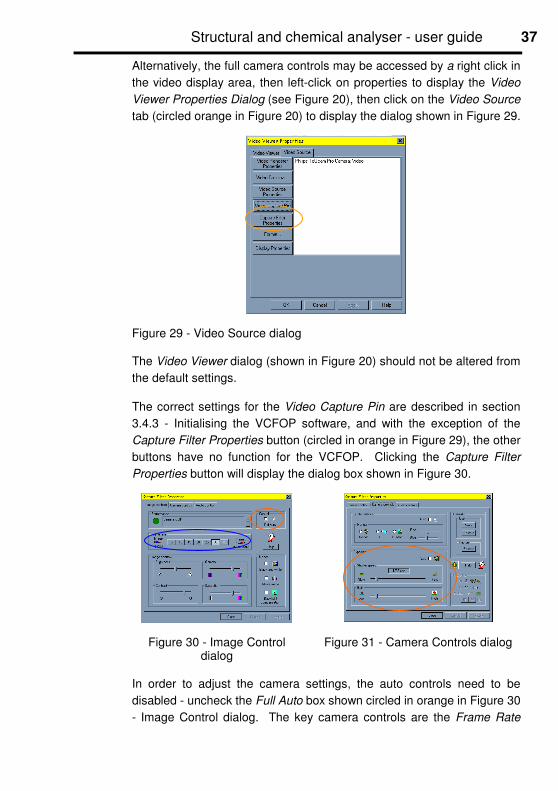
Alternatively, the full camera controls may be accessed by a right click in
the video display area, then left-click on properties to display the Video
Viewer Properties Dialog (see Figure 20), then click on the Video Source
tab (circled orange in Figure 20) to display the dialog shown in Figure 29.
Figure 29 - Video Source dialog
The Video Viewer dialog (shown in Figure 20) should not be altered from
the default settings.
The correct settings for the Video Capture Pin are described in section
3.4.3 - Initialising the VCFOP software, and with the exception of the
Capture Filter Properties button (circled in orange in Figure 29), the other
buttons have no function for the VCFOP. Clicking the Capture Filter
Properties button will display the dialog box shown in Figure 30.
Figure 30 - Image Controldialog
Figure 31 - Camera Controls dialog
In order to adjust the camera settings, the auto controls need to be
disabled - uncheck the Full Auto box shown circled in orange in Figure 30
- Image Control dialog. The key camera controls are the Frame Rate

38
adjusted by the buttons circled in blue in Figure 30 - Image Control dialog,
which principally affects the real-time response rate of the camera, and the
Gain (signal to noise). Faster frame rates will yield a better real-time
response, but poorer signal to noise and sometimes a less intense image
(which is desirable if the aim of setting the controls manually is to reduce
the spot intensity for example).
The other key control is the Exposure, the controls for which are circled in
orange in Figure 31 - Camera Controls dialog. Firstly disable the Auto
settings by un-checking the box to enable the Shutter Speed and Gain to
be adjusted. Setting a faster Shutter Speed will reduce the image
brightness, but will also decrease the signal to noise, the Gain may have
to be increased to compensate for reduced brightness, but this will also
tend increase the noise. Setting a slower Frame Rate (see above) will
improve the signal to noise.
Any adjustments made to the Camera Controls will be maintained unless
the PC is switched off, in which case the software will need to be re-
initialised (see section 3.4.3) and the custom Camera Controls reset
manually.
3.6. Changing Laser wavelengths
The SCA supports single or dual laser wavelengths (e.g. 514 nm or 532 nm
and 785 nm) or dual techniques (i.e. Raman/PL and CL – UV or VIS). With
Renishaw’s inVia spectrometers and SEM-SCA changing laser
wavelengths is very straightforward due to extensive automation. Changing
between analytical techniques involves a little more user intervention and
is described in sections 3.7 and 3.8 below.
3.6.1. Spectrometer set-up
For inVia spectrometers the default conditions (e.g. slit widths, gratings
etc.) for the techniques supported will have been set-up during installation
of the hardware and WiRE 2.0 software. Technique selection is made
using the drop down toolbar in the sample review dialog box (see Figure
14). It is possible that changing from one wavelength to another will require
changing the lens set in the spectrometer – if this is required a prompt
describing the changes needed will be displayed by the WiRE 2.0 software
(see also the electronic WiRE 2.0 User Guide for further information).

Structural and chemical analyser - user guide 39
To switch between standalone and SCA operation of the inVia
spectrometer, the steering mirrors on the rear arm need to be moved to the
appropriate positions as indicated in Figure 32.
Figure 32 - inVia rear arm showing position of steering mirrors
3.6.2. SCA set-up
For dual Raman systems (VIS/NIR) no physical adjustments are necessary
to switch wavelengths (changing the steering mirrors on the inVia rear arm
effectively sets up the SCA – see section 3.6.1 for details)
The Vidprobe.exe program, running either as part of the WiRE 2.0
software, or as a standalone application – is used to switch between white
light imaging and spectroscopy modes as described in section 3.5.3.
3.7. Set-up for VIS/UV-CL and PL spectroscopy
For SCA systems that provide Raman spectroscopy as well as
cathodoluminescence (CL - either VIS or UV) and photoluminescence (PL),
both the SCA and inVia will have been modified to optimise performance.
CL and PL require that the SCA has a VIS or UV CL CSMCFOP (confocal
single mode compact fibre optic probe) fitted.
VIS SCA position
VIS inVia positionNIR inVia position
NIR SCA position

40
3.7.1. Spectrometer set-up
Technique selection is made using the drop down toolbar in the sample
review dialog box (see Figure 14). It is possible that changing from one
technique to another will require changing the lens set in the spectrometer
– if this is required a prompt describing the changes needed will be
displayed by the WiRE 2.0 software (see also the WiRE 2.0 User Guide for
further information).
To provide an excitation source for PL excitation, the Raman source (VIS
or NIR laser needs to be selected for SCA operation on the rear arm of the
inVia spectrometer.
3.7.2. SCA set-up
SCA systems supporting CL/PL have a three-position technique selection
mechanism that is adjustable without having to remove the SCA covers -
the externally visible parts of mechanism are shown in Figure 33. The
mechanism is adjusted simply by moving the Raman/PL-CL technique
selection rod to either the CL or Raman/PL positions. With the technique
selection rod in the CL position, then the Raman-PL selection handle may
be pulled and rotated to either the PL or Raman positions. The technique
selection rod should only be moved using the “mushroom knob,” take care
that the rod is properly engaged in the Raman-PL position.
IMPORTANT - The Raman-PL selection handle must only be “pulled
and rotated” when the technique selection rod is in the CL position
Ensure the Raman-PL selection handle engages properly in its kinematic
mount before returning the technique selection rod to the Raman/PL-CL
position.

Structural and chemical analyser - user guide 41
Figure 33 - The three-position technique selection mechanism
When the technique selection mechanism is in the “Raman” position the
system is configured for full power laser excitation and optimised for
Raman spectroscopy.
When the technique selection mechanism is in the “PL” position the system
is configured for up to half full-power laser excitation, and data collection
using the CL probe (which has no Rayleigh filters fitted). It may be
necessary to attenuate the laser (see section 3.4.2) to avoid oversaturating
the Renishaw CCD detector.
When the technique selection mechanism is in the “CL” position the system
is configured for CL data collection using the CL probe (which has no
Rayleigh filters fitted) – no laser light is incident on the sample.
IMPORTANT – There is some leakage of laser light within the Video-Probe
so the laser should be fully blanked using the ND filters (see section 3.4.2)
to avoid seeing emissions from the laser.
3.8. Procedure for VIS/UV-CL mapping
For CL mapping the Renishaw inVia system uses an auxiliary
photomultiplier-type detector, this type of detector is particularly sensitive
to low light levels, can handle a wide dynamic range of signal input, and
Slide “mushroom knob” to selectbetween Raman/PL and CL
“Pull and rotate” selection handleto switch between PL and Raman

42
reacts quickly to changes in signal input level. The auxiliary detector is
fitted to the inVia CCD arm using a kinematic location system.
3.8.1. Spectrometer set-up
It is advisable to collect a CL spectrum before starting CL imaging (see
section 3.7), this will allow the position(s) of the characteristic CL peak(s)
to be determined.
The principle of CL mapping is to set the spectrometer to collect light only
from a particular wavelength, and then to scan the electron beam over the
sample, collecting and displaying the CL signal intensity in synchronism
with the scanning. With the Renishaw system, the scanning is controlled
by specialist software, which controls the position of the electron beam, the
positioning of the grating, and collection of the auxiliary detector output.
To collect the CL signal an auxiliary detector needs to be placed in position.
Figure 34 shows the CCD arm (on the right hand side of the spectrometer)
with its light-tight cover in position. This cover should be removed, and the
auxiliary detector put in its place, making sure that the micrometer head is
positioned towards the main body of the spectrometer (as shown in Figure
35). The detector assembly engages kinematically thereby ensuring the slit
and detector alignment is precisely maintained. Finger-tighten the locking
screws front (shown in Figure 35) and rear – these are to prevent
accidental exposure of the photomultiplier to room lights. Once the
detector is in place and the lock-screws tightened, it is safe to connect the
detector to the power supply. The other connections to the Raman PC will
have already been set up during installation.
Figure 34 – CCD arm - detector cover inposition
Figure 35 – CCD arm - auxiliarydetector in position (lock-screw circled

Structural and chemical analyser - user guide 43
in red)
3.8.2. SCA set-up
The three-position technique selection mechanism (see Figure 33) should
be set to the “CL” position (see section 3.7.2 for details) the system relies
upon the SEM electron beam to generate photons, and the CL probe -
which has no Rayleigh filters fitted - collects these. It may be necessary to
reduce the SEM probe current to avoid oversaturating the Renishaw CCD
detector.
3.8.3. SEM and MICA software set-up
Generally speaking, when initially setting up for CL imaging, it is preferable
to use high SEM probe-currents to ensure a high count-rate this will make
it easier to confirm that the CL imaging is working correctly. Once this has
been established, the SEM probe-current can be reduced to reduce the
spot size (and hence spatial resolution). Adjusting the SEM accelerating
voltage will change the CL sampling depth.
The SEM scanning control, grating position set-up, and photomultiplier
detector output collection are controlled by the MICA software application.
Clicking on the desktop icon launches the software.
After the start-up page, the main MICA dialog box is displayed. Click on the
Help menu to display detailed help for the MICA program. Click on the
Conditions menu item, and then select Imaging/Mapping to display the
dialog box shown below in Figure 36.

44
Figure 36 – The MICA imaging and mapping control dialog box
For CL imaging, the key parameters that need to be set are the grating
position (CL Spectrometer - Wavelength - see section 3.7 for details), the
Image size, and the Dwell Time per pixel – these are all set from within the
MICA imaging and mapping control dialog box.
The CL image size would normally be set either to 128x128 or 256x256
pixels although other sizes can be set.
The dwell time per pixel can be set from 1 ms to 100 ms the value selected
will alter the total acquisition time (which also depends on the image size).
Depending on the magnification of the image, the predicted SEM drift
should also be factored-in to the choice of dwell time (most SEMs drift
approximately 5 micrometres per hour).
Once the grating position, image size, and dwell time per pixel have been
set, then pressing the acquire button will collect the CL map. Once the
map has been collected, it should be saved as a .map file – this retains the
Structural and chemical analyser - user guide 45
16-bit data depth. The image is displayed using a Windows™ dialog box
and is restricted to an 8-bit greyscale viewer – the contrast and brightness
controls can change the visualisation of the 16-bit data but can seldom
reflect the true depth of information that is available in the 16-bit data. If the
data is saved as a bitmap (.bmp) then the 16-bit information is lost.
It is also possible to save the images in .raw format – this stores the data
as an array of 16-bit words with two words as header defining the image
width and height in pixels. These .raw files can be visualised using more
sophisticated third-party image processing programs.
46
4. Calibration
This section of the User Guide is concerned with calibration of the SCA
system. The system "health check" provides a rapid means of determining
whether the system is behaving normally, or whether a service or
maintenance visit is required. Setting the analytical WD should only be
necessary infrequently - the Renishaw retraction mechanism will not alter
with time, but it may be necessary to set up new objective lens DAC values
for alternative accelerating voltage and probe current settings. The
requirement to set the analytical position will depend on the level of
accuracy required in Raman analysis. The Renishaw collection optics will
not change position with time, but the SEM may "drift" on an hourly and
daily basis - this drift is likely to be micrometre-order, so depending upon
the analytical precision required, this will determine the calibration regime.
4.1. Silicon signal check (system "health check")
The easiest way to carry out a "health check" of the SCA is to collect a
spectrum from a clean silicon sample. For inVia spectrometers, the slits
will be set to the default value of 70 micrometres (see the Spectrometer
User Guide for further information), and the default grating will be set up.
The installation report supplied when the SCA was originally fitted will have
recorded the performance on silicon, this should be used as a reference.
Put a clean silicon sample in the SEM (use the sample holder insert for
example) and optimise the laser spot using the direct method (see section
3.5.1 for details). Check that the SCA shutter is open, and that the laser is
running at full power and that the beam is not attenuated (see section 3.4.2
for details), then use the WiRE™ software to set up a 10-second static
scan centred at 520 cm-1
. Collect a spectrum, and measure the silicon
peak intensity. The silicon peak intensity should not vary over time by more
than ±10% (with respect to the value measured at installation) - if it does,
then contact the local Renishaw service centre for advice.
4.2. Setting the analytical WD
The Renishaw collection optics are designed so that their position in space
(X, Y, Z) will not change with time. SEMs, however, will "drift" with time,
Structural and chemical analyser - user guide 47
some drift is mechanical, some is electrical, and some is attributable to the
sample, these variations need to be accommodated in order that the
analytical WD matches the optimum focus of the SCA optics.
SEMs typically have two methods of measuring the working distance, a Z-
sensor on the sample stage, and a Z value calculated from the objective
lens excitation for a given accelerating voltage. For Raman spectroscopy,
the stage Z-sensor is too inaccurate, especially because it assumes that
the top of the sample is exactly level with the top of the sample holder and
this may not be the case.
There are also issues where the Z value is calculated from the objective
lens excitation. The Z value needs to be calculated as a function of
accelerating voltage (higher voltages need higher lens excitation to
maintain the same effective focal length), and this calculation normally uses
a look-up table based on typical column performance. Secondly,
electromagnetic lenses can become slightly magnetised resulting in
hysteresis in the normally linear excitation versus magnetic flux
relationship, and this affects the actual focal length for a given excitation.
All SEMs, however, provide a lens clear function for removing hysteresis.
These considerations mean that it is difficult to calculate the effective focal
length of the SEM objective lens (i.e. the working distance) to much better
than 100 micrometres. A calculated WD therefore, will only set the effective
focal length close to the analytical WD required for the SCA.
If the SEM provides the means to read the DAC (digital to analogue
converter) settings that actually control the lens excitation, however, these
values can be used to set accurately the focal length (WD) of the objective
lens to the analytical WD. It must be emphasised, however, that the DAC
settings are specific to a particular accelerating voltage, and that the
objective lens must not be hysteretic (i.e. the lens clear function needs to
have been activated). If the functions mentioned above are not applicable
to the SEM to which the SCA is fitted (see also Appendix B for details), then
the analytical WD must be set using the direct method, which is described
in detail in section 3.5.1. Use the silicon sample attached to the SCA
sample holder provided by Renishaw to determine accurately the analytical
WD and then without altering the focus of the SEM use the stage Z control
to focus the region of interest on the sample to be analysed.
48
4.3. Setting the analytical position
For the Renishaw SCA the analytical position remains effectively invariant
- the design ensures that the positioning in space of the collection optics is
reproducible to sub-micrometre accuracy. The SEM image, however, may
move with time depending on the stability of the SEM electronics, the stage,
and the sample. Furthermore, depending on the accuracy of the electron
optical column, the image may shift when either the accelerating voltage or
probe size are adjusted.
For W and LaB6 instruments when the filament is changed, and as a new
filament conditions for the first few hours of use, the absolute position of the
SEM image gradually changes. Consequently the SEM image position with
respect to an absolute position in space (as established by Renishaw’s
collection optics) can alter by tens of micrometres from a previously
established position.
For these reasons the analytical position - specifically, where the laser spot
hits the sample with respect to the SEM image - needs to be set up and
reviewed at appropriate intervals. There are two methods to determine the
analytical position - the direct and indirect methods.
The direct method is very straightforward, a feature visible in the white-light
image that can be unambiguously correlated with the SEM image (for
example the integrated circuit on the sample insert) is positioned under the
laser spot (visible in the white-light image). Where the area illuminated by
the laser on the feature appears in the SEM image, is where the analytical
position is located. The limitations of this method are that the white-light
image has only approximately 2 micrometres resolution, and that many
samples do not have sufficient contrast or small enough visible features in
the white-light image to allow correlation with the SEM image.
When the direct method cannot be employed, the indirect method must be
used. The indirect method requires a discontinuity (typically a silicon
cleaved edge, or a feature on the integrated circuit on the sample insert)
across which the laser spot can be moved using the SEM X/Y stage to
observe when the spot is extinguished in the white-light image. The
position at which the spot disappears is then be correlated with the position
of the edge on the SEM image. The procedure for the indirect method is
shown by the flowchart in Figure 37.

Structural and chemical analyser - user guide 49
Figure 37 - Flowchart showing indirect positioning of laser spot
1. Set to the SCA to white light imaging - use the SCA control program
(see section 3.5.3) to select video mode for the SCA.
2. Set the SEM magnification to x1000 - this is the default magnification
for setting the laser spot position. Other magnifications can be
selected, but the chosen value must somehow be indicated on the
SEM image
3. Minimise the laser spot intensity by adjusting the Video Viewer controls
(see section 3.5.3) and/or the laser attenuation controls (section 3.4.2)
4. Move the silicon edge using the SEM X or Y control until the white light
image of the spot disappears [this implies that the laser spot is falling
on the silicon sample at the beginning of the procedure]. Note that
SEM stages typically have 1 micrometre to 2 micrometres backlash,
so it is important that the X or Y movement is carried out from one
direction only, having taken-up any backlash. Note also that motorised
stages may have smaller software steps than hardware steps, and this
will affect the precision to which the laser spot position may be set.
Indicate the silicon edge position on the SEM image when the laser
spot disappears from the white light image. Depending on the SEM
Set to white-light imaging1
Set SEM magnification to x10002
Move Si edge until spot disappears4
Minimise laser spot intensity3
Indicate edge position on SEM image5
Rotate sample 90º6
50
implementation (see Appendix B) this may involve defining a graphic
overlay file, or devising a hardware implementation to indicate the laser
spot position
5. After setting the laser spot position in one axis, the sample should be
rotated through 90º to set the laser spot position on the perpendicular
axis using steps 4 & 5 above
The frequency with which the laser spot position needs to be reviewed
depends principally upon the precision to which the spot position needs to
be known in order to analyse with confidence the regions of interest on a
sample. As has been explained above, whilst the positioning of the SCA
collection optics is effectively invariant, the position of the SEM image can
vary with respect to the absolute position of the sample.
If the effects of stage, electronics, thermal, and sample drift are ignored (a
fair assumption for a SEM that has been allowed to warm up sufficiently,
and has securely-attached samples), then the main factors that influence
the SEM image position are gun alignment, and spot size and accelerating
voltage. Although individual SEMs vary, in general the image shift caused
by changing accelerating voltage is typically 2 micrometres to 5
micrometres, and the same for changing spot size [these parameters are
typically additive]. For gun alignment [filament tilt and shift adjustment] the
figures can be up to two orders of magnitude higher.
Another critical consideration is the objective lens aperture alignment, and
correction of lens hysteresis. If the aperture is not correctly aligned, or if
hysteresis is not corrected, then SEM image shifts of tens of micrometres
are possible - it is imperative that these parameters are correctly set, but
once they are set, then their influence on the image position can be
disregarded.
Given the above, then the analytical position should be reviewed as follows:
If micrometre order analytical spatial resolution is required, then the
position of the laser spot must be determined for the exact SEM
conditions used to image the sample - specifically accelerating
voltage, spot size, and gun alignment. It is also essential that the
sample is securely mounted and is not charging, and that the SEM
is fully temperature stabilised, and that the filament has not recently
been changed.

Structural and chemical analyser - user guide 51
If 3 micrometres to 5 micrometres order analytical spatial resolution
is required, then the position of the laser spot needs to be
determined at the beginning of the analytical session. Changing
the spot size and accelerating voltage should not result in the
indicated SEM image position differing from the analytical position
by more than the required positional accuracy. If the filament is
new, however, or if the gun alignment is changed, then the system
will need to be recalibrated. If the sample is not securely attached
to the sample holder, or if the sample is charging, then the
positional accuracy may not be sufficient after approximately 10
minutes. It remains important that the objective lens aperture is
correctly centred, and that lens hysteresis has been removed.
If 5 micrometres to 10 micrometres order analytical spatial
resolution is required, then the position of the laser spot from the
last analytical session can be used provided neither the filament
nor the gun alignment have been changed. It remains important
that the objective lens aperture is correctly centred, and that lens
hysteresis has been removed.
If greater than 10 micrometres order analytical spatial resolution is
required, then the position of the laser spot from the last analytical
session can be used provided neither the filament nor the gun
alignment have been changed.
If the filament is changed, and if it is known that the filament drifts for the
first few hours of its life, then re-calibration of the analytical spot position
must be carried out regularly until the filament (and hence the SEM image)
has stopped drifting.
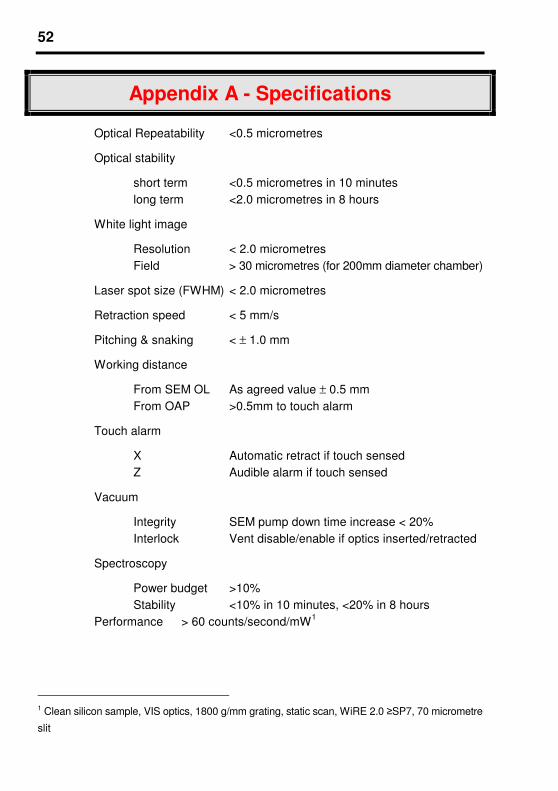
52
Appendix A - Specifications
Optical Repeatability <0.5 micrometres
Optical stability
short term <0.5 micrometres in 10 minutes
long term <2.0 micrometres in 8 hours
White light image
Resolution < 2.0 micrometres
Field > 30 micrometres (for 200mm diameter chamber)
Laser spot size (FWHM) < 2.0 micrometres
Retraction speed < 5 mm/s
Pitching & snaking < ± 1.0 mm
Working distance
From SEM OL As agreed value ± 0.5 mm
From OAP >0.5mm to touch alarm
Touch alarm
X Automatic retract if touch sensed
Z Audible alarm if touch sensed
Vacuum
Integrity SEM pump down time increase < 20%
Interlock Vent disable/enable if optics inserted/retracted
Spectroscopy
Power budget >10%
Stability <10% in 10 minutes, <20% in 8 hours
Performance > 60 counts/second/mW1
1 Clean silicon sample, VIS optics, 1800 g/mm grating, static scan, WiRE 2.0 ≥SP7, 70 micrometre
slit
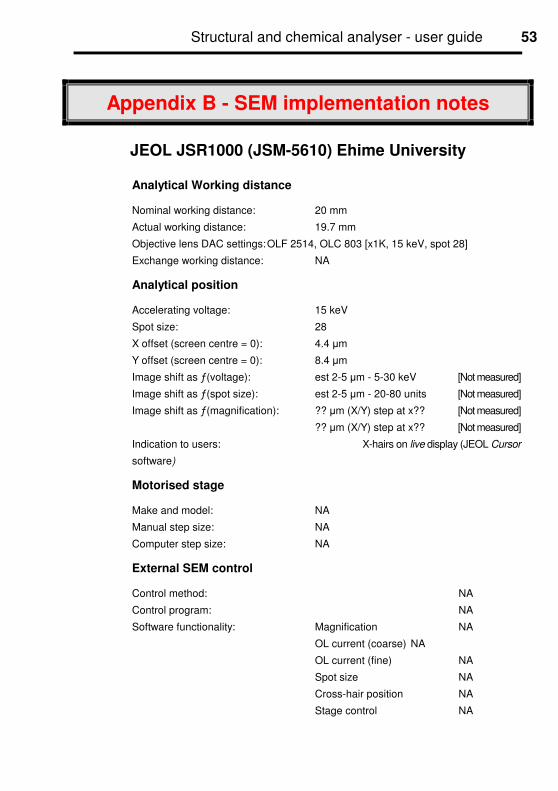
Structural and chemical analyser - user guide 53
Appendix B - SEM implementation notes
JEOL JSR1000 (JSM-5610) Ehime University
Analytical Working distance
Nominal working distance: 20 mm
Actual working distance: 19.7 mm
Objective lens DAC settings:OLF 2514, OLC 803 [x1K, 15 keV, spot 28]
Exchange working distance: NA
Analytical position
Accelerating voltage: 15 keV
Spot size: 28
X offset (screen centre = 0): 4.4 µm
Y offset (screen centre = 0): 8.4 µm
Image shift as ƒ(voltage): est 2-5 µm - 5-30 keV [Not measured]
Image shift as ƒ(spot size): est 2-5 µm - 20-80 units [Not measured]
Image shift as ƒ(magnification): ?? µm (X/Y) step at x?? [Not measured]
?? µm (X/Y) step at x?? [Not measured]
Indication to users: X-hairs on live display (JEOL Cursor
software)
Motorised stage
Make and model: NA
Manual step size: NA
Computer step size: NA
External SEM control
Control method: NA
Control program: NA
Software functionality: Magnification NA
OL current (coarse) NA
OL current (fine) NA
Spot size NA
Cross-hair position NA
Stage control NA
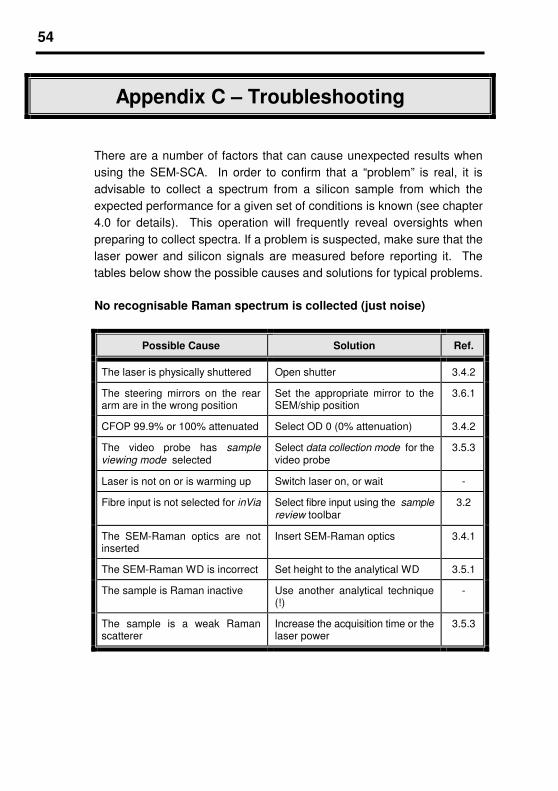
54
Appendix C – Troubleshooting
There are a number of factors that can cause unexpected results when
using the SEM-SCA. In order to confirm that a “problem” is real, it is
advisable to collect a spectrum from a silicon sample from which the
expected performance for a given set of conditions is known (see chapter
4.0 for details). This operation will frequently reveal oversights when
preparing to collect spectra. If a problem is suspected, make sure that the
laser power and silicon signals are measured before reporting it. The
tables below show the possible causes and solutions for typical problems.
No recognisable Raman spectrum is collected (just noise)
Possible Cause Solution Ref.
The laser is physically shuttered Open shutter 3.4.2
The steering mirrors on the reararm are in the wrong position
Set the appropriate mirror to theSEM/ship position
3.6.1
CFOP 99.9% or 100% attenuated Select OD 0 (0% attenuation) 3.4.2
The video probe has sampleviewing mode selected
Select data collection mode for thevideo probe
3.5.3
Laser is not on or is warming up Switch laser on, or wait -
Fibre input is not selected for inVia Select fibre input using the samplereview toolbar
3.2
The SEM-Raman optics are notinserted
Insert SEM-Raman optics 3.4.1
The SEM-Raman WD is incorrect Set height to the analytical WD 3.5.1
The sample is Raman inactive Use another analytical technique(!)
-
The sample is a weak Ramanscatterer
Increase the acquisition time or thelaser power
3.5.3

Structural and chemical analyser - user guide 55
The Raman signal levels are very low
Possible Cause Solution Ref.
The SEM-Raman WD is incorrect Set to analytical WD 3.5.1
CFOP 99% or 99.9% attenuated Select OD 0 (0% attenuation) 3.4.2
The laser power is low Measure the laser power and thesignal strength from silicon
4.1
The single mode launch hasmoved
Measure the laser power and thesignal strength from silicon
4.1
The single mode fibre is damaged Measure the laser power and thesignal strength from silicon
4.1
The sample is a poor Ramanscatterer
Increase the acquisition time or thelaser power, or use anotheranalytical technique
3.5.3
The Raman signals are very high
Possible Cause Solution Ref.
The sample is fluorescing Select another laser wavelength ortry quenching
3.6
The laser power is too high Select a higher degree of laserattenuation
3.4.2
The sample is being burned(incandescence)
Select a higher degree of laserattenuation
3.4.2
Stray light is being detected Switch off all in-SEM light sources -
Cathodoluminescence from thesample is being detected
Switch off the electron beam -

56
Various mechanical and electrical problems
Possible Cause Solution Ref.
The power light on the SEM-SCAis not illuminated
Check all cables are connectedand switch on the SCA
2.2.1
The collection optics will not insert Check the vacuum interlock cableis connected, and make sure SEMis pumped-down
-
The touch alarm sounds and theSEM-SCA collection optics will notinsert
The SEM stage is too high! Dropthe stage and retract the collectionoptics to the OUT position to reset
3.4.1
All indicators on the SCA statuspanel are flashing
The SCA is in manual mode,switch the power off and back onagain to reset the SCA
2.2.1
The video probe will not switchbetween sample viewing mode anddata collection mode
The video probe communicationshave failed – check all [USB]cables are connected, reboot thePC with the SCA connected andswitched on, re-run the VideoP.exeprogram
-
No white light image is visible insample viewing mode
The SCA camera is not initialised –re-run the initialisation procedure
3.4.3
No white light image is visible insample viewing mode
The intensity of the WL LED is toolow, turn the intensity up or theshutter speed or gain are too low,set to auto, or adjust manually
3.5.3
No laser spot is visible in the white light image
Possible Cause Solution Ref.
The video probe is set in datacollection mode
Select sample viewing mode onvideo probe
3.5.3
The laser is highly attenuated Reduce the laser attenuation 3.4.2
Laser not on or warming up Switch laser on or wait -
The laser is physically shuttered Open the laser shutter 3.4.2

Structural and chemical analyser - user guide 57
Appendix D – Weights and dimensions


![Home []...ASS. PROVVISORIE a.s. 19-20 triennio vigenza 19-22 ( Firmato) 12 MB.pdf Si invia la nota prot. n. 22651 del 21/06/2019, inerente l'oggetto, unitamente ai relativi allegati.](https://static.fdocuments.us/doc/165x107/6091611f72d59c3ca10d6484/home-ass-provvisorie-as-19-20-triennio-vigenza-19-22-firmato-12-mbpdf.jpg)