SBAB Annual Report 2012 - Cisionmb.cision.com/Main/462/9392140/107215.pdf · SBAB Annual Report...
94
Annual Report 2012 SBAB Bank AB (publ)
-
Upload
truongdiep -
Category
Documents
-
view
213 -
download
0
Transcript of SBAB Annual Report 2012 - Cisionmb.cision.com/Main/462/9392140/107215.pdf · SBAB Annual Report...

Annual Report 2012
SBAB Bank AB (publ)

II Business overview
SBAB Annual Report 2012
Business OverviewSBAB in brief II2012 in brief 1CEO’s review 2Vision and strategy 4
Administration Report 5Organisation 5Lending 6Savings 9Funding 10Sustainable development 12Risk management 15Results 18Five-year overview 21Proposed appropriation of profits 77Audit report 78
Financial Statements and Notes 22
Corporate Governance Report 79
This is a translation of the Swedish annual report. The translation has not been signed for approval by the auditor.
SBAB in brief
SBAB Bank AB (publ), “SBAB”, was established in 1985 and is wholly owned by the Swedish state. Early, SBAB began challenging conventions, first as a residential mortgage institution and later as a bank.
SBAB’s business concept is to provide a new banking experience to consumers in Sweden by treating every customer as unique and being the bank that is easiest to access and understand. The products are divided into three areas: Lending, Savings and Payments. The Lending area offers residential mortgages, loans to tenant-owner asso-ciations and retail loans. The Savings area offers savings accounts and a mutual-savings service will be launched in 2013.
Services in the Payments area will be launched in 2014.In 2012, SBAB had approximately 413 employees, with offices in Karlstad, Stockholm, Gothenburg and Malmö.
VisionWe create a new era
in banking by providing the best
customer experience
Business conceptWe provide a new banking experience to consumers in Sweden by treating every
customer as unique and by being the bank that is easiest to access
and understand
RootsWe challenged conventions
and stood on the side of the people
PassionHave courage
and dare to do things differently
ValuesSimple
Customer drivenBold
Read more at sbab.se
SBAB launches operations with 4 employees
1985 1989 1991 1992 1996 1998 2002
Established in the credit markets of London and Tokyo
Entitled to provide loans secured by first mortgage, in competition with other mortgage lenders
Office in Karlstad opens for customer service and administration of loans
Residential mortgages to private individuals
Loan applications by internet
SBAB has the most satisfied customers according to SQI
Contents

1Business overview
SBAB Annual Report 2012
2012 in brief
• SBAB’s operating profit for 2012 amounted to SEK 503 million (464)
• Net interest income amounted to SEK 1,941 million (1,618)
• Expenses totalled SEK 725 million (707)
• The year was characterised by stable lending volumes
• Loan losses remained at low levels
• Deposits increased sharply, due to attractive savings-account products
• Favourable demand in all active funding markets
• Carl-Viggo Östlund assumed the position of CEO on 1 March 2012
• Permission was obtained to conduct securities operations – mutual-fund services will be launched in March 2013
• A decision was made to ultimately phase out the Corporate business, with the aim of enabling a sharper focus on the consumer market.
• SBAB launched its vision to create a new era in banking by providing the best customer experience
summary sBAB Group
2012Jan–Dec
2011Jan–Dec %
inCoMe sTATeMenT iTeMs
Net interest income, SEK million 1,941 1,618 20
Loan losses, net, SEK million –20 –8 150
Operating profit, excl. net result of financial instruments, SEK million 1,104 813 36
Operating profit, SEK million 503 464 8
Net profit for the year, SEK million 363 341 6
BALAnCe sHeeT iTeMs
Lending, SEK billion 255.9 248.1 3
Doubtful loan receivables after individual provisions, SEK million 13 31 –59
Deposits, SEK billion 27.7 8.8 215
Funding, SEK billion 253.9 276.7 –9
KeY FiGures
Level of loan losses, % 1 0.01 0.00
Return on equity, % 4.2 4.2
Average number of employees 413 419
CAPiTAL ADeQuACY
without transitional rules
Core Tier 1 capital ratio, % 16.4 15.0
Tier 1 capital ratio, % 21.7 20.0
Capital adequacy ratio, % 27.4 23.9
with transitional regulations
Core Tier 1 capital ratio, % 6.9 6.7
Tier 1 capital ratio, % 9.1 8.9
Capital adequacy ratio, % 11.5 10.7
rATinG
sBAB
Long-term funding
–Standard & Poor’s 2 A A+
–Moody’s 3 A2 A2
Short-term funding
–Standard & Poor’s A-1 A-1
–Moody’s P-1 P-1
sCBC
Long-term funding
–Standard & Poor’s AAA AAA
–Moody’s Aaa Aaa
1) Loan losses in relation to opening balance for lending to the public.2) Standard & Poor¹s Credit Market Services Europe Limited.3) Moody’s Investors Service Limited.
2003 2004 2005 2006 2007 2011 2012
Interest rates for tenant-owner rights lowered to the same level as for single-family dwellings
Online automated loan promises
Final mortgage loans abolished
First in Sweden to issue covered bonds
Launch of savings accounts for pri-vate individuals
Permission to conduct banking operations
Clarify vision to create a new era in banking by providing the best customer experience
➔

2 Business overview
SBAB Annual Report 2012
A new era in banking. On 1 March, I began my new job as CEO of SBAB. I was greeted by a brand with substantial effectiveness and employees who were highly competent in their field, but most of all, the opportunity to create a challenger to the Swedish banking oligopoly. In 2012, we rolled out a clarified strategy with a clearly defined vision: To create a new era in banking by providing the best customer experience.

3Business overview
SBAB Annual Report 2012
Banking sector in centre of attentionThe banking sector has a big challenge ahead. The statistics and surveys are clear in their message: customer satisfaction is at low levels, loyalty is dimin-ishing and more customers than ever want to switch to other banks. It is no accident that the sector is facing critical news headlines and demands for change. Customers have provided us with a clear checklist for areas of improvement, such as: corporate responsibility, value-for-money services, interest-rate margins, advisory services, customer treatment, commitment, bonuses and dividends. Purely from the standpoint of self-pres-ervation, the industry should highlight, discuss and change itself on these points.
Stricter requirements must not impede customer experienceOne reason for the industry’s loss of focus on the cus-tomer could be the new, stricter regulations that have come into effect following the many financial problems of recent years. However, this is a reality to which we must adapt, since the financial sector has been part of the situation. It should go without saying that the new regulations created to protect consumers do not turn into something that makes a truly positive customer experience impossible.
A new era in bankingIn 2012, SBAB rolled out a clarified strategy with a clearly defined vision: to create a new era in banking by providing the best customer experience. This is a challenging objective that we will achieve by placing the customer first. We will endeavour to set a new standard in service and customer relations by treating
every customer as unique and by being the bank that is easiest to access and understand. We will be offering a small selection of simple products in three areas – Lending, Savings and Payments – which will enable cus-tomers to have SBAB as their everyday bank. Lending is already in place, featuring residential mortgages and retail loans online and by telephone, as well as loans to tenant-owner associations. Savings will be finalised in 2013 and will feature an attractive mutual-fund offering, in addition to the already existing savings accounts. In 2014, Payments in the form of salary-account and card solutions will be offered. Our role as a challenger runs like a central theme throughout our history. Early on, SBAB challenged conventions and stood on the side of the people. Our challenging spirit has resulted in both customer satisfaction and stressed competitors. In terms of residential mortgages, we are ranked highly – in 2012, we were Number One among tenant-owner asso-ciations and Number Two among private customers, ac-cording to the Swedish Quality Index annual survey on savings and loans. This is proof that with clearly defined and simple products, we can truly shake up and make a difference in an otherwise so uniform market. With our roots in mind and with an intense customer focus, the next few years will be the most overwhelming period in SBAB’s development to date. Our sights are clearly set on achieving the vision: to create a new era in banking by providing the best customer experience.
Stockholm, March 2013
Carl-Viggo ÖstlundCEO

AdministrAtion report4 Business overview
SBAB Annual Report 2012
Vision and strategy
SBAB’s vision is to create a new era in banking by providing the best customer experience.
Business conceptSBAB provides a new banking experience to consum-ers in Sweden by treating every customer as unique, and by being the bank that is easiest to access and understand.
Roots, values and passionThe key to achieving our vision lies in SBAB’s roots, val-ues and passion. The company’s roots are the starting point: SBAB challenged conventions and stood on the side of the people. These values put SBAB on the right track – to always be simple, customer driven and bold. Together with its passion to have courage and dare to do things differently, SBAB is providing the best custom-er experience and creating a new era in banking.
Products and servicesSBAB offers residential mortgages, loans to tenant- owner associations, retail loans and savings. With SBAB, customers can also insure both their loans and their homes, through loan insurance and home insurance. The Savings area offers savings accounts with customer-friendly terms and conditions: interest earned from the first krona saved, an unlimited number of withdrawals and most of all, cost-free withdrawals. The money deposited by customers is insured by the Swedish government’s guarantee on deposits.
ObjectivesSBAB’s overall business priority is profitable growth. The aims of SBAB’s profitability objective include fulfill-ing the return requirement established by the owner. This entails a return on equity (ROE) corresponding to the average yield on five-year government bonds plus
LoansResidential mortgages
Retail loans
Savings accountsSavings
a risk premium of 5 percentage points after tax over a business cycle.
To achieve profitable growth, strategies have also been established for:• Customer satisfaction• Product offering• Funding• Brand• Employee development• Corporate responsibility
In 2013, the Board of Directors in SBAB has decided to propose new financial objectives for the company to the General Meeting. For more information, refer to page 19.
In 2013, a fund offering will be launched
In 2014, the Payment area will be launched, with salary account and card services
PaymentsSalary account
Mutual funds
Card services

AdministrAtion report 5
SBAB Annual Report 2012
GroupSBAB began operating as a credit market company on 1 July 1985. In 2011, a decision was made empowering SBAB to begin conducting banking activities and in 2012, permission was obtained to conduct securities op-erations. SBAB is domiciled in Stockholm, Sweden, and comprises SBAB, the subsidiary, The Swedish Covered Bond Corporation “SCBC”, Corp. 556645-9755, and the partly owned company, FriSpar Bolån AB “FriSpar”, Corp. 556248-3338.
SCBCSCBC is a wholly owned credit market company and is consolidated in the SBAB Group. SCBC’s primary operations comprise the issuance of covered bonds in accordance with the Swedish Covered Bonds Issuance Act (2003:1223) and the Swedish Financial Supervisory Authority’s regulation FFFS 2004:11. Funding is conduct-ed in both Swedish and international capital markets. SCBC does not conduct any lending operations but acquires loans primarily from SBAB.
Organisation
sBAB Group
SBAB Bank AB (publ), Reg. 556253-7513, is an independent profit-making bank that is regulated by the Swedish Act on Banking and Financing Activities (2004:297) and the Securities Market Act (2007:528), and is subject to the supervision of the Swedish Financial Supervisory Authority. SBAB is a wholly state-owned public limited liability and joint-stock banking company.
SBAB Bank AB (publ)
The Swedish Covered Bond Corporation FriSpar Bolån AB
100% 51%
FriSparFriSpar is a jointly owned credit market company that primarily conducts operations in parts of southern Swe-den. SBAB has a 51% interest in FriSpar and the remain-ing shares in the company are owned by Sparbanken Öresund AB (publ) (39.2%) and, as of 3 November 2011, Sparbanken Syd (9.8%). FriSpar is consolidated in the SBAB Group in accordance with the proportional meth-od. Lending is conducted primarily to the retail market. Market development, credit rating and customer communication are conducted by Sparbanken Öresund AB (publ) and Sparbanken Syd. Funding and ongoing administration are handled by SBAB.

AdministrAtion report6
The lending portfolio presented on pages 6 to 8 in-cludes 100% of FriSpar’s lending portfolio. FriSpar is consolidated to 51% in SBAB’s financial statements, in accordance with the proportional method.
SBAB Annual Report 2012
Despite weaker growth in the residential mortgage market, SBAB’s new lending in-creased during 2012. SBAB’s new lending totalled SEK 38.0 billion (34.4). At year-end, SBAB’s total lending portfolio corresponded to SEK 256.6 billion (252.7), of which lending to retail customers accounted for SEK 163.0 billion (155.6), tenant-owner as-sociations for SEK 55.2 billion (53.3) and corporate customers SEK 38.4 billion (43.8).
Residential mortgagesretailThe retail market for residential mortgages increased during the year, but at a slower pace than in previous years. Growth in the market declined from 5.4% in 2011 to 4.6% in 2012. Prices for single-family dwellings and tenant-owner rights rose during the year.
Prices for single-family dwelling increased approx-imately 2% (decrease: 4) and prices for tenant-owner rights rose about 8% (decrease: 1)1 The retail market for residential mortgages was valued at SEK 2,223 billion (2,126)² at year-end.
SBAB’s new lending for residential mortgages in-creased during the year to SEK 28.8 billion (24.0). Most
of the new lending, SEK 18.8 billion (14.9), pertained to loans for home purchases.
The difference between the three-month interest rate and the fixed mortgage rates continued to narrow during the year. The percentage of customers with fixed mortgage rates rose. At year-end, of the customers who selected an interest period, 54% (56) opted for one to three months, 36% (32) for one to four years and 10% (12) for five to ten years.
During the year, demand for insight into the residen-tial-mortgage margins of banks was considerable. With the aim of providing increased transparency on the banking market, SBAB began to disclose openly on the Internet its funding costs and the manner in which prices for residential mortgages are constructed. Dur-ing 2012, SBAB made it easier for customers to change lenders by removing the interest-rate compensation charged on the repayment of three-month loans.
The portfolio of residential mortgages to retail cus-tomers increased SEK 7.1 billion (1.9) to SEK 162.3 billion (155.2) and SBAB’s market share for residential mortgag-es to retail customers totalled 7.3% (7.3) at year-end.2
Lending
SATISFIED RESIDENTIAL-MORTGAGE CuSTOMERS
sBAB continues to have sweden’s most satisfied customers in the tenant-owner association segment3
Customer satisfaction is rising sharply in the retail segment: sBAB currently has sweden’s second most satisfied retail mortgage customers³
1) Source: Svensk Mäklarstatistik AB2) The definition of the retail market for residential mortgages has changed compared with the preceding year. In 2011, the calculation of market share was based on the Swedish Bankers Association’s reported market volume. Since the Swedish Bankers Association has ceased to provide information on market volumes, market share is calculated on the basis of Statistic Sweden’s financial market statistics.3) According to the Swedish Quality Index survey, “Loans, Savings and Real Estate Agents 2012”.
0
20
40
60
80
100
201220112010
%
0
20
40
60
80
100%
Short-fixed interest periods
Fixed 1–4 years Fixed 5–10 years
Choice of fixed-interest period, lending of retail customer

AdministrAtion report 7
SBAB Annual Report 2012
Tenant-owner associationsThe growth rate in the market for lending to ten-ant-owner associations declined further in 2012. The lower growth rate was partly due to a decrease in the number of reorganisations from rental apartments to tenant-owned apartments in metropolitan areas. New production of tenant-owned apartments also declined in 2012. The market for lending to tenant-owner associa-tions totalled SEK 338 billion (329) at year-end.1
SBAB’s new lending to tenant-owner associations increased to SEK 6.3 billion (5.3). SBAB maintained a strong position in the market for reorganisations from rental apartments to tenant-owned apartments, which accounted for SEK 0.5 billion (1.0) of new lending.
New lending to newly formed tenant-owner associa-tions amounted to SEK 1.6 billion (1.5), while new lend-ing to existing customers and tenant-owner associa-tions that changed lenders totalled SEK 4.2 billion (2.8). The lending portfolio to tenant-owner associations
increased SEK 1.9 billion (decrease: 1.8) during the year to SEK 55.2 billion (53.3) at year-end. SBAB’s market share for lending to tenant-owner associations was 15.8% (15.8).
CorporateThe property market was characterised by relatively sta-ble property values and vacancy and rental levels dur-ing the year. However, transaction volumes were lower than in previous years, which was due in part to banks becoming more restrictive in their lending policies and in part to uncertainties in the economic climate.
In early 2012, SBAB made a decision to reduce and streamline its credit operations for companies, to facilitate a future divestment of this component. This has entailed limiting new lending to the most prioritised customers. New lending totalled SEK 2.3 billion (4.7) during the year. The focus of lending operations was to increase the profitability of the lending portfolio and to reduce lending.
This resulted in an overall decline in the lending port-folio by SEK 5.4 billion (decline: 0.8). SBAB’s lending to corporate customers, including municipalities, totalled SEK 38.4 billion (43.8) at year-end.
1) Source: SCB Statistic Sweden’s financial market statistics
0
100
50
150
200
300
300
201220112010
SEK billion %
Residential mortgage market, tenant-owner associations
SBAB Bank’s market share, tenant-owner associations
8
10
12
14
16
18
20
Trend in the residential mortgage market, tenant-owner associations
250
0
500
1,000
1,500
2,000
2,500
201220112010
SEK billion %
Residential mortgage market, retail
SBAB Bank’s market share, retail
6.0
6.5
7.0
7.5
8.0
8.5
Trend in the residential mortgage market, retail
Retail, 77%Corporate, 6%Tenant-owner associations, 17%
Distribution of new lending by borrower category

AdministrAtion report88
SBAB Annual Report 2012
Retail loansSince 2010, SBAB has been offering retail loans, meaning unsecured loans to households. In 2012, SBAB began extending retail loans to customers who are not residential mortgage customers. New lending of retail loans totalled SEK 0.6 billion (0.4).
At year-end, SBAB’s retail-loan portfolio amounted to SEK 0.7 billion (0.4).
Total lending portfolioSBAB’s total lending portfolio increased SEK 3.9 billion (decrease: 0.4) in 2012. The portfolio totalled SEK 256.6 billion (252.7) at year-end, corresponding to a share of 8.4% (8.4)¹ of the total residential mortgage market.
Lending to retail customers accounted for 62% (62)
of the total portfolio, corresponding to SEK 163.0 billion (155.6). The remaining portion comprised lending to corporate customers, including tenant-owner associa-tions, and amounted to SEK 93.6 billion (97.1).
The majority of the lending portfolio, 97% (96), comprised loans for financing residential properties. Lending for commercial properties amounted to SEK 7.1 billion (8.6) at year end, corresponding to 3% (3) of the lending portfolio. Retail loans, meaning unsecured loans to households, accounted for SEK 0.7 billion (0.4) or 0% (0) of the lending volume at year-end. The lend-ing portfolio is largely concentrated to metropolitan regions, with the Stockholm region accounting for 48% (48), the Öresund region for 24% (24) and the Gothen-burg region for 9% (9).
Distribution of the loan portfolio by property type
seK billion 2012-12-31 2011-12-31 Change
Single-family dwellings, incl. holiday homes 100.5 97.5 3.0
Tenant-owner rights 61.8 57.7 4.1
Tenant-owner associations 55.2 53.3 1.9
Private multi-family dwellings 26.5 29.1 –2.6
Municipal multi-family dwellings 4.8 6.1 –1.3
Commercial properties 7.1 8.6 –1.5
Retail loans* 0.7 0.4 0.3
Total 256.6 252.7 3.9
* Unsecured loans to households
Composition of collateral in the loan portfolio
seK billion 2012 2011 Förändring
Mortgage deeds 188.4 187.0 1.4
Tenant-owner rights 61.8 57.7 4.1
Municipal guarantees and direct loans to municipalities 4.7 6.2 –1.5
Government guarantees 0.5 0.6 –0.1
Bank guarantees 0.0 0.0 0.0
Other collateral 0.5 0.8 –0.3
Retail loans* 0.7 0.4 0.3
Total 256.6 252.7 3.9
* Unsecured loans to households
Geographical distribution of the loan portfolio
seK billion 2012 2011 Change
Stockholm region 125.8 121.2 4.6
Gothenburg region 23.1 22.5 0.6
Öresund region 61.9 60.8 1.1
University and growth regions 16.8 18.8 –2.0
Other regions 29.0 29.4 –0.4
Total 256.6 252.7 3.9
Retail, 64%Corporate, 15%Tenant-owner associations, 21%
Distribution of the loan portfolio by borrower category, 31 December 2012
1) Source: Statistic Sweden’s financial market statistics.

AdministrAtion report 99
SBAB Annual Report 2012
Savings
Interest in SBAB’s straightforward and competitive savings accounts increased sharply in 2012. Of the total volume of new deposits, 15% (2) was placed in SBAB’s savings accounts, making SBAB the market leader in new deposits in 2012. The deposit port-folio grew 215% (44) and amounted to SEK 27.7 billion (8.8) at year-end, of which deposits from retail customers accounted for SEK 22.5 billion (7.4) and deposits from corporate customers and tenant-owner associations for SEK 5.2 billion (1.4).
RetailTotal bank deposits from retail customers grew by SEK 95 billion (93) in 2012¹, corresponding to a growth rate of 8.5% (9.1). Total bank deposits from retail customers amounted to SEK 1,219 billion (1,123) at year-end.
SBAB’s deposits from retail customers increased by SEK 15.1 billion (2.6) in 2012. Accordingly, SBAB’s share of the total market growth was approximately 16% (ap-prox. 3). SBAB’s deposits from retail customers amount-ed to SEK 22.5 billion (7.4) at year-end, up 206% (53).
SBAB offers two competitive types of savings ac-counts for private individuals. The savings accounts are subject to no fees, offer free withdrawals and are easy to open and manage via sbab.se. The Savings Account (Sparkontot) carried an interest rate of 2.2% (3.00) as of December 31, 2012, and the SBAB Account (SBAB-kontot) for existing customers with residential mortgages carried an interest rate of 2.45% (3.25) as of 31 December 2011.
Corporate market and tenant-owner associationsThe total market for deposits from corporate custom-ers and tenant-owner associations increased in 2012. Deposits from corporate customers and tenant-owner associations totalled SEK 706 billion (671)² at year-end.
SBAB offers accounts at both floating interest rates and for fixed-term deposits for corporate customers and tenant-owner associations. During 2012, the interest rate for corporate savings accounts was raised to the same level as that of private individuals for amounts up to SEK 5 million. This resulted in a sharp increase in in-terest from small and medium-sized companies. SBAB’s deposits from corporate customers and tenant-own-er associations rose by SEK 3.8 billion (0.1) in 2012. Deposits from corporate customers and tenant-owner associations totalled SEK 5.2 billion (1.4) at year-end.
1) Statistic Sweden’s financial market statistics chapter 1.1, Banks: 2010151A Deposits/Funding, Sw, Retail2) Statistic Sweden’s financial market statistics chapter 1.1, Banks: 201014 Deposits/Funding, Sw, Retail
0
1.0
2.0
3.0
4.0
5.0
201220112010
SEK billion Accounts
Deposit volume
Number of accounts
0
1,000
2,000
3,000
4,000
5,000
Deposit volume and number of accounts, corporate customers and tenant-owner associations
0
5.0
10.0
15.0
20.0
25.0
201220112010
SEK billion Accounts
Deposit volume
Number of accounts
0
30,000
60,000
90,000
120,000
150,000
Deposit volume and number of accounts, retail

AdministrAtion report10
SBAB Annual Report 2012
Funding
SBAB operates in a number of funding markets. A broad and diversified inves-tor base is an important part of the Group’s funding strategy. Despite worries in capital markets primarily in Southern Europe, SBAB experienced favourable demand in 2012 in all of the funding markets where it is active.
Development in the capital marketEarly 2012 was marked by the European debt crisis, which resulted in funding costs remaining high. Howev-er, stimuli from central banks contributed to the gradual lowering of capital costs from the second quarter onward.
Nevertheless, continued concerns about the econom-ic situation of Southern European countries and the risk of spill-over effects occasioned the ECB to once again announce strong stimuli in the form of additional supply of cash. These measures, in combination with clear sig-nals from the EU in support of the financial system, had a positive impact on the market and led to stabilisation and lower interest rates. The improved market climate in Southern Europe also positively impacted funding costs for Nordic and Swedish issuers. Subsequently, the market was characterised by low key interest rates, high liquidity and continued regulatory alignment. The inves-tors’ pursuit for higher returns resulted in an increased risk appetite and the purchase of bonds with longer maturities, which contributed to lower bond yields and a reduction in risk premiums.
SBAB’s funding operationsThe SBAB Group was active in the senior unsecured market through SBAB and in the covered market through its wholly owned subsidiary, SCBC.
SBAB works continuously to limit its liquidity risk and funding risks. This effort primarily entails restricting the percentage of short-term funding, maintaining or extending the maturity of long-term funding, and the purchase of bonds with short residual maturities.
Due to the robust growth in bank deposits during the year, the borrowing requirement is lower than planned. The increase in deposits resulted in an improved balance between various liability items on the balance sheet and reduced dependence on capital market financing.
A significant portion of the funding requirements for the year were refinanced in early 2012 and portions of financial requirements for 2012 had already been prefi-nanced during the latter half of 2011. As a result of high growth in deposits in combination with prefinancing, long-term funding requirements were lower than in the preceding year. During the first quarter, SBAB repaid and settled the government-guaranteed programme (SEK 11.1 billion).
The following is a selection of SBAB’s funding transac-tions during the year:• A 2-year senior unsecured bond of EUR 750 million• A 5-year senior unsecured bond of EUR 2,750 million• Issue of a new Swedish five-year covered bond
SEK, 57%
EUR, 24%
JPY, 4%
Currency distribution, debt securities in issue, SBAB Bank GroupDebt outstanding at 31 December 2012: SEK 254 billion
Other currencies, 15%
Swedish covered mortgage bonds (SCBC), 36%
EMTCN programme (SCBC), 28%
EMTN-programme (SBAB), 24%
Sources of funding, debt securities in issue, SBAB Bank GroupDebt outstanding at 31 December 2012: SEK 254 billion
Issuances of Samurai bonds in the Japanese market so-called Samurai bonds, 2%SVCP, 4%USCP, 4%
ECP, 2%

AdministrAtion report 11
SBAB Annual Report 2012
Short-term fundingSBAB has three commercial paper programmes for non-secured senior short-term funding: one Swedish, one European and one US programme. Commercial papers were issued in a series of different currencies during the year.
short-term funding sources Limit
Swedish Commercial Paper Programme (SVCP) SEK 25 billion
European Commercial Paper Programme (ECP) EUR 3 billion
US Commercial Paper Programme (USCP) USD 4 billion
Long-term fundingSBAB issues non-covered (senior) loans through an EMTN programme. The Group’s covered funding is conducted through SCBC’s EMTCN programme and a Swedish covered bond programme. SCBC also has access to the Australian market through a separate funding programme. During the year, the Group issued long-term bonds with a total volume of SEK 46.1 billion (78.9). The decline was mainly due to the strong growth in deposits and earlier-implemented prefinancing.
Long-term funding sources Limit
Euro Medium Term Note Programme (EMTN),SBAB EUR 13 billion
Euro Medium Term Covered Note Programme (EMTCN), SCBC EUR 10 billion
Swedish Covered Bond Programme, SCBC No fixed limit
Australian Covered Bond Issuance Programme, SCBC AUD 4 billion
SCBC SCBC’s primary operations comprise the issuance of covered bonds in the Swedish and international capital markets. To accomplish this, the company has three funding programmes: These programmes received the highest possible long-term credit ratings, Aaa/AAA, from the rating agencies Moody’s and Standard & Poor’s. SCBC does not conduct any lending activities itself, but acquires loans on an ongoing basis, from SBAB. The intention of the acquisitions is for these loans to be included in full or in part in the cover pool that serves as collateral for SCBC’s covered bonds. Information on SCBC’s covered bonds and cover pool is published monthly on sbab.se.
RatingOn 20 November, Standard & Poor’s downgraded the outlook for the underlying credit rating of most Swedish banks.
The revised outlook on credit rating was primarily due to the weakened outlook for the Swedish economy, which is expected to adversely impact Swedish banks. SBAB’s outlook was downgraded from stable to nega-tive. The underlying long-term rating of A+ and SBAB’s short-term rating of A-1 were simultaneously confirmed.
On 14 December, S&P lowered SBAB’s long-term credit rating from A+ to A, with a negative outlook. At the same time, the short-term credit rating of A-1 was confirmed.
Moody’s long-term and short-term credit ratings were unchanged during the year, at A2 and P-1 respectively.
rating per 2012-12-31 Moody’s standard & Poor’s
Long-term funding, SBAB A2 A
Long-term funding, SCBC Aaa AAA
Short-term funding, SBAB P–1 A–1

AdministrAtion report12
SBAB Annual Report 2012
Sustainable development
“Sustainable development should be a matter of course in all parts of our ope-rations. Since 2009, corporate responsibility, “CR”, has been an integrated component of our business plan, with clearly defined goals and strategies.”
Carl-Viggo Östlund, CEO
Social and economic responsibility in focusAt SBAB, sustainable enterprise is defined as efforts un-dertaken over and above applicable laws to integrate social, economic and environmental responsibility into operations.
Based on the company’s values, SBAB is to pursue sound business activities that lead to sustainable eco-nomic development. With a focus on ethics and respon-sibility, these activities contribute to attainment of the company’s overall reputation objective. By engaging in active dialogue with its stakeholders, the bank gains an awareness and understanding of their expectations on our operations, which contributes to the company developing in the right direction, towards sustainable progress.
Responsible granting of loansSBAB seeks to create long-term and trustful customer relations. This requires taking responsibility by ensuring that customers have the financial capacity required to meet their undertakings. For this reason, every custom-er undergoes a rigorous credit assessment, enabling the bank to determine whether the customer has the financial capacity required for a loan to be granted. The customer’s repayment capacity is assessed first, followed by collateral. Loans are not granted in the event of insufficient income or repayment capacity. Using a residence as collateral, a customer may borrow up to a maximum of 85% of the property value. Since repayment
overall sustainability targets
2013 objectives outcome 2012 outcome 2011
Reputation Objective1 65.5 61.5 63.5
50/50 allocation between male and female managers2 50/50 56/44 61/39
Environmental target: reduce carbon emissions by 20% from 2011 to 20143 –5%/–15% –6,2%/–15,7% –10,2%/–10,2%
1 Index figure in Reputation Index from Nordic Brand Academy, “NBA”2 Percentage distribution3 The starting point for the measurement is carbon emissions in 2010. The target means an annual reduction in carbon emissions by 5%. In the table, the reduction in the current year as well as the total reduction since 2010 is stated. The target is set in relation to the scope of operations and measured in adjusted number of active employees. The restated number of active employees includes the average number of employees and engaged consultants, restated as full-time equivalents.
REPUTATION
SOC
IAL
RES
PON
SIBILITY
ENV IRO N MENTAL
RESPONS IB I L I T Y
ECONOMIC R
ESPO
NSIB
ILITY
REP
O
RTING AND COMMUNICATIO
N
of a residential mortgage contributes to sound house-hold finances, loan amounts exceeding 75% of the value of the residence are subject to a repayment requirement. In 2012, SBAB made it easier for customers to change lenders by removing the interest compensation normally charged for the redemption of three-month loans.
It is important that the company’s customers under-stand how the operations work and the costs that are associated with a residential mortgage. For this reason, SBAB’s costs for a residential mortgage are clearly de-scribed at sbab.se. The pricing model that is applied for SBAB’s residential mortgages is also described there.

AdministrAtion report 13
SBAB Annual Report 2012
ResponsibilityThe Board of Directors is ultimately responsible for ensuring that SBAB conducts proactive, long-term work to achieve sustainable development. Executive Man-agement is responsible for all performance indicators, which are reported in accordance with GRI. The Com-munications Department is responsible for coordinating the bank’s corporate responsbility efforts. The bank has a CR Council, which was reorganised during 2012 into an executive council that includes the CEO and the Head of Communications & HR.
There are also a number of CR ambassadors who represent all of the departments and units. The role of the ambassadors is to facilitate and support the various parts of the operations in their effort to deliver in line with the company’s overall CR targets.
ControlThe owner’s view is that state-owned enterprises should be role models in the field of sustainable business. The owner believes that sustainability issues are central from a business strategy perspective and important in order for SBAB to compete for customers and creating value for the owner. Since it is vital to SBAB that CR is an integrated part of its operations, the bank has chosen to measure, report and monitor CR targets in
the same manner as other targets and key indicators. Sustainable enterprise is an integrated component of SBAB’s overall business plan. To elucidate on this shared approach, a CR policy is available, which was approved by the Board of Directors in April 2012. Other internal CR guidelines are established by Executive Management. The actual CR work is to take place out in the organisation, where the operation-specific com-petencies exist. Identified activities are integrated in the business plan of every unit/department and contribute to the attainment of SBAB’s overall CR targets.
ReportingSBAB reports its sustainable development work on the basis of GRI, level C+. Reporting encompasses the Parent Company, SBAB Bank AB (publ), and the wholly owned subsidiary, SCBC.
SCBC’s operations are pursued by employees of the Parent Company and the applicable rules and guide-lines encompass both companies.
SBAB reports on specific indicators depending on their relevance and the availability of data and information. The reports are quality assured through independent reviews and verification. Further informa-tion about sustainable development and policies are available from www.sbab.se.
sustainable development activities
Achieved in 2012
• New smaller and more executive CR council (including CEO) in place
• Training/information to Board of Directors, Executive Manage-ment and CR ambassadors
• Additional CR ambassadors with more clearly defined roles in place
• Continued increased usage of video conferencing equipment
• Started the analysis regarding the prerequisites for adapting operations in accordance with ISO 14001
Focus for 2013–2014
• Continued work to achieve established environmental targets through the climate action plan
• Continued communication, information and training efforts in CR internally and externally
• Development of a social-commitment strategy
• Development of products and services that contribute to SBAB’s attainment of its reputation objective
CREDIT EVALuATION MODEL FOR RETAIL MORTGAGES 1. repayment capacity:The bank stress-tests the customer’s repayment capacity against a computed rate of interest. The computed rate of interest accounts for such factors as the forecast interest-rate development and also includes a buffer for unexpected interest-rate hikes.
2. Calculation of residual disposable income:The bank reviews the customer’s financial status to estimate his/her residual disposable income. Among other factors, the calculation is based on information from the Swedish Consumer Agency’s assessments of household costs and operating expenses for real estate.
3. Collateral:Collateral for a residential mortgage is not relevant until the customer’s financial position passes the bank’s credit evaluation. The valuation is conducted using SBAB’s approved valuation models. Using a residence as collateral, a customer may borrow up to a maximum of 85% of its value.

AdministrAtion report14
SBAB Annual Report 2012
Media
owner
Customers
employees suppliers
investorsstakeholder
organisations
Business partners
SIMPLE, CuSTOMER- DRIVEN AND BOLD
SBAB creates long-term customer relations by being the easiest bank to access and under-stand, and by exceeding customer expectations in terms of a banking experience (service, prod-ucts and treatment). SBAB monitors credibility and image surveys that are conducted on the market. In the 2012 Swedish Quality Index for residential mortgages, SBAB was once again ranked Number One by tenant-owner-associ-ation customers and climbed to Number Two among retail customers. By engaging in an active dialogue with its customers, SBAB aims to achieve top ranking in all segments of these surveys.
MOTIVATED AND COMPETENT EMPLOyEESSBAB’s employees are the principal driving force in achieving the company’s targets. Moti-vated and competent employees are required for this purpose. SBAB attains its collective targets and creates a new banking experience through a clear and active dialogue between the company’s managers and employees, and a focus on the company’s values, objectives and vision.
CLIMATE-SMART BANK
SBAB’s business model is climate-smart since banking business is mainly conducted via the Internet and telephone. By implementing new, innovative IT solutions, the climate impact of the operations can be further reduced. A climate action plan has been established to achieve the climate goal of reducing SBAB’s carbon emissions by 20% from 2011 to 2014.
A SuSTAINABLE INVESTMENT
SBAB’s relations with its investors are based on their confidence in the bank’s employees, oper-ations and sustainable financial development. Close contact with the market ensures that SBAB is aware of the demands and requirements that investors impose on the company. Extensive sur-veys are also conducted on behalf of investors regarding SBAB’s sustainability efforts – surveys that have become increasingly relevant as ever more investors integrate sustainability into their analyses and investment decisions.
Stake-holder dialogueBy engaging in dialogue with the company’s stakeholders, the company is able to set the right priorities when establish-ing focus areas for CR. As a result of an in-ternal analysis, SBAB has decid-ed to prioritise the following stakeholders; customers, investors and employees. It is SBAB’s ambi-tion, whenever reasonably pos-sible, to satisfy the wishes, ex-pectations and demands of its stakeholders.

AdministrAtion report 15
SBAB Annual Report 2012
Risk is a natural component of all businesses and all risks that arise must be managed. The recent financial and debt crises exemplify the importance of effective liquidity and counterparty risk management. SBAB is mainly exposed to credit risk in its lending operations. For further information about SBAB’s risk management and capital adequacy, refer to Note 2 or visit SBAB’s website: www.sbab.se.
Risk strategySBAB’s operations are to be conducted in such a manner that the risks that arise are adapted to the bank’s risk-bearing capacity. Risk-bearing capacity refers to the capacity to manage losses through either continuous earnings or the utilisation of risk capital. The anticipated scope of expected losses is to be borne by continuous earnings, while unexpected losses are to be
covered by risk capital insofar as they are not covered by continuous earnings. In cases where risks cannot be quantified and compared with risk-bearing capacity in the same manner as, for example, credit risk and market risk, the costs incurred for reducing the risk are weighed against the desired risk level and the change in risk level achieved through a particular measure.
Risk management
The risks that arise in sBAB’s operations primarily comprise:
risk
CREDIT RISK
LIQUIDITy RISK
MARKET RISK
OPERATIONAL RISK
BUSINESS RISK
CONCENTRATION RISK
Description
The counterparty is unable to fulfil its payment obligations.
Being unable to meet payment obligations on the date of maturity without the cost of obtaining payment funds increasing significantly.
A decline in profitability due to unfavourable market fluctuations.
Losses due to inappropriate or unsuccessful in-ternal processes, human error, incorrect systems or external events, including legal risk.
Declining income due to deteriorating com-petitive conditions or an incorrect strategy or decision. Margin risk, which arises when the fixed-interest periods applying to the interest-rate margins for lending and funding differ.
Exposures concentrated to certain types of bor-rowers, regions or industries.

AdministrAtion report16
SBAB Annual Report 2012
Risk toleranceBased on the established strategy of primarily gen-erating income by taking credit risks, it is important to be aware of the scope of the Group’s selected risk exposure at both an aggregate level and the segment and customer level. Risk tolerance is defined as “the risk that the company is willing to take to achieve the established business objectives within the framework of the long-term strategy.” The table above indicates the measurable risk tolerance objectives that SBAB has had during the year.
In December 2012, SBAB’s Board of Directors resolved on new risk-tolerance targets which are to apply in 2013. These are based on the three main categories of finan-cial solvency, liquidity risk and compliance. The category financial solvency encompasses the risks for which the bank must retain capital, while liquidity risk encompass-es the risks impacting SBAB’s prerequisites for success-ful financing and cash management. The third main category comprises compliance and encompasses the regulations and ethical standards with which SBAB must comply to be able to pursue its operations. Each catego-ry is divided into subgroups with specific objectives for which the outcome is monitored and reported.
Overall risk management objectivesThe Board of Directors of SBAB has established the following risk management objectives:• Risk management is to support the Group’s business
operations and rating goals. • The level of risk-taking is to be low. This is to be
achieved by ensuring that total risk is kept at a level compatible with SBAB’s financial objectives for return, the size of risk capital and the target rating.
• Collective risk management is to be pursued at a level that at least fulfils the requirements of the authorities.
• Relevant risks are to be identified, measured, man-aged and controlled.
• SBAB’s risk management is to be transparent and easily presented to and understood by the company’s external stakeholders.
• The capital assessed to cover unforeseeable losses in the coming years is to be measured in the form of economic capital. The assessment of economic capital must take into account the most fundamental and quantifiable risks, such as credit risk, market risk, operational risk and business risk.
• SBAB is to maintain an appropriate risk-management or-ganisation with a well-defined division of responsibilities.
Measurement of risk and capital requirementSBAB’s definition of capital and capital requirement complies with external requirements. Internal follow-up and reporting are based on Pillars 1 and 2 of the Basel II regulations.
In general terms, the SBAB’s risk process can be described as follows:
1. identify riskSBAB continuously identifies the risks generated by its operations. The operations, that primarily consist of funding and lending, mainly generate credit risk, market risk and liquidity risk.
2. Measure risk and capital requirementIdentified risks are measured using various models. Sev-eral statistical rating models are used to measure credit risk, depending on the type of counterparty and the type of collateral provided. SBAB mainly uses the internal ratings-based approach to determine its internal and external capital requirements. Market risk is measured using Value at Risk (VaR) in the calculation of economic capital and through various types of scenario analyses for monitoring internal limits. The external capital require-ment for market and operational risk is calculated using the standardised approach. For business risk, standards are used based on operating expenses in the calcula-tion of economic capital. Liquidity risk is measured by comparing the liquidity buffer with stressed flows and through the calculation of the liquidity coverage ratio.
3. Analyse, control and reportBased on the results provided by the models, an analysis is conducted to determine how the risks affect and can
risk tolerance objectives
objectives outcome Difference
2012 2011 2012 2011 2012 2011
Return on equity (owner’s return requirement)1) 7.4% 8% 7.3% 7.1% –0.1 –0.9
Core Tier 1 capital ratio2) ≥ 6% ≥ 6% 6.9% 6.7% 0.9 0.7
Tier 1 capital ratio2) ≥ 7% ≥ 7% 9.1% 8.9% 2.1 1.9
Capital adequacy ratio2) ≥ 10% ≥ 10% 11.5% 10.7% 1.5 0.7
Period that liquidity reserve is to cover MCO3) ≥ 30 days ≥ 30 days 83 days 60 days4) 53 days 30 days
Tolerance level for Operational risk – Total SEK 20 m SEK 7.5 m SEK 0.4 m SEK 3.9 m SEK 19.6 m SEK 3.6 m
Tolerance level for Operational risk – individual incidents SEK 5 m – SEK 0.1 m – SEK 4.9 m –
1) yield on five-year Government bonds plus five percentage points after tax over a business cycle.2) Calculated in accordance with transitional regulations3) Maximum Cumulative Outflow4) Adjusted for increased comparability. RMBS assets have been excluded from the reserve during 2012.

AdministrAtion report 17
SBAB Annual Report 2012
be expected to affect the operations. This work includes a follow-up and analysis of historical outcomes, as well as future-oriented stress tests and scenario analyses. The results of the analysis, together with a qualitative assessment of other risks, are reported to the Board of Directors, CEO and Executive Management.
Organisation and responsibilityThe Board of Directors has ultimate responsibility for risk management and makes decisions on the risk policies, capital policy and risk tolerance, as well as instructions for managing and measuring risk in the following areas: • Credit instructions for lending – The instructions are
established by the Board, which thereby regulates the authority to make credit and limit decisions at various levels in SBAB. Loans and credit limits exceeding SEK 250 million are decided by the Board’s Credit Committee.
• Finance directive for treasury operations – The Board determines the limits for the management of financial risks. The Board has delegated responsibility for certain issues to SBAB’s Risk and Capital Committee (formerly the Finance Committee).
The Risk and Capital Committee that was established in 2012 is the Board’s body for preparing issues for resolution by the Board in respect of SBAB’s treasury operations, risks and capital. The committee comprises three Board Members and the CEO. (For further infor-mation about the Boards committees, see the Corpo-rate Governance report.)
The Asset and Liability Committee, “ALCO”, was reorganized in 2012 and handles matters relating to risk and capital planning, which are then addressed by Executive Management The CFO is the Chairman of ALCO. ALCO otherwise comprises senior executives
from the Credit and Risk Department, and the Finance and Treasury department.
The CRO is responsible for SBAB’s risk management. Risk Control is the central body responsible for ongoing risk control at SBAB. Risk Control is subordinate to the CRO, but the head of the unit is appointed by the CEO. Risk Control has the overall responsibility for developing and ensuring that SBAB’s risk strategies are implement-ed in the intended manner and that policies and pro-cesses facilitate relevant follow-up. Risk Control is respon-sible for analysing, assessing and reporting the Group’s overall risks. On a daily basis Risk Control is ensuring that the limits for the treasury operations are not exceed-ed. The credit risk is monitored on a monthly basis. Risk Control is also responsible for the design, implementa-tion, reliability and monitoring of SBAB’s risk-classification systems and for the economic capital model.
Special functions manage operational risk and the new product approval process.
A monthly report on the overall risk situation and the economic capital trend is presented by Risk Control to the Board, the CEO and Executive Management. Risk Control reports to the CEO, CFO and CRO on a daily basis regarding the outcome of limits in treasury operations.
Risk Control also continuously reports the capital ad-equacy ratio, Tier 1 capital ratio and core Tier 1 capital ratio to the Board, the CEO and Executive Management. In addition, the Board and CEO are provided with a detailed description of risks on a quarterly basis. SBAB’s Board and management are thereby provided with a relevant overview of the Group’s risk exposure on a continuous basis. Risk Control’s work and reporting also provide a foundation for the Group’s strategic planning and form the basis for determining SBAB’s capital goals.
The individual risks are managed by the respective operation. A more detailed description of SBAB’s risk man-agement and capital adequacy is presented in Note 2.
During 2012, Anti-money Laundering, “AML”, was transferred to the compliance function.
operational risk – Security
– Financial reporting risk
new product approval process
Chief risk officer (Cro)
Board of Directors
risk Control
Ceo
risk and Capital Committee
ALCo
reporting of risk

AdministrAtion report18
SBAB Annual Report 2012
Results
Operating resultOperating profit excluding net result from financial instruments measured at fair value for the full-year amounted to SEK 1,104 million (813). The year was characterised by higher lending volumes and a sharp increase in deposits. Operating profit amounted to SEK 503 million (464) and was primarily impacted by higher net interest income, a negative outcome for net result from financial instruments and increased expenses.
The expenditure/income ratio decreased to 58% (60), mainly due to higher income. Loan losses remained low during the year and the loan loss rate was 0.01% (0.00). The return on equity was 4.2% (4.2). SBAB’s owner has a return requirement corresponding to the average yield on five-year government bonds plus 5 percentage points after tax over a business cycle.
Expressed as an average over the five-year period of 2008–2012, SBAB’s return on equity has been 7.3% (7.1 during the period 2007–2011). The owner’s average return requirement for the corresponding period was 7.4% (8.0).
Operating incomeOperating income amounted to SEK 1,248 million (1,179). Net interest income increased 20% to SEK 1,941 million (1,618). Net interest income was affected positively by a higher average volume and improved earnings in the lending operations. To reduce the liquidity risk, SBAB pre-funded a substantial share of the year’s funding requirements. Pre-funding adversely impacted net interest income, since the pre-funding was invested at a lower interest rate than the current interest rate on funding. The liquidity was later normal-ised with the debt maturity. Commission income fell to SEK 55 million (60), mainly due to lower income from business partners. Commission expenses were on par with the preceding year. The stability fee for the year was SEK 115 million (113). The stability fee comprises a fixed percentage of 0.036%, calculated on the basis of obligations in the fee-payer’s balance sheet less certain intra-Group loans and subordinated debt. Net result from financial instruments measured at fair value amounted to an income of SEK 601 million (expense:
1) Fair-value recognition of derivative instrumentsThe currency and interest-rate risk inherent in funding conducted in foreign currency is normally hedged throughout the maturity of the funding through currency interest-rate derivatives, known as basis swaps. According to the regulations, all derivatives are to be recognised at fair value (market value), with changes in fair value included in net income/expense from financial instruments measured at fair value.Major variations in the actual market value between the reporting periods could result in significant changes in the carrying amount and thus also in capital adequacy. However, changes in the form of losses/gains remain unrealised as long as the basis swap is not closed prematurely.In cases where the derivative is held to maturity, earnings are not affected by the accumulated changes since the market value of each derivative contract starts and ends at zero. Most of SBAB’s basis swaps are held to maturity.
349). The single largest factor impacting earnings was unrealised market-value changes on basis swaps.
Operating expensesSBAB’s expenses totalled SEK 725 million (707). Per-sonnel costs amounted to SEK 339 million (323) The increase was mainly due to higher pension costs. Other expenses totalled SEK 362 million (357). The increase derived primarily from higher operating expenses and temporary employees arising from a higher level of access to SBAB’s products and services by telephone and the Internet. Depreciation of property, plant and equipment and amortisation of fixed assets amounted to SEK 24 million (27).
Loan lossesLoan losses remained low. Loan losses for full-year 2012 amounted to SEK 20 million (8), corresponding to a loan loss rate of 0.01% (0.00). For a more detailed account of the loan-loss trend, refer to Note 11.
Parent CompanyOperating profit in 2012 totalled SEK 104 million (98). Operating income amounted to SEK 941 million (803). Operating profit was primarily impacted by higher net interest income totalling SEK 130 million (expense: 92). The improvement in net interest income was primarily driven by an increase in the volume of loans to the pub-lic and interest income arising from a higher amount of subordinated loans to the subsidiary, SCBC. Net income/expense from financial transactions amounted to SEK 213 million (expense: 206). The increase was mainly due to positive developments in the liquidity portfolio, which offset continued negative changes in the market value of basis swaps. Expenses totalled SEK 803 million (708). The increase in expenses was due to SBAB’s development of banking operations, temporary employees and operating expenses. Net loan losses increased to SEK -34 million (recovery: 3). The net effect was mainly impacted by increased provisions.

AdministrAtion report 19
SBAB Annual Report 2012
SCBCSCBC’s operating loss for 2012 amounted to SEK 194 million (profit: 1,287). Net interest income improved compared with the preceding year to SEK 1,787 million (1,689). The increase was due to improved earnings in lending operations. At year-end, the lending portfo-lio amounted to SEK 208.9 billion (210.5). Net result from financial transactions amounted to a loss of SEK 1,322 million (gain: 268). In 2012, components of the company’s hedge accounting were adapted to enable more uniform management within the SBAB Group. Net commission income/expense amounted to an expense of SEK 86 million (expense: 96). The improvement was mainly attributable to a change in the limits for liquidity facilities between SCBC and SBAB. SCBC’s total operating income decreased in comparison with the preceding year to SEK 380 million (1,861). Expenses for the year increased to SEK 587 million (563), primarily due to higher costs for the loan-administration services performed by SBAB. Net loan losses amounted to a profit of SEK 13 million (loss: 11), corresponding to a loan loss rate of minus 0.01% (plus: 0.01).
FriSparOperating profit amounted to SEK 51 million (44) and the lending portfolio to SEK 1.4 billion (9.3). Monthly transfers of credit from FriSpar to SBAB have been taking place since March.
Capital adequacyBasel III will be implemented gradually and is more stringent than the current regulations. The new regula-tions propose, for example, higher capital requirements and stricter demands on capital quality. For more infor-mation on SBAB’s capital adequacy, refer to Note 2.
Dividend policy and appropriation of profitsThe dividend policy set by the owner entails that one third of net profit after tax be distributed to the owner. In view of the rules regarding continued application of the transitional regulations under 2013 and the forth-coming new capital adequacy regulations, the Board proposes that the net profit for 2012 be carried forward and that no dividend be paid.
Corporate Governance ReportSBAB’s Corporate Governance Report for 2012 is ap-pended to this Annual Report on page 81.
Events after the balance-sheet dateOn 1 February 2013, changes were made to SBAB’s organisation and its Executive Management. The Executive Management as of this date comprises CEO Carl -Viggo Östlund, Vice President and Chief Legal Counsel Christine Ehnström, Head of Business Development Sarah Bucknell, Head of Communications & HR Jonas Burvall, Head of Retail Market Håkan Höijer, Head of Tenant-owner Associations Market Gustav Hoorn, Head of Collaboration Market Eva Marell, CRO Peter Svensén and CFO Lennart Krän.
On 14 March 2013, the Board of Directors decided to propose new financial objectives for the company to the Annual General Meeting on 18 April 2013. The proposal includes objectives on profitability, capital structure and dividends.

AdministrAtion report20
SBAB Annual Report 2012
overview of earnings
seK million
ParentCompany
sBAB Bank sCBC Frispar 20121) 2011 %
Interest income 4,162 7,902 164 10,485 10,449
Interest expense –4,032 –6,115 –105 –8,544 –8,831
net interest income 130 1,787 59 1,941 1,618 20%
Dividends received 17
Group contribution received
Commission income 136 10 55 60
Commission expense –70 –96 –150 –150
Net income/expense from financial instruments measured at fair value
Net income/expense from financial transactions 213 –1,322 –601 –349
Other operating income 515 1 3 0
Total operating income 941 380 59 1,248 1,179 6%
Personnel costs –354 –339 –323 5%
Costs for premises –29 –29 –28 4%
IT expenses –222 –146 –164 –11%
Other administration expenses –111 –586 –8 –114 –82 39%
Marketing –58 –58 –67 –13%
Other operating expenses –14 –1 –15 –16 –6%
Depreciation of property, plant and equipment and amortisation of intangible fixed assets –15 –24 –27 –11%
Total expenses before loan losses –803 –587 –8 –725 –707 3%
Profit/loss before loan losses 138 –207 51 523 472 11%
Loan losses, net –34 13 –20 –8 150%
operating profit/loss 104 –194 51 503 464 8%
Tax –11 52 –14 –140 –123
Profit/loss for the year 93 –142 37 363 341 6%
1) Parent Company SBAB Bank, SCBC and FriSpar do not add up to SBAB Bank Group 2012 due to eliminations and similar items.
new lending Gross lendinginvestment margin Net interest income in relation to average total assetsLoan loss rate Loan losses in relation to opening balance for lending to the publicshare of doubtful loan receivables Doubtful loan receivables (net) in relation to lending to the public at year-endexpenditure/income ratio, excl. loan losses Total operating expenses/total incomeexpenditure/income ratio, incl. loan losses (Total operating expenses plus loan losses)/total incomereturn on equity Operating profit after actual tax in relation to average equityCore Tier 1 capital ratio Tier 1 capital less Tier 1 capital contribution in relation to risk-weighted assets (RWA)Capital adequacy ratio Capital base/risk-weighted assetsTier 1 capital contribution Tier 1 capital/risk-weighted assetsequity ratio Equity, incl. minority interest, in relation to total assets at year-endConsolidation ratio Equity, incl. minority interest, and deferred tax in relation to total assets at year-end number of employees Permanent and temporary employees (annual average)
Definitions of key data

AdministrAtion report 21
SBAB Annual Report 2012
Five-year overview
Group
seK million 2012 2011 2010 2009 2008
Interest income 10,485 10,449 5,355 6,043 11,222
Interest expense –8,544 –8,831 –3,593 –4,524 –10,081
net interest income 1,941 1,618 1,762 1,519 1,141
Other operating income –693 –439 –333 455 –14
Total operating income 1,248 1,179 1,429 1,974 1,127
Depreciation of property, plant and equipment and amortisation of intangible fixed assets –24 –27 –26 –28 –32
Other operating expenses –701 –680 –578 –550 –488
Total operating expenses –725 –707 –604 –578 –520
Profit/loss before loan losses 523 472 825 1,396 607
Loan losses, incl. change in value of property –20 –8 –40 –107 –22
operating profit 503 464 785 1,289 585
Lending portfolio 255,946 248,150 249,103 225,976 183,959
Other assets 78,484 91,600 67,822 68,099 69,335
Total assets 334,430 339,750 316,925 294,075 253,294
Deposits 27,654 8,769 6,083 4,653 3,542
Debt securities in issue 253,897 276,678 261,962 249,095 198,643
Other liabilities 37,066 39,615 35,298 29,161 41,011
Deferred tax liabilities 0 71 60 238 –
Subordinated debt 7,052 6,233 5,508 3,551 3,666
Equity incl. minority interest 8,761 8,384 8,014 7,377 6,432
Total liabilities and equity 334 430 339,750 316,925 294,075 253,294
Lending
New lending, SEK million 34,878 31,107 50,398 64,626 32,425
Investment margin, % 0.58 0.49 0.58 0.55 0.48
Loan losses
Loan loss rate, % 0.01 0.00 0.02 0.06 0.01
Share of doubtful loan receivables, % 0.01 0.00 0.01 0.01 0.02
Productivity
Expenditure/Income ratio, excl. loan losses, % 58 60 42 29 46
Expenditure/Income ratio, incl. loan losses, % 60 61 45 35 48
Capital structure
Return on equity, % 4.2% 4.2% 7.5% 13.8% 6.7%
Core Tier 1 capital ratio without transitional regulations, % 16.4% 15.0% 14.1% 14,1% 11,8%
Tier 1 capital ratio without transitional regulations, % 21.7% 20.0% 19.1% 15,9% 13,5%
Capital adequacy ratio without transitional regulations, % 27.4% 23.9% 22.4% 19,7% 16,8%
Core Tier 1 capital ratio with transitional regulations, % 6.9% 6.7% 6.4% 6.6% 6.6%
Tier 1 capital ratio with transitional regulations, % 9.1% 8.9% 8.7% 7.4% 7.6%
Capital adequacy ratio with transitional regulations, % 11.5% 10.7% 10.2% 9.2% 9.4%
Equity ratio 2.6% 2.5% 2.5% 2.5% 2.5%
Consolidation ratio 2.6% 2.5% 2.5% 2.6% 2.5%
employees
Number of employees (annual average) 413 419 431 396 365
Financial statements22
SBAB Annual Report 2012
Financial statements
Income statement . . . . . . . . . . . . . . . . . . . . . . . . . . . . . . 23
Statement of comprehensive income . . . . . . . . . . . . . . . . 23
Balance sheet . . . . . . . . . . . . . . . . . . . . . . . . . . . . . . . . . 24
Statement of changes in equity . . . . . . . . . . . . . . . . . . . . . 25
Cash flow statement . . . . . . . . . . . . . . . . . . . . . . . . . . . . . 26
Notes
Note 1 Accounting policies . . . . . . . . . . . . . . . . . . . . . . . 27
Note 2 Risk management and capital adequacy . . . . . . 31
2a Risk management – Credit risk
in lending operations . . . . . . . . . . . . . . . . . . . . . 31
2b Risk management – Credit risk
in treasury operations . . . . . . . . . . . . . . . . . . . . . 38
2c Risk management – Liquidity risk . . . . . . . . . . . . 40
2d Risk management – Market risk . . . . . . . . . . . . . 42
2e Risk management – Operational risk . . . . . . . . . 45
2f Risk management – Business risk . . . . . . . . . . . . 45
2g Risk management – Concentration risk . . . . . . . . 45
2h Risk management – Internal capital
adequacy assessment . . . . . . . . . . . . . . . . . . . . 45
2i Risk management – Capital adequacy . . . . . . . . 46
Note 3 Net interest income . . . . . . . . . . . . . . . . . . . . . . . 48
Note 4 Dividends and group contribution received . . . . 48
Note 5 Commission . . . . . . . . . . . . . . . . . . . . . . . . . . . . . 48
Note 6 Net income/expense from financial instruments
measured at fair value/
Net income/expense from financial transactions . 49
Note 7 Other operating income . . . . . . . . . . . . . . . . . . . 49
Note 8 Personnel costs . . . . . . . . . . . . . . . . . . . . . . . . . . 49
Note 9 Other expenses . . . . . . . . . . . . . . . . . . . . . . . . . . 53
Note 10 Depreciation of property, plant and equipment
and amortisation of intangible fixed assets . . . . 54
Contents
Note 11 Loan losses, net . . . . . . . . . . . . . . . . . . . . . . . . . . 54
Note 12 Tax . . . . . . . . . . . . . . . . . . . . . . . . . . . . . . . . . . . 55
Note 13 Chargeable treasury bills and other
eligible bills . . . . . . . . . . . . . . . . . . . . . . . . . . . . . 55
Note 14 Lending to credit institutions . . . . . . . . . . . . . . . . 55
Note 15 Lending to the public . . . . . . . . . . . . . . . . . . . . . 56
Note 16 Change in value of interest-rate-hedged
items in portfolio hedges . . . . . . . . . . . . . . . . . . . 57
Note 17 Bonds and other interest-bearing securities . . . . 58
Note 18 Derivative instruments . . . . . . . . . . . . . . . . . . . . . 59
Note 19 Shares and participations . . . . . . . . . . . . . . . . . . 59
Note 20 Shares and participations in joint ventures . . . . . 60
Note 21 Shares and participations in group companies . . 60
Note 22 Intangible fixed assets . . . . . . . . . . . . . . . . . . . . 61
Note 23 Property, plant and equipment . . . . . . . . . . . . . . 61
Note 24 Other assets . . . . . . . . . . . . . . . . . . . . . . . . . . . . 61
Note 25 Prepaid expenses and accrued income . . . . . . . 62
Note 26 Liabilities to credit institutions . . . . . . . . . . . . . . . 62
Note 27 Deposits from the public . . . . . . . . . . . . . . . . . . . 62
Note 28 Debt securities in issue . . . . . . . . . . . . . . . . . . . . . 62
Note 29 Other liabilities . . . . . . . . . . . . . . . . . . . . . . . . . . 62
Note 30 Accrued expenses and prepaid income . . . . . . . 64
Note 31 Deferred tax . . . . . . . . . . . . . . . . . . . . . . . . . . . . 64
Note 32 Provisions . . . . . . . . . . . . . . . . . . . . . . . . . . . . . . . 64
Note 33 Subordinated debt . . . . . . . . . . . . . . . . . . . . . . . 66
Note 34 Equity . . . . . . . . . . . . . . . . . . . . . . . . . . . . . . . . . . 66
Note 35 Assets pledged for own liabilities . . . . . . . . . . . . 67
Note 36 Commitments . . . . . . . . . . . . . . . . . . . . . . . . . . . 67
Note 37 Classification of financial instruments . . . . . . . . . 68
Note 38 Information about fair value . . . . . . . . . . . . . . . . 72
Note 39 Information about related parties . . . . . . . . . . . . 73
Note 40 Operating segments . . . . . . . . . . . . . . . . . . . . . . 74
Note 41 Five-year overview . . . . . . . . . . . . . . . . . . . . . . . . 76

Financial statements 23
SBAB Annual Report 2012
Group pArENT CoMpANY
SEK million Note 2012 2011 2012 2011
Interest income 3 10,485 10,449 4,162 3,864
Interest expense 3 –8,544 –8,831 –4,032 –3,956
Net interest income/expense 1,941 1,618 130 –92
Dividends received 4 – – 17 13
Group contribution received 4 – – – 510
Commission income 5 55 60 136 126
Commission expense 5 –150 –150 –70 –69
Net income/expense from financial instruments measured at fair value/Net income/expense from financial transactions 6 –601 –349 213 –206
Other operating income 7 3 0 515 521
Total operating income 1,248 1,179 941 803
Personnel costs 8 –339 –323 –354 –325
Other expenses 9 –362 –357 –434 –370
Depreciation of property, plant and equipment and amortisation of intangible fixed assets 10 –24 –27 –15 –13
Total expenses before loan losses –725 –707 –803 –708
profit before loan losses 523 472 138 95
Loan losses, net 11 –20 –8 –34 3
operating profit 503 464 104 98
Tax 12 –140 –123 –11 –23
profit for the year 363 341 93 75
Income statement
Group pArENT CoMpANY
SEK million Note 2012 2011 2012 2011
profit for the year 363 341 93 75
other comprehensive income
Change in reclassified financial assets, after tax 34 14 28 14 28
Change in instruments used in cash-flow hedging, after tax 34 – 1 – 1
other comprehensive income, net after tax 14 29 14 29
Total comprehensive income for the year 377 370 107 104
Statement of comprehensive income

Financial statements24
SBAB Annual Report 2012
Group pArENT CoMpANY
SEK million Note 2012-12-31 2011-12-31 2012-12-31 2011-12-31
ASSETS
Cash and balances at central banks 0 0 0 0
Chargeable treasury bills and other eligible bills 13 12,860 5,949 12,860 5,949
Lending to credit institutions 14 18,269 23,454 48,435 56,412
Lending to the public 15 255,946 248,150 46,360 32,940
Change in value of interest-rate-hedged items in portfolio hedges 16 1,617 1,557 – –8
Bonds and other interest-bearing securities 17 31,452 41,556 31,452 41,556
Derivative instruments 18 12,745 17,496 11,499 13,813
Shares and participations 19 150 – 150 –
Shares and participations in joint ventures 20 – – 830 733
Shares and participations in Group companies 21 – – 9,600 9,600
Deferred tax assets 31 36 – – –
Intangible fixed assets 22 122 38 14 6
Property, plant and equipment 23 33 30 33 30
Other assets 24 238 319 76 718
Prepaid expenses and accrued income 25 962 1,201 719 899
ToTAL ASSETS 334 430 339 750 162 028 162,648
LIABILITIES AND EQuITY
Liabilities
Liabilities to credit institutions 26 17,538 21,233 2,443 9,688
Deposits from the public 27 27,654 8,769 27,654 8,769
Debt securities in issue 28 253,897 276,678 101,782 116,753
Derivative instruments 18 15,383 14,060 13,909 12,109
Other liabilities 29 361 161 356 120
Accrued expenses and prepaid income 30 3,698 4,067 835 903
Deferred tax liabilities 31 – 71 65 248
Provisions 32 86 94 – –
Subordinated debt 33 7,052 6,233 7,052 6,233
Total liabilities 325,669 331,366 154,096 154,823
Equity
Share capital 34 1,958 1,958 1,958 1,958
Legal reserve – – 392 392
Other reserves/Fair value reserve 34 –37 –51 –37 –51
Retained earnings 6,477 6,136 5,526 5,451
Profit for the year 363 341 93 75
Total equity 8,761 8,384 7,932 7,825
ToTAL LIABILITIES AND EQuITY 334,430 339,750 162,028 162,648
Memorandum items
Assets pledged for own liabilities 35 205,127 214,902 2,117 8,467
Commitments 36 39,279 34,735 59,587 53,889
Balance sheet

Financial statements 25
SBAB Annual Report 2012
Group
SEK million NoteShare
capitalother
reserves
retained earnings
and profit for the year
Total equity
opENING BALANCE, 1 January 2011 1,958 –80 6,136 8,014
Other comprehensive income, net after tax 34 29 29
Profit for the year 341 341
CLoSING BALANCE, 31 Dec 2011 1,958 –51 6,477 8,384
opENING BALANCE, 1 January 2012 1,958 –51 6,477 8,384
Other comprehensive income, net after tax 34 14 14
Profit for the year 363 363
CLoSING BALANCE, 31 December 2012 1,958 –37 6,840 8,761
Statement of changes in equity
pArENT CoMpANY
rESTrICTED EQuITY NoN-rESTrICTED EQuITY
SEK million NoteShare
capitalLegal
reserveFair value
reserve
retained earnings
and profit for the year
Total equity
opENING BALANCE, 1 January 2011 1,958 392 –80 5,451 7,721
Other comprehensive income, net after tax 34 29 29
Profit for the year 75 75
CLoSING BALANCE, 31 Dec 2011 1,958 392 –51 5,526 7,825
opENING BALANCE, 1 January 2012 1,958 392 –51 5,526 7,825
Other comprehensive income, net after tax 34 14 14
Profit for the year 93 93
CLoSING BALANCE, 31 December 2012 1,958 392 –37 5,619 7,932

Financial statements26
SBAB Annual Report 2012
Group pArENT CoMpANY
SEK million 2012 2011 2012 2011
Cash and cash equivalents at the beginning of the year 18,939 8,959 10,984 3,948
opErATING ACTIVITIES
Interest received 10,623 10,156 4,317 3,587
Commission received 48 61 140 120
Interest paid –9,093 –8,348 –4,314 –3,382
Commission paid –143 –90 –66 –43
Dividends received for shares and similar securities – – 17 113
Group contribution received – – 510 –
Recoveries on loans previously written off 3 6 3 6
Payments to suppliers and employees –709 –669 –788 –684
Income tax paid –201 –368 –174 –117
Change in subordinated receivables – – –3,301 2,062
Change in lending to credit institutions1) 3,853 –582 7,879 –1,174
Change in lending to the public –7,714 999 –13,449 2,363
Change in chargeable treasury bills and other eligible bills –6,564 473 –6,564 473
Change in bonds and other interest-bearing securities and fund units 9,635 –6,662 9,635 –6,662
Change in liabilities to credit institutions –3,695 2,976 –7,245 –287
Change in deposits from the public 18,885 2,686 18,885 2,686
Issuance of long-term funding 47,844 78,954 27,394 45,106
Repayment of long-term funding –64,433 –69,428 –37,439 –37,241
Issuance of short-term funding 98,757 121,269 98,757 121,269
Repayment of short-term funding –99,850 –121,631 –99,850 –121,631
Change in other assets and liabilities 461 –289 1,304 133
Cash flow from operating activities –2,293 9,513 –4,349 6,697
INVESTING ACTIVITIES
Sale of property, plant and equipment 0 0 0 0
Investments in property, plant and equipment and intangible fixed assets –110 –34 –26 –16
Investments in subsidiaries and joint ventures – – –25 –146
Cash flow from investing activities –110 –34 –51 –162
FuNDING ACTIVITIES
Issuance of subordinated debentures 1,000 1,000 1,000 1,000
Repayment of subordinated debentures – –499 – –499
Cash flow from funding activities 1,000 501 1,000 501
Increase/decrease in cash and cash equivalents –1,403 9,980 –3,400 7,036
Cash and cash equivalents at the end of the year 17,536 18,939 7,584 10,984
Cash and cash equivalents are defined as cash and lending to credit institutions with a maturity not later than three months from the acquisition date .1) Pertains to lending to credit institutions with a maturity of more than three months from the acquisition date .
Cash flow statement

notes 27
SBAB Annual Report 2012
Notes
Note 1 Accounting policies
The operations of SBAB Bank AB (publ), ”SBAB”, and its subsidiaries and joint ventures mainly comprise lending to private individuals, tenant-owner associations and companies in the Swedish residential mortgage market. SBAB’s offering also includes savings products. SBAB is a limited liability company that is domiciled in Stockholm County, Stockholm Municipality. The address of the Head Office is SBAB Bank AB (publ), Box 27 308, SE-102 54 Stockholm.
The Annual Report for SBAB has been prepared in accordance with the International Financial Reporting Standards (IFRS) as adopted by the EU. In addition to these accounting standards, the Swedish Financial Supervisory Authority’s regulations and general guidelines on annual accounts for credit institutions and securities companies (FFFS 2008:25), the Annual Accounts Act for Credit Institutions and Securities Companies and the Swedish Financial Reporting Board’s recommenda-tion RFR 1 Supplementary Accounting Rules for Groups were taken into consideration. The Annual Report has been prepared in accordance with the acquisition method, apart from derivatives and financial assets and liabilities measured at fair value through profit or loss, as well as hedge-accounted items. On 14 March 2013, the Board of Directors approved the financial statements for publication. They will receive final approval from the Annual General Meeting on 18 April 2013.
Amended and new accounting policies in 2012IFRS 7 – Financial Instruments: Disclosures (amendment)• New disclosure requirements were introduced for financial assets
transferred to a third party, including the remaining risk exposure. The objective is to facilitate an assessment of the risk exposure arising from the transfer of financial assets, as well as an assessment of the company’s financial position. For SBAB, the amendment gives rise to an expanded disclosure requirement concerning repos; see Note 35.The standard has been adopted by the EU and is to be applied from 1 January 2012 (financial years starting on 1 July 2011 or later).
Introduction of new accounting standards IFRS 9 – Financial Instruments• IFRS 9 Classification and Measurement was the first part of a larger
project aimed at replacing IAS 39 and was completed in 2010. IFRS 9 contains two primary measurement categories for financial assets: amortised cost and fair value. Classification occurs on the basis of the company’s business model and the characteristic properties of its contractual cash flows. For financial liabilities, most of the current rules contained in IAS 39 will be retained. Guidance in IAS 39 pertaining to impairment testing of financial assets and hedge accounting will continue to apply until IASB has completed those aspects of IFRS 9.
Introduction of the standard has been postponed and it is not expected to become mandatory until 1 January 2015, although ad-vance application is permissible. However, IFRS 9 has not yet been approved by the EU and is not expected to be approved until the sections on hedge accounting and impairment have been finalised, thus resulting in a complete standard. SBAB’s preliminary assessment is that introduction of the standard concerning classification and measurement of financial assets and liabilities will have a limited impact on its financial statements.
IFRS 10 Consolidated Financial Statements• The definition of controlling influence has been clarified but entails
no major changes in practice. The new standard is to be applied as of 1 January 2014, but is not expected to impact SBAB’s financial statements.
IFRS 11 Joint Arrangements• This standard applies to arrangements in which the part-owners
hold a joint controlling influence and significant decisions require the unanimous consent of all part-owners. Joint arrangements are classified as either joint operations or joint ventures. SBAB’s joint venture FriSpar Bolån AB is expected to remain classified as a joint
venture in the future. The proportional method will no longer be permitted and SBAB has concluded that the equity method will be used for the Group’s consolidation. This will have a minor impact on SBAB’s financial statements. The standard is to be applied as of 1 January 2014.
IFRS 12 Disclosure of Interests in Other Entities• The disclosure requirements for subsidiaries, joint arrangements and
associated companies have been compiled in one standard. Since the proportional method will no longer be permitted, and FriSpar Bolån AB will be consolidated in accordance with the equity method, disclosure requirements will be affected to a limited extent. The standard is to be applied as of 1 January 2014.
IFRS 13 Fair Value Measurement• Fair value is defined as the price that would be received to sell an
asset or the price that would be paid to transfer a liability in an orderly transaction between market participants at the measurement date. The new standard does not stipulate that any new items be measured at fair value. With regard to the items that SBAB measures at fair value, the new definition is not expected to have an impact on the financial statements. The standard is being applied as of 1 January 2013.
IAS 1 Presentation of Financial Statements• Components in other comprehensive income are divided into two
groups, depending on whether or not the components are expected to be subject to future inclusion in profit or loss. Components not subject to inclusion include actuarial gains and losses attributable to pensions, while components subject to inclusion include deferred gains and losses on cash flow hedges. Any tax accruing on each of the two groups is to be differentiated. This will have a limited impact on SBAB’s financial statements. The standard is to be applied as of 1 January 2013 (financial years beginning on or after 1 July 2012).
IAS 19 Employee Benefits• All changes to the pension provision are to be recognised immedi-
ately. The equalisation effect derived from the corridor method has been eliminated. This will result in increased volatility in the balance sheet and other comprehensive income. In addition, the calculated return on the plan assets is to be based on the discount rate, mean-ing the rate used for calculating the pension obligation.
The transitional effect arising from the discontinuation of the corri-dor method for unrecognised accumulated actuarial gains amounted to SEK 18 million on 1 January 2012 including special employer’s contributions, which implies a corresponding positive effect on equity. The new regulations also had an adverse impact of SEK 3 million on profit during 2012. The standard is being introduced on 1 January 2013 with retroactive application.
Other amendments, interpretations and annual improvements are deemed to have had no significant impact on SBAB’s financial statements.
General accounting policiesConsolidated financial statementsThe consolidated financial statements were prepared in accordance with the acquisition method and include the Parent Company SBAB and its subsidiaries.
Entities qualify as subsidiaries if they are controlled by the Parent Company, which means that the Parent Company has the power to govern the financial and operating strategies of the entity in order to obtain financial benefits from its activities. The companies included in the Group are those over which SBAB exercises the control generally accompanying a shareholding of more than 50% of the voting rights or where the Group exercises a sole controlling influence by agreement. The companies are consolidated from the date on which control is transferred to SBAB and are deconsolidated from the date on which control ceases. Intra-Group transactions and receivables and liabilities between Group companies are eliminated.

notes28
SBAB Annual Report 2012
Joint ventureBy contractual agreement, FriSpar Bolån AB is to be regarded as a joint venture and recognised in accordance with the proportional method. The proportional method entails that SBAB’s share (51%) of the company’s assets and liabilities is included in the consolidated balance sheet. The corresponding share of the company’s income and expense is included in consolidated profit or loss.
Recognition in and derecognition from the balance sheetIssued securities and all derivative instruments are recognised on the trade date, meaning the date on which the significant risks and rights are transferred between the parties. Other financial instruments are recognised on the settlement date.
A financial asset is derecognised from the balance sheet when the contractual rights to receive the cash flows from the financial asset expire and the company has transferred essentially all of the risks and rewards of ownership of the asset. A financial liability is derecognised from the balance sheet when it is extinguished, meaning when the obligation specified in the contract is fulfilled, cancelled or expires.
Recognition of income and expenseInterest income and interest expense (including interest income from impaired receivables) are recognised in accordance with the effective interest method. The calculation of the effective interest rate includes all fees paid or received between the parties to the contract, including transaction costs.
Since transaction costs in the form of remuneration to business part-ners or issue expenses attributable to the acquisition of loans constitute part of the acquisition cost of the loan, these costs are recognised in the balance sheet and included in profit or loss via net interest income over the expected maturity of the loan.
Commission income and commission expense are included in profit or loss continuously in accordance with the terms of the contract.
In the event of premature redemption of loans, the customer pays interest compensation intended to cover the cost that arises for SBAB. This compensation is recognised as income directly under the heading “Net income/expense from financial instruments measured at fair value.” Other items under this heading are described in the section “Financial instruments.”
Financial instrumentsClassificationAll financial instruments that are covered by IAS 39 and which are not subject to hedge accounting are classified in accordance with this standard in the following categories:• Financial assets measured at fair value through profit or loss• Loans and receivables• Financial liabilities measured at fair value through profit or loss • Other financial liabilitiesSBAB has not classified any assets as “Held-to-maturity investments” or as “Available-for-sale financial assets.”
Fair value measurementFair value is the amount for which an asset could be exchanged or a liability settled between knowledgeable, willing parties in an arm’s length transaction.
Measurement of the fair value of financial instruments measured at fair value and traded on an active market is based on quoted prices.
If the market for a financial instrument is not active, the fair value is established on the basis of generally accepted measurement methods. Calculations conducted in connection with measurement are based to the greatest extent possible on observable market information. The main tools used are models based on discounted cash flows. In individual cases, the calculations may also be based on assumptions or estimates.
Financial assets measured at fair value through profit or lossThe category “Financial assets measured at fair value through profit or loss” is divided into holdings held for trading and financial assets that Executive Management designated as such upon initial recognition. All of SBAB’s assets in this category are classified as held for trading and primarily encompass interest-bearing instruments. This category includes derivatives that are not subject to hedge accounting plus fund units. On the first accounting occasion, assets in this category are recognised at fair value, while related transaction costs are recognised in profit or loss.
Changes in fair value and realised gains or losses for these assets are recognised directly in profit or loss under the heading “Net income/expense from financial instruments measured at fair value,” while the effective interest rate is recognised in net interest income.
Loans and receivablesFinancial assets classified as loans and receivables are recognised at fair value at the time the loan is released plus transaction costs.
Loans and receivables are subsequently recognised at amortised cost using the effective interest method. This category consists of assets with fixed or determinable payments that are not quoted in an active market. Loan receivables consist of lending to the public and credit institutions and include associated items. The majority of lending com-prises retail loans for the funding of housing and loans to legal entities and private individuals for multi-family dwellings and commercial prop-erties. Changes in value are recognised as “Loan losses, net,” while the effective interest rate is recognised as interest income. Also refer to the section on “Loan losses and impairment of financial assets.”
From 1 July 2008, loan receivables also include the bonds (residen-tial mortgage-backed securities – RMBS) that have been reclassified from “Available-for-sale financial assets” to “Loans and receivables.” For further information, refer to Note 37.
Impairment losses are recognised as “Impairment of financial assets” while the effective interest rate is recognised as interest income.
Available-for-sale financial assetsFinancial assets that were previously included in this category pertained to the bonds that have been reclassified as “Loans and receivables.” The change in value that was recognised on the reclassi-fication date in “Other reserves/Fair value reserve” under equity will be reversed using the effective interest method in pace with the maturity of the underlying asset. This reversal will be recognised in profit or loss as interest income.
Financial liabilities measured at fair value through profit or lossThe category “Financial liabilities measured at fair value through profit or loss” is divided into financial liabilities held for trading and financial liabilities that Executive Management has designated as such upon initial recognition. All of SBAB’s liabilities in this category are classified as held for trading. The category includes derivatives not covered by hedge accounting. Liabilities in this category are initially recognised at fair value, while related transaction costs are recognised in profit or loss.
Changes in fair value and realised gains or losses for these liabilities are recognised in profit or loss under the heading “Net income/ expense from financial instruments measured at fair value,” while the effective interest rate is recognised in net interest income.
Other financial liabilitiesFinancial liabilities that are not classified as “Financial liabilities measured at fair value through profit or loss” are initially recognised at fair value with an addition for transaction costs and are subsequently recognised at amortised cost using the effective interest method. This category consists mainly of debt securities in issue, deposits from the public and liabilities to credit institutions.
Realised profit or loss from the repurchase of own liabilities affects profit or loss when incurred and is recognised under the heading “Net income/expense from financial instruments measured at fair value.”
ReposRepos are agreements where the parties have simultaneously reached agreement on the sale and repurchase of a particular security at a pre-determined price. Securities that have been provided or received according to a repo agreement are not derecognised from or not recognised in the balance sheet, respectively.
Payments received are recognised in the balance sheet as liabilities to credit institutions and payments made are recognised as lending to credit institutions. The impact on profit or loss is attributable to the difference between sale and repurchase prices and is recognised as interest income or interest expense, respectively.
Derivatives and hedge accountingDerivative instruments are used primarily to manage interest-rate and currency risk in the Group’s assets and liabilities. Derivatives are recog-nised at fair value in the balance sheet.
For economic hedges where the risk of a significant fluctuation in profit or loss is the greatest and that meet the formal hedge accounting criteria, SBAB has chosen to apply hedge accounting for hedging of the interest-rate and currency risk. There are also other economic hedges for which hedge accounting is not applied and such derivatives are classified as assets or liabilities, respectively, measured at fair value through profit or loss.

notes 29
SBAB Annual Report 2012
Fair value hedgingIn the case of fair value hedging, the derivative hedging instrument is measured at fair value at the same time as the hedged asset or liability is measured with an addition for accumulated changes in fair value attributable to the hedged risk associated with the hedged item. Changes in fair value are recognised directly in profit or loss under the heading “Net income/expense from financial instruments measured at fair value.” The effective interest rate of the hedge is recognised in net interest income.
When hedging relationships are terminated, the cumulative gains or losses are accrued adjusting the carrying amount of the hedged item in profit or loss in accordance with the effective interest method. The accrual extends over the remaining maturity of the hedged item.
The realised gain or loss arising from premature closing of a hedg-ing instrument is recognised in profit or loss under the heading “Net income/expense from financial instruments measured at fair value.”
Macro hedgeIn this type of hedging, derivative instruments are used at an aggregat-ed level to hedge structured interest-rate risks. When reporting these transactions, the “carve-out” version of IAS 39 is applied, as adopted by the EU. In the financial statements, derivative instruments designated as macro hedges are treated in the same way as other hedging instru-ments recognised at fair value.
In fair value hedging of portfolios of assets, the gain or loss attribut-able to the hedged risk is recognised under the heading “Change in value of interest-rate-hedged items in portfolio hedges” in the balance sheet. The hedged item is a portfolio of lending transactions based on the next contractual renewal date.
The hedging instrument used is a portfolio of interest-rate swaps grouped in accordance with renewal intervals based on conditions in the fixed leg of the swap.
Loan losses and impairment of financial assetsOn the balance-sheet date, an assessment takes place of whether there is any objective evidence that an individual receivable or group of receivable requires impairment. This takes place as a result of events that have occurred after the initial recognition of the asset and which have had an impact on the estimated future cash flows for the loan receivable or group of receivables in question.
Events that could lead to the loan being impaired include bankrupt-cy, suspension of payments, a composition or a court order to pay. The amount of impairment is measured as the difference between the carry-ing amount of the receivable and the present value of estimated future cash flows discounted at the effective interest rate of the receivable in accordance with the most recent interest-rate adjustment date.
The cash flows attributable to the borrower or the issuer and any use of the collateral are taken into consideration when assessing the need for impairment. Any expenses associated with the realisation of the pledge are included in the cash flow calculations. Measurement of probable loan losses or impairment of other financial assets is effected in gross amounts and, when there is a guarantee or the equivalent, this is recognised as a receivable against the counterparty. If the present value of future cash flows exceeds the carrying amount of the asset, no impairment takes place and the receivable is not regarded as doubtful. The impairment amount is recognised in profit or loss under the item “Loan losses, net” or “Impairment of financial assets” depending on the type of receivable. Refer to the paragraph on “Loans and receiva-bles” on page 28. If the impairment requirement has declined in a sub-sequent period and the decrease can objectively be attributed to an event that occurred after the impairment loss had been recognised, a reversal of a previously recognised impairment loss can be recognised in the corresponding profit or loss item.
Confirmed loan losses and provisions for probable losses, with deductions for guarantees expected to be utilised or that have been utilised plus any recoveries, are recognised as loan losses.
The term “Confirmed loan losses” refers to losses where the amounts are definite or established with a high level of probability.
Individually measured loan receivablesCorporate market loans are individually measured for impairment. Retail market loans are individually measured for impairment if there are special reasons for doing so. Loan receivables not determined to have an individual impairment requirement are included in a group of financial assets with similar credit risk characteristics and are judged on a collective basis in terms of the impairment requirement.
Collectively measured loan receivablesThe loan receivables assessed in this group are as follows:• Retail market loans not individually measured. These consist of a
large number of loans each of a limited amount and with similar credit risk characteristics.
• Individually measured loan receivables where no objective evidence of individual impairment requirements has been determined in accordance with the above information on “Individually measured loan receivables.”
Impairment of collectively measured loans is identified in two different ways:• As part of the work on Basel II, statistical models have been
produced for use in the internal ratings-based system. Adjusted in ac-cordance with the IFRS regulatory framework, groups of loans, which have been subject to events that produce a measurable negative impact on the expected future cash flows, have been identified.
• In addition, groups of loans are identified for which future cash flows have undergone a measurable deterioration due to events that have recently taken place but which have not yet had an impact on the risk classification system.
Restructured loan receivablesA restructured loan receivable is a receivable on which SBAB has made some form of concession due to deficiencies in the borrower’s solvency. Concessions granted are regarded as a confirmed loan loss. A loan that has been restructured is no longer regarded as doubtful but as a receivable with new conditions.
Individually measured bondsReceivables included in this group are the bonds (RMBS) that as of 1 July 2008 were reclassified from “Available-for-sale financial assets” to “Loans and receivables.” Each security is impairment tested individually.
MiscellaneousFunctional currencyFunctional currency is the currency used in the primary economic envi-ronments in which the Group operates. The companies included in the Group are the Parent Company, a subsidiary and a joint venture. The Parent Company’s functional currency and presentation currency is SEK. The Group’s presentation currency is SEK.
Foreign currency translation of receivables and liabilitiesForeign currency transactions are recognised by applying the exchange rate on the date of transaction, and foreign currency receiv-ables and liabilities are translated using the closing day rate. Foreign exchange gains or losses resulting from settlements of foreign currency transactions and from the translation of monetary assets and liabilities in foreign currency are recognised in profit or loss under “Net income/expense from financial instruments measured at fair value.”
LeasingExisting leases relate to normal leases for SBAB’s operations. They mainly concern office premises and office equipment and are classi-fied as operating leases.
In operating leases, lease payments are recognised as expenses in profit or loss on a straight-line basis over the lease term. Agreed future lease payments are presented in Note 9.
Property, plant and equipmentProperty, plant and equipment are recognised as an asset in the balance sheet if it is probable that future financial benefits will flow to the entity and the cost of the item can be measured reliably. Property, plant and equipment are recognised at cost less any accumulated depreciation and impairment losses.
Depreciation of property, plant and equipmentThe depreciable amount is calculated as the cost of the asset less its estimated residual value at the end of its useful life. The deprecia-ble amount is allocated on a straight-line basis over the estimated useful life of the asset, and the depreciation charge for each period is recognised in profit or loss. This means that computer hardware is depreciated over four years and other equipment over five years. The residual value and useful life of an asset are assessed annually.
Intangible fixed assetsInvestments in acquired computer software and/or software developed by SBAB are recognised at cost less any accumulated amortisation and impairment losses. Costs for the maintenance of software are expensed as they arise. Development expenditure that is directly attributable to the development and testing of identifiable and unique

notes30
SBAB Annual Report 2012
software products controlled by the Group is recognised as an intangi-ble asset when the following criteria are fulfilled:• it is technically possible to complete the software so that it can be
used,• the company intends to complete the software and use it,• it can be demonstrated how the software will generate probable
future financial benefits,• adequate technical, financial and other resources for completing the
development and for using the software are available, and• the expenditure that was attributable to the software during its devel-
opment can be reliably estimated.
Other development expenditure that does not fulfil these criteria is ex-pensed as it arises. Development expenditure that has previously been expensed may not be recognised as an asset in a later period.
Additional expenses for capitalised intangible fixed assets are recognised as an asset in the balance sheet only in cases where they increase the future financial benefits of the specific asset to which they are attributable. All other costs are expensed as they arise. Devel-opment expenditure is capitalised only in the consolidated financial statements.
Amortisation of intangible fixed assetsAmortisation is allocated on a straight-line basis over the useful life of the asset. This entails amortisation periods of four or five years. The amortisation period and amortisation method for an intangible fixed asset are reviewed at each financial year-end.
Impairment of non-financial itemsThe recoverable amount of an asset is measured when there is any indication that an asset may be impaired. Development work not yet available for use is tested annually for impairment irrespective of whether there is any indication of impairment. An asset is impaired when its carrying amount exceeds its recoverable amount. The impair-ment loss for each period is charged against profit or loss.
TaxTotal tax consists of current tax and deferred tax. Current tax comprises tax which is to be paid or received for taxable earnings during the cur-rent year and adjustments of current tax for previous years. Accordingly, for items recognised in profit or loss, the related tax effects are also recognised in profit or loss. Tax effects of items recognised in other comprehensive income or equity are recognised in other comprehen-sive income or equity.
Deferred tax assets and tax liabilities are measured according to the balance sheet method on the basis of temporary differences that arise between the carrying amount and the tax base of an asset or liability.
Deferred tax assets are recognised for unutilised tax losses to the extent that it is probable that the carryforwards can be used to offset future taxable profit. Deferred tax is calculated in accordance with the tax rate applicable at the time of taxation.
Cash and cash equivalentsCash and cash equivalents are defined as cash balances and lending to credit institutions with a maturity not later than three months from the acquisition date.
PensionsThe Group has both defined-contribution and defined-benefit pension plans. For the defined-contribution pension plans, fixed fees are paid to an independent unit, following which no additional obligations arise. The defined-benefit plan stipulates an amount for the pension benefit that an employee will receive on retirement based on age, period of service and salary. Pension costs for defined-contribution plans are expensed on a continuous basis in pace with vesting by the individual employee.
The provision recognised in the balance sheet for defined-benefit pension plans is the present value of the defined-benefit pension obligation at the end of the reporting period less the fair value of the plan assets, adjusted for unrecognised actuarial gains and losses, as well unrecognised costs for service during prior periods.
The defined-benefit pension obligation is calculated annually by independent actuaries applying the projected unit credit method.
Actuarial gains and losses resulting from experience-based adjust-ments and changes affecting actuarial assumptions exceeding the higher of 10% of the fair value of the plan assets and 10% of the present value of the defined-benefit obligation are recognised as expense or income over the employee’s estimated average remaining period of service.
Segment reportingA segment is a part of a business for which independent financial information is available, that conducts business operations from which income can be generated and expenses incurred and whose opera-tions are regularly assessed by the company’s chief operating decision maker as a basis for decisions regarding the allocation of resources to segments and an assessment of the segment’s results. At SBAB, the CEO is the function that is responsible for allocating resources and assessing the result of the operating segment.
Parent Company accounting policiesThe Parent Company, SBAB AB (publ), applies statutory IFRS, which means that the Annual Report has been prepared in compliance with IFRS subject to the additions and exceptions that ensue from the Swed-ish Financial Reporting Board’s recommendation RFR 2 Accounting for Legal Entities, the Annual Accounts Act for Credit Institutions and Securities Companies and the Swedish Financial Supervisory Authority’s regulations and general guidelines on annual accounts for credit institu-tions and securities companies (FFFS 2008:25).
Differences compared with the GroupThe main differences between the accounting policies of the Group and those of the Parent Company are shown below:
Presentation of income statement and balance sheetThe Parent Company complies with the presentation standards for in-come statements and balance sheets stipulated in the Annual Accounts Act for Credit Institutions and Securities Companies, which entails a different presentation of equity. The Parent Company’s legal reserve is recognised in the Group as retained earnings, while the Parent Compa-ny’s fair value reserve is included in the Group’s other reserves.
PensionsThe Swedish Pension Obligations Vesting Act and regulations issued by the Swedish Financial Supervisory Authority contain rules requiring a different method of recognising defined-benefit pension plans com-pared with the manner stipulated in IAS 19. Application of the Swedish Pension Obligations Vesting Act is a prerequisite for tax deductibility of the pension payments. In view of this, RFR 2 states that the regula-tions of IAS 19 in terms of defined-benefit pension plans need not be applied by the legal entity.
SubsidiariesParticipations in subsidiaries are recognised in the Parent Company in accordance with the cost method.
DividendsDividends received from subsidiaries are recognised in profit or loss.
Anticipated dividends from subsidiaries are recognised in cases where formal decisions have been taken in the subsidiaries or where the Parent Company otherwise has full control over the decision-making process before it publishes its financial statements.
Group contributions Group contributions (including the tax effect) paid to and received from subsidiaries are recognised in profit or loss.
Critical accounting estimates and judgementsSignificant estimates in the application of SBAB’s accounting policiesSBAB owns 51% of the shares of FriSpar, although the shareholders’ agreement between SBAB, Sparbanken Öresund AB (publ) and Sparbanken Syd states that SBAB cannot solely govern the financial and operating policies for the company. In addition, unanimity among all part-owners is required for valid decisions in all important matters. Accordingly, SBAB does not have a controlling influence and Executive Management has arrived at the assessment that FriSpar is to be recognised as a joint venture. At the Group level, this entails a marginal effect on net interest income, total assets and capital adequacy com-pared with recognising FriSpar as a subsidiary.
Critical assumptionsTo prepare the annual accounts in compliance with statutory IFRS, it is required that Executive Management use estimates and judgements based on historical experience and assumptions that are considered to be reasonable and fair. These estimates affect the carrying amounts of assets, liabilities and off-balance sheet commitments, as well as income and expenses presented in the Annual Report. Subsequently, the actual outcome may differ to some extent from the estimates made.

31notes
SBAB Annual Report 2012
1) Retail refers to all lending to the public comprising single-family dwellings, holiday homes and tenant-owner rights. This means, for example, that a private individual with loans for a multi-family dwelling is regarded as a Corporate client.
Note 2 Risk management and capital adequacy
Note 2, Risk management and capital adequacy is divided into the following segments:a) Credit risk in lending operations b) Credit risk in treasury operations c) Liquidity riskd) Market risk e) Operational risk f) Business risk g) Concentration riskh) Internal capital adequacy assessment i) Capital adequacy
Note 2a Risk management – Credit risk in lending operations
Credit risk in the lending operations is the risk that the counterparty is unable to fulfil its payment obligations. Credit risk arises in conjunction with loans and loan commitments, as well as in connection with chang-es in the value of pledged assets entailing that these no longer cover the Group’s receivables. Credit risk also arises in finance operations (Note 2b).
The credit risk in the lending operations is restricted by credit limits decided on for various customers or customer groups. The credit risk is also managed through a credit-granting process, whereby the ability of potential borrowers to make their interest payments and pay am-ortisation is analysed. The loans that have been acquired have been granted only to borrowers who are judged to be able to pay interest and amortisation in an interest-rate situation that comfortably exceeds the rate prevailing when the loan decision is taken. Furthermore, risk classification is based on the internal ratings-based approach (IRB approach) for the analysis of the credit risk for new and existing cus-tomers in the loan portfolios. SBAB applies the IRB approach for retail loans and the foundation IRB approach (FIRB approach) for Corporate loans. The Swedish Financial Supervisory Authority has examined the company’s use of the IRB approaches and judged them to be reliable. The IRB approach is used for assessing the credit risk associated with each part of the company’s individual exposures to retail or Corporate customers that have a mortgage deed or a tenant-owner right as collateral. For other types of exposures, the standardised approach is used for measurement of credit risk. For cases in which external ratings are used, the lowest rating from either Moody’s or Standard & Poor’s is selected. The credit risk models assess the following parameters:
• Probability of default by the customer – Probability of default (PD)• Loss amount in the event of default – Loss given default (LGD)• The part of the off-balance sheet commitment that is utilised in the
event of default – Credit conversion factor (CCF)• The expected exposure in the event of default – Exposure at default (EAD)• The expected loan loss (EL) is measured using the formula EL =
PD*LGD*EAD
On the basis of these parameters, customers can be ranked accord-ing to risk, and the expected and unexpected loss can be estimated. After assessment, the exposure is allocated to one of eight risk classes for retail and Corporate loans, of which the eighth class comprises customers in default. The development of customers in high risk classes is monitored thoroughly and, when necessary, the exposure is man-aged actively by credit monitoring personnel in the credit division. The developed models are validated annually and calibrated as the need arises. The validation conducted in 2012 resulted in minor adjustments to SBAB’s CCF model for retail exposures, as well as to the PD model, with property as collateral.
In the financial statements, the calculated loan loss (EL) according to IRB models differs from the provision for probable loan losses. The calculation of EL according to Basel Pillar 1 is regulated by the Capital Adequacy and Large Exposures Act (2006:1371) and by the Swedish Financial Supervisory Authority’s regulations and general guidelines governing capital adequacy and large exposures (FFFS 2007:1). According to these regulations, the risk associated with each individual loan is to be estimated over a longer period of time using a statistical model. The management of the loss arising in the financial statements is regulated by IAS 39, according to which, assets are to be impaired when there are objective grounds for impairment due to the occurrence of one or more events that have a negative impact on the future cash flows. EL for loans calculated according to IRB models amounts to SEK 400 million. The provision for corresponding loans according to the financial statements is SEK 261 million. Since EL exceeds the provision posted in the financial statements, the difference is deducted when calculating the capital base in the capital adequacy calculation.
In connection with the quantitative assessment in the Corporate market1), a systematic qualitative assessment is conducted based on the internal loan regulations by responding to a number of questions. This enables a more uniform risk assessment founded on a larger amount of data.
During 2012, SBAB applied for permission to place exposures to tenant-owner associations with sales of less than EUR 50 million and full collateral in residential property in the “retail exposures” class, for which SBAB has a permit to apply advanced IRB. In February 2013, per-mission was received to change the definition of the retail exposures class and to change the method for calculating LGD for exposures to tenant-owner associations.
Collateral in the lending operationsFor loans granted by SBAB, adequate collateral must normally be provided. Adequate collateral primarily refers to mortgage deeds in residential properties or shares in tenant-owner associations within a maximum of 75–85% of the market value. The 85% level applies only provided that collateral can be obtained with priority right and that the customer is included in a lower risk class. The lower risk classes for retail customers, “Retail-R”, comprise the levels R1–R4, while the lower risk classes for Corporate customers, “Corporate-C”, comprise the levels C1–C4. In other cases, the loan-to-value ratio of 75% applies. In addition to collateral in the form of mortgage deeds in residential property or shares in tenant-owner associations, it is possible to grant loans against, inter alia, collateral in the form of a government guaran-tee, municipal guarantee, securities, bank guarantee and deposits in a Swedish bank. SBAB does not hold any collateral which has been taken over to protect a receivable. Lending to the public accounts for 77% (73) of SBAB’s overall assets.
Without taking collateral received or any other forms of credit enhancement into account, the maximum credit risk exposure for the lending operations matches the carrying amount and amounts to SEK 248,542 million (248,542) (loans plus accrued interest).
The financial effect of collateral received is illustrated in the diagram below, which shows loans in relation to the market value of underlying collateral for loans secured on collateral comprising mortgage deeds or shares in tenant-owner associations. The floor area in the diagram corresponds to the lending volume and shows that SBAB has favoura-ble collateral, since the floor area is greatest in connection with lower loan-to-value ratios. The data encompasses 97% (96) of the company’s total lending to the public. Since 95% (95) of total lending is secured on collateral in mortgage deeds or shares in tenant-owner associations within 75%, the quality is judged to be highly favourable.
Measurement of loan receivablesThe area that primarily entails a risk of causing an adjustment to recog-nised assets and liabilities in the next financial year is the measure-ment of loan receivables.
In the case of individually measured loan receivables, the most critical assessment, which also contains the most uncertainty, is the estimate of the future cash flow that the customer will generate. For collectively measured loan receivables, the estimates of future cash flows are based partly on assumptions concerning how observable data may result in loan losses. See also the section “Loan losses and impairment of financial assets” above. The portion of the liquidity portfolio that pertains to RMBS is also measured as a loan receivable. Here too the most critical assumption involves estimating future cash flow. Models are used to enable measurements to be performed in an appropriate manner.
Recognition of pensionsMeasurement of the Group’s pension obligations is based on a number of actuarial and financial assumptions that have a material impact on carrying amounts. SBAB uses the yield on mortgage bonds for the discounting of pension obligations, since a functioning market for mortgage bonds exists in Sweden. The assumptions upon which the measurement is based, as well as a sensitivity analysis, are presented in Note 32.
events after the balance-sheet dateSee the section of the Administration Report entitled “Results” on page 19.

notes32
SBAB Annual Report 2012
Loans in relation to the market value of underlying collateral (LtV) for loans secured on collateral comprising mortgage deeds or tenant-owner rights
70 80 90 100 120110 130 >15014050 600 10 3020
Lending volume
LTV %
Hushåll¹)
40 70 80 90 100 120110 130 >15014050 600 10 3020
Lending volume
LTV %
Företagsmarknad¹)
40
Retail1) Corporate market
Loan portfolio allocated by risk class – Retail
2012 2011
Risk class R1) Lending Provisions/lending in respective risk class Lending
Provisions/lending in respective risk class
R0 – – – –
R1 14.1% 0.0% 24.6% –
R2 24.7% 0.0% 27.0% –
R3 40.0% 0.0% 27.3% –
R4 10.5% 0.0% 10.0% –
R5 6.1% 0.5% 5.1% 0.5%
R6 2.7% 1.2% 3.8% 1.3%
R7 1.6% 3.9% 1.8% 4.0%
R8 0.3% 12.5% 0.4% 12.1%
100.0% 0.2% 100.0% 0.2%
1) R = Retail market.
segment Under 50% Under 75% Under 100%exposure-weighted
average LtV
Corporate 80.6% 98.5% 99.7% 58.5%
Retail 73.0% 93.2% 99.1% 68.8%
Note 2a Risk management – Credit risk in lending operations, Cont’d
Loan portfolios in lending operations allocated by risk classEvery customer is allocated to a risk class. Customers with individually reserved loans are always allocated to the worst Corporate market risk class (C8) or the worst retail market risk class (R8). Loans covered by collective provisions are obtained for the Corporate market from risk classes C6–C8, and collectively impaired retail market loans comprise loans in risk classes R5–R8. Risk class C0 comprises loans to coun-terparties with a 0% risk weight (Swedish municipalities). Transaction costs of SEK 34 million (26), which were attributable to the loans, are distributed in the table on a pro rata basis.

notes 33
SBAB Annual Report 2012
Not 2a Risk management – Credit risk in lending operations, Cont’d
Loan portfolio allocated by risk class – Corporate market, including tenant-owner associations
2012 2011
Risk class C1) Lending Provisions/lending in respective risk class Lending
Provisions/lending in respective risk class
C0 0.2% – 0.4% –
C1 63.2% – 65.8% –
C2 22.8% 0.0% 21.3% –
C3 8.9% 0.0% 7.0% –
C4 2.3% 0.1% 1.9% –
C5 1.8% 0.1% 2.5% –
C6 0.4% 2.4% 0.7% 3.9%
C7 0.2% 7.3% 0.0% 11.9%
C8 0.2% 21.5% 0.4% 8.5%
100.0% 0.1% 100.0% 0.1%
1) C=Corporate market
Lending to the public and credit institutionsThe table below shows loans to the public and credit institutions in three categories based on the status of the borrower’s payments:
• Without past due unpaid amounts or provisions – the borrower has fulfilled its payment obligations in accordance with the terms of the loans
• With unpaid amounts more than five days past due – the borrower has not fulfilled its payment obligations
• With individual provisions, doubtful receivables
For individually reserved loan receivables, an individual assessment of the loan’s future cash flow is conducted in conjunction with an estimate of the market value of the underlying collateral, which constitutes the basis for the individual provision. For collective provisions, a change has occurred in the risk associated with a group of loans, but this change cannot be traced to an individual customer. The table provides
Lending to the public and credit institutions based on the status of the borrower’s payments
2012 2011
seK million Public Credit institutions Public Credit institutions
❶ Current loans without past due unpaid amounts or provisions 255,117 18,269 247,179 23,454
❷ Loans with unpaid amounts >5 days past due 1,098 1,239
❸ Loans with individual provisions 67 81
total outstanding loans 256,282 18,269 248,499 23,454
Individual provisions 54 50
Collective provisions Corporate market 27 31
Collective provisions retail market 255 268
total provisions 336 349
total lending after provisions 255,946 18,269 248,150 23,454
Guarantees for loans with individual provisions – 0
Guarantees for loans with collective provisions, Corporate market 4 10
Guarantees for loans with collective provisions, retail market 64 58
total guarantees 68 68
total lending after provisions and guarantees 256,014 18,269 248,218 23,454
a specification of provisions without taking guarantees into account, as well as a specification of the guaranteed amount for each group of provisions. The value of collateral and guarantees largely refers to the value of mortgage deeds or tenant-owner rights and to a lesser extent to the value of loan guarantees from the Swedish National Housing Credit Guarantee Board (currently part of the National Board of Housing, Building and Planning), insurance companies and banks that have been recognised at the assessed value of what is expected to be received in the event of insolvency.
At December 31, 2012, total provisions (individual and collective) amounted to SEK 268 million (281) after a deduction for guarantees, which corresponds to 0.1% (0.1) of the loan portfolio, of which individu-ally assessed loans accounted for SEK 54 million (50). At year-end 2012, individual provisions after deduction for guarantees had increased SEK 4 million (decrease: 22) compared with the preceding year, and accounted for 81% (62) of doubtful receivables, which amounted to SEK 67 million (81). No need for provisions arose for lending to credit institutions.

notes34
SBAB Annual Report 2012
Lending to the public by segment – Current loans without past due unpaid amounts or provision
2012
Risk class seK million
single- family
dwellings and holiday
homes
tenant- owner rights
tenant- owner
associations
Private multi-family
dwellings
Municipal multi-family
dwellingsCommercial
properties
Loans without formal
collateral total
C/R0 – – – – 216 – – 216
C/R1 16,775 6,119 30,763 19,326 3,839 5,284 6 82,112
C/R2 26,239 13,863 17,102 3,119 265 864 55 61,507
C/R3 37,347 27,363 4,793 2,846 190 481 319 73,339
C/R4 9,591 7,333 1,235 583 251 56 157 19,206
C/R5 5,641 4,077 957 239 34 443 127 11,518
C/R6 2,391 1,831 222 103 – – 60 4,607
C/R7 1,458 750 43 149 – – 28 2,428
C/R8 51 20 42 70 – – 1 184
total 99,493 61,356 55,157 26,435 4,795 7,128 753 255,117
2011
Risk class seK million
single- family
dwellings and holiday
homes
tenant- owner rights
tenant- owner
associations
Private multi-family
dwellings
Municipal multi-family
dwellingsCommercial
properties
Loans without formal
collateral total
C/R0 – – – – 422 – – 422
C/R1 26,184 11,018 30,467 22,295 4,766 6,292 23 101,045
C/R2 25,085 15,738 15,364 3,215 526 1,543 72 61,543
C/R3 24,406 16,799 4,390 1,804 291 303 144 48,137
C/R4 8,818 6,183 1,175 397 30 38 79 16,720
C/R5 4,556 3,111 1,300 586 72 372 50 10,047
C/R6 3,329 2,385 247 405 12 – 44 6,422
C/R7 1,486 906 30 18 – – 16 2,456
C/R8 63 13 263 48 – – 0 387
total 93,927 56,153 53,236 28,768 6,119 8,548 428 247,179
❶ Current loans without past due unpaid amounts or provisionsThe allocation of loans per risk class for the loans that had neither past due unpaid amounts nor individual provisions shows that 93% (92) are in the risk classes C0/R1–C4/R4. The allocation includes total transaction costs of SEK 34 million (26), which were allocated on a pro rata basis. The costs derive mainly from single-family dwellings and tenant-owner rights.
Note 2a Risk management – Credit risk in lending operations, Cont’d

notes 35
SBAB Annual Report 2012
❷ Loans with unpaid amounts more than five days past dueThe table below shows loans with past due receivables without individ-ual provisions distributed by past due amortisation, past due accrued interest and past due principal for which notice of termination has been given. Furthermore, for the sake of completeness, “principal and accrued interest not yet past due” are also stated for these loans. All amounts are distributed by segment. For loans with past due amounts in several time intervals, the part that is not past due is shown, where relevant, in the oldest time interval.
At year-end 2012, 99.5% (99.5) of lending had no past due unpaid amounts and was not assessed as doubtful. Of SBAB’s loan portfolio
Lending to the public by segment – Loans with unpaid amounts more than five days past due
2012
seK million
single-family dwellings
and holiday homes
tenant-owner rights
tenant-owner associations
Private multi-family
dwellings
Municipal multi-family
dwellingsCommercial
properties
Loans without formal
collateral total
5–30 days past due1)
Past due amortisation 5.7 5.8 5.9 8.2 – – 0.1 25.7
Past due accrued interest 1.4 0.6 0.3 0.1 – – 0.0 2.4
Terminated past due principal, excl. past due amortisation 1.4 0.4 – – – – – 1.8
Principal not past due 371.1 155.4 30.9 5.9 – – 3.9 567.2
Accrued interest not past due 0.1 0.0 0.1 0.0 – – 0.0 0.2
31–60 days past due
Past due amortisation 0.1 1.0 0.0 2.2 – – 0.0 3.3
Past due accrued interest 0.6 0.3 0.0 0.0 – – 0.0 0.9
Terminated past due principal, excl. past due amortisation 1.9 0.8 – 1.8 – – – 4.5
Principal not past due 92.0 46.3 5.2 0.4 – – 1.0 144.9
Accrued interest not past due 12.4 0.0 0.0 0.0 – – 0.0 12.4
61–90 days past due
Past due amortisation 0.1 0.3 – – – – – 0.4
Past due accrued interest 0.5 0.2 – – – – – 0.7
Terminated past due principal, excl. past due amortisation 5.7 1.5 – – – – – 7.2
Principal not past due 51.6 15.9 – – – – – 67.5
Accrued interest not past due 0.0 0.0 – – – – – 0.0
> 90 dagar days past due
Past due amortisation 1.9 0.8 – 0.0 – 0.0 0.3 3.0
Past due accrued interest 6.1 2.1 – 0.0 – 0.0 0.1 8.3
Terminated past due principal, excl. past due amortisation 127.9 54.9 – 0.2 – 0.5 1.0 184.5
Principal not past due 65.8 21.9 – – – – – 87.7
Accrued interest not past due 0.2 0.1 – 0.0 – 0.0 – 0.3
total past due
Total past due amortisation 7.8 7.9 5.9 10.4 – 0.0 0.4 32.4
Total past due accrued interest 8.6 3.2 0.3 0.1 – 0.0 0.1 12.3
Total terminated past due principal, excl. past due amortisation 136.9 57.6 – 2.0 – 0.5 1,0 198,0
Total principal not past due 580.5 239.5 36.1 6.3 – – 4,9 867,3
Total accrued interest not past due 12.7 0.1 0.1 0.0 – 0.0 – 12,9
total lending for loans with past due receivables without provisions 725.2 305.0 42.0 18.7 – 0.5 6,3 1,097.7
Value of collateral and guarantees 692.8 291.2 42.0 18.1 – 0.5 – 1,044.6
totalling SEK 256 billion (248), SEK 1,098 million (1,239) of the principal has past due unpaid amounts.
When calculating the value of collateral, the entire loan-to-value ratio for mortgage deeds or tenant-owner rights within the market value was included together with the entire municipal guarantee, government loan guarantee and bank guarantee. The value of the mortgaged collateral is based on the market value of the properties pledged as collateral for the corresponding loans. The market value is monitored regularly and refers to the most probable price in a sale on the open property market on the measurement date.
Note 2a Risk management – Credit risk in lending operations, Cont’d
1) For the time interval, amounts past due by five days or less are not taken into consideration to ensure that the analysis is not distorted by payments delayed because the payment date is a holiday.

notes36
SBAB Annual Report 2012
Lending to the public by segment – Loans with unpaid amounts more than five days past due
2011
seK million
single-family dwellings
and holiday homes
tenant- owner rights
tenant- owner
associations
Private multi-family
dwellings
Municipal multi-family
dwellingsCommercial
properties
Loans without formal
collateral total
5–30 days past due1)
Past due amortisation 6.8 2.5 2.3 0.5 – – 0.0 12.1
Past due accrued interest 1.2 0.6 0.3 0.9 – – 0.0 3.0
Terminated past due principal, excl. past due amortisation 2.8 – – – – – – 2.8
Principal not past due 278.0 150.0 55.6 185.2 – – 1.2 670.0
Accrued interest not past due 0.1 0.1 0.1 0.6 – – 0.0 0.9
31–60 days past due
Past due amortisation 0.1 0.1 – – – 0.0 0.0 0.2
Past due accrued interest 0.7 0.3 – 0.4 – 0.0 0.0 1.4
Terminated past due principal, excl. past due amortisation 2.4 0.5 – – – 0.0 – 2.9
Principal not past due 100.8 40.3 – 84.0 – 0.5 0.5 226.1
Accrued interest not past due 0.0 0.0 – 0.2 – 0.0 0.0 0.2
61–90 dagar days past due
Past due amortisation 0.1 0.0 – 0.0 – – – 0.1
Past due accrued interest 0.6 0.2 – 0.0 – – – 0.8
Terminated past due principal, excl. past due amortisation 12.0 1.5 – – – – – 13.5
Principal not past due 48.0 21.3 – 0.3 – – – 69.6
Accrued interest not past due 0.0 0.0 – – – – – 0.0
> 90 dagar days past due
Past due amortisation 2.2 0.8 – 0.3 – – 0.0 3.3
Past due accrued interest 3.9 1.6 – 0.6 – – 0.0 6.1
Terminated past due principal, excl. past due amortisation 68.0 39.0 – 4.4 – – 0.2 111.6
Principal not past due 76.9 28.5 – 21.6 – – 0.3 127.3
Accrued interest not past due 0.2 0.1 – 0.1 – – 0.0 0.4
total past due
Total past due amortisation 9.2 3.4 2.3 0.8 – 0.0 0.0 15.7
Total past due accrued interest 6.4 2.7 0.3 1.9 – 0.0 0.0 11.3
Total terminated past due principal, excl. past due amortisation 85.2 41.0 4.4 – 0.0 0.2 130.8
Total principal not past due 503.7 240.1 55.6 291.1 – 0.5 2.0 1,093.0
Total accrued interest not past due 0,3 0.2 0.1 0,9 – 0.0 0.0 1.5
total lending for loans with past due receivables without provisions 598.1 284.5 57.9 296.3 – 0.5 2.2 1,239.5
Value of collateral and guarantees 586.1 267.2 57.9 296.0 – 0.0 0.0 1,207.2
1) For the time interval, amounts past due by five days or less are not taken into consideration to ensure that the analysis is not distorted by payments delayed because the payment date is a holiday.
Note 2a Risk management – Credit risk in lending operations, Cont’d

notes 37
SBAB Annual Report 2012
❸ Loans with individual provisions (doubtful receivables)Doubtful loan receivables are those for which a provision has been made on the basis of an individual risk assessment. Doubtful loan receivables accounted for 0.03% (0.03) of SBAB’s total lending. For tenant-owner associations, doubtful receivables decreased, while an increase occurred for loans to private multi-family dwellings.
Lending to the public by segment – loans with individual provisions (doubtful receivables)
2012
seK million
single- family
dwellings and holi-
day homes
tenant- owner rights
tenant-owner associations
Private multi-family
dwellings
Municipal multi-family
dwellingsCommercial
properties
Loans without formal
collateral total
Doubtful receivables 9 16 – 42 – – – 67
Individual provision, corporate market – – – –34 – – – –34
Individual provision, retail market –6 –14 – – – – – –20
Doubtful receivables, net 3 2 – 8 – – – 13
Calculated value of guarantees – – – – – – – –
Doubtful receivables with pledged guarantees taken into consideration 3 2 – 8 – – – 13
2011
seK million
single- family
dwellings and holi-
day homes
tenant- owner rights
tenant-owner associations
Private multi-family
dwellings
Municipal multi-family
dwellingsCommercial
properties
Loans without formal
collateral total
Doubtful receivables 4 17 44 16 – – – 81
Individual provision, corporate market – – –24 –10 – – – –34
Individual provision, retail market –4 –12 – – – – – –16
Doubtful receivables, net 0 5 20 6 – – – 31
Calculated value of guarantees – – – 0 – – – 0
Doubtful receivables with pledged guarantees taken into consideration 0 5 20 6 – – – 31
Restructured receivablesRestructured receivables entail that the borrower has been granted some form of concession due to a deterioration of his/her financial position or because he/she has encountered other financial problems. After the loans have been restructured, they are considered satisfactory on the basis of the new terms.
Restructuring of a loan receivable may entail that:• the terms of the loan are modified by terms that are not normal
market terms,• the borrower partly repays the loan by handing over various assets,• the borrower agrees to convert part of the loan receivable into an
ownership share, or• the borrower is replaced or supplemented by a new borrower.
Carrying amount of renegotiated loans by segment
seK million 2012 2011
Single-family dwellings and holiday homes
6 9
Tenant-owner rights 1 2
Tenant-owner associations 10 76
Private multi-family dwellings – 6
Municipal multi-family dwellings – –
Commercial properties – –
Loans without formal collateral – –
total 17 93
Carrying amount of financial assets that would otherwise have been recognised as past due or impaired and whose terms have been renegotiated.
Note 2a Risk management – Credit risk in lending operations, Cont’d

notes38
SBAB Annual Report 2012
Limit utilisation
GRoUP PARent CoMPAnY
seK million 2012 2011 2012 2011
Rating category
Limit
Utilised limit
Limit
Utilised limit
Limit
Utilised limit
Limit
Utilised limit
AAA 0 0 0 0 0 0 0 0
AA– to AA+ 5,450 1,626 6,500 2,062 5,450 655 6,500 1,282
A– to A+ 10,885 2,702 12,885 2,695 10,885 2,152 12,885 1,206
Below A– 2,400 151 – – 2,400 3 – –
Unrated – – – – – – – –
total 18,735 4,479 19,385 4,757 18,735 2,810 19,385 2,488
Distribution of chargeable treasury bills, bonds and other interest-bearing securities by rating category
2012
Rating category seK million
Covered bonds RMBs
Government- guaranteed
securities
Inter- governmental
entities
non-governmen-tal public sector
entities total
AAA 16,911 1,355 16,955 1,537 3,683 40,441
AA– to AA+ 273 35 – – – 308
A– to A+ 134 1,952 – – – 2,086
Below A– – 1,477 – – – 1,477
total 17,318 4,819 16,955 1,537 3,683 44,312
Geographical distribution of chargeable treasury bills, bonds and other interest-bearing securities
Carrying amount securities seK million
2012
sweden other eU other total
Covered bonds 13,815 2,306 1,196 17,317
RMBS – 4,391 428 4,819
Government- guaranteed securities 5,613 11,241 102 16,956
Supranational and sovereign agencies – 1,537 – 1,537
Non-governmental public sector entities 3,561 122 – 3,683
total at 31 December 2012 22,989 19,597 1,726 44,312
total at 31 December 2011 25,468 21,094 944 47,506
Note 2b Credit risk in treasury operations
In the treasury operations, credit risk arises when the counterparty is unable to fulfil its payment obligations. Credit risk in the treasury op-erations arises in the form of counterparty credit risk for the derivative contracts entered into by the SBAB Bank Group for the purposes of managing financial risk and in the form of investment risk resulting from investments in the liquidity portfolio and investments of surplus liquidity.
The table shows the utilised limit and the limit, respectively, at an aggregate level per rating category, with each counterparty placed in relation to its lowest rating, for SBAB’s counterparties which are banks and credit institutions. The table includes investments, derivative con-tracts and repo contracts. At Group level, the limit is set by the Credit Committee within the scope of the rating-related framework established by the Board. For counterparties who are also loan customers, the limit is to be coordinated with the credit limit. A limit per counterparty can be established for a maximum period of one year before a new assessment must be made. The decisions of the Credit Committee are to be reported to the Board at the following Board meeting. All of SBAB’s counterparties have a rating. Individual limits for investment and
counterparty exposure may, as a main rule, not exceed 15% of SBAB’s capital base. Excepted from this are certain Nordic counterparties for whom the maximum limit may amount to the equivalent of 20% of the capital base. The current rating of individual counterparties issued by Moody’s or Standard & Poor’s is an additional restriction in establishing limits. The higher the rating of a counterparty, the larger the exposure that can be permitted in relation to SBAB’s capital base.
The table below shows an analysis of chargeable treasury bills, bonds and other interest-bearing securities distributed in accordance with the lowest rating at 31 December 2012 based on Standard & Poor’s rating or equivalent.

notes 39
SBAB Annual Report 2012
Note 2b Credit risk in treasury operations, Cont’d
Counterparty credit riskCounterparty risk is the risk that SBAB’s financial counterparties cannot fulfil their commitments under concluded derivative contracts and mainly comprises exposures to leading banks. This exposure is pre-dominantly covered by collateral agreements, where the counterparty posts collateral to reduce the exposure. In accordance with the finance directive, the credit-risk limit is established by SBAB’s Credit Committee for all counterparties in the finance operations, with the exception of the Swedish state and companies included in the SBAB Group, for which no credit limits are established.
Liquidity portfolioThe SBAB Group’s liquidity portfolio primarily comprises liquid, inter-est-bearing securities with a high rating and is intended to reduce the Group’s liquidity risk. Holdings in securities are limited by asset class and by country, respectively, and must have the highest rating upon acquisition.
Securities holdings also constitute an integrated part of the total credit risk utilisation for each issuer/counterparty. Holdings in the port-folio are long-term and amounted to SEK 44.0 billion at 31 December 2012, with an average maturity of 3.61 years. At the same date, 91% of the portfolio’s value had a rating of Aaa from Moody’s or AAA from Standard & Poor’s. The various asset classes in the portfolio are:
• Securities issued by central governments, SEK 12.5 billion
• Securities guaranteed by central governments, SEK 4.1 billion• Securities issued by supranational and sovereign agencies (SSA),
SEK 1.6 billion• Securities issued by public sector entities (PSE), SEK 3.7 billion • European covered bonds, SEK 17.6 billion• European and Australian residential mortgage-backed securities
(RMBS), SEK 4.4 billion
In the liquidity portfolio, holdings of RMBS are classified as “Loans and receivables” and other holdings are “Securities measured at fair value through profit or loss.”
Maximum credit risk exposure in the treasury operations
Without taking into account collateral received
or other credit enhancements
taking into account collateral received
or other credit enhancements
seK million 2012 2011 2012 2011
Lending to credit institutions 22,437 18,269 23,454
Chargeable treasury bills and other eligible bills 12,860 2,118 12,860 2,118
Bonds and other interest-bearing securities 31,452 45,387 31,452 45,387
Derivative instruments 12,745 17,496 9,370 13,026
Maximum credit risk exposure at 31 December 70,818
87,438 71,951 83,986
To limit the potential counterparty credit risk associated with deriva-tive transactions involving non-standardised derivative instruments that are not cleared by clearing organisations approved by the Swedish Financial Supervisory Authority (in accordance with FFFS 2007:1), a framework agreement is to be entered into with the counterparty. Where appropriate, such framework agreements, known as ISDA Mas-ter Agreements, or similar agreements have been supplemented with associated collateral agreements, known as Credit Support Annexes (CSAs). A CSA must always be established for counterparties entering into derivative contracts with SCBC.
Counterparty credit risk is reconciled on a daily basis for all coun-terparties. CSAs are reconciled on a daily basis or on a weekly basis if a collateral agreement exists. When collateral agreements exist, collateral is transferred to reduce the exposure. Wherever applicable, the posted and received collateral takes the form of cash with a trans-fer of title which entitles the party that receives the collateral to use the collateral in its operations.
Collateral posted and received under collateral agreements, 31 December 2012
seK million
Company Posted Received
SBAB 4,503 437
SCBC – 2,934
FriSpar Bolån – –

notes40
SBAB Annual Report 2012
Liquidity reserve
DIstRIBUtIon BY CURRenCY
seK million 31 Dec 2012 seK eUR UsD other
Cash and balances from central banks – – – – –
Balances from other banks – – – – –
Securities issued or guaranteed by central governments, central banks or multinational development banks 18,233 4,989 11,435 1,007 802
Securities issued or guaranteed by municipalities or non-governmental public sector entities 3,724 3,295 – 429 –
Covered bonds issued by others 17,617 12,538 4,745 334 –
Own covered bonds – – – – –
Securities issued by non-financial companies – – – – –
Securities issued by financial companies (excl. covered bonds) 4,391 – 4,047 103 241
Other securities – – – – –
43,965 20,822 20,227 1,873 1,043
Total liquidity portfolio – – – – –
total 43,965 20,822 20,227 1,873 1,043
Distribution by currency 48% 46% 4% 2%
SBAB’s liquidity portfolio primarily comprises liquid, interest-bearing securities with a high rating and is an integrated part of the Group’s liquidity risk management. Holdings in securities are limited by asset class and by country, respectively, and must have the highest rating upon acquisition. In addition to these collective limits, limits for individual issuers may also be set. In the table above, RMBSs are recognised at market value, in accord-ance with the Swedish Bank Association’s template for the publication of a bank’s liquidity reserve. These assets are excluded from the calculation of internal and regulatory liquidity measurements.
Note 2c Risk management – Liquidity risk
Liquidity risk is defined as the risk that the company will not be able to meet its payment obligations on the date of maturity without the related cost increasing significantly. The SBAB Group has long identified the importance of well-functioning and proactive liquidity risk management. SBAB’s liquidity risk management is based on the following principles:
Broad and diversified fundingBecause the SBAB Group has maintained an active presence in the international capital market since 1989, its brand is well established. Short-term, mid-term and long-term funding takes place on a global ba-sis. Moreover, the SBAB Group has access to the covered bond market, both in Sweden and internationally, through SCBC.
Liquidity reservesTo ensure access to funding in times when the normal sources of funding do not function, the SBAB Group has a liquidity portfolio. When calculating the reserve value of the securities included in the liquidity portfolio, the SBAB Group applies the haircuts issued in accordance with the Riksbank’s Guidelines for Collateral Management in the regu-latory framework for RIX and monetary policy instruments. The reserve value of the liquidity portfolio is referred to as the liquidity reserve. The portfolio comprises liquid securities with high ratings and 90% of the value of the portfolio can be used as collateral for repos with the Riksbank or another central bank.
At 31 December 2012, SBAB’s liquidity reserve comprised SEK 42.1 billion (reserve value) in liquid securities.
Liquid balance sheetSBAB’s assets primarily comprise lending against collateral in residen-tial properties and tenant-owner rights. SCBC was established in 2006 for the purpose of issuing covered bonds, which has also resulted in increased liquidity in SBAB’s balance sheet.
Continuous monitoring of liquidity riskActive debt management, the liquidity of the balance sheet and the size of SBAB’s liquidity reserves are key factors in SBAB’s liquidity risk management. By viewing funding activities as a natural part of both operational work and strategic planning of liquidity risk, concentrations of excessively large funding maturities are avoided. Another important part of the ongoing liquidity risk management is the continuous moni-toring and testing of the practical liquidity value of the liquidity portfolio in the secondary market.
Liquidity risk measurementsTo increase transparency and the comparability of liquidity risk between banks, the Basel Committee has formulated international measurements for use by all banks. The short-term measurement, called the Liquidity Coverage Ratio (LCR), has the purpose of ensuring that a bank maintains unencumbered liquid assets that, if required, can be converted into cash and cash equivalents sufficient to cover 30 days of forecast liquidity required under stressed conditions. The liquidity requirement consists in part of the bank’s contractual cash flows and in part of theoretical cash flows based on standard assumptions concerning, for example, the utilisation of committed lines of credit or major withdrawals of deposited funds by the public. Within the EU, there are plans to introduce a version of LCR as a statutory requirement for all banks as of 2015. The Swedish Financial Supervisory Authority is introducing a Swedish version of the liquidity coverage ratio, which is binding for all banks with balance sheet totals exceeding SEK 100 bil-lion as of 1 January 2013. The liquidity coverage ratio must correspond to at least 100% at a consolidated level, as well as isolated in terms of EUR and USD. SBAB’s liquidity coverage ratio, at all given times, is limited to amount to at least 100%.
Internally within the SBAB Group, the liquidity risk is measured and stress tested by totalling the maximum conceivable need for liquidity for every day during the coming 365 days. This measurement of liquidity risk is known as the Maximum Cumulative Outflow (MCO). MCO calcu-lations are based on a crisis scenario in which all loans are assumed to be extended on maturity, meaning that no liquidity is added through loan redemption, and where no funding is available. Accordingly, the maximum need for liquidity can be identified for every given future period, and the necessary liquidity reserve can be established. The number of MCO days corresponds to the number of days for which the liquidity reserve covers the maximum outflow (MCO) and is limited to a minimum of 30 days at any given time.
Moreover, unutilised issuance capacity for covered bonds is an additional reserve that is not included in the calculation of the measure-ments above. Nor are the holdings of RMBSs included in the definition of the liquidity reserve used to calculate the measurements.
Liquidity situation in 2012At 31 December, 2012, the liquidity reserve in accordance with the new definition for the ratio corresponded to 83 days (77) MCO. During 2012, the liquidity reserve was never lower than the equivalent future liquidity requirement of 45 days (48).
Note 2b Credit risk in treasury operations, Cont’d

notes 41
SBAB Annual Report 2012
During 2012, the LCR was reported to the Swedish Financial Supervisory Authority for observation, in accordance with the definitions stipulated in FFFS 2011:37. At 31 December, 2012, the ratio, according to this definition was 158%. At the same date, the liquidity coverage ratio, in accordance with the definition in FFFS 2012:6 that governs the quanti-tative requirement, was 279% at the consolidated level, and 858% and 130%, respectively, in EUR and USD.
new regulations for liquidity riskIn the wake of the financial crisis and its implications, a major inter-national review has been carried out and extensive efforts launched to review the regulations for the management of liquidity risk in banks and credit institutions. The objective of the new regulations, which are still being formulated, is to increase the resilience of banks to serious disruptions in the capital market and to achieve a more harmonised approach to liquidity risk at the international level.
In order to set minimum levels for the liquidity of banks, the new regulations focus on two key ratios or standard measurements called the net stable funding ratio (NSFR) and the liquidity coverage ratio (LCR). The aim of NSFR is to indicate how stable the Group’s funding is by comparing the stability of assets and liabilities. LCR is described in greater detail above.
Within the EU, both of these ratios are included in the work on formulating a new regulatory framework for capital adequacy, and there are plans to introduce them in reporting requirements in all mem-ber countries during 2013. The EBA has also been commissioned to formulate additional ratios for comparison, which are to be presented no later than 31 December 2013. It is proposed that LCR will be binding in the EU as of 2015 and NSFR as of 2018. A Swedish version of the LCR, which will also apply to companies such as SBAB, is being introduced as a binding ratio by the Swedish Financial Supervisory Authority effective 1 January 2013.
structural liquidity riskStructural liquidity risk pertains to when funding opportunities become more costly, or in short supply, as a result of differences in structure and maturity between lending and funding. SBAB aims to have a diversified funding.
In the structural liquidity risk model, shareholders’ equity is assigned a maturity that matches SBAB’s longest lending assets. The SBAB Group has adopted a conservative approach to the management of funding.
GRoUP Maturities for financial assets and liabilities (Amounts refer to contractual, undiscounted cash flows)
2012 2011
seK millionWithout maturity
< 3 months
3–6 months
6–12 months
1–5 years
> 5 years total
Without maturity
< 3 months
3–6 months
6–12 months
1–5 years
> 5 years total
Assets
Cash and balances from central banks 0 – – – – – 0 0 – – – – – 0
Chargeable treasury bills and other eligible bills – 35 2,416 367 8 967 1,456 13,241 – 19 85 250 4,978 997 6,329
Lending to credit institutions 1,219 16,339 38 416 262 20 18,294 571 18,951 652 1,829 1,716 35 23,754
Lending to the public – 34,400 41,247 83,317 105,224 3,965 268,153 – 35,520 42,934 72,208 105,841 5,158 261,661
Bonds and other interest- bearing securities – 871 1,737 2,057 25,589 3,353 33,607 – 3,103 4,661 3,999 29,061 4,504 45,328
Of which classified as loans and receivables – 327 694 473 2,126 1,815 5,435 623 2,333 1,936 3,255 2,039 10,186
Derivative instruments – 45,305 17,716 18,197 136,374 9,249 226,841 – 65,825 12,372 14,125 139,061 22,021 253,404
Other assets 1,200 – – – – – 1,200 1,520 – – – – – 1,520
total financial assets 2,419 96,950 63,154 104,354 276,416 18,043 561,336 2,091 123,418 60,704 92,411 280,657 32,715 591,996
LIABILItIes
Liabilities to credit institutions – 17,541 – – – – 17,541 – 21,349 – – – – 21,349
Deposits from the public 27,568 15 5 3 63 – 27,654 8,675 4 23 8 59 – 8,769
Debt securities in issue – 33,320 28,625 13,518 186,742 5,044 267,249 – 44,869 20,311 19,020 194,243 16,234 294,677
Derivative instruments – 46,995 15,871 19,257 139,847 9,749 231,719 – 65,705 11,001 14,608 139,120 23,665 254,099
Other liabilities 4,059 – – – – – 4,059 4,228 – – – – – 4,228
Subordinated debt – 10 1,323 33 6,525 0 7,891 – 3 280 55 6,832 0 7,170
Loan commitments and other credit-related commitments – 39,279 – – – – 39,279 – 34,248 – – – – 34,248
total financial liabilities 31,627 137,160 45,824 32,811 333,177 14,793 595,392 12,903 166.178 31,615 33,691 340,254 39,899 624,540
A greater share of future maturities is pre-funded and the share of total funding attributable to short-term funding is maintained at a low level. SBAB works actively to ensure an even distribution of maturities, while at the same time extending the maturity of the liability. Monitoring of upcoming maturities, repurchases, replacements and pre-funding constitutes key elements of the practical management efforts aimed at reducing the risk. The structural liquidity risk is calculated as the sum total of maturing funding within periods of 30 days, in relation to the market value of the liquidity reserve.
The tables “Derivative cash flow statement” and “Maturities for financial assets and liabilities” show SBAB Bank’s future cash flows at 31 December 2012 and 31 December 2011, respectively, from both a short and long-term perspective.
stress testsA model has been developed for stress testing of liquidity risk in order to fulfil internal requirements with regard to the analysis of liquidity risk and risk management preparedness. The stress tests were designed in accordance with the Swedish Financial Supervisory Authority’s regu-lations regarding the management of liquidity risks in credit institutions and investment companies (FFFS 2010:7). The developed models analyse SBAB’s Group’s ability to meet its capital requirement in various scenarios and assesses the effect that a prolonged period with various stresses would have on an estimated maturity profile. The scenarios are designed on the basis of SBAB’s specific risk profile and cover both company-specific and market-related problems. The scenarios are divided into different stages that illustrate increasing levels of stress intensity to reflect how a crisis can continuously deteriorate.
The scenarios simulated by the stress tests include:• Stress in the funding operations – the intention is that the stress
should replicate the 2008/09 financial crisis, with funding pro-grammes closing at various stages.
• Rating-related stress, with gradually lower ratings for SBAB and SCBC.• Price fall in the property market • Stress of liquidity in the liquidity reserve
The stress tests are under continuous development and the assump-tions on which the various scenarios are based are assessed regularly. Stress tests are conducted and reported on a quarterly basis, and the results are assessed against SBAB’s established risk tolerance and used for the purpose of adjusting strategies and guidelines.
Note 2c Risk management – Liquidity risk, Cont’d

notes42
SBAB Annual Report 2012
PARent CoMPAnY Maturities for financial assets and liabilities (Amounts refer to contractual, undiscounted cash flows)
2012 2011
seK millionWithout maturity
< 3 months
3–6 months
6–12 months
1–5 years
> 5 years total
Without maturity
< 3 months
3–6 months
6–12 months
1–5 years
> 5 years total
Assets
Cash and balances from central banks 0 – – – – – 0 0 – – – – – 0
Chargeable treasury bills and other eligible bills – 35 2,416 367 8,967 1,456 13,241 – 19 85 250 4,978 997 6,329
Lending to credit institutions 40,817 6,305 77 849 390 41 48,479 36,738 11,423 1,332 3,733 3,502 71 56,799
Lending to the public – 7,480 9,992 19,043 11,140 918 48,573 – 4,111 4,489 10,177 15,417 649 34,843
Bonds and other interest- bearing securities – 871 1,737 2,057 25,589 3,353 33,607 – 3,103 4,661 3,999 29,061 4,504 45,328
Of which classified as loans and receivables – 327 694 473 2,126 1,815 5,435 – 623 2,333 1,936 3,255 2,039 10,186
Derivative instruments – 40,592 11,077 15,945 76,635 5,866 150,115 – 171,643 20,202 23,738 161,887 11,934 389,404
Other assets 795 – – – – – 795 1,617 – – – – – 1,617
total financial assets 41,612 55,283 25,299 38,261 122,721 11,634 294,810 38,355 190,299 30,769 41,897 214,845 18,155 534,320
LIABILItIes
Liabilities to credit institutions – 2,445 – – – – 2,445 – 9,700 – – – – 9,700
Deposits from the public 27,568 15 5 3 63 – 27,654 8,675 4 23 8 59 – 8,769
Debt securities in issue – 32,158 6,963 11,461 53,354 1,090 105,026 – 44,266 3,001 12,625 59,369 1,140 120,401
Derivative instruments – 41,575 10,998 16,363 78,119 5,922 152,977 – 170,622 20,229 23,847 162,085 12,616 389,399
Other liabilities 1,191 – – – – – 1,191 1,023 – – – – – 1,023
Subordinated debt – 10 1,323 33 6,525 0 7,891 – 3 280 55 6,832 0 7,170
Loan commitments and other credit-related commitments – 39,135 – – – – 39,135 – 34,096 – – – – 34,096
total financial liabilities 28,759 115,338 19,289 27,860 138,061 7,012 336,319 9,698 258,691 23,533 36,535 228,345 13,756 570,558
For receivables and liabilities that have been amortised, the maturity for the amortisation has been calculated as the period up to the date of maturity for the particular amortisation. Foreign currency cash flows have been recalculated at the closing rate at 31 December 2012. Future interest-rate cash flows with floating interest rates have been estimated until the change of condition date using forward interest rates based on the actual interest base, usually the three-month STIBOR. The Parent Company, SBAB, is the creditor for the subsidiary SCBC’s subordinated debt. Since the maturity is not specified, current debt is recognised as without maturity and without estimated interest-rate cash flows.
The item “Loan commitments and other credit-related commitments” for the Group, which totals SEK 39,279 million (34,248), amounts to SEK 6,517 million (5,126) after application of the internal model for calculating the conversion factor. The reduction has not been included in the table. The corresponding figures for the Parent Company amounted to SEK 39,135 million (34,096) and SEK 6,411 million (5,006), respectively.
Note 2d Risk management – Market risk
Market risk is the risk of a decline in profitability due to unfavourable market fluctuations. SBAB is characterised by low risk-taking, and the Board ultimately decides on methods for risk measurement and for limits. Market risk is followed up at the Group level and Risk Control monitors current risk levels and compliance with limits on a daily basis.
Interest-rate riskInterest-rate risk arises primarily when the interest rate structure between funding and lending is not fully matched. SBAB’s interest rate structure at 31 December 2012 is shown in the table “Fixed-interest pe-riod for financial assets and liabilities.” The main principle for SBAB’s interest-rate risk management is to limit interest-rate risk through direct funding and the use of derivative instruments. Accordingly, interest-rate risk arises in SBAB to only a limited extent. SBAB’s interest-rate risk is quantified through a parallel shift of the yield curve, a model that sim-ulates a large number of non-parallel shifts of the yield curve (known as curve risk) and through Value at Risk (VaR). The calculation takes into account all contracted cash flows affecting lending, liabilities and derivative instruments.
The parallel shift measurement and curve risk are used for limiting, while the VaR is included in the model for economic capital. The inter-est-rate risk limits established by the Board of Directors are divided into two categories – operational and strategic.
Operational interest-rate risk is subject to a limit of 1% of SBAB’s capital base in the event of a parallel shift of the yield curve of 1 percentage point. At 31 December 2012, the operational interest-rate risk exposure amounted to a negative SEK 39.8 million (neg: 28.3), com-pared with the limit of +/– SEK 139 million set by the Board of Directors.
Curve risk is quantified through a model in which the short-term portion of the yield curve is adjusted upward (downward) by 0.5 percentage points and the long-term portion is adjusted downward (upward) by 0.5 percentage points. A large number of breakpoints are tested for both the short and long-term portion. The curve risk is defined as the least favourable of the tested scenarios. The limit for the operational curve risk is 1% of SBAB’s capital base. At 31 December 2012, the curve risk amounted to SEK 38.9 million (70.1), compared with the limit of SEK 139 million.
Strategic interest-rate risk is the interest-rate risk that arises when SBAB’s equity and flow are invested in fixed-interest lending. The flow arises because the frequency of interest payments from lending and funding varies. SBAB’s equity and flow is to be used primarily to fund lending operations. The benchmark for the investment of equity is set by the Board and defined as a maturity ladder with even annual maturities over a period of one to six years. The interest-rate risk associated with equity is defined as the deviation from this benchmark. The flow is invested at an average maturity corresponding to the average maturity of the lending portfolio.
At 31 December 2012, the strategic interest-rate risk was a negative SEK 15.5 million (pos: 2.0). Accordingly, the risk was within the approved interval of +/– SEK 20 million established for deviation from the benchmark.
Interest-rate risk is also quantified through measurements of Value at Risk (VaR). The VaR model used is a parametric model based on the assumption of normally distributed yields, calculated by variance/co-variance matrices for the risk factors included. A one-sided confidence interval of 99.97% and a holding period of one year are applied.
Note 2c Risk management – Liquidity risk, Cont’d
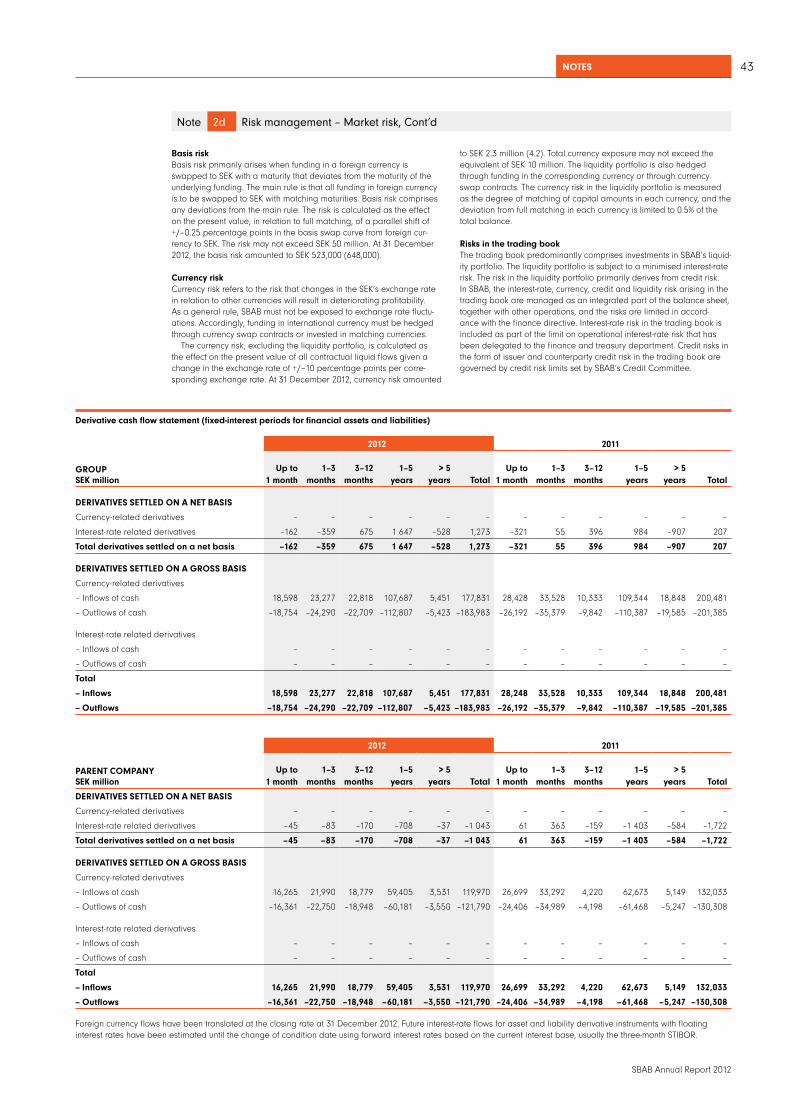
notes 43
SBAB Annual Report 2012
Basis riskBasis risk primarily arises when funding in a foreign currency is swapped to SEK with a maturity that deviates from the maturity of the underlying funding. The main rule is that all funding in foreign currency is to be swapped to SEK with matching maturities. Basis risk comprises any deviations from the main rule. The risk is calculated as the effect on the present value, in relation to full matching, of a parallel shift of +/–0.25 percentage points in the basis swap curve from foreign cur-rency to SEK. The risk may not exceed SEK 50 million. At 31 December 2012, the basis risk amounted to SEK 523,000 (648,000).
Currency riskCurrency risk refers to the risk that changes in the SEK’s exchange rate in relation to other currencies will result in deteriorating profitability. As a general rule, SBAB must not be exposed to exchange rate fluctu-ations. Accordingly, funding in international currency must be hedged through currency swap contracts or invested in matching currencies.
The currency risk, excluding the liquidity portfolio, is calculated as the effect on the present value of all contractual liquid flows given a change in the exchange rate of +/–10 percentage points per corre-sponding exchange rate. At 31 December 2012, currency risk amounted
Derivative cash flow statement (fixed-interest periods for financial assets and liabilities)
2012 2011
GRoUP seK million
Up to 1 month
1–3 months
3–12 months
1–5 years
> 5 years total
Up to 1 month
1–3 months
3–12 months
1–5 years
> 5 years total
DeRIVAtIVes settLeD on A net BAsIs
Currency-related derivatives – – – – – – – – – – – –
Interest-rate related derivatives –162 –359 675 1 647 –528 1,273 –321 55 396 984 –907 207
total derivatives settled on a net basis –162 –359 675 1 647 –528 1,273 –321 55 396 984 –907 207
DeRIVAtIVes settLeD on A GRoss BAsIs
Currency-related derivatives
– Inflows of cash 18,598 23,277 22,818 107,687 5,451 177,831 28,428 33,528 10,333 109,344 18,848 200,481
– Outflows of cash –18,754 –24,290 –22,709 –112,807 –5,423 –183,983 –26,192 –35,379 –9,842 –110,387 –19,585 –201,385
Interest-rate related derivatives
– Inflows of cash – – – – – – – – – – – –
– Outflows of cash – – – – – – – – – – – –
total
– Inflows 18,598 23,277 22,818 107,687 5,451 177,831 28,248 33,528 10,333 109,344 18,848 200,481
– outflows –18,754 –24,290 –22,709 –112,807 –5,423 –183,983 –26,192 –35,379 –9,842 –110,387 –19,585 –201,385
2012 2011
PARent CoMPAnY seK million
Up to 1 month
1–3 months
3–12 months
1–5 years
> 5 years total
Up to 1 month
1–3 months
3–12 months
1–5 years
> 5 years total
DeRIVAtIVes settLeD on A net BAsIs
Currency-related derivatives – – – – – – – – – – – –
Interest-rate related derivatives –45 –83 –170 –708 –37 –1 043 61 363 –159 –1 403 –584 –1,722
total derivatives settled on a net basis –45 –83 –170 –708 –37 –1 043 61 363 –159 –1 403 –584 –1,722
DeRIVAtIVes settLeD on A GRoss BAsIs
Currency-related derivatives
– Inflows of cash 16,265 21,990 18,779 59,405 3,531 119,970 26,699 33,292 4,220 62,673 5,149 132,033
– Outflows of cash –16,361 –22,750 –18,948 –60,181 –3,550 –121,790 –24,406 –34,989 –4,198 –61,468 –5,247 –130,308
Interest-rate related derivatives
– Inflows of cash – – – – – – – – – – – –
– Outflows of cash – – – – – – – – – – – –
total
– Inflows 16,265 21,990 18,779 59,405 3,531 119,970 26,699 33,292 4,220 62,673 5,149 132,033
– outflows –16,361 –22,750 –18,948 –60,181 –3,550 –121,790 –24,406 –34,989 –4,198 –61,468 –5,247 –130,308
Foreign currency flows have been translated at the closing rate at 31 December 2012. Future interest-rate flows for asset and liability derivative instruments with floating interest rates have been estimated until the change of condition date using forward interest rates based on the current interest base, usually the three-month STIBOR.
to SEK 2.3 million (4.2). Total currency exposure may not exceed the equivalent of SEK 10 million. The liquidity portfolio is also hedged through funding in the corresponding currency or through currency swap contracts. The currency risk in the liquidity portfolio is measured as the degree of matching of capital amounts in each currency, and the deviation from full matching in each currency is limited to 0.5% of the total balance.
Risks in the trading bookThe trading book predominantly comprises investments in SBAB’s liquid-ity portfolio. The liquidity portfolio is subject to a minimised interest-rate risk. The risk in the liquidity portfolio primarily derives from credit risk. In SBAB, the interest-rate, currency, credit and liquidity risk arising in the trading book are managed as an integrated part of the balance sheet, together with other operations, and the risks are limited in accord-ance with the finance directive. Interest-rate risk in the trading book is included as part of the limit on operational interest-rate risk that has been delegated to the finance and treasury department. Credit risks in the form of issuer and counterparty credit risk in the trading book are governed by credit risk limits set by SBAB’s Credit Committee.
Note 2d Risk management – Market risk, Cont’d
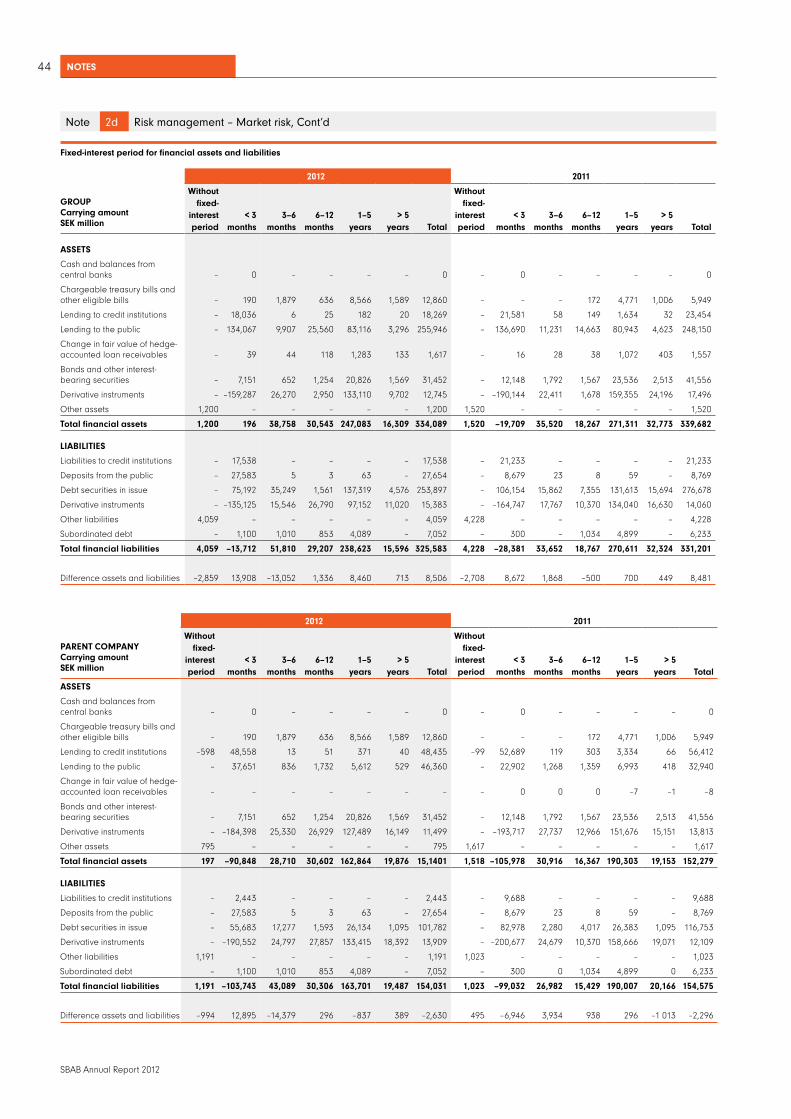
notes44
SBAB Annual Report 2012
Fixed-interest period for financial assets and liabilities
2012 2011
GRoUPCarrying amountseK million
Without fixed-
interest period
< 3 months
3–6 months
6–12 months
1–5 years
> 5 years total
Without fixed-
interest period
< 3 months
3–6 months
6–12 months
1–5 years
> 5 years total
Assets
Cash and balances from central banks – 0 – – – – 0 – 0 – – – – 0
Chargeable treasury bills and other eligible bills – 190 1,879 636 8,566 1,589 12,860 – – – 172 4,771 1,006 5,949
Lending to credit institutions – 18,036 6 25 182 20 18,269 – 21,581 58 149 1,634 32 23,454
Lending to the public – 134,067 9,907 25,560 83,116 3,296 255,946 – 136,690 11,231 14,663 80,943 4,623 248,150
Change in fair value of hedge-accounted loan receivables – 39 44 118 1,283 133 1,617 – 16 28 38 1,072 403 1,557
Bonds and other interest- bearing securities – 7,151 652 1,254 20,826 1,569 31,452 – 12,148 1,792 1,567 23,536 2,513 41,556
Derivative instruments – –159,287 26,270 2,950 133,110 9,702 12,745 – –190,144 22,411 1,678 159,355 24,196 17,496
Other assets 1,200 – – – – – 1,200 1,520 – – – – – 1,520
total financial assets 1,200 196 38,758 30,543 247,083 16,309 334,089 1,520 –19,709 35,520 18,267 271,311 32,773 339,682
LIABILItIes
Liabilities to credit institutions – 17,538 – – – – 17,538 – 21,233 – – – – 21,233
Deposits from the public – 27,583 5 3 63 – 27,654 – 8,679 23 8 59 – 8,769
Debt securities in issue – 75,192 35,249 1,561 137,319 4,576 253,897 – 106,154 15,862 7,355 131,613 15,694 276,678
Derivative instruments – –135,125 15,546 26,790 97,152 11,020 15,383 – –164,747 17,767 10,370 134,040 16,630 14,060
Other liabilities 4,059 – – – – – 4,059 4,228 – – – – – 4,228
Subordinated debt – 1,100 1,010 853 4,089 – 7,052 – 300 – 1,034 4,899 – 6,233
total financial liabilities 4,059 –13,712 51,810 29,207 238,623 15,596 325,583 4,228 –28,381 33,652 18,767 270,611 32,324 331,201
Difference assets and liabilities –2,859 13,908 –13,052 1,336 8,460 713 8,506 –2,708 8,672 1,868 –500 700 449 8,481
2012 2011
PARent CoMPAnY Carrying amountseK million
Without fixed-
interest period
< 3 months
3–6 months
6–12 months
1–5 years
> 5 years total
Without fixed-
interest period
< 3 months
3–6 months
6–12 months
1–5 years
> 5 years total
Assets
Cash and balances from central banks – 0 – – – – 0 – 0 – – – – 0
Chargeable treasury bills and other eligible bills – 190 1,879 636 8,566 1,589 12,860 – – – 172 4,771 1,006 5,949
Lending to credit institutions –598 48,558 13 51 371 40 48,435 –99 52,689 119 303 3,334 66 56,412
Lending to the public – 37,651 836 1,732 5,612 529 46,360 – 22,902 1,268 1,359 6,993 418 32,940
Change in fair value of hedge-accounted loan receivables – – – – – – – – 0 0 0 –7 –1 –8
Bonds and other interest- bearing securities – 7,151 652 1,254 20,826 1,569 31,452 – 12,148 1,792 1,567 23,536 2,513 41,556
Derivative instruments – –184,398 25,330 26,929 127,489 16,149 11,499 – –193,717 27,737 12,966 151,676 15,151 13,813
Other assets 795 – – – – – 795 1,617 – – – – – 1,617
total financial assets 197 –90,848 28,710 30,602 162,864 19,876 15,1401 1,518 –105,978 30,916 16,367 190,303 19,153 152,279
LIABILItIes
Liabilities to credit institutions – 2,443 – – – – 2,443 – 9,688 – – – – 9,688
Deposits from the public – 27,583 5 3 63 – 27,654 – 8,679 23 8 59 – 8,769
Debt securities in issue – 55,683 17,277 1,593 26,134 1,095 101,782 – 82,978 2,280 4,017 26,383 1,095 116,753
Derivative instruments – –190,552 24,797 27,857 133,415 18,392 13,909 – –200,677 24,679 10,370 158,666 19,071 12,109
Other liabilities 1,191 – – – – – 1,191 1,023 – – – – – 1,023
Subordinated debt – 1,100 1,010 853 4,089 – 7,052 – 300 0 1,034 4,899 0 6,233
total financial liabilities 1,191 –103,743 43,089 30,306 163,701 19,487 154,031 1,023 –99,032 26,982 15,429 190,007 20,166 154,575
Difference assets and liabilities –994 12,895 –14,379 296 –837 389 –2,630 495 –6,946 3,934 938 296 –1 013 –2,296
Note 2d Risk management – Market risk, Cont’d

notes 45
SBAB Annual Report 2012
Note 2e Risk management – Operational risk
Operational risk refers to the risk of losses due to inappropriate or unsuccessful internal processes, human error, incorrect systems or external events, including legal risk.
SBAB uses the standardised approach to measure operational risk and assess capital requirements. This approach entails that the capital requirement is based on 12–18% of the average operating income of the business areas for the past three years. To be permitted to use the standardised approach, the company must fulfil the requirements for documentation, processes and structures stipulated in the regulations, such as:• Established control documents• Documented risk management• Internal reporting structure• Processes for managing operational risks• Contingency plans and continuity plans• Method for allocating operating income among business areas.
SBAB uses a model to manage operational risk, which is based on self-evaluation of operational risks and risks associated with financial reporting in existing processes, as well as the registration of incidents that have occurred. The self-evaluation process encompasses the identification of risks in all units, measurement of identified risks and management of material risks. The results of the self-evaluation are reported annually and any incidents that occur are reported on a monthly basis to the Board, the CEO and senior executives. For further details concerning the management of risks associated with financial reporting, refer to the Corporate Governance Report, in the section Internal control concerning financial reporting.
Note 2f Risk management – Business risk
Business risk refers to the risk that deteriorating competitive conditions or an incorrect strategy or decision will result in declining income. Busi-ness risk also includes margin risk, which arises when the fixed-interest periods applying to the interest-rate margins for lending and funding differ.
Business risk is divided into two main groups: new business and existing business. New business is to be relatively similar to business already existing in SBAB. Changes in the form of new products or new markets should account for only a minor share of SBAB’s operations and should be implemented at a pace that ensures that SBAB does not significantly jeopardise its level of earnings or capital base. Business risk is included in the calculation of the capital requirement based on economic capital using a standardised approach that reflects the business areas’ operating expenses.
Note 2g Risk management – Concentration risk
Concentration risk arises when major exposures or exposures in the loan portfolio are concentrated to certain types of borrowers, regions or industries. SBAB is primarily considered to be exposed to credit-risk related concentration risk in its lending operations. The concentration risk is calculated based on the size of the exposures, industry concen-tration and geographical concentration. The full capital requirement for concentration risk is included in the economic capital for credit risk.
Upon calculation at 31 December 2012, the internally calculated capital requirement for concentration risk amounted to SEK 575 million (878), of which SEK 504 million (822) pertained to credit risk in the lending operations and SEK 71 million (56) to credit risk in the funding operations. The decrease in the concentration risk in lending opera-tions is due to SBAB currently measuring concentration as a part of the total lending portfolio, in contrast to the past when it was measured as a part of the portfolio of corporate exposures.
Note 2h Risk management – Internal capital adequacy assessment
ICAAPThe purpose of the internal capital adequacy assessment process (ICAAP) is performed for the corporate group, SBAB, in which SCBC is a significant part.
Pillar 2 of the Basel II regulations imposes the requirement that the banks’ management and assessment of risks must be satisfactory to ensure that the banks can fulfil their obligations. In order to fulfil this requirement, the banks must have methods that enable them to contin-uously evaluate and uphold capital in an amount, type and distribution sufficient to cover the risks to which they are or will become exposed. This is called the internal capital adequacy assessment process.
The purpose of the internal capital adequacy assessment process is to identify, evaluate, secure and manage the risks to which SBAB is exposed and ensure that the Group has sufficient risk capital for its selected risk profile. The ICAAP is revised annually to identify changes in the operating environment that continuously affect the Group’s performance.
Calculation of the amount of risk capital required to manage the combined risk in the operations occurs at Group level and is based primarily on the calculation of SBAB’s economic capital. A qualitative assessment is also made of the risks that are not included in the calcu-lation of economic capital. In addition, consideration is given to the risk associated with extraordinary events, which is illustrated in conjunction with stress tests. What is finally taken into account is the impact on profit or loss caused by a valuation effect on primarily basis swap spreads as well as spreads on residential bonds and government paper that arise due to accounting regulations. The valuation effect is not estimated to affect risk in the operations, apart from the impact on the capital base. Based on the qualitative assessment and results of the stress tests, as well as the calculation of earnings volatility, the calculated economic capital is supplemented with extra buffer capital.
Taken together, economic capital and buffer capital comprise the capital that, in accordance with Basel II, is required to meet all risks in SBAB’s operations. At 31 December 2012, the Group’s capital require-ment amounted to SEK 9,239 million (8,883).
economic capitalEconomic capital comprises the capital that SBAB deems to be required to cover unexpected losses during the coming year. It is presumed that expected losses can be covered by earnings from oper-ating activities. The assessment of economic capital takes into account credit risk, concentration risk, market risk, operational risk and business risk. Credit risk is the dominant risk in SBAB’s operations. The levels take into account diversification effects by taking into account the probability that several risks will be realised simultaneously.
To a large extent, the economic capital model is based on the result of the Group’s IRB approach for quantification of credit risk. In addition to comprising an assessment of the combined capital requirement for managing the risks in the company’s operations, the economic capital model is also used for monitoring purposes, economic control and strategic considerations.
stress testsCapital planning is founded on a basic scenario that reflects the most probable operational development in accordance with internal forecasts. Complementing this, stress tests and scenario analyses are performed, whereby the development of the loan portfolio and capital requirements during a serious economic downturn is evaluated. In the stress scenario, the Swedish economy is subjected to several major disturbances simultaneously. A combination of external and internal factors further exacerbates the situation and leads to a recession, inflation and problems in the bank sector. The scenario is of the nature that might be expected to occur every 20 to 25 years.
The stress tests are conducted in such a way that the macroeconomic scenario that forms the foundation for the stress in the system is translat-ed to reflect the effects it has on the SBAB Bank Group’s risk models. A change in the credit-worthiness of individual loans is simulated through changes in the majority of the parameters in SBAB’s IRB approach. A negative stress on PD variables simulates the deterioration in the payment capacity of customers due to factors including higher interest rates, while declining market values for underlying collateral lead to an increase in the LGD.
To evaluate the effect of the stress test, measurements are made of the change in the SBAB’s economic capital and expected losses for the loan portfolio due to the changes in composition and credit quality. In the stress scenario characterised by a severe recession, both the eco-

notes46
SBAB Annual Report 2012
Capital base
GRoUP PARent CoMPAnY
seK million 2012 2011 2012 2011
Core tier 1 capital
Equity 8,761 8,384 7,932 7,825
Group contribution, not received – – – –376
Unrealised change in value of loans and receivables previously classified available-for-sale assets 37 51 37 51
Minority interest 731 706 – –
Intangible fixed assets –122 –38 –14 –6
Deferred tax assets –36 – – –
Net provisions for IRB exposures –69 –128 –35 –62
Core tier 1 capital 9,302 8,975 7,920 7,432
tier 1 capital contribution
Tier 1 capital contribution without redemption incentives* 2,000 2,000 2,000 2,000
Tier 1 capital contribution with redemption incentives* 994 994 994 994
tier 1 capital 12,296 11,969 10,914 10,426
tier 2 capital
Perpetual subordinated debentures (Upper Tier 2) – – – –
Time-limited subordinated debentures (Lower Tier 2) 3,300 2,456 3,300 2,456
Net provisions for IRB exposures –70 –129 –35 –63
tier 2 capital 3,230 2,327 3,265 2,393
Expanded part of capital base – – – –
Deduction from entire capital base – – – –
Amount for capital base net after deductible items and limit value 15,526 14,296 14,179 12,819
* Encompassed by the transitional regulations to FFFS 2007:1.
nomic capital and expected losses increase significantly, although from very low levels. During the first year of the stress scenario, economic capital in SBAB increased SEK 996 million (978) and loan losses rose SEK 41 million (36), only to increase additionally during the second year before recovering somewhat in the final year. The increase in economic capital and expected losses derives largely from the simulation of declining market values, since these have an impact on both the PD and the LGD dimension.
Based on the results of the stress tests, a capital buffer of SEK 996 million (978) has been allocated to offset the increase in economic cap-ital during the first year of the stress scenario. The increase in economic capital during the remaining years is covered by the Group’s equity and
earnings, which significantly exceed the lowest level corresponding to the minimum capital requirement under the regulatory framework.
seK million 2012 2011
Credit risk 5,070 4,858
of which, concentration risk 575 878
Market risk 156 151
Business risk 129 200
Operational risk 243 134
total economic capital 5,598 5,343
Note 2i Risk management – Capital adequacy
The regulations for capital adequacy and large exposures introduced in 2007 through Basel II stipulate that the risk associated with the company’s operations is to be reflected in the minimum capital require-ment. The impact of the changed regulations has been limited to date, since the transitional regulations, which connect to older regulations, constitute a floor for the lowest capital requirement. The regulations, which had been intended to remain in effect until year-end 2009, have been extended and will apply until year-end 2013, or until the time stipulated in the forthcoming CRR regulations.
Many of the changes discussed prior to Basel II were never included in the regulations, but rather were deferred until a later time. Since then, the financial and debt crises have led to additional demand for stricter capital adequacy regulations, resulting in the proposal of a new regulatory standard – Basel III.
Basel III includes proposals for higher capital requirements, stricter demands on capital quality, the introduction of a non-risk-based measurement (leverage ratio) and quantitative liquidity requirements. The new regulations, which will be implemented gradually, are stricter than the current regulations. The aim is for all of the changes to be introduced by 2019. Implementation of Basel III will take place at the EU level through CRDIV/CRRIV. In addition to the forthcoming Basel III regulations, Swedish authorities have proposed a national risk-weight floor of 15% for residential mortgages to Swedish retail customers.
Banks that are important to the Swedish system, which include the four Swedish super-banks, are subject to more stringent demands than other banks. The requirement for additional capital at a later stage could encompass more banks.
SBAB primarily recognises credit risk in accordance with the IRB approach, and operational and market risk in accordance with the standardised approach. Profit for the year is included in the calculation of the capital base and Tier 1 capital. The figures do not include a dividend to shareholders, which is in line with the Board of Directors’ proposal for the appropriation of profits. There are no ongoing or unforeseen material obstacles or legal barriers to a rapid transfer of funds from the capital base other than what is stipulated in the terms and conditions governing subordinated debentures (see Note 32) or what is generally stipulated by the Companies Act.
As in the past, SBAB holds securitised assets in the liquidity portfolio in the form of residential mortgage-backed securities (RMBSs). These are now recognised under “Positions in securitisation” in accordance with the external ratings-based approach. SBAB has no securitised loans of its own and has not contributed to any other institution’s secu-ritisation. The original objective for the securitised assets was that they were to be utilised as collateral with the Riksbank to ensure the bank’s liquidity requirement.
Note 2h Risk management – Internal capital adequacy assessment, Cont’d

notes 47
SBAB Annual Report 2012
Capital adequacy
GRoUP PARent CoMPAnY FRIsPAR sCBC
seK million 2012 2011 2012 2011 2012 2011 2012 2011
Core Tier 1 capital 9,302 8,975 7,920 7,432 1,489 1,428 10,724 10,813
Tier 1 capital 12,296 11,969 10,914 10,426 1,489 1,428 10,724 10,813
Total capital 15,526 14,296 14,179 12,819 1,489 1,428 10,724 10,813
Without transitional regulations
Risk-weighted assets 56,638 59,786 26,688 25,159 260 910 31,903 34,654
Core Tier 1 capital ratio 16.4% 15.0% 29.7% 29.5% 573.8% 157.0% 33.6% 31.2%
Tier 1 capital ratio 21.7% 20.0% 40.9% 41.4% 573.8% 157.0% 33.6% 31.2%
Capital adequacy ratio 27.4% 23.9% 53.1% 51.0% 573.8% 157.0% 33.6% 31.2%
Capital quotient 3.43 2.99 6.64 6.37 71.72 19.62 4.20 3.90
With transitional regulations
Risk-weighted assets 135,124 133,917 30,719 27,948 710 4,676 103,714 101,241
Core Tier 1 capital ratio 6.9% 6.7% 25.8% 26.6% 209.7% 30.5% 10.3% 10.7%
Tier 1 capital ratio 9.1% 8.9% 35.5% 37.3% 209.7% 30.5% 10.3% 10.7%
Capital adequacy ratio 11.5% 10.7% 46.2% 45.9% 209.7% 30.5% 10.3% 10.7%
Capital quotient 1.44 1.33 5.77 5.73 26.21 3.82 1.29 1.34
In the calculation of capital adequacy ratio and capital quotient, FriSpar Bolån AB is consolidated as a subsidiary, in contrast to the consolidated financial statements, in which FriSpar Bolån AB is consolidated in accordance with the proportional method. This is due to differences between the rules and regulations for capital adequacy and large exposures and IFRS.
Capital requirements
GRoUP PARent CoMPAnY
seK million 2012 2011 2012 2011
Credit risk recognised in accordance with IRB approach
Exposures to corporates 2,173 2,491 575 570
Retail exposures 908 894 343 281
Positions in securitisation 423 229 423 229
total exposures, recognised in accordance with IRB approach 3 ,504 3,614 1,341 1,080
Credit risk recognised in accordance with standardised approach
Exposures to governments and central banks 0 0 0 0
Exposures to municipalities and comparable associations 0 0 0 0
Exposures to institutions 387 514 223 366
Exposures to corporates 169 142 165 136
Retail exposures 76 48 74 46
Past-due items 1 1 1 1
Exposures to funds 12 – 12 –
Other items 9 8 7 6
total exposures, recognised in accordance with standardised approach 654 713 482 555
Risks in the trading book 162 239 162 239
operational risk 211 217 150 139
Currency risk – – – –
Commodity risk – – – –
total minimum capital requirement 4,531 4,783 2,135 2,013
Addition according to transitional regulations 6,279 5,930 323 223
total capital requirement according to transitional regulations 10,810 10,713 2,458 2,236
Note 2i Risk management – Capital adequacy, Cont’d

notes48
SBAB Annual Report 2012
Note 3 Net interest income
GROUP PaRent cOmPany
SeK million 2012 2011 2012 2011
Interest income
Lending to credit institutions 339 482 1,743 1,593
Lending to the public1) 9,782 9,301 1,715 1,275
Interest-bearing securities 997 1,294 997 1,294
Derivatives –633 –628 –293 –298
total 10,485 10,449 4,162 3,864
Interest expense
Liabilities to credit institutions –252 –328 –100 –158
Deposits from the public –523 –174 –523 –174
Debt securities in issue –7,197 –8,092 –2,589 –2,945
Subordinated debt –363 –348 –363 –348
Derivatives –198 125 –446 –317
Other –11 –14 –11 –14
total –8,544 –8,831 –4,032 –3,956
net interest income/expense 1,941 1,618 130 –92
1) Includes interest income of SEK 3 million (3) from doubtful receivables.
Note 4 Dividends and Group contribution received
GROUP PaRent cOmPany
SeK million 2012 2011 2012 2011
Dividends received
Dividend income from FriSpar Bolån AB joint venture – – 17 13
total – – 17 13
Group contribution received
Group contribution from the subsidiary The Swedish Covered Bond Corporation (SCBC) – – – 510
total – – – 510
Note 5 Commission
GROUP PaRent cOmPany
SeK million 2012 2011 2012 2011
commission income
Commission on lending 24 29 89 70
Other commission 31 31 47 56
total 55 60 136 126
commission expense
Commission on securities –35 –37 –19 –22
Stability fee –115 –113 –51 –47
total –150 –150 –70 –69
commission, net –95 –90 66 57

notes 49
SBAB Annual Report 2012
Note 6 Net income/expense from financial instruments measured at fair value/ Net income/expense from financial transactions
GROUP PaRent cOmPany
SeK million 2012 2011 2012 2011
Gains/losses on interest-bearing financial instruments
- Securities measured at fair value through profit or loss 950 920 950 920
- Change in value of hedged items in hedge accounting –742 –3,285 –62 –804
- Realised expense from financial liabilities –192 –116 –21 –21
- Derivative instruments in hedge accounting –333 3,185 –304 799
- Other derivative instruments –364 –1,115 –356 –1,108
- Loan receivables 90 72 15 14
currency translation effects –10 –10 –9 –6
Gains/losses on shares and participations measured at fair value through the income statement 0 – 0 –
total –601 –349 213 –206
In the table above, changes in the market value of basis swaps affected the “Derivative instruments in hedge accounting” and “Other derivative instruments” items. The positive performance of the liquidity portfolio impacted the items: “Securities measured at fair value through profit or loss” and “Other derivative instruments.”
With respect to risk management, derivative instruments are related to and have their counter items in all other categories of interest-bearing financial instruments.
Note 7 Other operating income
GROUP PaRent cOmPany
SeK million 2012 2011 2012 2011
Administrative services on behalf of subsidiary – – 514 521
Other operating income 3 0 1 0
total 3 0 515 521
Note 8 Personnel costs
GROUP PaRent cOmPany
SeK million 2012 2011 2012 2011
Salaries and other remuneration –197 –190 –201 –191
Pension costs –47 –41 –54 –42
Other social security expenses –74 –71 –78 –71
Other personnel costs –21 –21 –21 –21
total –339 –323 –354 –325
Salaries and other remuneration
KOnceRnen mODeRBOLaGet
SeK million 2012 2011 2012 2011
CEO –4 –3 –4 –3
Senior executives who report directly to the CEO –15 –13 –15 –13
Other employees –178 –174 –182 –175
total salaries and other remuneration –197 –190 –201 –191
Board Members who are employed by the Parent Company receive remuneration and pension benefits as a result of their employment. No additional remuneration or pension benefits are paid for Board assignments.
No remuneration is paid to the Managing Director or the Board of the subsidiary The Swedish Covered Bond Corporation (SCBC) or the jointly owned company FriSpar Bolån AB.

notes50
SBAB Annual Report 2012
average number of employees
GROUP PaRent cOmPany
2012 2011 2012 2011
Women 235 240 235 240
Men 178 179 178 179
total average number of employees 413 419 413 419
Sickness absence
GROUP PaRent cOmPany
2012 2011 2012 2011
total sickness absence 2.1% 2.5% 2.1% 2,5%
Women 2.8% 3.2% 2.8% 3.2%
Men 1.2% 1.5% 1.2% 1.5%
29 years or younger 2.9% 2.8% 2.9% 2.8%
30–49 years 1.9% 2.3% 1.9% 2.3%
50 years and older 2.1% 2.7% 2.1% 2.7%
Proportion of long-term sickness absence, meaning sickness absence exceeding 60 days 10.9% 22.1% 10.9% 22.1%
Gender distribution among senior executives
GROUP PaRent cOmPany
Board of Directors 2012 2011 2012 2011
Women 8 6 4 4
Men 9 11 4 4
total number of Board members 17 17 8 8
The Group includes the Board Members of the subsidiary The Swedish Covered Bond Corporation (SCBC) and the jointly owned company FriSpar Bolån AB.
GROUP PaRent cOmPany
executive management 2012 2011 2012 2011
Women 4 3 4 3
Men 10 7 6 5
total number of employees in executive management 14 10 10 8
The Group includes the Managing Director of the subsidiary The Swedish Covered Bond Corporation (SCBC) and the jointly owned company FriSpar Bolån AB.
GROUP PaRent cOmPany
Form of employment 2012 2011 2012 2011
total number of employees at the end of the year 423 409 409 409
Of whom, women 55.8% 58.1% 55.8% 58.1%
Of whom, managers 13.5% 13.7% 13.5% 13.7%
Of whom, female managers 5.9% 5.4% 5.9% 5.4%
Of whom, temporary employees 2.1% 2.3% 2.1% 2.3%
Of whom, part-time employees 2.1% 0.1% 2.1% 0.1%
GROUP PaRent cOmPany
Personnel turnover 2012 2011 2012 2011
number of permanent employees who terminated employment during the year 36 54 36 54
Of whom, women 38.9% 53.7% 38.9% 53.7%
Of whom, 30 years or younger 13.9% 13.0% 13.9% 13.0%
Of whom, 30–50 years 47.2% 55.5% 47.2% 55.5%
Of whom, 50 years and older 38.9% 31.5% 38.9% 31.5%
Note 8 Personnel costs, Cont’d

notes 51
SBAB Annual Report 2012
GROUP PaRent cOmPany
external education/training 2012 2011 2012 2011
Number of education/training days per employee 1.5 1.9 1.5 1.9
GROUP PaRent cOmPany
Internal education/training 2012 2011 2012 2011
Number of education/training days per permanent employee 6.1 1.7 6.1 1.7
Number of education/training days per temporary employee 6.1 2.8 6.1 2.8
Salary, remuneration and pension costs for the ceOSalaries and other remuneration paid to the CEO amounted to SEK 3.7 million (2.9). No company car was provided and no fringe benefits were paid. Pension costs for the CEO for 2012, including special employer’s contributions, amounted to SEK 1.3 million (0.9). The company pays for a de-fined-contribution pension insurance plan corresponding to 30% of the CEO’s pensionable salary, although not longer than until age 65. In 2012, the CEO and SBAB were subject to a mutual period of notice of six months. With respect to severance pay, the agreement stipulates that if the company gives notice terminating the agreement and the CEO leaves his position, the company shall – in addition to salary and pension during the period of notice – pay severance pay corresponding to 18 monthly salaries, all with deduction of new salary.
Salaries and other remunerationSalaries and other remuneration paid to the CEO amounted to SEK 3.7 million (2.9). No company car was provided and no fringe benefits were paid. A total of SEK 0.3 million (0.05) was paid to the Acting CEO, who held the position up to 28 February 2012. (The Acting CEO also held the position of Chief Legal Counsel.)
Salaries and other remuneration to senior executives who report directly to the CEO or Board of Directors totalled SEK 14.5 million (13.4). Fringe benefits (subsidised interest-rate and sickness benefit) to these executives amounted to SEK 0.1 million (0.1). Salary and other remuneration were paid in the following amounts:
During the year, changes were implemented to the composition of the Executive Management and new recruitments took place. Thus, the roles are not entirely comparable with the preceding year.
1) As of 1 August 2012, the Compliance Unit is no longer included as part of the Legal Department, but forms a separate organisational unit. 2) For information about remuneration of former senior executives, refer to Annual Report 2011, Note 8 pages 55–56.
After preparation by the Remuneration Committee and being subjected to a risk analysis, the remuneration policy has been adopted by the Board. Risk analyses for SBAB’s remuneration system, remuneration policy and remuneration instructions are published on sbab.se. The composition and mandates of the Remuneration Committee are described on page 84. Salaries and other remuneration to specially regulated personnel, 21 employees (23), excluding senior executives and the Head of Internal Audit, amounted to SEK 15.7 million (16.8).
Remuneration of the BoardThe remuneration paid to Board Members is resolved by the Annual General Meeting. The remuneration paid to Board Members in the Par-ent Company amounted to SEK 1.3 million (0.9) for Board work and SEK 0.2 million (0.2) for work on committees. Board Members who serve on a committee received SEK 3,500 per meeting attended. A fee of SEK 0.3 million (0.3) was paid to the Chairman of the Board and a fee of SEK
Salaries and other remuneration to senior executives who report directly to the ceO
SeK million 2012 2011
CEO as of March 2012 3.7 2.9
Acting CEO from December 2011 up to and including February 2012 0.3 0.1
Head of Corporate Business Area 2.0 1.8
Head of Retail Business Area up to and including November 2012 1.6 1.6
Acting Head of Retail Business Area as of November 2012 0.2 –
Chief Information Officer 1.4 1.3
Head of Internal Audit 1.1 0.9
Chief Legal Counsel1) 1.5 1.3
Head of Compliance as of August 20121) 0.6 n/a
Former CRO up to and including February 2012 0.3 0.4
CRO as of August 2012 0.8 –
Human Resources Manager 1.3 1.3
Former Head of Communications up to and including May 2012 0.5 1.2
Head of Communications as of June 2012 1.0 –
Former CFO up to and including May 2012 0.8 0.5
CFO as of June 2012 1.1 –
Other former senior executives2) – 3.1
total 18.2 16.3
0.2 million (0.1) each to four of the six elected Board Members. The fee to the remaining two Board Members who were elected to the Board on 19 April 2012, totalled SEK 0.1 million each. No fees are paid to Board Members employed by the Ministry of Finance or the employee representatives who sit on the Board.
PensionsPension costs for the entire company, including special employer’s contributions, totalled SEK 58.1 million (51.3). Pension costs for the CEO for 2012, including special employer’s contributions, amounted to SEK 1.3 million (0.9). Pension costs for senior executives who report directly to the CEO or the Board, including special employer’s contributions, totalled SEK 5.4 million (4.4), distributed as above:
SBAB employees are covered by a pension plan that includes disa-bility pension, survivor’s coverage, retirement pension, supplementary pension and, in some cases, family pension. The pension plan also
Note 8 Personnel costs, Cont’d
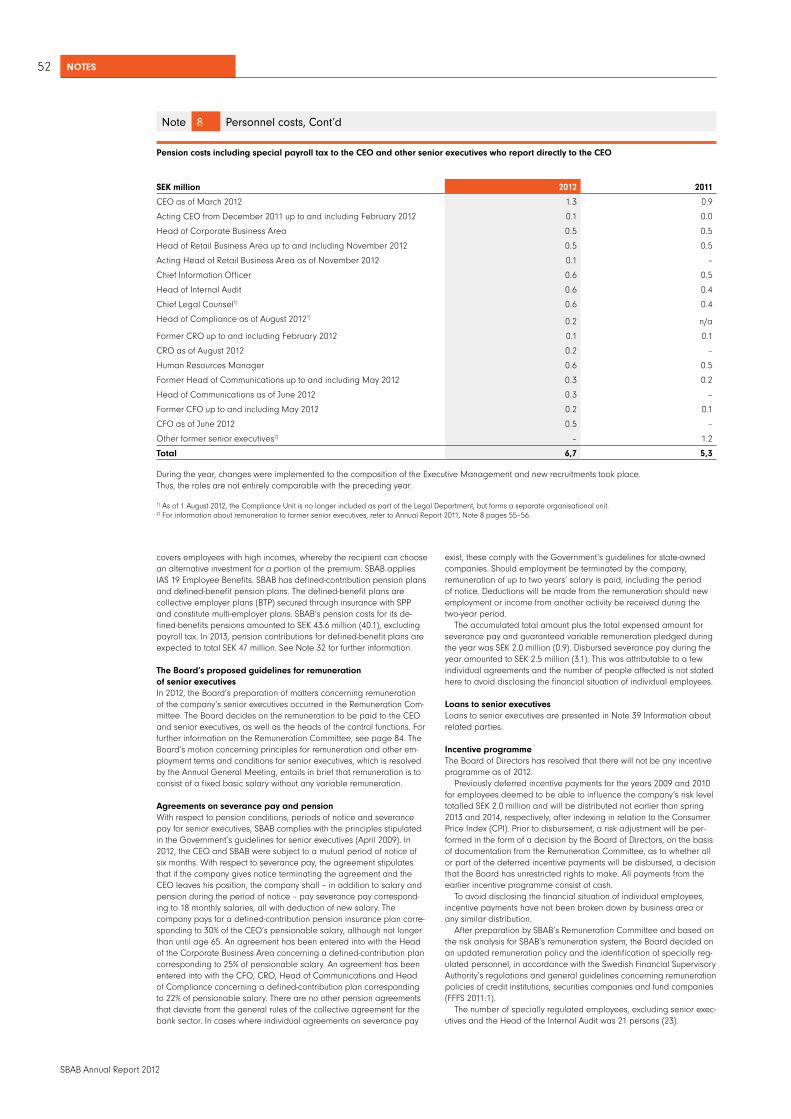
notes52
SBAB Annual Report 2012
Pension costs including special payroll tax to the ceO and other senior executives who report directly to the ceO
SeK million 2012 2011
CEO as of March 2012 1.3 0.9
Acting CEO from December 2011 up to and including February 2012 0.1 0.0
Head of Corporate Business Area 0.5 0.5
Head of Retail Business Area up to and including November 2012 0.5 0.5
Acting Head of Retail Business Area as of November 2012 0.1 –
Chief Information Officer 0.6 0.5
Head of Internal Audit 0.6 0.4
Chief Legal Counsel1) 0.6 0.4
Head of Compliance as of August 20121)0.2 n/a
Former CRO up to and including February 2012 0.1 0.1
CRO as of August 2012 0.2 –
Human Resources Manager 0.6 0.5
Former Head of Communications up to and including May 2012 0.3 0.2
Head of Communications as of June 2012 0.3 –
Former CFO up to and including May 2012 0.2 0.1
CFO as of June 2012 0.5 –
Other former senior executives2) – 1.2
total 6,7 5,3
During the year, changes were implemented to the composition of the Executive Management and new recruitments took place. Thus, the roles are not entirely comparable with the preceding year.
1) As of 1 August 2012, the Compliance Unit is no longer included as part of the Legal Department, but forms a separate organisational unit. 2) For information about remuneration to former senior executives, refer to Annual Report 2011, Note 8 pages 55–56.
covers employees with high incomes, whereby the recipient can choose an alternative investment for a portion of the premium. SBAB applies IAS 19 Employee Benefits. SBAB has defined-contribution pension plans and defined-benefit pension plans. The defined-benefit plans are collective employer plans (BTP) secured through insurance with SPP and constitute multi-employer plans. SBAB’s pension costs for its de-fined-benefits pensions amounted to SEK 43.6 million (40.1), excluding payroll tax. In 2013, pension contributions for defined-benefit plans are expected to total SEK 47 million. See Note 32 for further information.
the Board’s proposed guidelines for remuneration of senior executives In 2012, the Board’s preparation of matters concerning remuneration of the company’s senior executives occurred in the Remuneration Com-mittee. The Board decides on the remuneration to be paid to the CEO and senior executives, as well as the heads of the control functions. For further information on the Remuneration Committee, see page 84. The Board’s motion concerning principles for remuneration and other em-ployment terms and conditions for senior executives, which is resolved by the Annual General Meeting, entails in brief that remuneration is to consist of a fixed basic salary without any variable remuneration.
agreements on severance pay and pensionWith respect to pension conditions, periods of notice and severance pay for senior executives, SBAB complies with the principles stipulated in the Government’s guidelines for senior executives (April 2009). In 2012, the CEO and SBAB were subject to a mutual period of notice of six months. With respect to severance pay, the agreement stipulates that if the company gives notice terminating the agreement and the CEO leaves his position, the company shall – in addition to salary and pension during the period of notice – pay severance pay correspond-ing to 18 monthly salaries, all with deduction of new salary. The company pays for a defined-contribution pension insurance plan corre-sponding to 30% of the CEO’s pensionable salary, although not longer than until age 65. An agreement has been entered into with the Head of the Corporate Business Area concerning a defined-contribution plan corresponding to 25% of pensionable salary. An agreement has been entered into with the CFO, CRO, Head of Communications and Head of Compliance concerning a defined-contribution plan corresponding to 22% of pensionable salary. There are no other pension agreements that deviate from the general rules of the collective agreement for the bank sector. In cases where individual agreements on severance pay
exist, these comply with the Government’s guidelines for state-owned companies. Should employment be terminated by the company, remuneration of up to two years’ salary is paid, including the period of notice. Deductions will be made from the remuneration should new employment or income from another activity be received during the two-year period.
The accumulated total amount plus the total expensed amount for severance pay and guaranteed variable remuneration pledged during the year was SEK 2.0 million (0.9). Disbursed severance pay during the year amounted to SEK 2.5 million (3.1). This was attributable to a few individual agreements and the number of people affected is not stated here to avoid disclosing the financial situation of individual employees.
Loans to senior executivesLoans to senior executives are presented in Note 39 Information about related parties.
Incentive programmeThe Board of Directors has resolved that there will not be any incentive programme as of 2012.
Previously deferred incentive payments for the years 2009 and 2010 for employees deemed to be able to influence the company’s risk level totalled SEK 2.0 million and will be distributed not earlier than spring 2013 and 2014, respectively, after indexing in relation to the Consumer Price Index (CPI). Prior to disbursement, a risk adjustment will be per-formed in the form of a decision by the Board of Directors, on the basis of documentation from the Remuneration Committee, as to whether all or part of the deferred incentive payments will be disbursed, a decision that the Board has unrestricted rights to make. All payments from the earlier incentive programme consist of cash.
To avoid disclosing the financial situation of individual employees, incentive payments have not been broken down by business area or any similar distribution.
After preparation by SBAB’s Remuneration Committee and based on the risk analysis for SBAB’s remuneration system, the Board decided on an updated remuneration policy and the identification of specially reg-ulated personnel, in accordance with the Swedish Financial Supervisory Authority’s regulations and general guidelines concerning remuneration policies of credit institutions, securities companies and fund companies (FFFS 2011:1).
The number of specially regulated employees, excluding senior exec-utives and the Head of the Internal Audit was 21 persons (23).
Note 8 Personnel costs, Cont’d
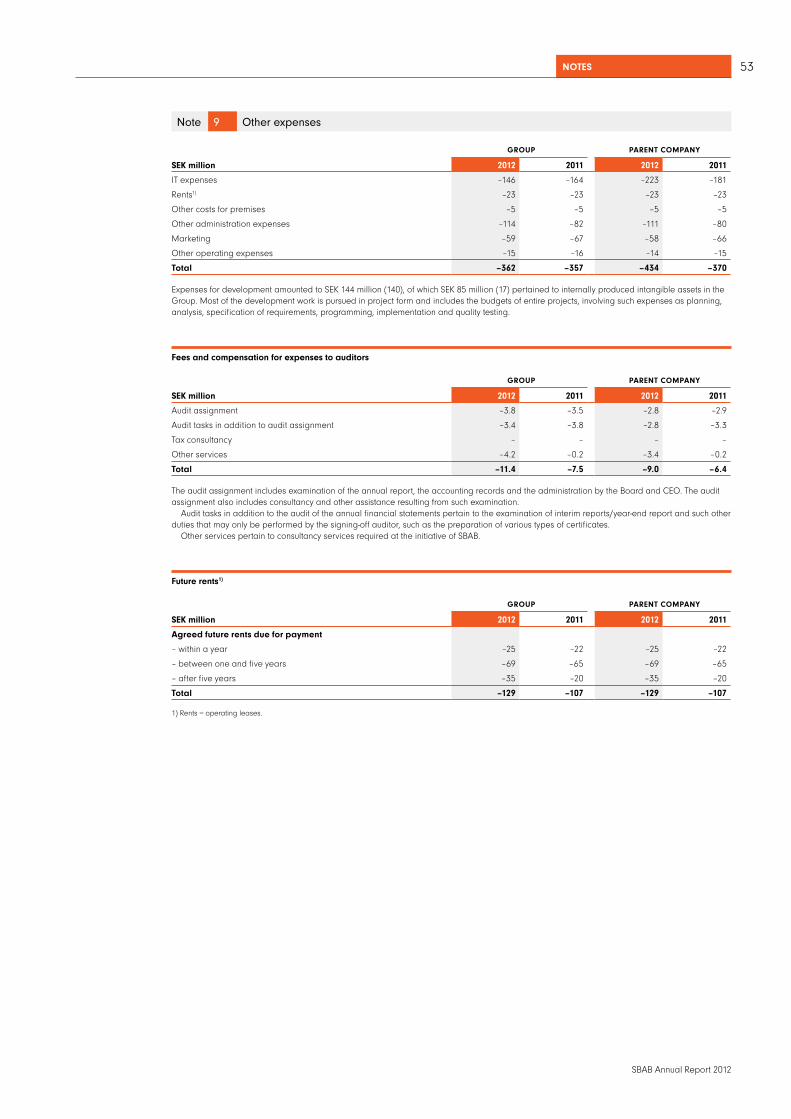
notes 53
SBAB Annual Report 2012
Note 9 Other expenses
GROUP PaRent cOmPany
SeK million 2012 2011 2012 2011
IT expenses –146 –164 –223 –181
Rents1) –23 –23 –23 –23
Other costs for premises –5 –5 –5 –5
Other administration expenses –114 –82 –111 –80
Marketing –59 –67 –58 –66
Other operating expenses –15 –16 –14 –15
total –362 –357 –434 –370
Expenses for development amounted to SEK 144 million (140), of which SEK 85 million (17) pertained to internally produced intangible assets in the Group. Most of the development work is pursued in project form and includes the budgets of entire projects, involving such expenses as planning, analysis, specification of requirements, programming, implementation and quality testing.
Fees and compensation for expenses to auditors
GROUP PaRent cOmPany
SeK million 2012 2011 2012 2011
Audit assignment –3.8 –3.5 –2.8 –2.9
Audit tasks in addition to audit assignment –3.4 –3.8 –2.8 –3.3
Tax consultancy – – – –
Other services –4.2 –0.2 –3.4 –0.2
total –11.4 –7.5 –9.0 –6.4
The audit assignment includes examination of the annual report, the accounting records and the administration by the Board and CEO. The audit assignment also includes consultancy and other assistance resulting from such examination.
Audit tasks in addition to the audit of the annual financial statements pertain to the examination of interim reports/year-end report and such other duties that may only be performed by the signing-off auditor, such as the preparation of various types of certificates.
Other services pertain to consultancy services required at the initiative of SBAB.
Future rents1)
GROUP PaRent cOmPany
SeK million 2012 2011 2012 2011
agreed future rents due for payment
– within a year –25 –22 –25 –22
– between one and five years –69 –65 –69 –65
– after five years –35 –20 –35 –20
total –129 –107 –129 –107
1) Rents = operating leases.

notes54
SBAB Annual Report 2012
Note 10 Depreciation of property, plant and equipment and amortisation of intangible fixed assets
GROUP PaRent cOmPany
SeK million 2012 2011 2012 2011
Property, plant and equipment
Computer hardware –5 –5 –5 –5
Other equipment –6 –5 –6 –5
Intangible fixed assets
Acquired software –4 –3 –4 –3
Internally developed part of software –9 –14 – –
total –24 –27 –15 –13
Note 11 Loan losses, net
GROUP PaRent cOmPany
SeK million 2012 2011 2012 2011
cORPORate maRKet
Individual provision for corporate market loans
Write-off of confirmed loan losses for the year –0 –17 –0 –17
Reversal of prior year provisions for probable loan losses recognised as confirmed loan losses in the financial statements for the year – 20 – 20
Provision for probable loan losses for the year –26 –0 –26 –0
Recoveries in respect of confirmed loan losses in prior years 0 0 0 0
Reversal of prior year provisions for probable loan losses no longer required 26 5 26 5
Guarantees –0 –0 –0 –0
net income/cost for the year for individual provisions for corporate market loans –0 8 –0 8
collective provision for corporate market loans
Redemption of collective provisions 4 7 5 7
Guarantees –6 8 1 –0
net income/cost for the year for collective provisions for corporate market loans –2 15 6 7
RetaIL maRKet
Individual provision for retail market loans
Write-off of confirmed loan losses for the year –9 –4 –9 –4
Reversal of prior year provisions for probable loan losses recognised as confirmed loan losses in the financial statements for the year 5 5 5 5
Provision for probable loan losses for the year –9 –8 –9 –5
Reversal of prior year provisions for probable loan losses no longer required 0 – 0 –
Guarantees – – – –
net cost for the year for individual provisions for retail market loans –13 –7 –13 –4
collective provision for retail market loans
Write-off of confirmed loan losses for the year –27 –13 –25 –12
Recoveries in respect of confirmed loan losses in prior years 3 6 3 6
Allocation to/redemption of collective provisions 19 –24 –14 –8
Guarantees 0 7 9 6
net cost for the year for collective provisions for retail market loans –5 –24 –27 –8
net IncOme/cOSt FOR tHe yeaR FOR LOan LOSSeS –20 –8 –34 3
Both the write-off of confirmed loan losses for the period and reversal of prior year write-offs as specified above relate to receivables from the public. The guarantees pertain to received or expected receivables from the National Board of Housing, Building and Planning, insurance compa-nies and banks.
For additional analyses and information on loan losses, refer to Note 2a Risk management – Credit risk in lending operations.

notes 55
SBAB Annual Report 2012
Note 12 Tax
GROUP PaRent cOmPany
SeK million 2012 2011 2012 2011
Current tax –247 –122 –194 –
Deferred tax 107 –1 183 –23
total –140 –123 –11 –23
The effective tax rate differs from the nominal tax rate in Sweden as below
Profit before tax 503 464 104 98
Nominal tax rate in Sweden 26.3% –132 –122 –27 –26
Restatement of deferred tax to 22% –7 13
Tax-exempt dividend from subsidiary – – 4 3
Tax for prior years and other –1 –1 –1 –1
total tax –140 –123 –11 –23
Effective tax rate 27.9% 26.5% 10.9% 23.8%
Note 13 Chargeable treasury bills and other eligible bills
GROUP PaRent cOmPany
SeK million 2012 2011 2012 2011
current assets measured at fair value through profit or loss
Swedish state 4,808 3,501 4,808 3,501
Foreign states 8,052 2,448 8,052 2,448
total chargeable treasury bills and other eligible bills 12,860 5,949 12,860 5,949
Holdings of chargeable treasury bills and other eligible bills distributed by remaining maturity, carrying amount
At most 1 year 2,515 172 2,515 172
Longer than 1 year but at most 5 years 8,756 4,771 8,756 4,771
Longer than 5 years but at most 10 years 1,589 1,006 1,589 1,006
Longer than 10 years – – – –
total 12,860 5,949 12,860 5,949
Average remaining maturity, years 2.8 3.9 2.8 3.9
Average remaining fixed-interest period, years 2.8 3.9 2.8 3.9
Note 14 Lending to credit institutions
GROUP PaRent cOmPany
SeK million 2012 2011 2012 2011
Lending in SEK 14,117 23,136 44,286 56,141
Lending in foreign currency 4,152 318 4,149 271
total 18,269 23,454 48,435 56,412
of which repos 11,809 13,351 1,860 5,443
Lending to credit institutions distributed by remaining maturity, net carrying amount
Payable on demand 5,706 1,556 45,181 37,690
At most 3 months 11,916 17,814 1,933 10,388
Longer than 3 months but at most 1 year 445 2,412 910 4,921
Longer than 1 year but at most 5 years 182 1,640 371 3,347
Longer than 5 years 20 32 40 66
total 18,269 23,454 48,435 56,412
Average remaining maturity, years 0,1 0,2 0,0 0,2
Of the Parent Company’s lending to credit institutions, SEK 39,602 million (36,300) relates to a receivable from the wholly owned subsidiary The Swedish Covered Bond Corporation, SCBC (publ). These receivables are subordinated, which means that payment is received only after other creditors of the subsidiary have been paid.

notes56
SBAB Annual Report 2012
Note 15 Lending to the public
GROUP PaRent cOmPany
SeK million 2012 2011 2012 2011
Opening balance 248,499 249,455 33,121 35,519
Lending for the year 34,878 31,107 31,673 27,682
Transferred to/from Group companies – – –303 –13,250
Amortisation, write-offs, redemption, etc. –27,095 –32,063 –17,917 –16,830
Closing balance 256,282 248,499 46,574 33,121
Provision for probable loan losses –336 –349 –214 –181
closing balance 255,946 248,150 46,360 32,940
of which subordinated assets – – – –
Receivables outstanding distributed by remaining maturity, net carrying amount
Payable on demand – – – –
At most 3 months 32,171 32,995 7,076 3,775
Longer than 3 months but at most 1 year 120,403 110,592 28,281 14,025
Longer than 1 year but at most 5 years 99,749 99,752 10,147 14,535
Longer than 5 years 3,623 4,811 856 605
total 255,946 248,150 46,360 32,940
Average remaining maturity, years 1.3 1.4 1.1 1.4
GROUP Distribution of lending by property type
SeK million
2012 2011
FriSpar Bolån aB
the Swedish co-vered Bond corporation
(ScBc)SBaB Bank aB ( publ)
total within Group*
FriSpar Bolån aB
the Swedish co-vered Bond corporation
(ScBc)SBaB Bank aB ( publ)
total within Group*
Single-family dwellings and holiday homes 975 84,471 15,259 100,227 6,464 82,730 8,503 94,530
Tenant-owner rights 387 51,650 9,829 61,677 2,736 48,699 6,360 56,454
Tenant-owner associations 20 46,668 8,521 55,199 23 47,920 5,406 53,338
Private multi-family dwellings 13 21,688 4,801 26,496 70 25,202 3,841 29,079
Municipal multi-family dwellings – 4,439 357 4,796 – 5,904 216 6,120
Commercial properties – 80 7,048 7,128 – 183 8,365 8,548
Other – – 759 759 – – 430 430
Provision for probable loan losses –1 –121 –214 –336 –14 –160 –181 –349
total 1.394 208,875 46,360 255,946 9,279 210,478 32,940 248,150
Percentage of lending with a government or municipal guarantee – 2 1 2 – 3 1 2
Average fixed-interest period, years 1,0 1,1 0,5 1,0 1,0 1,1 0,7 1,0
* The Group includes 51% of FriSpar Bolån AB.
In the event of early redemption during the fixed-interest period, SBAB has the right to receive so-called interest compensation. The amount of compensation in the case of retail market loans is based on the interest rate on government bonds/treasury bills with a comparable remaining maturity up to the interest adjustment date +1%. For other loans, the reinvestment interest rate for comparable government securities is, in most cases, the comparable interest rate. In other cases, the compara-ble interest rate is specified in the current terms of the loan.
In addition to mortgage deeds in pledged property, SBAB has, in certain cases, received government or municipal guarantees as collat-eral for the borrower’s commitments. The proportion of loans covered by this type of guarantee is shown in the table above.
A total of SEK 64,906 million (54,735) of SBAB’s lending portfolio, of which SEK 11,744 million (6,030) in the Parent Company, was provided by business partners and it is possible for certain partners, in the event of a change of ownership of SBAB, to acquire brokered loans.
Loan commitments and other credit-related commitments are shown in Note 36.

notes 57
SBAB Annual Report 2012
Doubtful loan receivables and provisions
GROUP PaRent cOmPany
SeK million 2012 2011 2012 2011
a) Doubtful loan receivables 67 81 67 78
b) Individual provisions, loan receivables 54 50 54 47
c) Collective provisions, corporate market loans 27 31 13 7
d) Collective provisions, retail market loans 255 268 147 127
e) Total provisions (b+c+d) 336 349 214 181
f) Doubtful loan receivables after individual provisions (a-b) 13 31 13 31
g) Provision ratio for individual provisions (b/a) 81% 62% 81% 60%
For further information on doubtful and non-performing loan receivables, refer to Note 2a Risk management – Credit risk in lending operations.
GROUP Distribution of doubtful loan receivables and provisions by type of property
SeK million
2012 2011
Single-family
dwellings and
holiday homes
tenant-owner rights
tenant-owner
associa-tions
Private multi-
family dwellings Other total
Single-family
dwellings and
holiday homes
tenant-owner rights
tenant-owner
associa-tions
Private multi-
family dwellings Other total
Doubtful loan receivables, gross 9 16 – 42 67 4 17 44 16 81
Individual provisions, loan receivables –6 –14 – –34 –54 –4 –12 –24 –10 –50
Collective provisions, corporate market loans –15 –12 –27 –5 –26 –31
Collective provisions, retail market loans –164 –84 –7 –255 –158 –106 –4 –268
Doubtful loan receivables after individual provisions 13 31
Note 16 Change in value of interest-rate-hedged items in portfolio hedges
GROUP PaRent cOmPany
SeK million 2012 2011 2012 2011
Carrying amount at the beginning of the year 1,557 500 –8 –14
Terminated hedges –35 –7 8 6
Remeasurement of hedged items 95 1 064 – –
total 1,617 1,557 – –8
Carrying amount at the end of the year refers to accumulated changes in the fair value of the hedged item in the portfolio hedge.
Note 15 Lending to the public, Cont’d

notes58
SBAB Annual Report 2012
Note 17 Bonds and other interest-bearing securities
GROUP PaRent cOmPany
SeK million 2012 2011 2012 2011
Securities measured at fair value through profit or loss 26,633 32,307 26,633 32,307
Securities classified as loans and receivables, measured at amortised cost 4,819 9,249 4,819 9,249
total 31,452 41,556 31,452 41,556
Distribution of holdings by issuer, etc.
cURRent aSSetS
Listed securities
Issued by public bodies
Intergovernmental issuers 1,537 583 1,537 583
Other public issuers 3,683 2,393 3,683 2,393
Issued by other borrowers
Swedish banks (with government guarantee) 805 1,678 805 1,678
Swedish mortgage institutions 13,816 17,895 13,816 17,895
Other foreign issuers (covered bonds, RMBS) 8,321 18,111 8,321 18,111
Other foreign issuers (with government guarantee) 3,290 896 3,290 896
total listed securities 31,452 41,556 31,452 41,556
Unlisted securities – – – –
total 31,452 41,556 31,452 41,556
of which subordinated assets – – – –
Bonds and other interest-bearing securities
At most 1 year 3,152 9,533 3,152 9,533
Longer than 1 year but at most 5 years 23,495 25,893 23,495 25,893
Longer than 5 years but at most 10 years 3,942 5,090 3,942 5,090
Longer than 10 years 863 1,041 863 1,041
total 31,452 41,556 31,452 41,556
Average remaining maturity, years 3.6 2.8 3.6 2.8

notes 59
SBAB Annual Report 2012
Note 18 Derivative instruments
GROUP PaRent cOmPany
SeK million 2012 2011 2012 2011
Fair value
assets
Fair value
liabilitiesnominal amount
Fair value
assets
Fair value
liabilitiesnominal amount
Fair value
assets
Fair value
liabilitiesnominal amount
Fair value
assets
Fair value
liabilitiesnominal amount
Derivatives in fair-value hedges
Interest-rate related
– interest-rate swaps 8,470 4,654 273,270 8,093 4,415 329,905 1,385 40 21,540 1,679 49 28,224
Currency related 2,623 5,192 66,543 6,856 4,374 91,142 1,021 1,686 33,682 4,358 2,200 45,278
total 11,093 9,846 339,813 14,949 8,789 421,047 2,406 1,726 55,222 6,037 2,249 73,502
Other derivatives
Interest-rate related
– interest-rate swaps 526 2,063 49,411 745 2,648 95,625 7,522 9,302 387,658 5,747 7,987 545,295
– interest-rate swaps futures 17 17 0 72 51 3,266 17 17 0 72 51 3,266
Currency related 1,109 3,457 79,662 1,730 2,572 79,985 1,554 2,864 80,823 1,957 1,822 73,565
total 1,652 5,537 129,073 2,547 5,271 178,876 9,093 12,183 468,481 7,776 9,860 622,126
Note 19 Shares and participations
SeK million
GROUP PaRent cOmPany
2012 2011 2012 2011
Fund units measured at fair value through profit or loss 150 – 150 –
total 150 – 150 –
Hedge accountingHedge accounting is only applied for hedging relationships where the risk of a significant fluctuation in profit or loss is considered the greatest.
Fair-value hedgesSBAB mainly uses fair-value hedges to protect against changes in the fair value of lending and funding at fixed interest rates and to hedge currency exposure of funding in foreign currency. The hedge instruments primarily used are interest-rate and currency interest-rate swaps. Curren-cy interest-rate swaps are defined as currency-related above. SBAB applies hedge accounting solely for currency and interest-rate risk.
GroupAt 31 December 2012, the nominal amount of derivatives held for fair-value hedging was SEK 340.0 billion (421.0). The fair value of these derivatives was SEK 1,247 million (6,160) and the year’s change in value amounted to a negative SEK 333 million (pos: 3,185). The change in fair value of the hedged items with respect to hedged risk
amounted to a negative SEK 742 million (neg: 3,285) and the realised loss on the repurchased debt was SEK 192 million (loss: 116).
Accordingly, the Group’s hedge accounting for fair value and com-pleted repurchases had a negative impact of SEK 1,267 million (neg: 216) on profit for the year. The results were negatively impacted by value changes on basis swaps.
Parent CompanyAt 31 December 2012, the nominal amount of derivatives held for fair-val-ue hedging was SEK 55.2 billion (73.5). The fair value of these derivatives was SEK 680 million (3,788) and the year’s change in value amounted to a negative SEK 304 million (pos: 799). The change in fair value of the hedged items with respect to hedged risk amounted to a negative SEK 62 million (neg: 804) and the realised loss on the repurchased debt was SEK 21 million (loss: 21) Accordingly, the Parent Company’s hedge accounting for fair value and completed repurchases had a negative impact of SEK 387 million (neg: 26) on profit for the year. The results were negatively impacted by value changes on basis swaps.
Derivative instruments distributed by remaining maturity, carrying amount
GROUP PaRent cOmPany
SeK million 2012 2011 2012 2011
Fair valuenominal amount Fair value
nominal amount Fair value
nominal amount Fair value
nominal amount
At most 3 months –1,188 45,816 685 74,429 –798 54,845 694 76,103
3–12 months 298 86,456 890 84,388 –38 118,379 –97 78,864
1–5 years –1,476 315,035 2,264 388,523 –1,285 317,374 –541 297,511
Longer than 5 years –272 21,579 –403 52,582 –289 33,105 1,648 243,150
total –2,638 468,886 3,436 599,922 –2,410 523,703 1,704 695,628

notes60
SBAB Annual Report 2012
Note 20 Shares and participations in joint ventures
FriSpar Bolån AB is a joint venture and is recognised in accordance with the proportional method. The company is domiciled in Stockholm. For more information about the company, see page 19-20.
PaRent cOmPany
SeK million 2012 2011
Swedish credit institutionsFriSpar Bolån aB
556248-3338FriSpar Bolån aB
556248-3338
Cost at the beginning of the year 733 587
Shareholder contribution 97 146
cost at the end of the year 830 733
The assets are expected to be disposed of after more than 12 months.
2012 2011
Swedish credit institutionsFriSpar Bolån aB
556248-3338FriSpar Bolån aB
556248-3338
Number of shares 6,120 6,120
Share of ownership 51 51
Share of equity 56 51
Carrying amount, SEK million 830 733
SeK million 2012 2011
Swedish credit institutionsFriSpar Bolån aB
556248-3338FriSpar Bolån aB
556248-3338
Current assets 13 9
Fixed assets 1,470 5,473
Current liabilities 15 30
Long-term liabilities 689 4,700
Income 30 34
Expenses –4 –12
The amounts relate to the Parent Company’s share, meaning 51% of FriSpar Bolån AB’s corresponding amount.
Note 21 Shares and participations in Group companies
The Swedish Covered Bond Corporation is domiciled in Stockholm. For more information about the company, see page 18-20.
PaRent cOmPany
SeK million 2012 2011
Swedish credit institutions
the Swedish covered Bond corporation
556645-9755Stockholm
the Swedish covered Bond corporation
556645-9755Stockholm
Cost at the beginning of the year 9,600 9,600
Shareholder contribution – –
cost at the end of the year 9,600 9,600
The assets are expected to be disposed of after more than 12 months.
2012 2011
Swedish credit institutions
the Swedish covered Bond corporation
556645-9755Stockholm
the Swedish covered Bond corporation
556645-9755Stockholm
Number of shares 500,000 500,000
Share of equity 100 100
Carrying amount, SEK million 9,600 9,600

notes 61
SBAB Annual Report 2012
Note 22 Intangible fixed assets
GROUP PaRent cOmPany
Software SeK million
2012 2011 2012 2011
Cost at the beginning of the year 177 156 52 48
Acquisitions during the year 97 21 11 4
Divestments during the year –1 – – –
cost at the end of the year 273 177 63 52
Amortisation at the beginning of the year –139 –122 –46 –43
Amortisation for the year according to plan –12 –17 –3 –3
Divestments during the year – – – –
accumulated amortisation according to plan –151 –139 –49 –46
net carrying amount 122 38 14 6
Borrowing costs are capitalised for assets that are produced internally and take a significant amount of time to utilise. In 2012, borrowing costs of SEK 2 million (0) were capitalised. The average interest rate for the periods and assets in question was 2.7% (3.3).
Note 23 Property, plant and equipment
GROUP PaRent cOmPany
SeK million 2012 2011 2012 2011
Cost at the beginning of the year 151 140 151 140
Acquisitions during the year 14 12 14 12
Divestments during the year –1 –1 –1 –1
cost at the end of the year 164 151 164 151
Amortisation at the beginning of the year –121 –112 –121 –112
Amortisation for the year according to plan –11 –10 –11 –10
Divestments during the year 1 1 1 1
accumulated amortisation according to plan –131 –121 –131 –121
net carrying amount 33 30 33 30
Note 24 Other assets
GROUP PaRent cOmPany
SeK million 2012 2011 2012 2011
Securities settlement receivables – 8 – 8
Past due interest receivables 189 71 57 29
Group contribution – – – 510
Other 49 240 19 171
total 238 319 76 718
Other assets distributed by remaining maturity, carrying amount
At most 1 year 238 319 76 718
Longer than 1 year – – – –
total 238 319 76 718

notes62
SBAB Annual Report 2012
Note 25 Prepaid expenses and accrued income
GROUP PARENT COMPANY
SEK million 2012 2011 2012 2011
Prepaid expenses 26 27 26 25
Accrued interest income 849 1,090 641 832
Accrued guarantees 68 69 40 25
Other accrued income 19 15 12 17
Total 962 1,201 719 899
Prepaid expenses and accrued income distributed by remaining maturity, carrying amount
At most 1 year 917 1,154 692 882
Longer than 1 year 45 47 27 17
Total 962 1,201 719 899
Note 26 Liabilities to credit institutions
GROUP PARENT COMPANY
SEK million 2012 2011 2012 2011
Liabilities in SEK 14,477 14,823 1,685 4,978
Lilabilities in foreign currency 3,061 6,410 758 4,710
Total 17,538 21,233 2,443 9,688
of which repos 14,151 16,614 2,005 8,232
Liabilities to credit institutions distributed by remaining maturity, carrying amount
Payable on demand 3,387 4,619 438 1,455
At most 3 months 14,151 16,614 2,005 8,233
Total 17,538 21,233 2,443 9,688
Average remaining maturity, years 0.0 0.0 0.0 0.1
Note 27 Deposits from the public
GROUP PARENT COMPANY
SEK million 2012 2011 2012 2011
Private individuals 22,518 7,344 22,518 7,344
Tenant-owner associations 1,633 980 1,633 980
Corporate 3,503 445 3,503 445
Total 27,654 8,769 27,654 8,769
Deposits from the public distributed by remaining maturity, carrying amount
Payable on demand 27,568 8,675 27,568 8,675
At most 3 months 15 4 15 4
Longer than 3 months but at most 1 year 8 31 8 31
Longer than 1 year but at most 5 years 63 59 63 59
Longer than 5 years – – – –
Total 27,654 8,769 27,654 8,769

notes 63
SBAB Annual Report 2012
Note 28 Debt securities in issue
GROUP PARENT COMPANY
SEK million 2012 2011 2012 2011
Commercial paper programmes
Commercial paper programmes in SEK
– at amortised cost 8,982 12,669 8,982 12,669
Commercial paper programmes in foreign currency
– at amortised cost 16,013 13,924 16,013 13,924
Total 24,995 26,593 24,995 26,593
Bond loans
Bond loans in SEK
– at amortised cost 37,090 25,670 29,203 17,003
– in fair-value hedging 98,970 109,290 4,931 15,115
Bond loans in foreign currency
– at amortised cost 35,103 43,133 23,686 28,500
– in fair-value hedging 57,739 71,992 18,967 29,542
Total 228,902 250,085 76,787 90,160
Total debt securities in issue 253,897 276,678 101,782 116,753
of which covered bonds 152,874 160,658 – –
Debt securities in issue distributed by remaining maturity, carrying amount
At most 1 year 68,992 76,713 49,003 57,777
Longer than 1 year but at most 5 years 180,206 184,049 51,647 57,749
Longer than 5 years but at most 10 years 3,658 14,260 1,095 1,184
Longer than 10 years 1,041 1,656 37 43
Total 253,897 276,678 101,782 116,753
Average remaining maturity, years 2.2 2.3 1.4 1.4
Average remaining fixed-interest period, years 1.9 1.9 0.9 0.9
The bond loan conditions in SBAB’s long-term funding programme include a possibility for the bondholder to demand premature redemption of the holder’s bonds issued in such loan programmes if the Swedish state ceases to own the majority of the shares in SBAB and the Swedish state, before such change in ownership, has not taken steps to guarantee SBAB’s commitments ensuing from the bond loan or the bondholders have accepted this in such a way as is described in current terms and conditions. However, subordinated debentures and Tier 1 contributions issued under the long-term funding programme do not include the aforesaid conditions. Total funding under these programmes with the right to demand redemption amounted to SEK 70.3 billion (70.4) at 31 December 2012.
Note 29 Other liabilities
GROUP PARENT COMPANY
SEK million 2012 2011 2012 2011
Accounts payable 24 17 24 17
Employee withholding tax 6 5 6 5
Tax liabilities – – 12 –
Liabilities to borrowers 82 79 65 38
Other 249 60 249 60
Total 361 161 356 120
Other liabilities distributed by remaining maturity, carrying amount
At most 1 year 361 161 356 120
Longer than 1 year – – – –
Total 361 161 356 120

notes64
SBAB Annual Report 2012
Note 30 Accrued expenses and prepaid income
GROUP PARENT COMPANY
SEK million 2012 2011 2012 2011
Accrued interest expense 3,403 3,765 594 685
Other accrued expenses 295 302 241 218
Total 3,698 4,067 835 903
Accrued expenses and prepaid income distributed by remaining maturity, carrying amount
At most 1 year 3,698 4,067 835 903
Longer than 1 year – – – –
Total 3,698 4,067 835 903
Note 31 Deferred tax
GROUP PARENT COMPANY
SEK million 2012 2011 2012 2011
Deferred tax assets (+)/tax liabilities (-) for temporary differences in
– Change in value of interest-rate-hedged items in portfolio hedges 113 269 – –
– Bonds –95 –219 –95 –219
– Debt securities in issue 1,195 1,217 207 231
– Derivative instruments –1,173 –1,357 –178 –262
– Intangible fixed assets –24 –8 – –
– Provision for pensions 19 25 – –
– Other 1 2 1 2
Total 36 –71 –65 –248
Change in deferred tax
Deferred tax in profit or loss 107 0 183 –23
Deferred tax attributable to items recognised directly in equity – –11 – –11
Total 107 –11 183 –34
Deferred tax distributed by expected maturity date, carrying amount
At most 1 year – – – –
Longer than 1 year 36 –71 –65 –248
Total 36 –71 –65 –248
Note 32 Provisions
GROUP
SEK million 2012 2011
Provisions for pensions –69 –76
Provision for special employer’s contribution on pensions –17 –18
Total –86 –94
Provisions for pensions
Summary of defined-benefit pension plan
GROUP
SEK million 2012 2011
Present value of the obligation, closing balance 298 272
Fair value of plan assets –236 –211
Unrecognised actuarial gain (+) / loss (–), net 7 15
Provisions for pensions 69 76
Changes pertaining to pension obligations
GROUP
SEK million 2012 2011
Present value of the obligation, opening balance 272 291
Cost pertaining to service during the period 11 12
Interest expense 11 10
Pension disbursements –4 –4
Actuarial gain (–) / loss (+) during the period 8 –37
of which experience-based –7 5
Present value of the obligation, closing balance 298 272

notes 65
SBAB Annual Report 2012
Changes in fair value of plan assets
GROUP
SEK million 2012 2011
Fair value, opening balance 211 181
Expected return 11 9
Premium payments 18 14
Disbursed compensation –4 –4
Actuarial gain (+) / loss (–) during the period 0 11
of which experience-based 0 11
Fair value, closing balance 236 211
The plan assets comprised 82% (82) interest-bearing instruments, 10% (11) equities and 8% (7) alternative investments. The return on plan assets was 7% (9).
Pension cost pertaining to defined-benefit pension plan
GROUP
SEK million 2012 2011
Cost pertaining to service during the period 11 12
Interest expense 11 10
Expected return on plan assets –11 –9
Amortisation of actuarial gain (–) / loss (+) –0 0
Total pension cost for de-fined-benefit pension plan
11 13
Actuarial and financial obligations
GROUP
% 2012 2011
Discount rate 3.50 3.75
Return on plan assets 5.00 5.00
Annual salary increase 3.00 3.00
Annual increase in income base amount 3.00 3.00
Annual inflation 2.00 2.00
Retirement frequency 6.00 6.00
Mortality table DUS06 DUS06
Unrecognised actuarial gain (+) / loss (–), net
GROUP
SEK million 2012 2011
Unrecognised actuarial gain (+) / loss (–), net, opening balance 15 –33
Corridor limit, opening balance 27 29
Amortisation of actuarial gain (–) / loss (+) – 0
Actuarial gain (+) / loss (–) on present value of the obligation during the period –8 37
Actuarial gain (+) / loss (–) on plan assets during the period 0 11
Unrecognised accumulated actuarial gain (+) / loss (–), net, closing balance 7 15
Sensitivity analysis of obligations
GROUP
Discount rate 2012
Obligations 4.50%
Present value of the obligation, SEK million 243
Cost pertaining to service during the current period, SEK million 7
Interest expense, SEK million 11
Obligations 2.50%
Present value of the obligation, SEK million 371
Cost pertaining to service during the current period, SEK million 13
Interest expense, SEK million 9
For further information about pensions, refer to Note 8 Personnel costs.
Note 32 Provisions, Cont’d

notes66
SBAB Annual Report 2012
Note 33 Subordinated debt
PARENT COMPANY AND GROUP
Loan designation CurrencyNominal amount
Nominal amount outstanding
First possible redemption
right for SBAB
Interest rate, %31 Dec 2012
Maturity date
Carrying amount, SEK million
2012 2011
Subordinated debenture JPY 1 JPY 10,000,000,000 10,000,000,000 – 5.23 16 Nov 2015 853 1 034
Subordinated debenture SEK 1 SEK 700,000,000 700,000,000 2016 5.22 Perpetual 765 765
Subordinated debenture SEK 2 SEK 300,000,000 300,000,000 2016 3 M STIBOR+0.93 Perpetual 300 300
Subordinated debenture SEK 3 SEK 1,000,000,000 1,000,000,000 2013 7.32 25 Apr 2018 1,010 1,031
Subordinated debenture SEK 4 SEK 2,000,000,000 2,000,000,000 2015 7.16 Perpetual 2,054 2,037
Subordinated debenture SEK 5 SEK 1,000,000,000 1,000,000,000 2016 6.12 20 Apr 2021 1,070 1,066
Subordinated debenture SEK 6 SEK 800,000,000 800,000,000 2017 3 M STIBOR+2.65 16 Nov 2022 800 –
Subordinated debenture SEK 7 SEK 200,000,000 200,000,000 2017 4.18 16 Nov 2022 200 –
Total 7,052 6,233
of which Group companies – –
Note 34 Equity
The share capital amounts to SEK 1,958,300,000. The number of shares is 19,583, each with a quotient value of SEK 100,000, as in previous years. All shares are owned by the Swedish state.
Dividends are proposed by the Board in accordance with the provi-sions of the Companies Act and are resolved by the Annual General Meeting. It is proposed that no dividend be paid for 2012. The decision was made not to pay a dividend for the years 2010 to 2011.
The subordinated debentures are subordinate to the Parent Company’s other liabilities, which means that they carry entitlement to payment only after other unsubordinated creditors have received payment. Subordinated debentures SEK 1, SEK 2 and SEK 4 are subordinate to other subordinated debentures, known as Tier 1 capital contributions, and may be included in Tier 1 capital.
Permission has been obtained from the Swedish Financial Superviso-ry Authority to include these debentures in the company’s capital base for the purpose of calculating the Parent Company’s capital adequacy.
Subordinated debt is distributed among the following loans:JPY 1Maturity: 16 November 1995 to 16 November 2015. Interest rate: SBAB may opt to pay the interest in USD, EUR or JPY. The interest rate is 5.23% in the respective currency.
SEK 1The loan is perpetual. Interest rate: For the period 30 June 2006 to 30 June 2016: 5.22%. For the subsequent period: Floating interest corresponding to three-month STIBOR plus 1.93%.
SEK 2The loan is perpetual. Interest rate: For the period 30 June 2006 to 30 June 2016: Floating interest equivalent to three-month STIBOR plus 0.93%. For the subsequent period: Floating interest corresponding to three-month STIBOR plus 1.93%.
SEK 3Maturity: 25 April 2008 to 25 April 2018. Interest rate: For the period 25 April 2008 to 25 April 2013: 7.32%. For the subsequent period: Floating interest corresponding to three-month STIBOR plus 4.10%.
SEK 4The loan is perpetual. Interest rate: For the period 8 April 2010 to 8 June 2015: 7.16%. For the subsequent period: Floating interest corresponding to three-month STIBOR plus 4.50%.
SEK 5Maturity: 20 April 2011 to 20 April 2021. Interest rate: For the period 20 April 2011 to 20 April 2016: 6.123%. For the subsequent period: Floating interest corresponding to three-month STIBOR plus 2.40%.
SEK 6Maturity: 16 November 2012 to 16 November 2022. Interest rate: For the period 16 November 2012 to 16 November 2017: Floating interest corresponding to three-month STIBOR plus 2.65%. For the subsequent period: Floating interest corresponding to three-month STIBOR plus 2.65%.
SEK 7Maturity: 16 November 2012 to 16 November 2022. Interest rate: For the period 16 November 2012 to 16 November 2017: 4.18%. For the subsequent period: Floating interest corresponding to three-month STIBOR plus 2.65%

notes 67
SBAB Annual Report 2012
Note 35 Assets pledged for own liabilities
GROUP PARENT COMPANY
SEK million 2012 2011 2012 2011
Loan receivables 201,776 201,596 – –
Other receivables – 235 – 235
Repos 1,234 4,945 – –
Securities 2,117 8,126 2,117 8,232
Total 205,127 214,902 2,117 8,467
Of the assets pledged, SEK 203.0 billion (210.0) comprise the cover pool for covered bonds totalling SEK 152.9 billion (160.7).
Transferred financial assets not entirely removed from the balance sheet
GROUP PARENT COMPANY
SEK million 2012 2011 2012 2011
Securities measured at fair value 2,005 4,713 2,005 8,232
Carrying amount of associated liabilities 2,005 4,713 2,005 8,232
Note 36 Commitments
GROUP PARENT COMPANY
SEK million 2012 2011 2012 2011
Commitments concerning future payments – – – –
Other commitments
Loan commitments and other credit-related commitments 39,279 34,248 39,135 34,096
Unutilised portion of granted credit facilities – – – –
Other commitments – 487 20,452 19,794
Total 39,279 34,735 59,587 53,889
Commitments allocated by remaining maturity
Within 1 year 37,904 34,735 58,212 53,889
1–5 years 1,375 – 1,375 –
> 5 years – – – –
Total 39,279 34,735 59,587 53,889
Excluding building credits of SEK 1,573 million, loan commitments and other credit-related commitments in the Group totalling SEK 37,706 million (34,248) were reduced to SEK 5,731 million (5,126) after taking into account the conversion factor, meaning the statistically calculated probability that the exposure will lead to payment of the loan.
Excluding building credits of SEK 1,573 million, the corresponding figures for the Parent Company were SEK 37,562 million (34,096) and SEK 5,624 million (5,006), respectively.
The Parent Company’s other commitments include an agreement concerning liquidity facility with the subsidiary, SCBC, through which SCBC may borrow funds from the Parent Company for its operations if the need arises.
Fair value reserve PARENT COMPANY
SEK million 2012 2011
Cash-flow hedges at the beginning of the year – –1
Change in fair value – 1
Tax attributable to the change – –0
Cash-flow hedges at the end of the year
– –
Reclassification of financial as-sets at the beginning of the year –51 –79
Accrual of interest and currency ef-fect in reclassified financial assets 19 38
Tax attributable to the change –5 –10
Reclassified financial assets at the end of the year –37 –51
Total –37 –51
Statement of changes in equity
Other reserves GROUP
SEK million 2012 2011
Cash-flow hedges at the beginning of the year – –1
Change in fair value – 1
Tax attributable to the change – –0
Cash-flow hedges at the end of the year
– –
Reclassification of financial as-sets at the beginning of the year –51 –79
Accrual of interest and currency ef-fect in reclassified financial assets 19 38
Tax attributable to the change –5 –10
Reclassified financial assets at the end of the year –37 –51
Total –37 –51
Note 34 Equity, Cont’d

notes68
SBAB Annual Report 2012
Note 37 Classification of financial instruments
GROUP Financial assets
2012
SEK million
Hedge- accounted derivative
instruments
Loan receiva-bles in hedge
accounting
Assets mea-sured at fair
value through profit or loss
Other receivables Total
Total fair value
Cash and balances at central banks 0 0 0
Chargeable treasury bills and other eligible bills 12,860 12,860 12,860
Lending to credit institutions 18,269 18,269 18,202
Lending to the public 100,040 155,906 255,946 258,737
Change in value of interest-rate- hedged items in portfolio hedges 1,617 1,617 –
Bonds and other interest-bearing securities 26,633 4,819 31,452 31,022
Derivative instruments 11,093 1,652 12,745 12,745
Shares and participations 150 150 150
Other assets 238 238 238
Prepaid expenses and accrued income 103 580 279 962 962
Total 11,093 101,760 41,875 179,511 334,239 334,916
2011
SEK million
Hedge- accounted derivative
instruments
Loan receiva-bles in hedge
accounting
Assets mea-sured at fair
value through profit or loss
Other receivables Total
Total fair value
Cash and balances at central banks 0 0 0
Chargeable treasury bills and other eligible bills 5,949 5,949 5,949
Lending to credit institutions 23,454 23,454 23,495
Lending to the public 109,468 138,682 248,150 250,081
Change in value of interest-rate- hedged items in portfolio hedges 1,557 1,557 –
Bonds and other interest-bearing securities 32,307 9,249 41,556 40,725
Derivative instruments 14,949 2,547 17,496 17,496
Shares and participations – –
Other assets 319 319 319
Prepaid expenses and accrued income 142 751 308 1,201 1,201
Total 14,949 111,167 41,554 172,012 339,682 339,266

notes 69
SBAB Annual Report 2012
GROUP Financial liabilities
2012
SEK million
Hedge- accounted derivative
instruments
Liabilities covered by
hedge accounting
Liabilities measured
at fair value through profit
or loss
Other financial liabilities Total
Total fair value
Liabilities to credit institutions 17,538 17,538 17,538
Deposits from the public 27,654 27,654 27,654
Debt securities in issue 156,709 97,188 253,897 253,806
Derivative instruments 9,846 5,537 15,383 15,383
Other liabilities 361 361 361
Accrued expenses and prepaid income 3,243 455 3,698 3,698
Subordinated debt 5,752 1,300 7,052 7,083
Total 9,846 165,704 5,537 144,496 325,583 325,523
2011
SEK million
Hedge- accounted derivative
instruments
Liabilities covered by
hedge accounting
Liabilities measured
at fair value through profit
or loss
Other financial liabilities Total
Total fair value
Liabilities to credit institutions 21,233 21,233 21,233
Deposits from the public 8,769 8,769 8,769
Debt securities in issue 181,282 95,396 276,678 277,280
Derivative instruments 8,789 5,271 14,060 14,060
Other liabilities 161 161 161
Accrued expenses and prepaid income 3,566 501 4,067 4,067
Subordinated debt 5,933 300 6,233 6,264
Total 8,789 190,781 5,271 126,360 331,201 331,834
Note 37 Classification of financial instruments, Cont’d

notes70
SBAB Annual Report 2012
PARENT COMPANY Financial assets
2012
SEK million
Hedge- accounted derivative
instruments
Loan receivables
in hedge accounting
Assets mea-sured at fair
value through profit or loss
Other receivables Total
Total fair value
Cash and balances at central banks 0 0 0
Chargeable treasury bills and other eligible bills 12,860 12,860 12,860
Lending to credit institutions 48,435 48,435 48,443
Lending to the public 46,360 46,360 46,848
Change in value of interest-rate- hedged items in portfolio hedges – – –
Bonds and other interest-bearing securities 26,633 4,819 31,452 31,022
Derivative instruments 2,406 9,093 11,499 11,499
Shares and participations 150 150 150
Other assets 76 76 76
Prepaid expenses and accrued income 580 139 719 719
Total 2,406 49,316 99,829 151,551 151,617
2011
mnkr
Hedge- accounted derivative
instruments
Loan receivables
in hedge accounting
Assets mea-sured at fair
value through profit or loss
Other receivables Total
Total fair value
Cash and balances at central banks 0 0 0
Chargeable treasury bills and other eligible bills 5,949 5,949 5,949
Lending to credit institutions 56,412 56,412 56,497
Lending to the public 32,940 32,940 33,310
Change in value of interest-rate- hedged items in portfolio hedges –8 –8 –
Bonds and other interest-bearing securities 32,307 9,249 41,556 40,725
Derivative instruments 6,037 7,776 13,813 13,813
Shares and participations – –
Other assets 718 718 718
Prepaid expenses and accrued income 751 148 899 899
Total 6,037 46,783 99,459 152,279 151,911
Note 37 Classification of financial instruments, Cont’d

notes 71
SBAB Annual Report 2012
PARENT COMPANY Financial liabilities
2012
SEK million
Hedge- accounted derivative
instruments
Liabilities covered
by hedge accounting
Liabilities measured
at fair value through profit
or loss
Other financial liabilities Total
Total fair value
Liabilities to credit institutions 2,443 2,443 2,443
Deposits from the public 27,654 27,654 27,654
Debt securities in issue 23,898 77,884 101,782 101,936
Derivative instruments 1,726 12,183 13,909 13,909
Other liabilities 356 356 356
Accrued expenses and prepaid income 481 354 835 835
Subordinated debt 5,752 1,300 7,052 7,083
Total 1,726 30,131 12,183 109,991 154,031 154,216
2011
SEK million
Hedge- accounted derivative
instruments
Liabilities covered
by hedge accounting
Liabilities measured
at fair value through profit
or loss
Other financial liabilities Total
Total fair value
Liabilities to credit institutions 9,688 9,688 9,688
Deposits from the public 8,769 8,769 8,769
Debt securities in issue 44,657 72,096 116,753 116,509
Derivative instruments 2,249 9,860 12,109 12,109
Other liabilities 120 120 120
Accrued expenses and prepaid income 550 353 903 903
Subordinated debt 5,933 300 6,233 6,264
Total 2,249 51,140 9,860 91,326 154,575 154,362
During autumn 2008, financial institutions were given the opportunity to reclassify holdings of “Financial assets available for sale” to “Loan receivables and accounts receivable.” The assets were reclassified due to SBAB’s perception that the downturn in the global financial markets during autumn 2008 was of sufficient magnitude to justify a reclassifica-tion. The reclassification was implemented on 1 July 2008. The value that was assigned to the assets at the time was the prevailing market value.
Since the assets in the RMBS portfolio are classified as “Loan recei-vables and accounts receivable,” the assets must be recognised at ac-crued cost and a credit-risk assessment must be performed according to the same principles as the risk assessment of SBAB’s credit portfolio.
Since no impairment need has arisen since the reclassification of RMBS assets, the company has not recognised any impairment losses under the “Impairment of financial assets” item.
As of 1 July 2008, the fair value of the reclassified portfolio amounted to SEK 21.7 billion. The average effective compound interest rate used in reclassification was 6.3%. At the same date, the fair value reserve
Impact on profit
SEK million 2012 2011
Interest income 110 313
Change in fair value – –
Currency –230 –5
Total –120 308
Expected cash flows distributed by reclassification date, 1 July 2008
SEK million < 1 year 1–2 years 2–5 years > 5 years
Structured loans 2,430 1,769 14,875 2,603
attributable to these assets had a negative value of SEK 200 million, net after tax. At 31 December 2012, the fair value of the assets would have amounted to SEK 4.4 billion had the assets continued to be recognised as “Available-for-sale financial assets.”
The carrying amount at 31 December 2012 was SEK 4.8 billion. At the same date, the fair value reserve attributable to the reclassified assets would have amounted to a negative SEK 0.3 billion, net after tax, had the assets continued to be recognised as “Available-for-sale financial assets.” The reserve amounted to a negative SEK 37 million, net after tax, at 31 December 2012.
After the reclassification date, SEK 205 million of the reserve before tax was reversed and exchange rate fluctuations had a negative impact of SEK 23 million before tax on the value of the reserve.
The table below shows how the reclassified assets were recognised in terms of gains, losses, revenues and costs. Interest income is shown in gross amounts, excluding funding costs. Currency translation effects do not take into account the counteracting effects that have arisen in connection with funding.
GROUP RMBS portfolio
31 Dec 2012
SEK million Carrying amount Fair value
Country of asset
Australia 427 448
Spain 2,515 2,051
United Kingdom 949 987
The Netherlands 928 903
Total 4,819 4,389
Note 37 Classification of financial instruments, Cont’d
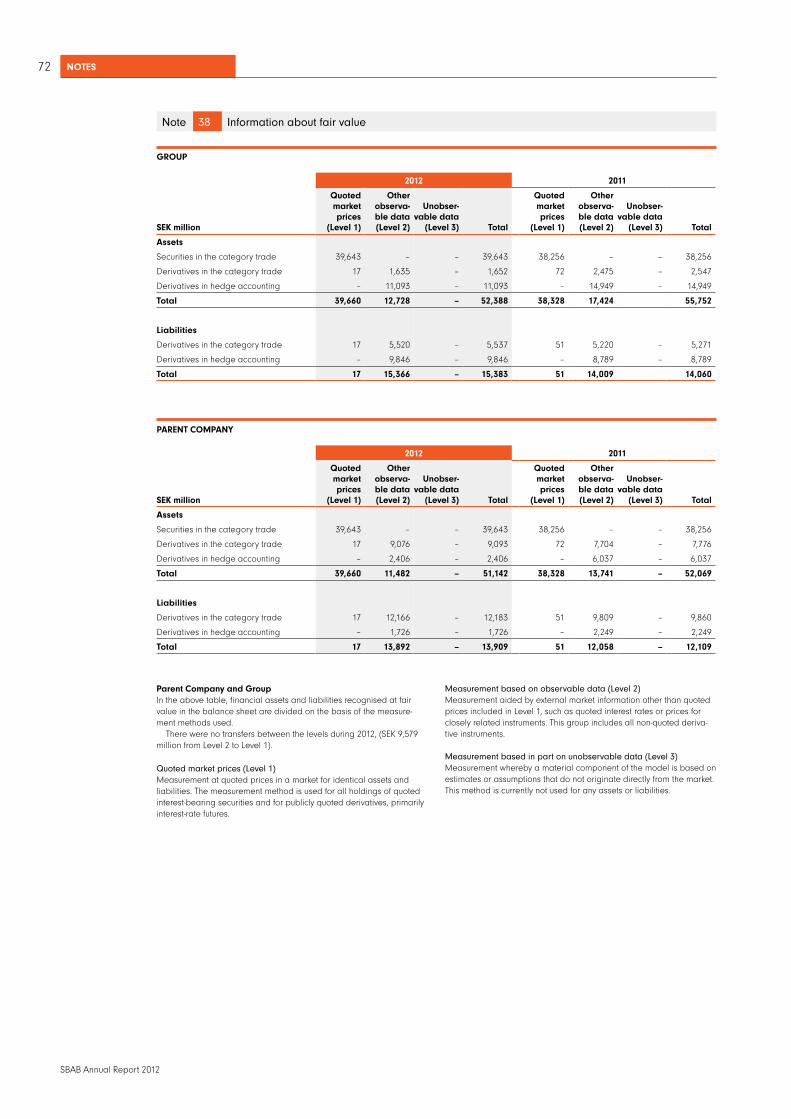
notes72
SBAB Annual Report 2012
Note 38 Information about fair value
GROUP
2012 2011
SEK million
Quoted market prices
(Level 1)
Other observa-ble data (Level 2)
Unobser-vable data
(Level 3) Total
Quoted market prices
(Level 1)
Other observa-ble data (Level 2)
Unobser-vable data
(Level 3) Total
Assets
Securities in the category trade 39,643 – – 39,643 38,256 – – 38,256
Derivatives in the category trade 17 1,635 – 1,652 72 2,475 – 2,547
Derivatives in hedge accounting – 11,093 – 11,093 – 14,949 – 14,949
Total 39,660 12,728 – 52,388 38,328 17,424 55,752
Liabilities
Derivatives in the category trade 17 5,520 – 5,537 51 5,220 – 5,271
Derivatives in hedge accounting – 9,846 – 9,846 – 8,789 – 8,789
Total 17 15,366 – 15,383 51 14,009 14,060
PARENT COMPANY
2012 2011
SEK million
Quoted market prices
(Level 1)
Other observa-ble data (Level 2)
Unobser-vable data
(Level 3) Total
Quoted market prices
(Level 1)
Other observa-ble data (Level 2)
Unobser-vable data
(Level 3) Total
Assets
Securities in the category trade 39,643 – – 39,643 38,256 – – 38,256
Derivatives in the category trade 17 9,076 – 9,093 72 7,704 – 7,776
Derivatives in hedge accounting – 2,406 – 2,406 – 6,037 – 6,037
Total 39,660 11,482 – 51,142 38,328 13,741 – 52,069
Liabilities
Derivatives in the category trade 17 12,166 – 12,183 51 9,809 – 9,860
Derivatives in hedge accounting – 1,726 – 1,726 – 2,249 – 2,249
Total 17 13,892 – 13,909 51 12,058 – 12,109
Parent Company and GroupIn the above table, financial assets and liabilities recognised at fair value in the balance sheet are divided on the basis of the measure-ment methods used.
There were no transfers between the levels during 2012, (SEK 9,579 million from Level 2 to Level 1).
Quoted market prices (Level 1)Measurement at quoted prices in a market for identical assets and liabilities. The measurement method is used for all holdings of quoted interest-bearing securities and for publicly quoted derivatives, primarily interest-rate futures.
Measurement based on observable data (Level 2)Measurement aided by external market information other than quoted prices included in Level 1, such as quoted interest rates or prices for closely related instruments. This group includes all non-quoted deriva-tive instruments.
Measurement based in part on unobservable data (Level 3)Measurement whereby a material component of the model is based on estimates or assumptions that do not originate directly from the market. This method is currently not used for any assets or liabilities.

notes 73
SBAB Annual Report 2012
Note 39 Information about related parties
SBAB Bank AB (publ) is a Swedish public limited company that is wholly owned by the Swedish state.
Group companies and joint venturesThe Swedish Covered Bond Corporation (SCBC) is to be regarded as a subsidiary and recognised in accordance with the acquisition method, which entails the elimination of internal transactions at Group level. FriSpar Bolån AB is a joint venture. Transactions with related parties have been made on market terms.
PARENT COMPANY
2012
GROUP COMPANIES JOINT VENTURES TOTAL
SEK millionAssets/
LiabilitiesInterest income/
expenseAssets/
LiabilitiesInterest income/
expenseAssets/
LiabilitiesInterest income/
expense
Lending to credit institutions 39,602 1,514 1,249 105 40,851 1,619
Derivative instruments 5,232 107 5,232 107
Other assets 1 1 2
Total 44,835 1,621 1,250 105 46,085 1,726
Liabilities to credit institutions –62 –62
Debt securities in issue 1,488 –52 1,488 –52
Derivative instruments 3,100 –43 3,100 –43
Other liabilities 22 25 47
Total 3,122 –105 1,513 –52 4,635 –157
2011
GROUP COMPANIES JOINT VENTURES TOTAL
SEK millionAssets/
LiabilitiesInterest income/
expenseAssets/
LiabilitiesInterest income/
expenseAssets/
LiabilitiesInterest income/
expense
Lending to credit institutions 36,300 1,068 9,128 339 45,428 1,407
Derivative instruments 2,968 272 2,968 272
Other assets 512 14 526
Total 39,780 1,340 9,142 339 48,922 1,679
Liabilities to credit institutions 3,520 –77 3,520 –77
Debt securities in issue 1,438 –43 1,438 –43
Derivative instruments 1,528 –158 1,528 –158
Other liabilities 2 13 15
Total 5,050 –235 1,451 –43 6,501 –278
Of the Parent Company’s commission income, SEK 8 million (23) pertained to commission on lending from joint ventures and SEK 70 million (39) to commission on lending from Group companies. Of the Parent Company’s other commission income, SEK 16 million (25) pertained to the ability of Group companies to utilise a liquidity facility at the Parent Company.
The Parent Company also conducted administrative services on behalf of Group companies for SEK 514 million (521); refer to Note 7.
GROUP COMPANIES
2012 2011
JOINT VENTURES JOINT VENTURES
SEK million Assets Interest income Assets Interest income
Lending to credit institutions 102 87
Total 102 87
The table shows the subsidiary SCBC’s dealings with FriSpar Bolån AB.

notes74
SBAB Annual Report 2012
Loans to the Board, CEO and other key senior executives
SEK million
2012 2011
Lending Interest income Lending Interest income
Loans to key personnel
CEO – – 2 0
Board of Directors 4 0 2 0
Other key senior executives 10 0 7 0
Total 14 0 11 0
SEK million
2012 2011
Lending Interest income Lending Interest income
Deposits from key personnel
CEO and other key senior executives 3 0 2 0
Board of Directors 0 0 0 0
Total 3 0 2 0
The CEO and the Board refer to the Parent Company. Wherever relevant, the Managing Directors and Board of other Group companies are included under “Other key senior executives.”
Lending to members of the Board of SBAB Bank AB (publ) or to employees holding key positions in the company may not occur on terms that are not normally available to other personnel.
Deposits from key personnel are made on the same terms and conditions as other deposits in the company.
Note 40 Operating segments
SBAB has identified two operating segments: Retail and Corporate. The operating segments comply with how SBAB’s organisation is composed and matches the segments previously presented in accordance with IAS 14. The Retail operating segment includes lending for single-family dwel-lings, holiday homes, tenant-owned apartments and tenant-owner associations, as well as deposits from private individuals and tenant-owner associations. The Corporate operating segment includes lending for private multi-family dwellings, commercial properties and municipal residential mortgages, together with deposits.
Overhead costs/indirect costs have been allocated to the segments using relevant allocation keys.
GROUP Risk-adjusted income statement
SEK million
2012 2011
Retail Corporate Other Total Retail Corporate Other Total
Risk-adjusted net interest 1,537 348 – 1,885 1,262 330 – 1,592
Net result of financial instruments measured at fair value –1 –600 –601 0 0 –349 –349
Other risk-adjusted income –73 –19 – –92 –64 –26 – –90
Total operating income 1,463 329 –600 1,192 1 198 304 –349 1,153
Personnel costs –278 –61 – –339 –254 –69 – –323
Other expenses –312 –50 – –362 –290 –67 – –357
Depreciation of property, plant and equipment and amortisation of intangible fixed assets –22 –2 – –24 –23 –4 – –27
Expected loan losses –94 –24 – –118 –58 –11 – –69
Total expenses and expected loan losses
–706 –137 – –843 –625 –151 – –776
Tax –199 –51 158 –92 –151 –40 92 –99
Risk-adjusted profit/loss after tax 558 141 –442 257 422 113 –257 278
RAROC1), after tax 13.6% 12.3% n/a 4.9% 11.8% 7.3% n/a 5.4%
1) Risk-Adjusted Return On (economic) Capital, meaning risk-adjusted return after tax.
Note 39 Information about related parties, Cont’d

notes 75
SBAB Annual Report 2012
Following a reorganisation within SBAB, the former Finance segment is no longer a separate business area as of 1 January 2012.
Accordingly, the comparative period for the two segments, Corporate and Retail, has been recalculated.
Operating-segment disclosures are risk adjusted. In the risk-adjusted follow-up of profit and loss, return on recognised equity is replaced by “return on economic capital.” ”Economic capital” comprises the capital that SBAB deems to be required to cover unexpected losses during the coming year.
GROUP Reconciliation
SEK million 2012 2011
Risk-adjusted net interest 1,885 1,592
Net result of financial instruments measured at fair value –601 –349
Other risk-adjusted income –92 –90
Total risk-adjusted income 1,192 1,153
Risk-adjusted income 1,192 1,153
Adjustment to return on recognised equity 56 26
Total operating income 1,248 1,179
Personnel costs –339 –323
Other expenses –362 –357
Depreciation of property, plant and equipment and amortisation of
intangible fixed assets –24 –27
Expected loan losses –118 –69
Total expenses and expected loan losses –843 –776
Risk-adjusted expense –843 –776
Adjustment to recognised loan losses 98 61
Total expenses and loan losses –745 –715
Risk-adjusted profit before tax 349 377
Tax according to risk-adjusted income statement –92 –99
Risk-adjusted profit after tax 257 278
Risk-adjusted items
Adjustment to return on recognised equity 56 26
Adjustment to recognised loan losses 98 61
Reversal of tax according to risk-adjusted income statement 92 99
Operating profit 503 464
Recognised tax –140 –123
Profit for the year after tax 363 341
At 31 December 2012, economic capital was lower than recognised equity, thus making the return on equity in the risk-adjusted income statement lower. Recognised loan losses were replaced by expected losses in risk-adjusted expense. Expected losses are determined using credit-risk models, through which the risk is calculated for each individu-al loan based on the outcome over an extended period, in distinction to recognised loan losses. For further information on expected losses and economic capital, refer to Notes 2a and 2h.
Note 40 Operating segments, Cont’d

notes76
SBAB Annual Report 2012
Note 41 Five-year overview
PARENT COMPANY
SEK million 2012 2011 2010 2009 2008
Interest income 4,162 3,864 2,226 2,294 4,445
Interest expense –4,032 –3,956 –1,922 –1,611 –4,175
Net interest income/expense 130 –92 304 683 270
Other operating income 811 895 409 830 287
Total operating income 941 803 713 1 513 557
Depreciation of property, plant and equipment and amortisation of intangible fixed assets –15 –13 –12 –13 –16
Other operating expenses –788 –695 –587 –558 –498
Total operating expenses –803 –708 –599 –571 –514
Profit/loss before loan losses 138 95 114 942 43
Loan losses, net –34 3 –30 –82 –4
Operating profit 104 98 84 860 39
Lending portfolio1) 46,360 32,940 35,298 48,225 24,910
Other assets 115,668 129,708 112,296 98,593 88,870
Total assets 162,028 162,648 147,594 146,818 113,780
Deposits from the public 27,654 8,769 6,083 4,653 3,542
Debt securities in issue 101,782 116,753 107,223 109,749 72,872
Other liabilities 17,543 22,820 20,845 20,922 26,027
Deferred tax liabilities 65 248 214 373 354
Subordinated debt 7,052 6,233 5,508 3,551 3,666
Equity 7,932 7,825 7,721 7,570 7,319
Total liabilities and equity 162,028 162,648 147,594 146,818 113,780
Capital adequacy with transitional regulations
Core Tier 1 capital ratio, % 25.8 26.6 26.5 21.7 23.4
Tier 1 capital ratio, % 35.5 37.3 36.9 24.5 27.2
Capital adequacy ratio, % 46.2 45.9 44.0 30.7 35.3
1) The Parent Company continuous transfers loans to the subsidiary, The Swedish Covered Bond Corporation (SCBC).

77PROPOSED APPROPRIATION OF PROFITS
SBAB Annual Report 2012
The Group’s income statement and balance sheet will be submitted to the Annual General Meeting on 18 April 2013 for adoption.
Proposed appropriation of profits
The Board and the CEO certify that the consolidated financial state-ments were prepared in accordance with the international accounting standard (IFRS) as adopted by the EU and provide a true and fair view of the Group’s position and earnings. The Annual Report was prepared in accordance with generally accepted accounting policies and provides a true and fair view of the Parent Company’s position and earnings.
The Administration Report for the Group and Parent Company provides a true and fair view of the development of the Group and the Parent Company’s operations, position and earnings, and describes
Per Anders FasthBoard Member
Jakob GrinbaumBoard Member
Hanna LagercrantzBoard Member
Helena LevanderBoard Member
Ebba LindsöBoard Member
Karin MobergBoard Member
Christer ÅbergBoard Member
Anna ChristensonBoard Member
(Employee Representative)
Anders HederBoard Member
(Employee Representative)
Carl-Viggo ÖstlundCEO
Our audit report was submitted on 14 mars 2013
Öhrlings PricewaterhouseCoopers AB
Catarina EricssonAuthorised Public Accountant
the significant risks and uncertainties faced by the Parent Company and the companies included in the Group.
In accordance with Chapter 6, Section 2, Item 2 of the Annual Ac-counts Act for Credit Institutions and Securities Companies, the Board considers the company’s equity to be sufficiently large in relation to the scope and risks of the operations. The Board and the CEO propose that the funds which, according to the balance sheet of the Parent Com-pany, are at the disposal of the Annual General Meeting, namely SEK 5,581,986,646, of which profit for the year accounts for SEK 92,141,468, be carried forward.
Stockholm, 14 March 2013
Arne LiljedahlChairman of the Board

78 AUDIT REPORT
SBAB Annual Report 2012
To the annual meeting of the shareholders of SBAB Bank AB (publ), corporate identity number 556253-7513
Audit report
Report on the annual accounts and consolidated accountsWe have audited the annual accounts and consolidated accounts of SBAB Bank AB (publ) for the year 2012. The annual accounts and conso-lidated accounts of the company are included in the printed version of this document on pages 5-77, excluding pages 12-14.
Responsibilities of the Board of Directors and the Managing Director for the annual accounts and consolidated accounts The Board of Directors and the Managing Director are responsible for the preparation and fair presentation of the annual accounts in accor-dance with the Annual Accounts Act for Credit Institutions and Securities Companies and for the fair presentation of the consolidated accounts in accordance with International Financial Reporting Standards , as adopted by the EU, and the Annual Accounts Act for Credit Institutions and Securities Companies, and for such internal control as the Board of Directors and the Managing Director determine is necessary to enable the preparation of annual accounts and consolidated accounts that are free from material misstatement, whether due to fraud or error.
Auditor’s responsibility Our responsibility is to express an opinion on these annual accounts and consolidated accounts based on our audit. We conducted our audit in accordance with International Standards on Auditing and generally accepted auditing standards in Sweden. Those standards require that we comply with ethical requirements and plan and perform the audit to obtain reasonable assurance about whether the annual ac-counts and consolidated accounts are free from material misstatement.
An audit involves performing procedures to obtain audit evidence about the amounts and disclosures in the annual accounts and consoli-dated accounts. The procedures selected depend on the auditor’s jud-gement, including the assessment of the risks of material misstatement of the annual accounts and consolidated accounts, whether due to fraud or error. In making those risk assessments, the auditor considers internal control relevant to the company’s preparation and fair pre-sentation of the annual accounts and consolidated accounts in order to design audit procedures that are appropriate in the circumstances, but not for the purpose of expressing an opinion on the effectiveness of the company’s internal control. An audit also includes evaluating the appropriateness of accounting policies used and the reasonable-ness of accounting estimates made by the Board of Directors and the Managing Director, as well as evaluating the overall presentation of the annual accounts and consolidated accounts.
We believe that the audit evidence we have obtained is sufficient and appropriate to provide a basis for our audit opinion.
OpinionsIn our opinion, the annual accounts have been prepared in accordance with the Annual Accounts Act for Credit Institutions and Securities Com-panies and present fairly, in all material respects, the financial position of the parent company as of 31 December 2012 and of its financial performance and its cash flows for the year then ended in accordance with the Annual Accounts Act for Credit Institutions and Securities Com-panies. The consolidated accounts have been prepared in accordance
with the Annual Accounts Act for Credit Institutions and Securities Companies and present fairly, in all material respects, the financial position of the group as of 31 December 2012 and of their financial performance and cash flows for the year then ended in accordance with International Financial Reporting Standards, as adopted by the EU, and the Annual Accounts Act for Credit Institutions and Securities Companies. The statutory administration report is consistent with the other parts of the annual accounts and consolidated accounts.
We therefore recommend that the annual meeting of shareholders adopt the income statement and balance sheet for the parent com-pany and the group.
Report on other legal and regulatory requirements In addition to our audit of the annual accounts and consolidated accounts, we have also audited the proposed appropriations of the company’s profit or loss and the administration of the Board of Directors and the Managing Director of SBAB Bank AB (publ) for the year 2012.
Responsibilities of the Board of Directors and the Managing DirectorThe Board of Directors is responsible for the proposal for appropria-tions of the company’s profit or loss, and the Board of Directors and the Managing Director are responsible for administration under the Companies Act and the Banking and Financing Business Act.
Auditor’s responsibility Our responsibility is to express an opinion with reasonable assurance on the proposed appropriations of the company’s profit or loss and on the administration based on our audit. We conducted the audit in ac-cordance with generally accepted auditing standards in Sweden.
As a basis for our opinion on the Board of Directors’ proposed appropriations of the company’s profit or loss, we examined whether the proposal is in accordance with the Companies Act.
As a basis for our opinion concerning discharge from liability, in ad-dition to our audit of the annual accounts and consolidated accounts, we examined significant decisions, actions taken and circumstances of the company in order to determine whether any member of the Board of Directors or the Managing Director is liable to the company. We also examined whether any member of the Board of Directors or the Managing Director has, in any other way, acted in contravention of the Companies Act, the Banking and Financing Business Act, the Annual Accounts Act for Credit Institutions and Securities Companies or the Articles of Association.
We believe that the audit evidence we have obtained is sufficient and appropriate to provide a basis for our opinions.
OpinionsWe recommend to the annual meeting of shareholders that the profit be appropriated in accordance with the proposal in the statutory administration report and that the members of the Board of Directors and the Managing Director be discharged from liability for the financial year.
Stockholm 14 March 2013Öhrlings PricewaterhouseCoopers AB
Catarina Ericsson, Authorized Public Accountant
Independent assurance report relating to Sustainability Report Pages 12-14 of this document contain an extract of the Sustainability Report. A complete Sustainability Report has been prepared by the company, which contains our full assurance report. Based on our review, nothing has come to our attention that causes us to believe
that the Sustainability Report has not, in all material respects, been prepared in accordance with the criteria stipulated in the full version of the assurance report.
Stockholm 14 March 2013Öhrlings PricewaterhouseCoopers AB
Catarina Ericsson, Authorized Public Accountant Fredrik Ljungdahl, Expert member, FAR SRS

79corporate Governance reportbolaGsstyrninG
SBAB Annual Report 2012
SBAB’s corporate governance report 2012
Chairman of the Board’s Statement
SBAB had an eventful year in 2012. After considerable unrest in capital markets in 2011, the beginning of 2012 entailed some relief in the form of the European Central Bank’s repo loans. However, the financial markets were characterised by continued unease during the year, particularly for the euro collaboration.
The Board of Directors carefully monitored the de-velopment of new regulatory codes that are of major importance to SBAB’s operations, primarily capital adequacy and liquidity. Current issues during the year included intensive negotiations in Brussels on capital adequacy regulations, a framework for banks in crisis and a bank union.
The regulations drafted after the financial crisis place ever greater requirements on the boards of financial companies. It is important for the Board in the midst of this work not to lose focus on the business operations and the customers, which have served as a guide for the Board of SBAB.
SBAB began its operations as a bank in 2011 after obtaining permission to conduct banking activities and, during the year, the Board controlled and followed up on the work of management on broadening SBAB’s activities, with the goal of offering everyday banking services for consumers in Sweden. At the beginning of the year and as a result of the strategic emphasis towards a consumer-focused bank, the Board decided that SBAB would reduce and refine its corporate busi-ness to enable a future sale of that part of the business.
Together with CEO Carl-Viggo Östlund, who took office on 1 March 2012, and the management, the Board decided on the vision for SBAB during the year – “To create a new era in banking by providing the best customer experience”.
On the topic of broadening SBAB’s operations, it is especially pleasing to note that SBAB is now not only associated with residential mortgages. The trust our savings customers have shown SBAB during the year is very positive. SBAB increased deposits by approximate-ly SEK 19 billion during the year.
SBAB’s operating profit from the core business is sta-ble. However, operating profit has been impacted over several years by market value fluctuations, primarily of derivatives, which has made earnings volatile. In 2012, the Board decided on a strategy for funding activities and the composition of the balance sheet, which will ultimately mean that SBAB’s earnings will become less sensitive to these market value effects. The strategy entails that in the long term SBAB will become less dependent on lending in foreign currencies.
Through its committees, the Board addressed issues involving SBAB’s loan granting, funding operations, audit, internal control and remuneration during the year. In 2012, the Board established a new committee, the Risk and Capital Committee, which has the primary task of preparing matters concerning SBAB’s finance operations and risk and capital issues. This committee replaced the Finance Committee, which was thereby discontinued. The Board continuously monitored the bank’s earnings, lending and deposits during the year.
Through a resolution of the Annual General Meeting in April 2012, the Board received two new members: Ebba Lindsö and Christer Åberg. Anders Heder re-placed Göran Thilén as one of two employee repre-sentatives on the Board.
I would like to take this opportunity to thank our customers, the employees, the Board and the owner in SBAB for 2012.
I have declined re-election as Chairman of the Board effective the 2013 Annual General Meeting. I wish both the Board of Directors and the executive management the best of luck in leading SBAB into an exciting new phase in the bank’s development.
Arne LiljedahlChairman of the Board

Corporate GovernanCe report80
SBAB Annual Report 2012
The Code is part of the Government’s framework for corporate governance that complements the state’s ownership policy (concerning, for example, external financial reporting and remuneration to senior execu-tives). SBAB complies with the Code in the manner ap-plied by the Government Offices. In certain issues, the Government Offices have decided to apply the rules in a manner that deviates from the Code rules, which are described in greater detail in the Ministry of Finance’s report “Government ownership policy and guidelines for state-owned companies 2012.”
SBAB applies the sections of the Code that are appropriate for the bank in accordance with the state’s ownership policy. Based on this ownership structure, deviations have occurred from the following Code rules: • Code rule 1.1 – publication of information regarding
the shareholders’ right to propose business at the Annual General Meeting. The purpose of this rule is to give shareholders the opportunity to prepare ahead of time for the Annual General Meeting and have matters included in the agenda for the Annual General Meeting. There is no reason for wholly state-owned companies to comply with this Code rule.
• Code rule 1.4 and 2 – establishment of a nomina-tion committee responsible for such matters as the appointment of the Board and auditor. The reason for the deviation is that nomination matters in state-owned companies are handled by the Government in the manner described in the state’s ownership policy.
• Code rule 4.5, 4.6 and 10.2 – information to be provided concerning the independence of Board Members in relation to major shareholders. No such information is provided since the primary objective of the Code rules in question is to protect minority share-holders in companies with dispersed ownership. Consequently, there is no reason for such information concerning independence to be disclosed in wholly state-owned companies.
SBAB also deviated from the following rules in 2012: • Code rule 7.3 – the number of Board Members in the
Audit and Compliance Committee, which is SBAB’s equivalent to an audit committee, has been fewer
than three between 1 January and 26 April 2012, due to a Board Member who was also a member of the Committee stepping down from the Board in Septem-ber 2011. In conjunction with the statutory meeting of the Board of Directors on 26 April 2012, new members were elected to the Audit and Compliance Committee, which subsequently comprised three members.
Articles of AssociationSBAB’s Articles of Association regulate matters such as the company’s business objective. The Articles of Association do not include any stipulations regulating the appointment or dismissal of Board members, with the exception of stipulations stating that the Annual General Meeting is to appoint the Chairman of the Board and determine the minimum and maximum number of Board members. The Articles of Association require that notifi-cation of an extraordinary general meeting convened to address amendments to the Articles of Association must be issued not earlier than six weeks and not later than four weeks prior to the meeting. SBAB’s Articles of Association do not assign any limitations as to the number of votes each shareholder is entitled to exercise at a general meeting.
Annual General Meeting
SBAB’s Annual General Meeting was held on 19 April 2012. The Annual General Meeting was open and the general public was invited to attend. The owner was represented by deputy director Malin Fries. Most of SBAB’s Board Members, the CEO and SBAB’s auditor also attended the Annual General Meeting. Arne Liljedahl, Chairman of the Board of SBAB, served as the Chairman of the Annual General Meeting.
The Annual General Meeting re-elected as Board Members Jakob Grinbaum, Hanna Lagercrantz, Helena Levander, Karin Moberg, Lena Smeby-Udesen and Arne Liljedahl, who was also elected Chairman of the Board. Ebba Lindsö and Christer Åberg were elected as new Board members.
Corporate governance report for 2012SBAB is a Swedish public limited banking company that is wholly owned by the Swedish state. SBAB is domiciled in Stockholm. Governance of SBAB occurs through general shareholder meetings, the Board of Directors and the CEO in accordance with the Companies Act, the Articles of Association, and policies and instructions adopted by SBAB. The Corporate Governance Report has been prepared in accordance with the regulations regarding corporate governance reports in the Swedish Code of Corporate Governance, “the Code”, and the Annual Accounts Act.

Corporate GovernanCe report 81
SBAB Annual Report 2012
Overview, 14 March 2013
1) In addition to reporting to the CEO, Compliance reports to the Board of Directors.2) SBAB’s function for independent risk management within the Credit and Risk Department reports to the Board of Directors in addition to the CEO.
The Heads of: Business Development, Accounting & Finance, Retail Market, Tenant-owner Associations Market, Collaboration Market, Legal, Communications & HR, Credit & Risk, are included in SBAB’s executive management
Internal audit
Accounting & Finance
Sales UnitRetail Market
Sales UnitCollaboration
Market
Communications& HR
Sales UnitTenant-Owner
Association Market
Business Development
Board of Directors
General meeting
CEO
CreditCommittee
Risk andCapital
Committee
RemunerationCommitttee
Audit and Compliance Committee
Corporate Legal and Deputy CEO
Credit & Risk²
Compliance¹
external audit
The auditor reviews the Annual Report, the consoli-dated financial statements and the accounting records, as well as the Board of Directors and the CEO’s ad-ministration of the company.
The Board of Directors is ultimately responsible for SBAB:s organisation and management.
The Risk and Capital Committee’s principal task is to prepare issues within the risk and capital area.
The Credit Committee’s principal task is to decide on loans and credit limits.
Compliance ensures that operations are conducted in accordance with laws and regulations and reports to the Board of Directors, the CEO and the Executive Management.
The General meeting is SBAB’s highest governing body where the shareholder exercises its decision-making authority.
The Audit and Compliance Committee’s principal task is to examine SBAB’s control mechanisms, the internal controls and the financial information.
The Remuneration Committee’s main task is to prepare motions regarding principles for remuneration and other employment terms and conditions for senior management.
CEO is responsible for the ongoing management of the operations of SBAB.
Internal audit is SBAB’s independent audit function.
The Risk Control Department which in the organisation is a part of the Credit & Risk department, analyses and controls SBAB’s risks, and reports to the Board of Directors, the CEO and the Executive Management. The CRO is responsible for the Credit & Risk department and reports to the Board of Directors and the CEO.

Corporate GovernanCe report82 bolaGsstyrninG
SBAB Annual Report 2012
• Arne Liljedahl (Chairman of the Board), • Anna Christenson (employee representative) • Per Anders Fasth• Jakob Grinbaum • Anders Heder (employee representative)• Hanna Lagercrantz • Ebba Lindsö• Helena Levander • Karin Moberg • Christer Åberg
A specification of age, principal education, occupation-al experience and the other assignments held by the members of the Board, as well as their attendance at Board and committee meetings, is presented on pages 83, 86-87. None of the Board Members or the CEO holds shares or financial instruments issued by SBAB.
chairman of the boardThe Chairman of the Board is elected by the Annual General Meeting. The Chairman of the Board leads the work of the Board of Directors, monitors that the Board conducts its duties, represents the Board in any dealings with the owner and maintains contact with the owner. The Chairman of the Board is also respon-sible for initiating the annual evaluation of the work of the Board and the CEO. The Chairman of the Board ensures that the Board receives adequate information and decision documentation for its work and the train-ing necessary for the Board to function efficiently. The Chairman of the Board also monitors the implementa-tion of Board decisions.
board work and methods of workThe Board of Directors is responsible for the organ-isation and administration of matters pertaining to SBAB. The Board is also responsible for continuously assessing SBAB’s financial situation and ensuring that the organisation is structured in a manner that enables accounting, management of assets and SBAB’s other financial circumstances to be controlled in a satisfacto-ry manner. The Board adopts business objectives and strategies for the operations. The Board ensures that an efficient system is in place for the follow-up and control of SBAB’s operations. The Board is also assigned with appointing, evaluating and, if the need arises, dismiss-ing the CEO.
The work of the Board complies with the working procedures adopted annually at the Board of Directors’ statutory Board meeting immediately after the Annual General Meeting. The formal work plan regulates deci-sion-making within SBAB, the arrangements for Board meetings and the division of work among the Board, the Chairman of the Board and the Board committees.
During 2012, the Board held eight regular Board meetings. The work of the Board complies with an annual plan, which includes aims such as satisfying the Board’s need for information. SBAB’s Board makes decisions on matters concerning SBAB’s strategic
The Meeting resolved to discharge the Board of Di-rectors and the CEO from personal liability, to approve the appropriation of profits and to adopt the annual financial statements for 2011. The Annual General Meeting elected Öhrlings PricewaterhouseCoopers AB as SBAB’s auditor until the end of the 2013 Annual General Meeting, with Catarina Ericsson elected as au-ditor-in-charge. The Annual General Meeting followed up guidelines adopted by the 2011 Annual General Meeting regarding remuneration to senior executives and passed resolutions regarding new guidelines for remuneration to senior executives. The Annual General Meeting also passed a resolution concerning fees to elected Board Members. The CEO and Chairman of the Board gave an account of work performed for the bank and the bank’s Board of Directors during 2011.
SBAB’s general meeting has not authorised the Board to issue any new shares or to purchase shares to be held in treasury.
Nomination processUniform and shared principles are applied to achieve a structured nomination process for state-owned companies, as described in the report “Government ownership policy and guidelines for state-owned com-panies 2012.” The objective is to ensure an adequate supply of competence for the Board of Directors of these companies.
The Board nomination process is coordinated by the Ministry of Finance. A task force assesses each company’s competency requirements based on the company’s operations, position, future challenges and the composition of the Board. Recruitment requirements are then established and work commences. Members are selected from a broad recruitment base in order to utilise the expertise of both women and men, as well as individuals with different backgrounds and experi-ence. Once the process is complete, the nominations are announced in accordance with the Code. Adopting a uniform and structured approach ensures quality throughout the nomination procedure.
The Board of Directors and its methods of workboard of DirectorsIn accordance with the Articles of Association, the Board of Directors is to comprise not fewer than five and not more than ten members. The members are elected annually at the Annual General Meeting for the period up to the end of the following Annual General Meeting. SBAB’s Board of Directors comprises eight members elected by the Annual General Meeting and two members appointed by the Financial Sector Union of Sweden. The CEO is not a member of the Board.
SBAB’s Board Members following the Annual General Meeting, or employee representatives following the local union’s annual meeting, comprise:

Corporate GovernanCe report 83bolaGsstyrninG
SBAB Annual Report 2012
and the financial information, as well as preparing matters in these areas ahead of Board decisions.
The Audit and Compliance Committee is also responsible for monitoring financial statements and the efficiency of internal control, internal audit and risk management with respect to financial statements.
The Audit and Compliance Committee is responsible for evaluating external auditing work, informing the owner’s administrator of the results of this work and assisting in the drafting of proposals for auditors. The Audit and Compliance Committee is also to review and monitor the auditor’s impartiality and independence. The internal audit and compliance function’s annual plans and reports are also addressed in the Audit and Compliance Committee prior to decision by or pres-entation to the Board.
The Audit and Compliance Committee comprises three Board members. Following the statutory Board meeting in 2012, the members of the Audit and Compli-ance Committee are:• Karin Moberg (chairman)• Per Anders Fasth • Ebba Lindsö
The Audit and Compliance Committee held six meet-ings during the year.
credit committeeThe principal task of the Credit Committee is to decide on loans and credit limits in the SBAB’s lending and funding operations. The Credit Committee also has the task of preparing matters involving changes in the credit policy and credit instructions for decision by the Board, the assessment of portfolio strategies, the trans-parency of the loan portfolio, the evaluation of existing or proposed portfolio strategies, the evaluation of ex-isting or new delegation rights and the Board’s annual review of regulatory frameworks, models for granting credits and outcomes in terms of retail credit granting.
The Credit Committee comprises at least three Board Members, as well as SBAB’s CEO. The Chief Risk Officer, the heads of business units or another specially appointed officer acts as reporter.
orientation with regard, for example, to business plans, investments, funding, capitalisation, major organisation-al issues, policies and certain instructions. The Board reviews the company’s interim reports on a quarterly basis and decides on their adoption and publication. The Board also follows up SBAB’s risks and its regula-tory compliance. The Board also receives reports from SBAB’s auditor and the internal audit regarding obser-vations from completed examinations and assessments of how control is maintained within the company. The Board also receives reports regarding the bank’s risks and regulatory compliance from SBAB’s risk manage-ment and compliance functions. The CEO participates in Board meetings. When necessary, other SBAB employees may participate as reporters. SBAB’s Chief Legal Counsel takes the minutes at Board meetings.
In addition to Board meetings, the Board monitors SBAB’s ongoing work and financial development through the CEO’s monthly written report to the Board. The report includes information regarding operating profit, expenses, other financial reports, the report on funding operations, the capital adequacy situation and a risk report. The Board has established committees for the preparation of certain issues that are to be addressed.
evaluation of the work of the board and the ceoThe annual evaluation of the work of the Board was conducted in 2012. The results of this evaluation were addressed at a special meeting of the Board of Direc-tors held on 21 November 2012.
The Board’s committeesThe Board of Directors has established the following committees.
audit and compliance committeeThe Audit and Compliance Committee’s principal duty, on the basis of the assignment from the owner and the applicable regulatory framework, is to examine the SBAB Group’s control mechanisms, the internal controls
attendance of board members
board credit Finance risk and capital audit and comp- remunerationcommittee members meetings committee committee committee liance committee committee
Arne Liljedahl 8/8 13/13 – – – 2/2
Anna Christenson 7/8 – – – - –
Per Anders Fasth 7/8 – – – 6/6 –
Jakob Grinbaum 8/8 12/13 7/7 1/1 – –
Anders Heder 5/61) – – – – –
Hanna Lagercrantz 8/8 – 7/7 1/1 – 2/2
Helena Levander 7/8 11/13 – – – –
Ebba Lindsö 5/61) – 4/71) 1/1 4/61) –
Karin Moberg 8/8 – – – 6/6 –
Christer Åberg 6/61) – – – – 1/21)
presence
1) Because the Board member was appointed at the Annual General Meeting 2012, the number of meetings the Board member could attend is fewer.

Corporate GovernanCe report84
SBAB Annual Report 2012
SBAB’s remuneration system ahead of Board decisions. The Remuneration Committee monitors the remunera-tion structures and remuneration levels at SBAB.
Following the statutory Board meeting in 2012, the members of the Remuneration Committee are: • Arne Liljedahl (Chairman)• Hanna Lagercrantz• Christer Åberg
The Remuneration Committee held two meetings during the year.
CEO and Executive ManagementThe Board has formulated instructions for the CEO’s role and duties. The CEO is responsible for the ongoing management of the operations in accordance with guidelines, established policies and instructions issued by the Board. The CEO reports to the Board. Executive Management, which is presented in further detail on pages 88-89, provides the CEO with support in exercis-ing operational management of SBAB.
Remuneration of Board of Directors and senior executivesInformation regarding the remuneration of the Board, the CEO and Executive Management is presented in Note 8 of the Annual Report.
Internal control and governanceinternal controlInternal control is important for ensuring that SBAB’s operations are conducted in accordance with pre-vailing regulations, as well as ensuring that SBAB identifies, measures and controls relevant risks and has an efficient organisation and operational manage-ment and reliable financial reporting. The Board and the CEO are ultimately responsible for ensuring that internal control and governance are maintained. The Board and the CEO of SBAB are assisted in this work by several functions. Key control functions in this regard are the compliance, risk and internal audit functions, which are described in further detail below. Other functions, such as the Accounting Department, Credit Department within the Credit and Risk function, and the Legal Department, also provide support for the Board and the CEO with respect to maintaining sound internal control and governance. The heads of the various areas of responsibility are also expected to ensure that their operations are subject to sound internal control and governance.
riskSBAB’s Risk Control Department has overall responsibility for developing risk-taking strategies and for ensuring that SBAB’s strategies for assuming risk are implemented in accordance with the Board’s intention, and that policies and processes facilitate relevant follow-up. The Risk
Following the statutory Board meeting in 2012, the members of the Credit Committee are: • Arne Liljedahl (Chairman) • Jakob Grinbaum • Helena Levander• CEO
The Credit Committee held 13 meetings during the year.
risk and capital committeeFollowing a decision by the Board of Directors, a new committee was established on 24 October 2012: the Risk and Capital Committee. The Risk and Capital Com-mittee prepares issues for resolution by the Board of Directors concerning the SBAB’s finance operations as well as risk and capital matters. The Risk and Capital Committee also makes decisions regarding new IRB models or significant changes to existing models. The Risk and Capital Committee decides on the usage of new financial instruments. The committee also prepares issues for resolution by the Board of Directors concern-ing objectives, strategies and control documents within the areas of risk and capital. The Risk and Capital Committee comprises at least three members appoint-ed by the Board, as well as SBAB’s CEO. The CRO, or in certain cases, the CFO or another specially appointed officer acts as reporter for the committee.
Since its establishment on 24 October 2012, the members of the Risk and Capital Committee have comprised:• Jakob Grinbaum (Chairman)• Hanna Lagercrantz• Ebba Lindsö• The CEO
The Risk and Capital Committee held one meeting during 2012.
Finance committeeThe Finance Committee, which mainly prepared mat-ters involving the Group’s finance operations, existed until 24 October 2012. Most of the Committee’s duties are now included in the Risk and Capital Committee, which was formed during the year.
From the statutory Board meeting held in 2012 until 24 October 2012, the members of the Finance Committee comprised: • Jakob Grinbaum (Chairman)• Hanna Lagercrantz• Ebba Lindsö• The CEO
The Finance Committee held seven meetings during 2012.
remuneration committeeThe principal task of the Remuneration Committee is to prepare motions regarding principles for remuneration and other employment terms and conditions for senior executives for resolution by the Board. The Remuner-ation Committee also prepares matters pertaining to

Corporate GovernanCe report 85
SBAB Annual Report 2012
Control Department is responsible for analysing, assess-ing and reporting the SBAB’s overall risks to the Parent Company’s Board, its CEO and other senior executives.
complianceSBAB has a centrally located compliance function. The Compliance Department is independent from business operations and the Head of Compliance reports to the CEO and the Board of Directors. Its area of respon-sibility encompasses providing advice and support in compliance matters to the operations, analysing regulatory compliance in respect of the operations that require licences, administration and reporting in the compliance area, as well as function responsibility for money-laundering matters. Reporting occurs on an ongoing basis to the CEO and quarterly by means of a written report to the Board and its Audit and Compli-ance Committee. The scope and focus of the work of the compliance function is established in an annual plan by the CEO after approval by the Board.
internal auditSBAB’s internal audit unit is an internal independent examination function in accordance with the Swedish Financial Supervisory Authority’s regulations (FFFS 2005:1, Chapter 6). Accordingly, the main function of the internal audit is to examine and evaluate the inter-nal controls of companies in SBAB. The internal audit’s examination activities are performed in accordance with an audit plan that is prepared annually by the Audit and Compliance Committee and decided on by the Board. In connection with this, the Head of the Internal Audit presents both the proposed audit plan for the coming year and the overall risk assessment that forms the foundation for the plan to both the Audit and Compliance Committee and to the Board.
At least twice annually, the Head of the Internal Audit makes a written and an oral report to the Audit and Compli-ance Committee and the Board. All reporting is conducted in accordance with a reporting and meeting plan.
auditorThe Annual General Meeting appoints auditors. SBAB’s Audit and Compliance Committee evaluates the contri-bution of the auditor and assists the owner in preparing motions for the auditor. Officials at the Government Offices monitor all stages of the procurement process from tendering criteria to selection and evaluation.
At the Annual General Meeting, the owner appoints the auditor or the accounting firm that is commissioned to audit SBAB. Auditors must be authorised public accountants or an authorised accounting firm with an auditor-in-charge. As of 2011, SBAB’s auditor is appointed annually in accordance with the Companies Act and the Articles of Association. The 2012 Annual General Meeting appointed Öhrlings PricewaterhouseCoopers AB as auditor. The auditor-in-charge is Catarina Ericsson. A more detailed presentation of the auditor and the fees and expenses paid to auditors is provided on page 89 and in Note 9, respectively, of the Annual Report.
The auditor examines the Annual Report, the consoli-dated financial statements and the accounting records, as well as the Board’s and the CEO’s administration of the company. The auditor reports the results of these examinations through the Audit Report, which is presented to the Annual General Meeting. In addition, the auditor reviews SBAB’s interim reports and year-end reports, and provides detailed accounts to the Audit and Compliance Committee at scheduled meetings of the committee, when the interim reports are adopted, and to the Board.
Internal Control of Financial Reportingcontrol environmentThe basis for the internal control process with regard to financial reporting is the control environment, meaning the organisational structure and division of responsibil-ities, as well as the guidelines and steering documents described earlier. The function manager for financial reporting risk is responsible for following up, analysing and evaluating SBAB’s financial reporting risk and for working for a generally acceptable control structure. In organisational terms, the function manager for financial risk reporting is included in the Credit and Risk Department.
risk assessment and control activitiesBusiness-support processes that provide data for the financial statements are charted and contain control activities in the form of descriptions of processes, rea-sonability assessment, reconciliations, attestations and results analyses.
Each year, a risk assessment is performed in the form of a self-evaluation of all business-support processes that provide data for the financial statements. The self-evaluation is intended to assess the principal risks that could lead to faults in the financial statements and the related controls. The risks and controls are iden-tified, evaluated and documented at a process and department level. The self-evaluation forms the starting point for improvement measures. Controls that are as-sessed to not function satisfactory have to be improved. When an event occurs that has generated faults in the financial statements, the operations must send incident reports on this through SBAB’s intranet.
The function manager is to report to the Board, the Audit and Compliance Committee and the CEO annual-ly concerning the Group’s financial reporting risk on the basis of available information. This reporting is to be coordinated with the Group’s other risks.
information and communicationThe SBAB Group’s process concerning the internal control of financial reporting and the relating control documents, in the form of instructions and directions, is available on SBAB’s intranet. The charted business-sup-port processes that provide data for the financial statements are documented on SBAB’s intranet.

Corporate GovernanCe report86
SBAB Annual Report 2012
Board of Directors
Arne LiljedahlChairman of the Board
Bachelor of Business Administration and EconomicsBorn: 1950Elected: 2010Other appointments: Chairman of the Board of Carnegie Investment Bank, Board Member of Electroen-gine in Sweden AB, Board Member of Lindorff GroupPast experience: CFO/Executive Vice President and member of Group management at Nordea
Jakob GrinbaumBoard Member
Bachelor of ArtsBorn: 1949Elected: 2010Other appointments: Chairman of the Board of Oscar Properties AB, Deputy Chairman of the Board of the Fourth Swedish National Pension Fund, Board Member of the Öst-götagården Foundation in Uppsala, Board Member of IK Sirius, Member of the Advisory Board of Genesta Property Nordic ABPast experience: Executive Vice Pres-ident, Group Treasury and Group Corporate Development at Nordea
Anna ChristensonBoard Member (Employee Representative)
Born: 1970Appointed in 2009 by the Financial Sector Union of Sweden
Anders Heder Board Member (Employee Representative)
Born: 1962Appointed in 2012 by the Financial Sector Union of Sweden
Per Anders FasthBoard Member
Bachelor of Business Administration and EconomicsBorn: 1960Elected: 2011Other appointments: Partner of Quartz+Co, Board Member of Blong ABPast experience: CEO of European Resolution Capital, Senior Vice Pres-ident of SEB, McKinsey & Company, Statoil AS
Hanna LagercrantzBoard Member
Bachelor of Business Administration and Economics, M.Sc., M.Phil. Born: 1970Elected: 2010Other appointments: Desk Officer at the Ministry of Finance, Board Member of LKAB, Board Member of the Swedish Space CorporationPast experience: SEB Investor Rela-tions, SEB Investment Management, Corporate Finance UBS Brunswick, UBS, S.G. Warburg

Corporate GovernanCe report 87
SBAB Annual Report 2012
Helena LevanderBoard Member
Bachelor of Business Administration and EconomicsBorn: 1957Elected: 2004Other appointments: Partner and CEO of Nordic Investor Services AB, Board Member of Erik Penser Bankaktie-bolag, Collector AB, Neurovive Pharmaceutical AB, Allba Holding, Stampen AB and Uniflex ABPast experience: CEO of Neonet Securities AB, CEO of Odin Fonder, Senior Fund Manager at Nordea Asset Management, SEB Asset Management
Christer Åberg Board Member
Bachelor Degree, Marketing & Business IHM Business School Born: 1966Elected: 2012Other appointments: Executive Vice President Arla Sweden, Member of the Board of Svenska Spel AB and Meca Scandinavia ABPast experience: Unilever, including VD Home & Personal Care Nordic, CEO of Atria Scandinavia
Ebba LindsöBoard Member
Bachelor of Business Administration and EconomicsBorn: 1955Elected: 2012Other appointments: Senior Advisor to Brummer & Partners and Kommun-invest, Chairman of the Board Sixth AP Fund, Board Member of King Carl XVI Gustaf’s Young Leadership Foundation, Party Executive for the Swedish Christian Democrats and member of Statistic Sweden’s Advisory CouncilPast experience: CEO Respect Europe, CEO Confederation of Swedish Enterprise, CEO and editor in chief TT, editor in chief Affärsvärlden, CEO Transferator Fondkommission
Karin MobergBoard Member
Bachelor of Business Administration and EconomicsBorn: 1963Elected: 2009Other appointments: CEO and Founder of FriendsOfAdam, Board Member Caretech AB, Board Mem-ber of Doro AB, Board Member of IAR ABPast experience: CEO of Telia e-bolaget, Marketing Director and Acting Chief Communication Officer TeliaSonera, Management Consultant

88 corporate Governance report
SBAB Annual Report 2012
Executive management and auditor
Carl-Viggo ÖstlundCEO
Bachelor of Business Administration and EconomicsBorn: 1955Year of employment: 2012Board assignments: Chairman of the Board of SCBC, Deputy Board Member of Peyron Rekrytering ABPast experience: CEO of Nordnet Bank AB, CEO of SalusAnsvar AB, CEO of TNT Scandinavia and several positions within the Tetra Pak Group, including CEO of Tetra Pak Saudi Arabia, CEO of Tetra Pak Canada, CEO of Tetra Pak Brazil and CEO of Tetra Pak Turkey
Sarah BucknellHead of Business Development
Bachelor of Business Administration and Economics Born: 1971 Year of employment: 2011Board assignments: Board Member of SCBC, Board Member of FriSpar Bolån ABPast experience: Head of Col-laboration Market at SBAB, Chief Administration Officer and other po-sitions at Nordnet Bank AB, Svenska Handelsbanken
Gustaf HoornHead of Tenant-owner Associations Market
Bachelor of Business Administration and EconomicsBorn: 1958Year of employment: 2001Past experience: Advisor Götabank-en, Advisor Nordiska Fondkommis-sion, Advisor Östgötabanken, Head of Retail Market Köping-Arboga Sparbank
Jonas BurvallHead of Communications and HR
Master of Political Science Born: 1972Year of employment: 2012Board assignments: Board Member of Swedish Investor Relations AssociationPast experience: Head of Com-munications of Nordnet AB, Head of Corporate Communications at Skandia Liv, Head of Corporate Communications at SalusAnsvar AB
At 14 March 2013
Christine EhnströmChief Legal Counsel & Deputy CEO
Master of LawsBorn: 1973Year of employment: 1999Board assignments: Board Member of FriSpar Bolån AB, Board Member of Maricon Marinconsult AB’s Pen-sion Fund, Deputy Board Member of Maricon Marinconsult ABPast experience: Legal Counsel at Volvo Treasury AB (publ)
Håkan HöijerHead of Retail Market
Graduate from the School of EconomicsBorn: 1958Year of employment: 2008Past experience: Head of Sales and Marketing Skandia, Head of Customer Center ICA-banken, Head of Customer Center SEB Sesam, Head of Mortgages Trygg-banken, Head of Retail Market Värmland Stadshypotek

Corporate GovernanCe report 89
SBAB Annual Report 2012
Peter SvensénCRO
Master of Engineering Born: 1974 Year of employment: 2012 Past experience: Senior Job Man-ager at Oliver Wyman, Manager at KPMG Financial Services
Catarina EricssonÖhrlings PricewaterhouseCoopers AB
Auditor-in-charge at SBAB since 2011Born: 1966 Other assignments: Alecta, Avanza, Praktikertjänst and Svolder
Lennart KränCFO
Bachelor of Business Administration and Economics Born: 1965 Year of employment: 2012Board assignments: Chairman of the Board of Söderberg & Partners Placeringsrådgvining ABPast experience: CEO and CFO of SalusAnsvar, COO of HSBC Invest-ment Bank Stockholm, Treasury at Duni, various controlling positions within treasury and asset manage-ment at TryggHansa, auditor at PricewaterhouseCoopers AB
auditorThe 2011 Annual General Meeting resolved to elect the auditing firm Öhrlings PricewaterhouseCoopers AB as auditor for the period until the end of the 2013 Annual General Meeting, with Catarina Ericsson as auditor-in-charge.
changes in executive Management in 2012/2013
On 1 February 2013, changes were made to SBAB’s organisation and its management team. From the close of 2012 to 1 February 2013, the Executive Management group comprised:- CEO: Carl-Viggo Östlund- Chief Legal Counsel: Christine
Ehnström- Acting Head of Retail Market business
area: Sarah Bucknell- Head of Corporate Business Area
Per O. Dahlstedt- CFO: Lennart Krän- Head of Compliance: Matilda Berglin- CRO: Peter Svensén- Head of Communications:
Jonas Burvall- -Human Resources Manager:
Catharina Kandel- Chief Information Officer: Bo Andersson
Eva MarellHead of Collaboration Market
Bachelor of Business Administration and EconomicsBorn: 1973Year of employment: 2001Past experience: Various positions at SBAB, such as Business Control-ler and Company Controller

90 corporate Governance report
SBAB Annual Report 2012
Auditor’s report on the corporate governance reportTo the annual meeting of the shareholders of SBAB Bank AB (publ), corporate identity number 556253-7513
It is the Board of Directors who is responsible for the Corporate Governance Statement for the year 2012 on pages 79-89 and that it has been prepared in accordance with the Annual Accounts Act.
We have read the corporate governance statement and based on that reading and our knowledge of the compa-ny and the group we believe that we have a sufficient basis for our opinions. This means that our statutory exami-
nation of the Corporate Governance Statement is different and substantially less in scope than an audit conducted in accordance with International Standards on Auditing and generally accepted auditing standards in Sweden.
In our opinion, the Corporate Governance Statement has been prepared and its statutory content is consistent with the annual accounts and the consolidated accounts.
Stockholm 14 March 2013Öhrlings PricewaterhouseCoopers AB
Catarina EricssonAuthorized Public Accountant

Corporate GovernanCe report 91
SBAB Annual Report 2012
Information for investors
For more information and contacts, see www.sbab.se/omsbab
Financial calendarAnnual General Meeting 18 April 2013Interim Report January–March 25 April 2013Interim Report January–June 19 July 2013Interim Report January–September 28 October 2013Year-End Report February 2014

Head Office:SBAB BankBox 27308 SE-102 54 Stockholm (Visiting address: Löjtnantsgatan 21) Telephone: +46 771 45 30 00 Fax: +46 8 611 46 00 E- mail: [email protected]. Reg. No 556253 -7513 sbab.se
SBAB BankBox 1012 SE-651 15 Karlstad (Visiting address: Tingvallagatan 11) Telephone: +46 771 45 30 00 Fax: +46 54 17 71 10 E- mail: [email protected]
SBAB BankBox 53072 SE-400 14 Göteborg (Visiting address: Kungsportsavenyen 31– 35) Telephone Corporate: +46 31 743 37 40 Telephone Tenant-owner association: +46 31 743 37 00 Fax: +46 31 743 37 10 E -mail: [email protected]
SBAB BankRundelsgatan 16 SE-211 36 Malmö Telephone Corporate: +46 40 664 53 59 Telephone Tenant-owner association: +46 40 664 53 40 Fax: +46 40 664 53 58 E- mail: [email protected]
SBAB BankBox 27308 SE-102 54 Stockholm (Visiting address: Löjtnantsgatan 21) Telephone Corporate: +46 8 614 43 55 Telephone Tenant-owner association: +46 771 45 30 00 Fax Corporate: +46 8 614 38 63 Fax Tenant-owner association: +46 8 614 38 60 E- mail: [email protected]
NA
RVA