XASTRO-2 Overview Presentation CCSDS SAWG Athens Meeting 12 th April 2005.

1
1
New York StateDepartment of Transportation
MTAMetro-North Railroad
New York StateThruway Authority
SAWG Presentation
Land Use
July 17, 2007
Traffic and Transit
June 6 and July 11, 2007 T
Title slide.

2
2
New York StateDepartment of Transportation
MTAMetro-North Railroad
New York StateThruway Authority
Content
• What we know – establishing existing conditions
• How we’re using it – predicting future conditions
The presentation will describe the transportation data collected to date and how we are using it to predict future conditions.

3
3
New York StateDepartment of Transportation
MTAMetro-North Railroad
New York StateThruway Authority
What We Know
Establishing Existing Conditions
The first part of the presentation focuses on how we establish existing traffic conditions.

4
4
New York StateDepartment of Transportation
MTAMetro-North Railroad
New York StateThruway Authority
Current Data
• Population• Employment• River Crossings• Journey-to-work• Highway network
– Physical characteristics– Volumes
• Transit network– Routes– Ridership
Many elements of data that go into the forecasting of future travel.

5
5
New York StateDepartment of Transportation
MTAMetro-North Railroad
New York StateThruway Authority
Count Locations –Rockland County West
The locations where traffic counts were done in Rockland County, supplementing the counts available from other government agencies. The counts were concentrated on I-287 and Route 59.
6
6
New York StateDepartment of Transportation
MTAMetro-North Railroad
New York StateThruway Authority
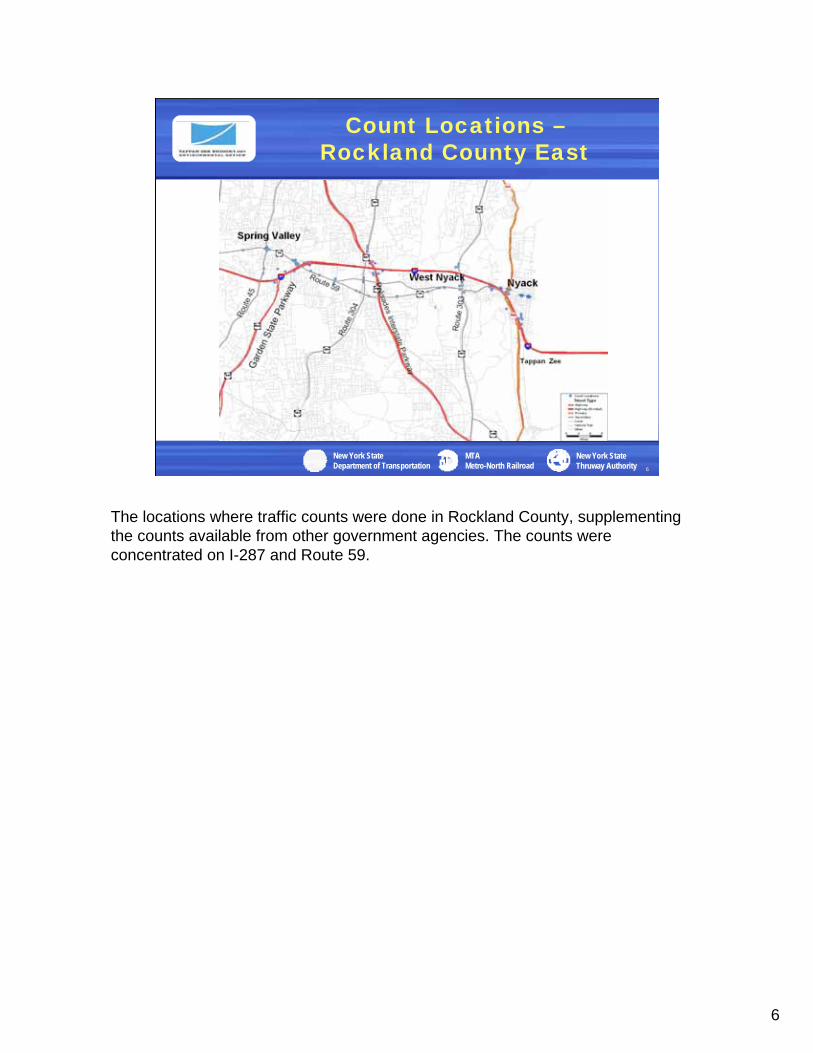
Count Locations –Rockland County East
The locations where traffic counts were done in Rockland County, supplementing the counts available from other government agencies. The counts were concentrated on I-287 and Route 59.

7
7
New York StateDepartment of Transportation
MTAMetro-North Railroad
New York StateThruway Authority
Count Locations –Westchester County West
The locations where traffic counts were done in Westchester County. The counts were concentrated on I-287, Route 119 and Route 120A.

8
8
New York StateDepartment of Transportation
MTAMetro-North Railroad
New York StateThruway Authority
Count Locations –Westchester County East
The locations where traffic counts were done in Westchester County. The counts were concentrated on I-287, Route 119 and Route 120A.

9
9
New York StateDepartment of Transportation
MTAMetro-North Railroad
New York StateThruway Authority
Surveys Conducted
• River crossing vehicle survey– All cars at Tappan Zee– EZPass at other crossings
• River crossing transit survey• Truck survey• Stated preference survey of transit modes
Surveys were done to collect data on current travel. The following slides show some of the results. The transit survey included all buses crossing the river and train passengers on the Port Jervis and Pascack Valley Lines. The truck survey investigated the impact of congestion pricing tolls. The stated preference survey examined how residents and travelers in the corridor viewed alternative transit modes.

10
10
New York StateDepartment of Transportation
MTAMetro-North Railroad
New York StateThruway Authority
Tappan Zee Bridge Eastbound Average Weekday Person Trips
Based on a survey of automobiles passing through the Tappan Zee Bridge toll plaza, the graph shows the origins on the west side of the Hudson and the destinations on the east side.
11
11
New York StateDepartment of Transportation
MTAMetro-North Railroad
New York StateThruway Authority
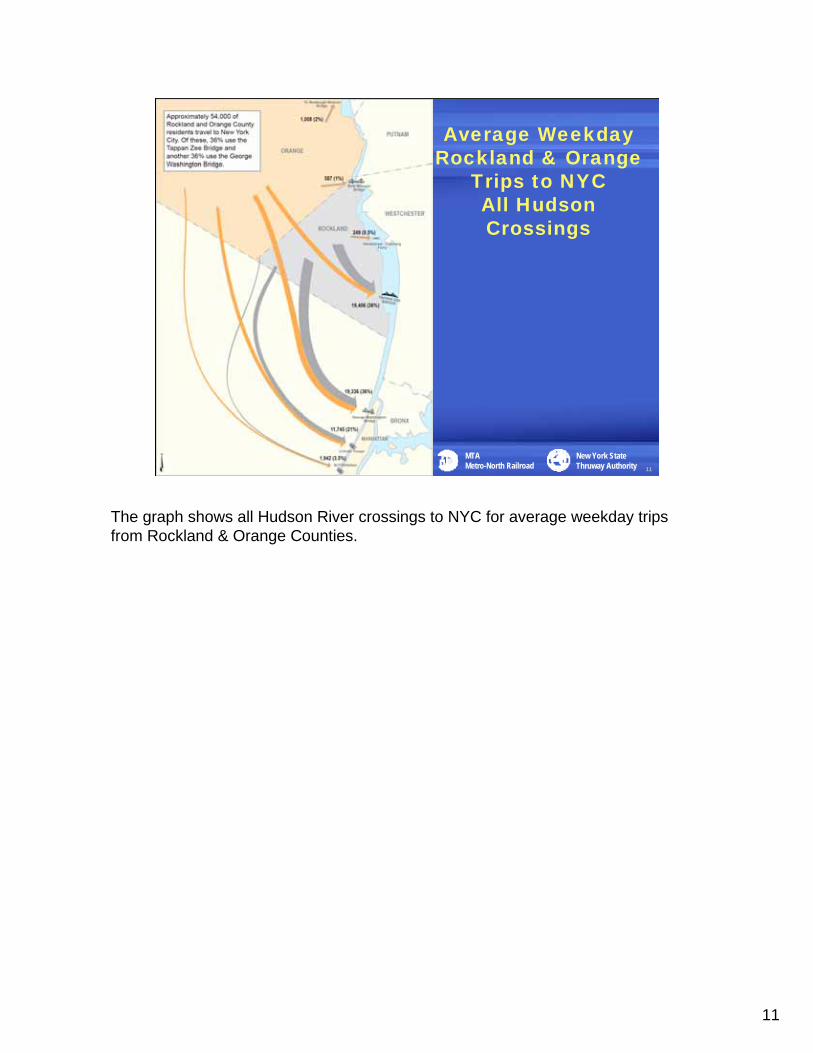
Average Weekday Rockland & Orange
Trips to NYCAll Hudson Crossings
The graph shows all Hudson River crossings to NYC for average weekday trips from Rockland & Orange Counties.

12
12
New York StateDepartment of Transportation
MTAMetro-North Railroad
New York StateThruway Authority
How We’re Using It
Predicting Future Conditions
This part of the presentation focuses on how we use our data on existing conditions to predict future conditions.

13
13
New York StateDepartment of Transportation
MTAMetro-North Railroad
New York StateThruway Authority
Key Steps
• Identifying growth trends and other planned projects
• Develop service plans for transit options• Run travel demand model• Run traffic impact model
The procedure we follow is to systematically look at the variables in the future and see what impact they had on travel.

14
14
New York StateDepartment of Transportation
MTAMetro-North Railroad
New York StateThruway Authority
Future Forecasts
– From the MPOs• Population• Employment• Capital Projects
Forecasts of population and employment are developed by the New York Metropolitan Transportation Council (NYMTC) with the cooperation of the counties it serves. Capital projects are all projects funded in the Transportation Improvement Programs adopted by the metropolitan planning organization.

15
15
New York StateDepartment of Transportation
MTAMetro-North Railroad
New York StateThruway Authority
Population Growth
P ro je c te d P o p u la tio n : 20 0 5 -2 0 3 5
-
2 0 0 ,0 0 0
4 0 0 ,0 0 0
6 0 0 ,0 0 0
8 0 0 ,0 0 0
1 ,0 0 0 ,0 0 0
1 ,2 0 0 ,0 0 0
1 ,4 0 0 ,0 0 0
1 ,6 0 0 ,0 0 0
1 ,8 0 0 ,0 0 0
2 ,0 0 0 ,0 0 0
Rockland
Orange
Westc
hester
Fairfie
ldBro
nx
Manahatta
n
2 0 0 52 0 1 02 0 1 52 0 2 02 0 2 52 0 3 02 0 3 5
Population forecast by five-year increments. The NYMTC forecasts currently are to 2030. Forecasts for 2035 are projections based on growth rates by zone between 2025 and 2030.

16
16
New York StateDepartment of Transportation
MTAMetro-North Railroad
New York StateThruway Authority
Employment Growth
P ro je c te d E m p lo y m e n t: 2 0 0 5 -2 0 3 5
-
5 00 ,00 0
1 ,0 00 ,00 0
1 ,5 00 ,00 0
2 ,0 00 ,00 0
2 ,5 00 ,00 0
3 ,0 00 ,00 0
Rockland
Orang
e
Westc
hester
Fairfie
ld
Bronx
Manaha
ttan
2 0 0 52 0 1 02 0 1 52 0 2 02 0 2 52 0 3 02 0 3 5
Employment forecasts were treated the same way as population forecasts. Note that employment in Westchester is growing faster than the population.

17
17
New York StateDepartment of Transportation
MTAMetro-North Railroad
New York StateThruway Authority
Capital Projects
• Adopted Transportation Improvement Programs (TIPs)– NYMTC– NJTPA– SWRPA
• Includes ARC as a project in all alternatives• Includes ESA and 2nd Ave Subway (to 63rd St in
2015)• Includes planned improvements on I-287 in
Westchester
The forecasts consider all approved capital projects.

18
18
New York StateDepartment of Transportation
MTAMetro-North Railroad
New York StateThruway Authority
Service Plans
Establishing Future Operating Conditions
Establishing Future Operating Conditions.

19
19
New York StateDepartment of Transportation
MTAMetro-North Railroad
New York StateThruway Authority
How the HOT Lanes Would Work
• Limited entry and exit points– Costs displayed in advance of entrance
• EZ-Pass only – no toll booths• No cost for buses• Costs for registered HOV3+ being evaluated• Costs for SOVs and HOV2s change
continuously with traffic to prevent congestion• No HOV discount on weekends
HOT lanes are a means of fully utilizing lanes set aside for high occupancy vehicles (HOVs) by allowing other vehicles in the lanes, for a toll, limited to the number that can operate without causing problems.

20
20
New York StateDepartment of Transportation
MTAMetro-North Railroad
New York StateThruway Authority
BRT Service Plans -Alternative 3
This diagram shows the bus routes using the BRT facilities across the corridor, but extending, in mixed traffic, to points north and south of the corridor, including Bergen County, Stamford, Yonkers and the Bronx.

21
21
New York StateDepartment of Transportation
MTAMetro-North Railroad
New York StateThruway Authority
Commuter Rail Service Plans –Alternative 4A
This diagram illustrates stop pattern and frequency of service for existing and proposed services. Green columns are rail services down the western shore to Hoboken and Penn Station, orange columns are services from Rockland and Orange Counties to Grand Central, and blue columns are cross-corridor service from Port Jervis and Hillburn to White Plains and Stamford.

22
22
New York StateDepartment of Transportation
MTAMetro-North Railroad
New York StateThruway Authority
Commuter Rail Service Plans –Alternative 4B and 4C
The same diagrams are shown for Alternatives 4B and 4C, without cross-corridor rail service. Note that all trains crossing the river would stop at the proposed Tappan Zee Station.

23
23
New York StateDepartment of Transportation
MTAMetro-North Railroad
New York StateThruway Authority
Light Rail Service PlanAlternative 4B
The service plan for light rail is simple, with one route stopping at all stops.

24
24
New York StateDepartment of Transportation
MTAMetro-North Railroad
New York StateThruway Authority
BRT Service Plans –Alternative 4C
The bus route diagram for Alternative 4C, where fewer routes serve Rockland County due to the rail service to the Hudson Line.

25
25
New York StateDepartment of Transportation
MTAMetro-North Railroad
New York StateThruway Authority
The Computer Modeling Process
The Computer Modeling Process.

26
26
New York StateDepartment of Transportation
MTAMetro-North Railroad
New York StateThruway Authority
The BPM Model
• We’re using the NYMTC Best Practice Model to forecast future travel– Covers 28 counties and is the adopted model
for the region– Has several elements and is a state-of-the-art
urban travel model– Splits trips between highway and transit
The basic travel forecasting model being used is the state-of-the-art Best Practice Model (BPM), a model developed especially for the New York metropolitan area.

27
27
New York StateDepartment of Transportation
MTAMetro-North Railroad
New York StateThruway Authority
What BPM Does
• BPM begins with population, employment and networks
• First it determines how many trips will be made in each zone
• Then it determines, simultaneously, where those trips will go, and what mode they will use
• Then it assigns those trips to highways, train routes, buses and subways.
BPM takes socio-economic data and uses it to forecast future travel and determine its mode and route.

28
28
New York StateDepartment of Transportation
MTAMetro-North Railroad
New York StateThruway Authority
BPM FLOWCHART
The sequence of computer programs that make up the Best Practice Model

29
29
New York StateDepartment of Transportation
MTAMetro-North Railroad
New York StateThruway Authority
BPM’s Highway Network
Wes te rn H
wy S
RT 3
03
I 87
TAPPAN ZEE BRIDGE EB
ERIE ST
N B
RO
AD
WA
Y
W NYACK RD
US H
WY 9W
SICKLETOWN RD
STATE HWY 59
PALISADES INTERSTATE
BARDONIA RD
GERMONDS RD
LD MOUNTAIN RD N
STAT
E HW
Y 30
4
BLAUVELT RD
TOWN LINE RD
ERIE ST E
S BR
OA
DWA
Y A
VE
Ramp
TAPPAN ZEE WB
DEPEW AVE
STATE HWY 303 N
RT 303 N
SMIT
H S
T
WES
TERN
HW
Y
WESTER
N HWY S
RT 3 03 S
KING
LUDVIGH RD
HURCH ST
STATE
HW
Y 303 CHRISTIAN HERALD RD
0 .4 .8 1.2
Miles
Functional ClassInterstateOther Freeway and ExpresswayMajor ArterialMinor ArterialCollectorLocalRampCentroid ConnectorLine Width by Capacity
30000 15000 7500
An illustration of the level of detail in the BPM highway network which includes all freeways (red) parkways (green) and most major arterials and collector routes (blue) but not all streets.

30
30
New York StateDepartment of Transportation
MTAMetro-North Railroad
New York StateThruway Authority
BPM’s Transit Network
This illustration shows the level of detail of the transit network, which includes all commuter rail lines (red), express bus routes (yellow), and local bus routes (green).

31
31
New York StateDepartment of Transportation
MTAMetro-North Railroad
New York StateThruway Authority
Modes Used
Transit• Drive to Commuter Rail• Walk to Commuter Rail• Drive to other transit [bus, subway, light rail, ferry]• Walk to other transitAuto• Single-occupant vehicle• Two-occupant vehicle• Three plus-occupant vehicleTaxiTruck• Light truck• Heavy truckOther Commercial Vehicles
BPM has four transit modes, three auto modes, taxi and three commercial vehicle modes.

32
32
New York StateDepartment of Transportation
MTAMetro-North Railroad
New York StateThruway Authority
Calibrate BPM
• Recalibrate BPM for 2005– Based on Census Journey-to-Work and
Surveys– Adjust fares, tolls and operating costs to reflect
2005– Adjust constants to get the trips to/from/within
the corridor to come out close to the counts– Further adjustments to get transit share closer
to counts
Before we applied BPM to future conditions, we calibrated it for 2005 based on existing count and travel data.

33
33
New York StateDepartment of Transportation
MTAMetro-North Railroad
New York StateThruway Authority
Run the Alternatives and their Options
• Alternative 1 - No Build• Alternative 2 - Bridge Rehabilitation• Alternative 3 – Full Corridor BRT• Alternative 4A – Full Corridor CRT Hillburn-Port
Chester/Hudson Line• Alternative 4B - CRT Hillburn-Hudson Line with
LRT in Westchester• Alternative 4C - CRT Hillburn-Hudson Line with
BRT in Westchester
We’re using it to test six alternatives and some options within each alternative.

34
34
New York StateDepartment of Transportation
MTAMetro-North Railroad
New York StateThruway Authority
Examples of Options
An example of an option being evaluated with BPM, showing the possible BRT route from Suffern to Airmont Road using the Piermont right-of-way as an exclusive busway.

35
35
New York StateDepartment of Transportation
MTAMetro-North Railroad
New York StateThruway Authority
The Paramics Model
• We’re using Paramics to forecast and analyze future traffic– Used for the corridor, divided between Rockland and
Westchester County– Uses trip tables [travel forecasts between zones] from
BPM– Can analyze interchanges, intersections, HOT lanes,
climbing lanes and traffic/transit interface– Produces Levels of Service for roadway segments and
interchanges/intersections
While BPM forecasts travel, by all modes, we use Paramics to analyze traffic on the roadways, based on forecasts from BPM.

36
36
New York StateDepartment of Transportation
MTAMetro-North Railroad
New York StateThruway Authority
Levels of Service
• Measure of congestion – from A to F– A - is free-flow traffic– C - is Stable flow– F - is Forced or breakdown flow
Traffic is measured using levels of service – a standardized method developed by the Federal Highway Administration.

37
37
New York StateDepartment of Transportation
MTAMetro-North Railroad
New York StateThruway Authority
Calibrate Paramics
• Calibrate Paramics to Counts– Adjust the model and trip table to match the
counts on I-287 and the major arterials– Add zones and network links as necessary to
allow detailed analysis, especially at potential station locations and new facilities
Like BPM, we have to calibrate the Paramics model to current conditions before applying it in the future.

38
38
New York StateDepartment of Transportation
MTAMetro-North Railroad
New York StateThruway Authority
Example of Paramics
• Interchange 11 – Route 59 in Nyack• Needs reconstruction with HOT Lanes
and/or climbing lane• Possibilities for improving traffic flow and
eliminating conflicts
As an example, we are using Paramics to analyze the impact of a reconfigured interchange at Interchange 11 in Nyack.

39
39
New York StateDepartment of Transportation
MTAMetro-North Railroad
New York StateThruway Authority
Examples of Options
An example of options being evaluated using Paramics, showing alternative interchange configurations at Interchange 11 in Nyack.

40
40
New York StateDepartment of Transportation
MTAMetro-North Railroad
New York StateThruway Authority
SAWG Land Use Meetings
1. Land Use and Zoning in the Study Area2. Transportation Data and Forecasting3. Transportation Oriented Development4. Acquisitions and Relocations5. Neighborhood/Town Focused
Discussions of Potential Land Use Impacts
A listing of possible topics to be presented in future meetings.