Saudi Arabia Fertilizers Company - Aljazira Capital · Urea capacity – Expansion plans ... Cash...
26
Saudi Arabia Fertilizers Company SAFCO: Initiation Report Please Read Disclaimer on the Back © All rights reserved, AlJAZIRA CAPITAL Research Division Company Reports December 2011
Transcript of Saudi Arabia Fertilizers Company - Aljazira Capital · Urea capacity – Expansion plans ... Cash...

Saudi Arabia Fertilizers CompanySAFCO: Initiation Report
Please Read Disclaimer on the Back
© All rights reserved, AlJAZIRA CAPITAL
Research DivisionCompany Reports December 2011

Aljazira Capital is a Saudi Investment Company licensed by the Capital Market Authority (CMA), License No. 07076-37
Brokerage and Investment Centers DivisionResearch Division
General Manager - Brokerage DivisionAla’a Al-Yousef+966 1 [email protected]
Division ManagerAbdullah Alawi+966 2 [email protected]
AGM-Head of international and institutional brokerageLuay Jawad Al-Motawa +966 1 [email protected]
Senior Analyst Syed Taimure Akhtar +966 2 6618271 [email protected]
Regional Manager - Central RegionSultan Al-Mutawa+966 1 [email protected]
AnalystSaleh Al-Quati+966 2 [email protected]
Regional Manager - West and South RegionsAbdullah Al-Misbahi+966 2 [email protected]
Area Manager - Qassim & Eastern ProvinceAbdullah Al-Rahit+966 6 [email protected]

December 2011
ContentsSAFCO - A Defensive Play 1Investment Risks 3Valuation Summary 4
Discounted cash flows (DCF) Valuation 4Comparative valuation 6Weighted average valuation 6Sensitivity Analysis 7Valuation Under Different Scenarios 7
Company Overview 9Shareholding pattern 9
Production process & key consuming markets 10SAFCO-V – Financial Implication 12Massive expansions will lead excessive production capacities globally 13
Ammonia capacity - Expansion plans 13Urea capacity – Expansion plans 13
Expansion Will Support Production Growth 14SAFCO-V to support production growth 14
Financial Overview 159MFY11 Financial Result 15
Balanced Financial Growth 164Q11 Financial Estimates 18
Financial Statements 19SAFCO - Income Statement (FY10-14e) 19SAFCO - Balance Sheet (FY10-14e) 20SAFCO - Cash Flow Statement (FY10-14e) 21
Page 1 of 21 December 2011
SAFCO - A Defensive Play
• Operational focus revolves around fertilizer business - Saudi Arabia Fertilizers Company (SAFCO) is among the key producers of fertilizer products within the region and the largest manufacturer of fertilizers inside the Kingdom. At present, after the shutdown of Dammam urea plant in 4QFY08, the company is operating at a design capacity of around 4.5mn tons of fertilizer. The company’s production mix is mainly based on ammonia & urea; where most of the ammonia is used to produce urea. Beside these products, the company has a limited capacity to produce melamine and sulfuric acid. It is noteworthy that the company adopted a defensive expansion rather than aggressive; where the recent expansion (SAFCO-IV) was completed in 2QFY07. Moreover, we believe the company, at present, is indicating to remain more focused on fertilizer business rather than diversification.
• Improvement in capacity utilization and steady price movement supported regional sector – The financial turmoil in 2008 led most of the developing nations to postpone their expansion plans (including fertilizer complexes), which were supposed to come online in recent years. Consequently, these countries along with others are still relying on imports, which allowed the regional as well as local fertilizer plants to make a quick come back in term of capacity utilization. Moreover, recovery in the average prices of fertilizer products from 4QFY08 & 1HFY09 levels also played a vital role in supporting the regional sector’s financial growth.
• SAFCO-V project to expand fertilizer products’ base – SAFCO recently made an announcement to initiate study to establish a new production facility (SAFCO-V) of SAR1.9bn (USD500mn). According to the given information, SAFCO is scheduled to award Engineering, Procurement and Construction (EPC) for the project in 4QFY11, while the project is expected to come on in 2HFY14. Furthermore, the announcement was made after reaching an agreement with the Ministry of Petroleum and Mineral Resources (MPMR) for the supply of feedstock gas, which was the major reason to put this expansion on hold in the past. SAFCO-V is expected to make the additions of 1.2mn tons and 1.5mn tons ammonia and urea, respectively, which will lead the overall capacity to increase at 2010-14CAGR of 6.7%.
• Possible over-supply in global market – According to International Fertilizer Association (IFA) 2011-15 outlooks, the sector will experience 250 capacity-related projects with an estimated investment of USD88bn till 2015. This indicates most of the new complexes around the globe are under construction process, so the world is still facing an imbalance demand supply situation. However, the completion of these expansions, possibly in 2014, will drag the global industry to face over-supply situation. Similarly, we expect SAFCO to operate with high utilization rate ranging in the average level of 95%-115% till 2013 and show subsequent decline in utilization rate in 2014.
Key Financial and Valuation Data
Financials (All fig in SAR mn, unless otherwise stated)
2010 2011 E 2012 E 2013 E 2014 E
Revenues 3,789 5,325 6,346 6,494 6,716
EBITDA 3,051 4,431 5,240 5,426 5,566
Net income 3,235 4,383 5,366 5,531 5,646
EPS (SAR) 12.9 17.5 21.5 22.1 22.6
P/E 12.3 10.0 8.2 7.9 7.7
PBV 5.6 5.3 4.7 4.2 3.7
EV/EBITDA 12.4 9.2 7.8 7.4 7.2 Source: Company Data, AlJazira Capital * Historical prices are based on respective year end closing and for 2011 &
subsequent year we have taken closing price as on 21st Dec 2011
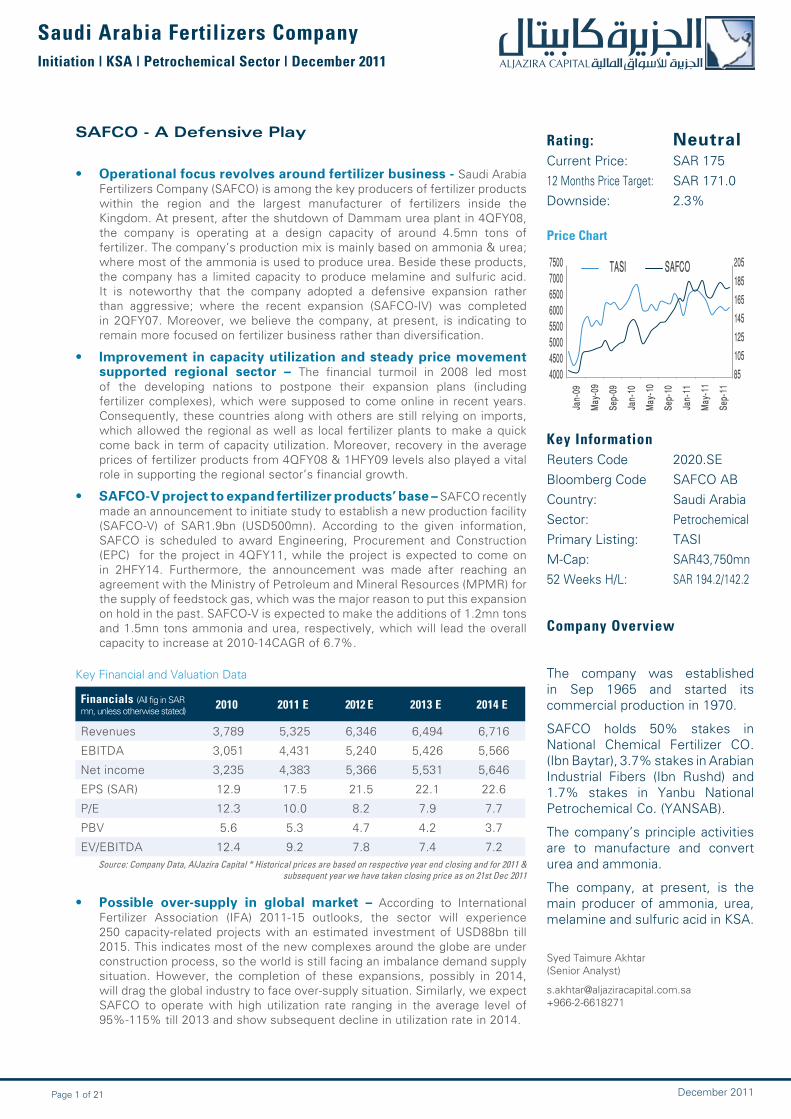
Saudi Arabia Fertilizers CompanyInitiation | KSA | Petrochemical Sector | December 2011
Rating: NeutralCurrent Price: SAR 17512 Months Price Target: SAR 171.0Downside: 2.3%
85 105 125 145 165 185 205
4000 4500 5000 5500 6000 6500 7000 7500
Jan-
09
May-
09
Sep-
09
Jan-
10
May-
10
Sep-
10
Jan-
11
May-
11
Sep-
11
TASI SAFCO
Key Information Reuters Code 2020.SEBloomberg Code SAFCO ABCountry: Saudi ArabiaSector: PetrochemicalPrimary Listing: TASIM-Cap: SAR43,750mn52 Weeks H/L: SAR 194.2/142.2
Company Overview
The company was established in Sep 1965 and started its commercial production in 1970.
SAFCO holds 50% stakes in National Chemical Fertilizer CO. (Ibn Baytar), 3.7% stakes in Arabian Industrial Fibers (Ibn Rushd) and 1.7% stakes in Yanbu National Petrochemical Co. (YANSAB).
The company’s principle activities are to manufacture and convert urea and ammonia.
The company, at present, is the main producer of ammonia, urea, melamine and sulfuric acid in KSA.
Syed Taimure Akhtar(Senior Analyst)
[email protected]+966-2-6618271
Price Chart

Page 2 of 21 December 2011
Saudi Arabia Fertilizers Company
• Sound financial growth – We expect the company’s revenues to increase at a CAGR of 15.4%, during 2010-14. The expected growth is mainly based on the increase in volumetric sales and average prices of related fertilizer products at a CAGR of 2.4% and 10.5%, respectively during 2010-14. On the other hand, the expected stability in gross margin coupled with growth in revenues will the lead the company’s net profitability to increase at a CAGR of 14.9%, during 2011-14.
• Investment recommendation – We used a blended approach to derive 12-month price target for SAFCO. Under this valuation approach, we assigned 85% weights to DCF based value and 15% to relative/comparative valuation (EV/EBITDA metrics) based value and arrived at a weighted average 12-month price target of SAR171.0/share. This implies the stock is trading at a premium of 2.3% to the market price of SAR175/share (as of 21st Dec 2011) and prospective 2012 P/E & P/BV of 8.2 and 4.7x, respectively. We, therefore, initiate our coverage on SAFCO with Neutral recommendation.

Page 3 of 21 December 2011
Saudi Arabia Fertilizers Company
Investment Risks
• Deviation in capacity utilization from expectation – The growth story of SAFCO is primarily based on improvement in capacity utilization. We believe the main factors which could lead us to make subsequent changes in our expected utilization and valuation are (i) early completion of expansion in importing countries or vice versa, (ii) lower than expected demand of related products or vice versa and (iii) easy availability of substitute products i.e. DAP3.
• Lower than expected average prices – We are considering that the average prices of related fertilizer products will remain close to its current high levels. Hence, any unexpected movement in the average prices could lead us to make subsequent changes in our valuation.
• Larger than expected impact of competition – Based on the upcoming regional & international capacity expansions, we are expecting the company might face stiff challenges to maintain its market share in international markets. Although we have discounted this factor in our valuation but any event beyond our expectation could lead us to alter our valuation, subsequently.
• Unexpected maintenance shutdown – Though the unexpected maintenance shutdown has no long-term impact the company’s growth but it could hit the financials of the particular period. Hence, we are anticipating limited impact on the company’s valuation.
• Delay in SAFCO-V expansion – In a later section, we have discussed in detail the impact of any possible an early or a delayed commencement of SAFCO-V expansion on our valuation.
3 Di ammonia phosphate used as a fertilizer and it temporarily increase the soil acidity.

Page 4 of 21 December 2011
Saudi Arabia Fertilizers Company
Valuation Summary
Discounted cash flows (DCF) Valuation
The following are key basic steps & assumptions we are using to value SAFCO on DCF:
• 4-years forecasted free cash flows (FCF).
• Terminal value calculation based on the Gordon Growth Model (GGM).
o Expecting terminal growth of 3%.
• Using Capital Asset Pricing Model (CAPM) to calculate cost of equity. However, the CAPM calculation is based on the following variables:
o Risk free rate of 3.1%, which is equivalent to 10-years US bond yield plus Saudi Arabia sovereign risk premium of 1.25%.
o Equity risk premium taken at 10.77%.
o Beta of 1.05
• We are using Weighted Average Cost of Capital (WACC) for discounting the future FCF of the company, where the calculation of WACC is based on the following variables:
o Cost of equity equivalent to CAPM
o Cost of debt taken at 3.9%
o Contribution from equity & debt in SAFCOs capital structure is taken at 95% & 5%, respectively.
Using the above assumptions, we have derived the company’s cost of equity & WACC at 14.4% & 13.9%, respectively, and arrived at DCF based value of SAR179.7/share for the company.

Page 5 of 21 December 2011
Saudi Arabia Fertilizers Company
DCF Base Valuation
Source: AlJazira Capital
All figures in SAR Mn, unless specified 2010 2011e 2012e 2013e 2014e
Revenues 3,789 5,325 6,346 6,494 6,716
EBITDA 3,051 4,431 5,240 5,426 5,566
Margin (%) 80.5% 83.2% 82.6% 83.5% 82.9%
EBIT 2,622 3,980 4,752 4,894 4,982
Margin (%) 69% 75% 75% 75% 74%
Net Income 3,235 4,383 5,366 5,531 5,646
Margin (%) 85% 82% 85% 85% 84%
Cash from operations 2,435 4,211 4,910 5,024 5,101
Total assets 8,379 9,331 10,420 11,546 12,977
Shareholders› equity 7,134 8,212 9,289 10,398 11,813
Total liabilities & equity 8,379 9,331 10,420 11,546 12,977
Free Cash Flow Analysis (FCF)
NOPLAT 2,363 3,898 4,670 4,809 4,896
Depriciation & amortization 429 450 488 532 584
Change in net working capital (377) (138) (248) (318) (379)
CAPEX (222) (664) (638) (733) (865)
FCF 2,193 3,546 4,273 4,291 4,236
Discount Factor 0.99 0.87 0.76 0.67
PV of FCF 3,500 3,704 3,266 2,831
Sum of PV of FCF 13,301
Terminal value 40,099
PV of Terminal value 26,801
Enterprise value 40,102
Add: Net debts 4,117
Total equity value 44,219
Value of YANSAB in SAFCO 709
Net Worth 44,927
Shares (mn) 250.0
DCF Based value (SAR/share) 179.7
Terminal growth 3.0%
WACC 13.9%

Page 6 of 21 December 2011
Saudi Arabia Fertilizers Company
Source: AlJazira Capital
Source: AlJazira Capital
Comparative valuation
Weighted average valuation
SAR/Share Weights Weighted average
DCF base value 179.7 85% 152.8
Relative value 121.4 15% 18.2
Weighted average 12-month price target (SAR/share) 171.0
All figures in SAR Mn, unless specified
Sector EV/EBITDA 5.9
Implicit enterprise value 26,235
Cash 4,197
Debt (80)
Net worth of SAFCO 30,352
Shares outstanding (mn) 250
Comparative value (SAR/share) 121.4
Comparative valuation
We used EV/EBITDA to compare SAFCO with its peer group around the globe. Under the comparative valuation, we used the average 2011 EV/EBITDA of 5.9x for the peer group to arrive at a value of SAR121.4/share for the company.
Weighted average valuation
We used a blended approach to derive the price target for SAFCO. Under this valuation approach, we assigned 85% weights to DCF based value and 15% to relative/comparative valuation (EV/EBITDA metrics) based value and arrived at a weighted average 12-month price target of SAR171.0/share. This implies the stock is trading at a premium of 2.3% to the market price of SAR176/share (as of 21st Dec 2011) and trading at prospective 2012 P/E & P/BV of 8.2 and 4.7x, respectively. We, therefore, initiate our coverage on SAFCO with Neutral recommendation.

Page 7 of 21 December 2011
Saudi Arabia Fertilizers Company
Sensitivity Analysis
Scenario 1 – Price Analysis
Source: AlJazira Capital
Source: AlJazira Capital
Sensitivity Analysis
The table below highlights the sensitivity of SAFCO weighted average 12-month price target with terminal growth & WACC.
Valuation Under Different Scenarios
In order to examine different situations that SAFCO could face we have further tested our core fundamental assumptions under two possible scenarios: Bull Case and Bear Case. These scenarios illustrate how sensitive our DCF-based fair value is to changes in key fundamental variables. We chose the impact of average prices of related products, while keeping the other factors constant (base case) and the capacity utilization of the company’s operational complexes, while keeping the other factors constant (base case).
0 50 100 150 200 250
Bear Case - 15%
-10.0%
-7.5%
-5.0%
-2.5%
Base Case
2.5%
5.0%
7.5%
10.0%
Bull Case - 15%
SAR/share
144.4
153.1
157.5
162.0
166.4
171.0
175.6
180.4
185.4
190.8
203.3
Term
inal
Gro
wth
Weighted Average Cost of Capital (WACC)
11.88% 12.88% 13.88% 14.88% 15.88%
2.00% 186.1 173.2 162.5 153.4 145.7
2.50% 192.2 178.1 166.5 156.8 148.5
3.00% 199.0 183.6 171.0 160.5 151.6
3.50% 206.7 189.6 175.8 164.5 154.9
4.00% 215.3 196.3 181.2 168.8 158.5

Page 8 of 21 December 2011
Saudi Arabia Fertilizers Company
Scenario 2 – Capacity Utilization
Source: AlJazira Capital
0 50 100 150 200 250 300
Bear Case - 60%
65.0%
70.0%
75.0%
80.0%
Base Case
90.0%
95.0%
100.0%
105.0%
Bull Case - 115%
SAR/share
116.9
126.6
136.2
146.1
155.8
171.0
175.4
185.1
194.8
204.6
224.0

Page 9 of 21 December 2011
Saudi Arabia Fertilizers Company
SAFCO – Product-wise capacity
Source: Tadawul
Source: Company reports & Aljazira Capital
Company Overview
Saudi Arabia Fertilizer Company (SAFCO) is among the largest producer of fertilizer products in the region. The company is operating at a design capacity to produce around 4.5mn tons of different fertilizer products; where production is primarily based on ammonia and urea. However, the company is also producing a limited amount of melamine and sulfuric acid products.
It is noteworthy that the company has not made any expansion in its capacity after the completion of SAFCO-IV in 2007 i.e. 4th expansion since its establishment in 1965. Hence, beside the issue of gas allocation for SAFCO-V in past, this indicates the company’s reluctance for an aggressive expansion strategy. Apparently, this enabled the company to remain cost efficient in the recent global financial turmoil with the only setback was from the decline in average prices of related products. In addition, the company permanently shut down its oldest Dammam urea plant in 4QFY08.
In 2011, SAFCO canceled JV with Saudi Iron & Steel Company complex (Hadeed) to construct a flat steel product facility and made an announcement to continue its focus on generic business i.e. fertilizer. According to the press release, the company’s decision not to make further development on 50:50 JV with Hadeed is based on the not encouraging results of the final studies.
Shareholding pattern
The below chart shows the company’s current shareholding structure as of 31st Dec 2010:
Production line Capacity (% of Total)
Ammonia 45.0%
Urea 51.7%
Melamine 2.9%
Sulfuric acid 0.4%
SAFCO is the largest producer of fertilizer products inside the Kingdom. The major feedstock is methane gas, which is supplied by Saudi Aramco under a long-term contract.
The company was established with the initial share capital of SAR100mn, which continued to increase over the period of time. At present, SAFCOs share capital is stood at SAR2,500mn,
SAFCO is considered as the fertilizer wing of SABIC; where SABIC owns most of the company’s stake followed by GOSI.
Based on the given information, SAFCO-IV expansion made the addition of 2.2mn tons of urea & ammonia in 2007.
At the time of closure Dammam plant was operating with a design capacity to produce 330,000 & 200,000 tons/year of urea and ammonia, respectively.
Based on the given information, the canceled JV with Hadeed was scheduled to operate at a design capacity to produce 1.7mn tons of flat steel.
SABIC 42.9%
GOSI 16.7%
General Public40.4%

Page 10 of 21 December 2011
Saudi Arabia Fertilizers Company
Ammonia production process
Source: New Zealand Institute of Technology
Production process & key consuming markets
The company has a typical operational structure at the complex; where the production flow is much similar to other international players. Most of the fertilizer complexes around the world are utilizing ammonia as a feedstock to produce urea and Di Ammonia Phosphate (DAP). However, the production flow at SAFCO complex starts from the manufacturing of ammonia and ends with the generation of urea as the final output.
According to the company’s annual reports, sales to Asian market remained prominent over the period of time; where the contribution in sales was recorded at 66.9% in 2009 as compared to 40.3% in 2007 (Note: The unavailability of 2010 revenues break-up led us to use 2009 revenues break-up). In addition, American & Australian markets made 30.6% of the company’s sales revenue in 2009 followed by the limited exposure in local and regional market.
Natural gas
Desulfuriser
Waste heat boiler
Shift converter(CO CO2 )
Air reformer
Steam reformer
CO2 removal
Methananation
NH3 converter
Cool to 30oC
Mixer
Compression and cooling
Decompression
CO2
Ammonia
CO2 Stripper
NH3 recovery
NH3
NH3 Pure gas
Synthesis loop
Impurities
Industry Urea plant
UCARSOL
Air
Saturated UCARSOL
Steam
Water
Waste heat boiler
Flue gases
Steam
Atmosphere
Water
Urea plant

Page 11 of 21 December 2011
Saudi Arabia Fertilizers Company
We believe the limited exposure in local and regional markets are mainly due to the lower consumption of fertilizer products on the back of limited agricultural activities i.e. wheat, rice, grain and so on, locally.
CO2
Synthesis
Decomposition
Granulation
Concentration
NH3, CO2
Recovery
NH3
Urea, excess NH3,Carbamate, H2O
Urea H2O
Heat
Heat
Urea
H2O
Cooling
UreaGranule
Urea production process
Source: New Zealand Institute of Technology

Page 12 of 21 December 2011
Saudi Arabia Fertilizers Company
SAFCO - V – Impact on EPS
SAFCO-V – Implication on valuation
Source: AlJazira Capital
Source: AlJazira Capital
SAFCO-V – Financial Implication
The project faced several delays because of reluctance from Saudi Aramco to supply gas for this expansion. However, after reaching an agreement to get undisrupted supply of feedstock gas from Saudi Aramco the company, recently, made announcement to reinitiate its study to establish new production line i.e. SAFCO-V. According to the given information, the company is scheduled to award EPC for the project in 4QFY11, while the project is scheduled to come online in 2HFY14. The start of commercial operation from SAFCO-V will make the addition of 2.7mn tons of urea of ammonia in the company’s existing production capacity.
Based on given information, we expect the project will start its commercial operation in 2HFY14. This indicates the impact of SAFCO-V on the company cash flows will start in 2014. The completion of project will lead the company’s overall capacity to increase at a CAGR of 6.7% in 2010-14.
Scenarios 2014 (EPS in SAR) Impact in % - 2014 EPS
Commencement after 2014 21.1 -6.6%
Base Case 22.6
Early start 2Q 2014 23.2 2.7%
159.2
171.0
190.1
0 50 100 150 200 250
Commence operation after 2014
Base Case
Early start 2Q14
SAR/share

Page 13 of 21 December 2011
Saudi Arabia Fertilizers Company
Million Tonne 2010* 2011e 2012e 2013e 2014e 2015e
Supply
Capacity 179.5 184.1 198.2 205.4 218.6 224.5
Total supply 152.0 155.6 165.1 171.7 182.1 190.5
Demand
Fertilizer demand 129.7 134.5 138.0 142.6 146.4 150.4
Non-fertilizer demand 18.3 19.6 19.6 20.2 21 21.3
Total demand 148.0 154.1 157.6 162.8 167.4 171.7
Supply/demand gap 4.0 1.5 7.5 8.9 14.7 18.8
Based on IFA estimations, we expect 2011 will remain a tight year for fertilizer industry with limited availability of excess urea. Considering the historical utilization rate, the sector is expected to start facing massive excess in urea starting 2014, which will further increase to 18.8mn tons of urea in 2015. Hence, we believe this will allow the complexes globally to operate on high utilization rate without facing intense inventory build-up pressure till 2013.
However, the historical utilization rate with scheduled expansion will lead the sector to reach excess urea of 14.7mn tons and 18.8mn tons in 2014 & 2015, respectively. Thus, the key exporting regions (with large facilities) are expected to operate at a lower utilization rate with limited volumetric growth, in the long-run, to (i) avoid inventory build-up and (ii) fill the post expansion global demand/supply gap, which is expected to remain in major importing countries.
World Urea Supply & Demand
Source: IFA 2011-15 outlooks * estimated figures by IFA
Massive expansions will lead excessive production
capacities globally
According to IFA 2011-15 outlooks, the global industry will carry out 250 capacity-related expansion projects, over the next five years. Moreover, IFA estimates that almost USD88mn will be invested in the sector to carry out these projects. It is noteworthy that most of the expansions are scheduled to be done on existing sites.
Ammonia capacity - Expansion plans
Based on IFAs 2011 global capacity survey, ammonia capacity around the world is expected to increase at a CAGR of 3.5%, during 2010-15, to reach at 229.6mn tons/year in 2015. Moreover, the expected expansion in capacity is mainly based on the successful completion of 67 projects during 2010-15. It is noteworthy that around 33% of the upcoming expansions are expected from China. On regional basis, the major expansions are expected in Asian, African and Latin American regions.
Urea capacity – Expansion plans
Most of ammonia around the world is utilized to produce urea. This indicates urea as the major driver in the growth of ammonia capacity. According to IFA 2011-15 outlooks, around 58 new plants are expected to come on-stream till 2015. Consequently, this will lead the global urea capacity to increase at a CAGR of 4.5%, during 2010-15, to reach at 224.5mn tons in 2015. In addition, IFA estimates urea production and demand around the globe will increase at a CAGR of 4.6% and 3%, during 2010-15, respectively.

Page 14 of 21 December 2011
Saudi Arabia Fertilizers Company
Production Growth
Source: Aljazira Capital *2010 production figures are calculated while 2011 onwards are estimated
Expansion Will Support Production Growth
In line with the global sector future dynamics, we expect the company will be able to continue to show improvement in the utilization rate till 2013 ranging in the average levels of 95%-115%. However, the company’s utilization rate is expected to drop down to 75%-80% in 2014, which is mainly due to the anticipated oversupply situation globally, if large fertilizer complexes around the world continue to operate at historical utilization rate (as discussed earlier).
SAFCO-V to support production growth
We believe since the inception of SAFCO-IV plant in 2007, the company’s production growth was solely based on the operational performance/smoothness of existing production line. Similarly, the operational halt at the company’s production facilities in 4QFY09 remained a prime factor that led YoY decline of 12.3% in production volume in 2009. However, the increase in volumetric production in subsequent years i.e. 2010 & 2011 was mainly associated with the undisputed flow of operation with better utilization rate.
Despite of expected decline in the utilization rate in 2014 (as discussed earlier), we expect the company’s overall volumetric production to increase at a CAGR of 2.3%, during 2010-14. The growth in production volume is mainly based on;
1. Start of SAFCO-V project, which will offset the potential impact of lower utilization rate in 2014 on production volume.
2. The demand/supply gap in major importing countries will remain in coming years, since the pace of increase in demand in these countries will remain higher than their respective expansions in coming years.
Production (000 tons) - LHS Growth - RHS
-12.3%
6.6%
1.9% 1.6%
2.6%
3.4%
-15.0%
-10.0%
-5.0%
0.0%
5.0%
10.0%
3800
4000
4200
4400
4600
4800
5000
2009 2010* 2011e 2012e 2013e 2014e

Page 15 of 21 December 2011
Saudi Arabia Fertilizers Company
Financial Overview
9MFY11 Financial Result
SAFCO posted after tax profit of SAR2.8bn (EPS: SAR11.3) in 9MFY11, indicating an increase of 48.6% as compared to the corresponding period last year. On quarterly basis, the company’s 3QFY11 profitability rose by 100.5% to SAR1.2bn (EPS: SAR4.8). The YoY growth in net profitability, on quarterly and 9MFY11, was mainly based on the improvement in operational performance of the company; where 9MFY11 gross margin was recorded at 74.4% as compared to 71.2% in 9MFY10.
Furthermore, the improvement in the company’s financials, during the period review, was mainly associated with YoY increase in (i) volumetric sales by 2.6% in 9MFY11 and 2.5% in 3QFY11 and (ii) the average prices of related fertilizer products rose by 36.1% in 9MFY11 and 41.9% in 3QFY11.
9MFY10 9MFY11
Profitability Ratios (%)
Gross Profit Margin 71.2% 74.4%
Operating Margin 69.2% 72.7%
Net Profit Margin 76.7% 79.9%
Return on Average Assets 24.9% 37.1%
Return on Average Equity 30.0% 43.7%
Liquidity Ratios (x)
Current Ratio 4.1 6.8
Quick Ratio 3.5 6.1
Turnover Ratios (x)
Inventory 6.4 9.1
Receivable 6.2 5.6
Payable 0.5 0.5
Capital Structure
Debt/Equity (%) 2.7% 1.2%
Interest Coverage (x) n/a n/a
All figures in SAR Mn, unless specified 9MFY10 9MFY11 YoY Change
Sales 2,487.2 3,546.2 42.6%
Cost of sales (715.3) (909.0) 27.1%
Gross profit 1,771.9 2,637.2 48.8%
General & Administrative expenses (51.9) (60.8) 17.3%
Income from main operation 1,720.0 2,576.4 49.8%
Investment income 22.4 36.3 62.0%
Income from Ibn Byatar 214.6 278.9 30.0%
Income before zakat 1,957.0 2,891.6 47.8%
Zakat (50.3) (58.5) 16.4%
Net income 1,906.8 2,833.1 48.6%
Earnings per share (SAR) 8.84 11.33
Financial Ratios: 9MFY11
Income Statement: 9MFY11
Source: SAFCO quarterly financial statements
Source: SAFCO quarterly financial statements

Page 16 of 21 December 2011
Saudi Arabia Fertilizers Company
Sales revenue growth
Source: SAFCO financial reports & Aljazira Capital
Balanced Financial Growth
We believe the favorable price trend in related products along with the improvement in volumetric sales will remain crucial for the company’s future growth. Hence, the expected increase in these factors at 2010-14 CAGR of 10.5% and 2.4%, respectively, will translate into an increase in the company’s revenues at a CAGR 15.4%, during 2010-14. On the other hand, SAFCOs gross margins are expected to show steady improvement and stabilize in the range of 75%-76%, during 2011-14, as compared to 4-year (FY07-10) historical average of 69.3%.
-50.6%
38.3%
40.5% 19.2% 2.3%
3.4%
-60.0%
-40.0%
-20.0%
0.0%
20.0%
40.0%
60.0%
0
1000
2000
3000
4000
5000
6000
7000
2009 2010 2011e 2012e 2013e 2014e
Sale revenues (SAR mn) Growth - RHS

Page 17 of 21 December 2011
Saudi Arabia Fertilizers Company
The company’s net profitability is expected to be SAR4.3bn (EPS: SAR17.4) in 2011, indicating a growth of 34.1% over net profit of 2010. However, SAFCOs net profit margin is expected to lower down in 2011 to 82.3% from 85.4% recorded in 2010; where the decline is mainly due to the recognition of gain on disposal of land amounting SAR302.5mn in 2010.
Net profitability growth, ROAA & ROAE
Source: SAFCO financial reports & Aljazira Capital
We expect the company’s net profitability margin will continue to show improvement in 2012 and 2013 to 85% (on average basis). However, the expected decline in utilization rate in 2014 will cause a retreat in the company‘s net margin to 84.1% in the respective year.
19.8%
37.7%
49.5%
54.3%
50.4%
46.0%
24.5%
45.6%
57.1%
61.3%
56.2%
50.8%
15.0%
20.0%
25.0%
30.0%
35.0%
40.0%
45.0%
50.0%
55.0%
60.0%
65.0%
0
1000
2000
3000
4000
5000
6000
2009 2010 2011e 2012e 2013e 2014e
Net profit (SAR mn) - LHS ROAA - RHS ROAE - RHS

Page 18 of 21 December 2011
Saudi Arabia Fertilizers Company
All figures are in SARmn, unless otherwise stated
1QFY11A 2QFY11A 3QFY11A 4QFY11eQoQ change
4QFY11/3QFY11
Sales revenue 1,038 1,130 1,379 1,779 29.0%
Gross profit 775 778 1,084 1,426 31.6%
EBIT 757 757 1,062 1,404 32.2%
Net income 833 790 1,211 1,550 28.1%
EPS (SAR) 3.3 3.2 4.8 6.2
4Q11 Financial Estimates
The company is expected to post after tax profit of SAR1.5bn (EPS: SAR6.2) in 4QFY11 as compared to the net profit of SAR1.2bn (EPS: SAR4.8) in preceding quarter i.e. 3QFY11. The QoQ growth in SAFCO bottom line is mainly associated with the expected improvement in the average prices of related fertilizer products and higher volumetric sales due to seasonal impact. Consequently, these factors will lead the company’s revenue to show QoQ increase of 29%, where gross margin is expected to reach at 80.2% as compared to 78.6% recorded in 3QFY11.
In comparison with the corresponding quarter last year, our expected revenues for 4QFY11 are indicating a growth of 36.6%. However, the net profitability is expected to show an improvement of 51.2% over the after tax profit of SAR1.0bn (EPS: SAR4.1) recorded in 4QFY10. The growth is mainly based on the expected improvement in operational margins to 78.9% in 4QFY11 as compare to 69.9% recorded in 4QFY10.
Source: SAFCO Quarterly financial reports & Aljazira Capital
4Q11 Financial Estimates

Page 19 of 21 December 2011
Saudi Arabia Fertilizers Company
Financial Statements
SAFCO - Income Statement: FY10-14e
Source: SAFCO financial reports, AlJazira Capital
All figure in SAR Mn, unless specified 2010 2011E 2012E 2013E 2014E
Sales 3,789 5,325 6,346 6,494 6,716
Cost of sales (1,100) (1,262) (1,503) (1,505) (1,635)
Gross Profit 2,690 4,064 4,843 4,989 5,081
Selling & distribution expenses (68) (83) (92) (95) (99)
General & admin expenses - - - - -
Operating Income 2,622 3,980 4,752 4,894 4,982
Interest income and financial charges - net 65 56 78 80 81
Write down of investment - - - - -
Other income (expenses) - net 303 - - - -
Interest before share of income from associated company 2,989 4,036 4,830 4,973 5,063
Income from IBN-Baytar 307 429 618 643 669
Net Income Before Zakat 3,296 4,465 5,447 5,616 5,732
Zakat (61) (82) (82) (84) (86)
Unusual item - (0) - - -
Net Income 3,235 4,383 5,366 5,531 5,646
P&L Appropriation A/C
Opening balance 3,038 2,982 4,078 5,151 6,257
Net profit for the year 3,235 4,383 5,366 5,531 5,646
Gain from available for sale investments - - - - -
Dividend declared (3,291) (3,287) (4,292) (4,425) (4,234)
Transfer to statutory reserves - - - - -
Retained Earnings 2,982 4,078 5,151 6,257 7,669

Page 20 of 21 December 2011
Saudi Arabia Fertilizers Company
SAFCO - Balance Sheet Statement: FY10-14e
Source: SAFCO financial reports, AlJazira Capital
All figure in SAR Mn, unless specified 2010 2011E 2012E 2013E 2014E
Assets
Current Assets
Cash & equivalent 2,256 2,864 3,203 3,457 3,806
Account receivables, other receivable & prepayments
1,036 1,068 1,282 1,538 1,846
Inventories 345 414 456 524 603
Payment & other assets - 58 63 67 72
Securities & short term investment - - - - -
Total current assets 3,637 4,405 5,003 5,587 6,328
Non current & fixed assets
Intangible assets 147 103 108 114 120
Intangible and financial investments 1,269 1,333 1,666 1,999 2,399
Plant & property 3,243 3,457 3,607 3,807 4,088
Home ownership program receivables 82 33 36 40 44
Total non current & fixed assets 4,741 4,926 5,417 5,959 6,649
Total assets 8,379 9,331 10,420 11,546 12,977
Liabilities & Owners’ Equity
Current liabilities
Accounts P/A 315 459 470 482 494
Current installment of long term debt 193 80 80 80 80
Zakat provision 122 - - - -
Total Current liabilities 630 539 550 562 574
Non current liabilities
Long term debt 160 80 76 75 74
End of service indemnity 455 500 505 510 515
Other long-term liabilities - - - - -
Total non current liabilities 615 580 581 585 590
Total liabilities 1,245 1,119 1,131 1,148 1,164
Provisions - - - - -
Provisions & liabilities
Owners’ Equity
Share capital 2,500 2,500 2,500 2,500 2,500
Statuary reserves 1,250 1,250 1,250 1,250 1,250
General reserves 45 45 45 45 45
Unrealized gains from investments 357 339 342 346 349
Retained earnings 2,982 4,078 5,151 6,257 7,669
Total owners’ equity 7,134 8,212 9,289 10,398 11,813
Total liabilities & owners’ equity 8,379 9,331 10,420 11,546 12,977

Page 21 of 21 December 2011
Saudi Arabia Fertilizers Company
SAFCO - Cash Flow Statement: FY10-14e
Source: SAFCO financial reports, AlJazira Capital
All figure in SAR Mn, unless specified 2010 2011E 2012E 2013E 2014E
Operating cash flow
Income before zakat 3,296 4,465 5,447 5,616 5,732
Depreciation & amortization 299 450 488 532 584
Other cash flows from operations (670) (567) (777) (806) (836)
Change in Working Capital (490) (138) (248) (318) (379)
Net Cash from operating activities 2,435 4,211 4,910 5,024 5,101
Investing Cash flow
Addition to property. Plat & equipment (123) (664) (638) (733) (865)
Other investment activities 466 487 284 309 268
Cash Flows from Investing Activities 344 (178) (353) (424) (597)
Financing Cash flow
Dividend paid (3,250) (3,287) (4,292) (4,425) (4,234)
Repayment of term loans (237) (193) (4) (1) (1)
Other financing activities 56 78 80 81
Cash Flows from Financing Activities (3,487) (3,425) (4,218) (4,346) (4,154)
Increase/Decrease in Cash (709) 608 339 254 350
Cash Beginning Balance 2,964.5 2,255.9 2,864.2 3,202.9 3,456.7
Cash Ending Balance 2,256 2,864 3,203 3,457 3,806
Rating Terminology 1. Overweight: This rating implies that the stock is currently trading at a discount to its 12 months price target.
Stocks rated “Overweight” will typically provide an upside potential of over 10% from the current price levels over next twelve months.
2. Underweight: This rating implies that the stock is currently trading at a premium to its 12 months price target. Stocks rated “Underweight” would typically decline by over 10% from the current price levels over next twelve months.
3. Neutral: The rating implies that the stock is trading in the proximate range of its 12 months price target. Stocks rated “Neutral” is expected to stagnate within +/- 10% range from the current price levels over next twelve months.
4. Suspension of rating or rating on hold (SR/RH): This basically implies suspension of a rating pending further analysis of a material change in the fundamentals of the company.
COMPANY PROFILE
AlJazira Capital, the investment arm of Bank AlJazira, is a Shariaa Compliant Saudi Closed Joint Stock company and operating under the regulatory supervision of the Capital Market Authority. AlJazira Capital is licensed to conduct securities business in all securities business as authorized by CMA, including dealing, managing, arranging, advisory, and custody. AlJazira Capital is the continuation of a long success story in the Saudi Tadawul market, having occupied the market leadership position for several years. With an objective to maintain its market leadership position, AlJazira Capital is expanding its brokerage capabilities to offer further value-added services, brokerage across MENA and International markets, as well as offering a full suite of securities business.
For further queries about our special services, contact us at the toll free number 800 116 9999.

Disclaimer
The purpose of producing this report is to present a general view on the company/economic sector/economic subject under research, and not to recommend a buy/sell/hold for any security or any other assets. Based on that, this report does not take into consideration the specific financial position of every investor and/or his/her risk appetite in relation to investing in the security or any other assets, and hence, may not be suitable for all clients depending on their financial position and their ability and willingness to undertake risks. It is advised that every potential investor seek professional advice from several sources concerning investment decision and should study the impact of such decisions on his/her financial/legal/tax position and other concerns before getting into such investments or liquidate them partially or fully. The market of stocks, bonds, macroeconomic or microeconomic are of a volatile nature and could witness sudden changes without any prior warning, therefore, the investor in securities or other assets might face some unexpected risks and fluctuations. All the information, views and expectations and fair values or target prices contained in this report have been compiled or arrived at by AlJazira Capital from sources believed to be reliable, but AlJazira Capital has not independently verified the contents obtained from these sources and such information may be condensed or incomplete. Accordingly, no representation or warranty, express or implied, is made as to, and no reliance should be placed on the fairness, accuracy, completeness or correctness of the information and opinions contained in this report. AlJazira Capital shall not be liable for any loss as that may arise from the use of this report or its contents or otherwise arising in connection therewith. The past performance of any investment is not an indicator of future performance. Any financial projections, fair value estimates or price targets and statements regarding future prospects contained in this document may not be realized. The value of the security or any other assets or the return from them might increase or decrease. Any change in currency rates may have a positive or negative impact on the value/return on the stock or securities mentioned in the report. The investor might get an amount less than the amount invested in some cases. Some stocks or securities maybe, by nature, of low volume/trades or may become like that unexpectedly in special circumstances and this might increase the risk on the investor. Some fees might be levied on some investments in securities. This report has been written by professional employees in AlJazira Capital, and they undertake that neither them, nor their wives or children hold positions directly in any listed shares or securities contained in this report during the time of publication of this report. This report has been produced independently and separately and no party (in-house or outside) who might have interest whether direct or indirect have seen the contents of this report. It should be also noted that the Research Division of AlJazira Capital had no information at the time of issuing this report regarding any conflict of interest between the company/companies mentioned in this report and any members of the board / executives / employees of AlJazira Capital or any of Bank AlJazira Group companies. No part of this document may be reproduced whether inside or outside the Kingdom of Saudi Arabia without the written permission of AlJazira Capital. Persons who receive this document should make themselves aware, of and adhere to, any such restrictions. By accepting this document, the recipient agrees to be bound by the foregoing limitations.
Asset Management Brokerage Corporate Finance Custody Advisory
Head Office: Madinah Road, Mosadia، P.O. Box: 6277, Jeddah 21442, Saudi Arabia، Tel: 02 6692669 - Fax: 02 669 7761