SATRACK-REVIEW AND UPDATE · ceiver and wideband recorder that simultaneously re cover all the GPS...
9
R&DUPDATES ____________________________________________________ __ THOMAS THOMPSON SATRACK--REVIEW AND UPDATE Accurate evaluation of the trajectory (position and velocity) and error sources of Trident missiles is achieved with a system that makes use of the Global Positioning System satellite network. Signal handling, data reduction, operation, and performance of the SATRACK system are described. BACKGROUND Submarine-launched ballistic missiles are an im- portant part of the nation's strategic nuclear weapon capability. Because these weapons are intended to be a deterrent force, they achieve their design objective only if they are never used. However, if we are to have a truly effective weapon system, we must con- tinually evaluate its operation by means of periodic flight tests. We must carry out the tests under circum- stances that are as close to tactical as we can reason- ably arrange. Obviously, the measure of effectiveness includes factors other than those related strictly to accuracy (e.g., readiness, reliability), but the focus of this discussion will be on accuracy. Throughout the Polaris and Poseidon weapon sys- tem programs, accuracy evaluations were carried out by measuring actual "splash" positions relative to the intended splash positions in instrumented test areas. This method required a large number of test flights in order to give high statistical confidence. The Trident program, with its need for improved accuracy, required refinement in all areas of test and evaluation to obtain the desired assurance of system capability. The SATRACK system provides both in- strumentation and analytic improvements for accura- cy evaluation of test flights. SATRACK is an instrumentation and analysis sys- tem that provides trajectory determination and error- source identification of Trident missile flight tests. Trajectory determination is based on radio-fre- quency measurements between the test missile and four or more "in-view" satellites having precisely determined orbits. Comparison of this externally measured trajectory with the trajectory derived from the missile's guidance system gives the data necessary for identification of possible sources of weapon system error. The satellites are part of the Global Positioning System (GPS) that is to become the sys- tem for meeting all military space-based positioning requirements. Currently, a five-satellite constellation · is operational. Eventually, the GPS will include 18 to 24 satellites. 118 The SATRACK concept grew out of a series of meetings between the Space Department and the Strategic Systems Department at APL in early 1973. It seemed clear that the Navy would initiate an im- proved accuracy effort within the Trident frame-. work, with emphasis on an improved understanding of accuracy models. In response to the anticipated need, the SATRACK concept and rough estimates of its performance were presented to the Navy's Strate- gic Systems Projects Office in May 1973. As pro- posed, the system would have used a dedicated satel- lite constellation, but the development of the GPS program resulted in its becoming the satellite refer- ence in the final concept. As a result of the specific signal characteristics of the GPS satellites, this change led to some significant alterations of the orig- inal concept. Redirection to the use of the GPS oc- curred in mid-1974, and the changes in concept were developed by the end of 1974. Except for some small details, the concept as it was then defined is now operational. MEASUREMENT CONCEPT The measurement concept of SATRACK is illus- trated in Fig. 1. Radio signals from the GPS satellites are relayed by the missile to receiving equipment on two ships, one in the launch area and one in a down- range area. These ships also receive and record mis- sile telemetry and act as central sites for range-safety support. GPS transmissions provide measurements of the distance and velocity components along the paths be- tween the test missile and each in-view satellite. At an instant of missile flight (Fig. 1), the four in-view sat- ellites form the base of an inverted pyramid (the sat- ellites are at an altitude of approximately 11,000 miles) with the missile at the apex. I Since the position of each satellite (at the four corners of the base of the pyramid) is known, the position of the missile can be determined from the measured distance along each of the four satellite-to-missile paths. Similarly, a measurement of velocity along each of the paths pro- Johns Hopkins APL Technical Digest
Transcript of SATRACK-REVIEW AND UPDATE · ceiver and wideband recorder that simultaneously re cover all the GPS...
R&DUPDATES ____________________________________________________ __
THOMAS THOMPSON
SATRACK--REVIEW AND UPDATE
Accurate evaluation of the trajectory (position and velocity) and error sources of Trident missiles is achieved with a system that makes use of the Global Positioning System satellite network. Signal handling, data reduction, operation, and performance of the SA TRACK system are described.
BACKGROUND Submarine-launched ballistic missiles are an im
portant part of the nation's strategic nuclear weapon capability. Because these weapons are intended to be a deterrent force, they achieve their design objective only if they are never used. However, if we are to have a truly effective weapon system, we must continually evaluate its operation by means of periodic flight tests. We must carry out the tests under circumstances that are as close to tactical as we can reasonably arrange. Obviously, the measure of effectiveness includes factors other than those related strictly to accuracy (e.g., readiness, reliability), but the focus of this discussion will be on accuracy.
Throughout the Polaris and Poseidon weapon system programs, accuracy evaluations were carried out by measuring actual "splash" positions relative to the intended splash positions in instrumented test areas. This method required a large number of test flights in order to give high statistical confidence.
The Trident program, with its need for improved accuracy, required refinement in all areas of test and evaluation to obtain the desired assurance of system capability. The SA TRACK system provides both instrumentation and analytic improvements for accuracy evaluation of test flights.
SATRACK is an instrumentation and analysis system that provides trajectory determination and errorsource identification of Trident missile flight tests. Trajectory determination is based on radio-frequency measurements between the test missile and four or more "in-view" satellites having precisely determined orbits. Comparison of this externally measured trajectory with the trajectory derived from the missile's guidance system gives the data necessary for identification of possible sources of weapon system error. The satellites are part of the Global Positioning System (GPS) that is to become the system for meeting all military space-based positioning requirements. Currently, a five-satellite constellation ·is operational. Eventually, the GPS will include 18 to 24 satellites.
118
The SA TRACK concept grew out of a series of meetings between the Space Department and the Strategic Systems Department at APL in early 1973. It seemed clear that the Navy would initiate an improved accuracy effort within the Trident frame- . work, with emphasis on an improved understanding of accuracy models. In response to the anticipated need, the SA TRACK concept and rough estimates of its performance were presented to the Navy's Strategic Systems Projects Office in May 1973. As proposed, the system would have used a dedicated satellite constellation, but the development of the GPS program resulted in its becoming the satellite reference in the final concept. As a result of the specific signal characteristics of the GPS satellites, this change led to some significant alterations of the original concept. Redirection to the use of the GPS occurred in mid-1974, and the changes in concept were developed by the end of 1974. Except for some small details, the concept as it was then defined is now operational.
MEASUREMENT CONCEPT The measurement concept of SA TRACK is illus
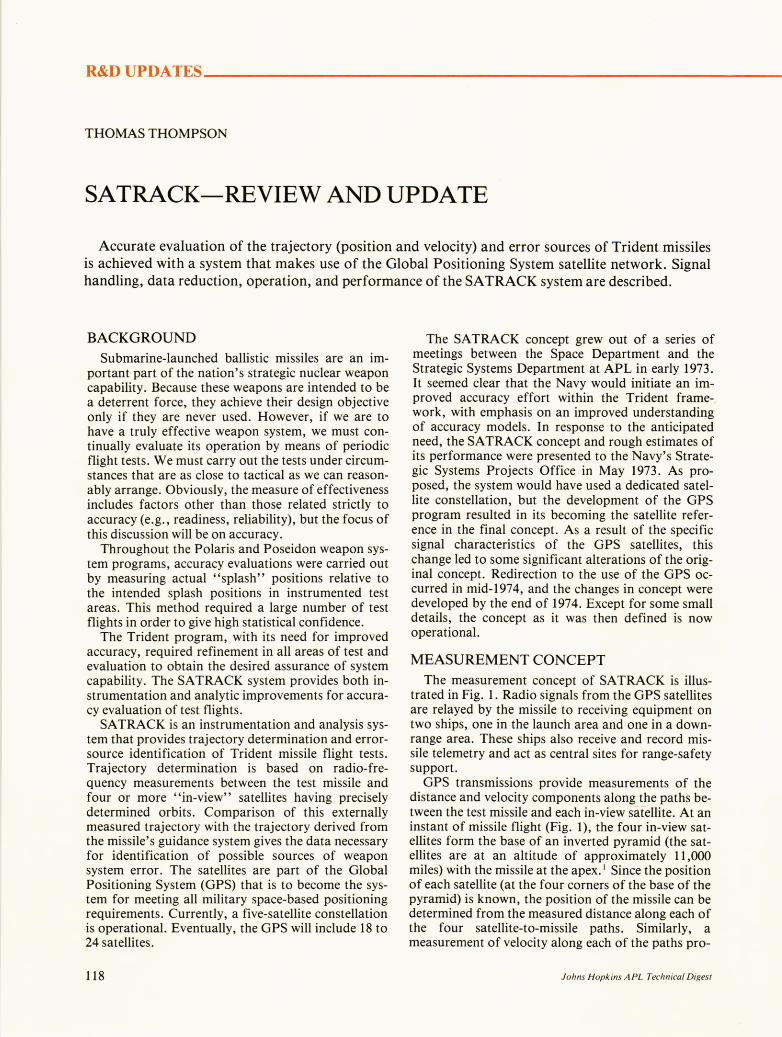
trated in Fig. 1. Radio signals from the GPS satellites are relayed by the missile to receiving equipment on two ships, one in the launch area and one in a downrange area. These ships also receive and record missile telemetry and act as central sites for range-safety support.
GPS transmissions provide measurements of the distance and velocity components along the paths between the test missile and each in-view satellite. At an instant of missile flight (Fig. 1), the four in-view satellites form the base of an inverted pyramid (the satellites are at an altitude of approximately 11,000 miles) with the missile at the apex. I Since the position of each satellite (at the four corners of the base of the pyramid) is known, the position of the missile can be determined from the measured distance along each of the four satellite-to-missile paths. Similarly, a measurement of velocity along each of the paths pro-
Johns Hopkins APL Technical Digest
¥ GPS satellites
I I
I I
I I
I
\/ciO
~~I'id\ Tride~ Downrange support ship
missit:t
,. "xj. t a
Launch-area support ship
Figure 1 - SATRACK measurement concept. Signals transmitted from the GPS satellites are received at the missile, translated to another frequency, and relayed to the two support ships where they are recorded for later processing at APL. At APL, the satellite-to-missile measurement data are combined with the known locations of the satellites to describe the missile test trajectory.
vides a basis for determining the missile velocity at each point in the flight trajectory.
Radar distance measurements are made by transmitting a pulse of radio energy and then listening for the return (echo) from a target. The time between transmission and return is then converted into distance to the target. GPS positioning, in contrast, is based on one-way transmissions. Each satellite transmits a pulse signal, and the time of receipt of each pulse is identified on the missile's "clock." Although the GPS synchronizes all satellite transmissions, there is no provision for synchronizing the missile clock with the satellite clocks. Therefore, the measurement of receipt time of the satellite signals on the missile clock cannot be directly converted to distance because of the missile's clock "error." However, the four time-of-arrival measurements allow a simultaneous computation of the three components of the missile position and the missile clock error.
Volume 4, Number 2, 1983
Because the satellites and the missile are all moving, the geometry is continually changing. If there are no errors in the measurements, the particular geometry is of no importance, but the effect of errors is amplified by a factor that depends on geometry. Consider defining the position of a point by three measurements of distance from an origin along each of three orthogonal axes. If the measurement uncertainty in each direction is the same, the uncertainty in positioning the point is properly described as a sphere whose center is the point indicated by the measurement, with a radius equal to the uncertainty in each measurement direction. However, if one of the measurement directions is changed from orthogonal, the uncertainty is no longer defined by a sphere but by a spheroid with its long axis orthogonal to the two unchanged directions. Therefore the volume of uncertainty is increased by moving one of the measurement directions from orthogonal. As all three directions become nonorthogonal, the measurement geometry is weakened further. The ratio of the actual volume of uncertainty to that of the sphere provides a quantitative description of the geometry weakness.
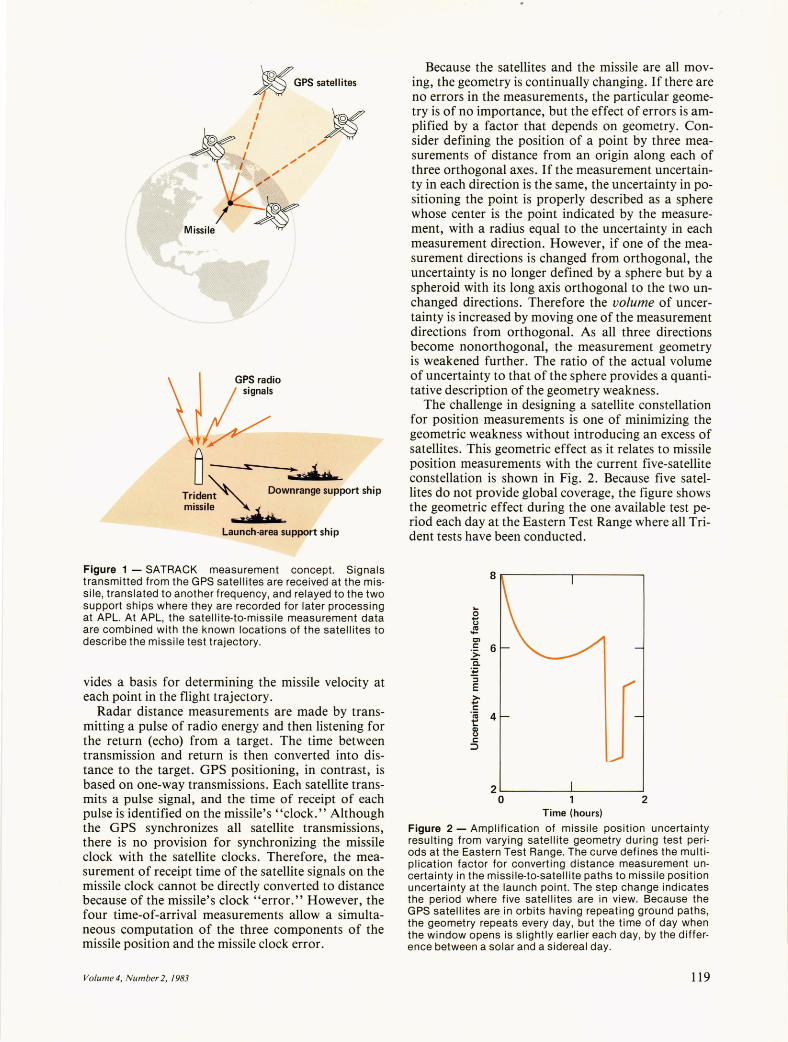
The challenge in designing a satellite constellation for position measurements is one of minimizing the geometric weakness without introducing an excess of satellites. This geometric effect as it relates to missile position measurements with the current five-satellite constellation is shown in Fig. 2. Because five satellites do not provide global coverage, the figure shows the geometric effect during the one available test period each day at the Eastern Test Range where all Trident tests have been conducted.
8r---------~------~
o .... CJ
~ Cl
.~ 6 a. .;; :; E >-.... c .~ 4
~ c :l J
2~------~~------~ o 2
Time (hours)
Figure 2 - Amplification of missile position uncertainty resulting from varying satellite geometry during test periods at the Eastern Test Range. The curve defines the multiplication factor for converting distance measurement uncertainty in the missile-to-satellite paths to missile position uncertainty at the launch point. The step change indicates the period where five satellites are in view. Because the GPS satellites are in orbits having repeating ground paths, the geometry repeats every day, but the time of day when the window opens is Slightly earlier each day, by the difference between a solar and a sidereal day.
119

T. Thompson - SA TRACK Instrumentation and Analysis System
To simplify the missile hardware, the SATRACK system is based on simply relaying satellite signals to the two support ships (see Fig. 1). The signals from a satellite as received at the missile are converted to a different frequency and retransmitted to the support ships. Therefore, the signals as received at the ships at a specific time have added propagation delays caused by the characteristics of the missile hardware and the missile-to-ship transmission path. However, each time-of-arrival measurement as noted on the ship clock at the received time has the same added propagation delay for each satellite signal relayed. Now, when the three time-of-arrival differences are formed, the ship clock error and the common delay error are cancelled, and the resulting differences are exactly equal to those that would have been observed at the missile. Thus, three equations can be formed based on three independent time-of-arrival differences that determine the three components of missile position without regard to an accurate knowledge of ship or missile time, missile hardware delays, or missile-to-ship path length. This technique greatly simplifies the processing system.
A similar situation applies to velocity measurements. What is actually measured by radio-frequency techniques is an accumulation of counts of cycles of the changes in received frequency over a time interval. Changes in frequency are produced by the relative velocity between transmitter and receiver (Doppler effect). If an oscillator frequency generated on the missile is mixed with a received satellite transmission frequency, a beat frequency equal to the difference of the two frequencies is created. Assuming the missile's oscillator frequency to be constant, the beat frequency depends on the relative velocity of the satellite and missile along the line joining them. A count (integration) of this beat frequency over some time interval gives a measure of the change in distance between the satellite and the missile during the interval.
However, the measurement also includes an unknown frequency because the missile's oscillator frequency is not precisely known. Whereas the distance measurement was corrupted by the missile's clock setting error, the velocity measurement is corrupted by its rate error. If differences of the count from two satellites are formed, the common rate error is removed, and three such differences provide the three components of missile velocity. This measurement is also accomplished relative to the ship's oscillator frequency in the same manner as the time-of-arrival differences. The count differences thus formed are again equivalent to those that would be observed on the missile.
While the frequency measurements provide a basis for velocity determination, they are not truly measurements of velocity. The Doppler counts are an integration of the velocity effect and are therefore actually measurements of the change in distance between the transmitter and receiver during the measurement interval. That change divided by the time interval represents an average velocity during the interval.
120
More precisely, the measurement provides an average of a component of missile velocity in the direction of the radio signal.
The process of recovering the measurement data used for determination of the missile trajectory is not actually accomplished on the support ships. Again, for simplicity, the ships are equipped with a single receiver and wideband recorder that simultaneously recover all the GPS signals without separating the multiple satellite signals or making detailed measurements of the signals. The process of recovering signal data is accomplished at an APL processing center by replaying the tapes recorded on the support ships. Before the data reduction aspects of the system are considered, it is helpful to discuss the signal handling characteristics.
SIGNAL HANDLING GPS satellites transmit signals at 1575.42 mega
hertz (defined as the L J signal) and at 1227.60 megahertz (defined as the L 2 signal). The two signals are coherent, being 154 and 120 times 10.23 megahertz, respectively. Both signals are modulated by a digital code sequence that has a clock rate of 10.23 megahertz, defined as the P code (meaning protected code). The modulation is applied by shifting the carrier signal phase ± 90 0 in response to the two states of the modulating code. The bandwidth required to transmit or relay the P code signals is twice the code clock rate or 20.46 megahertz. This bandwidth was not compatible with the SA TRACK design constraints; therefore, an auxiliary signal normally used for acquisition, designated C/ A code (meaning clear/acquisition code), is the primary SATRACK signal. This signal is also transmitted on the L
J car
rier as ± 90 0 phase modulation, but the clock rate is 1.023 megahertz and the modulation is added in quadrature to the P code. The nature of the signals is such that the P and C/ A components of the L J transmission can be treated as completely independent signals. Finally, the satellites transmit one additional modulation for broadcasting digital data. This modulation, at a rate of 50 bits per second, is added by phase-inverting the code modulation in response to the two states of the digital data.
The code and data modulations are synchronized so that there are fixed time relationships (e.g., there will always be 20,460 C/ A-code bits per data bit). This data modulation is added to all the code modulations and contains data that define the satellite position and clock characteristics for normal navigation users and satellite health and status information.
Figure 3 shows the transmission spectrum for the L J -C/ A signal, which is the only signal of interest to SATRACK operation. The code modulation produces a signal spectrum that has an envelope,
(1)
Johns Hopkins A PL Technical Digest

T. Thompson - SA TRACK Instrumentation and Analysis System
L,-1.023MHz L, + 1.023 MHz
Figure 3 - L1-C/A signal transmission spectrum. The CIA code modulates the L1 frequency by shifting its phase ± 90 0 in response to the two code states. As a result, the carrier signal at L1 is fully suppressed, and a line spectrum is produced with the envelope and line spacing shown. The peak amplitude of the spectral lines is about 30 deci bels below the unmodulated carrier power.
where
W e = 27rle (2)
and Ie is the code clock rate (i.e., 1.023 megahertz) . Spectral lines within the envelope are separated by a frequency of (lITe) where Te is the code period. In this case the code period is 1 millisecond and consists of 1023 bits (i.e., the number of 1.023-megahertz clock cycles produced in 1 millisecond). It is the nature of the code used (each satellite has a different code sequence) that the peak amplitude of the resulting line spectrum is approximately equal to 1/1000 of the total signal power and that the line component at the center of the spectrum (i.e., the unmodulated carrier location) is totally suppressed. The first null in the spectrum is at ± 1.023 megahertz from the carrier location, and the region between the first nulls contains about 900/0 of the total power. Therefore, the transmission bandwidth is normally considered to be 2.046 megahertz. The code is a unique sequence of "1 's" and "O's," with each code bit setting the carrier phase for 978 nanoseconds (ll Ie). A specific I-to-O transition between two of the 1023 code bits (Le., specific code phase) is used to identify uniquely the I-millisecond "tick" of the satellite clock. Recovery of the 50-bit-per-second data provides identification of the time of day of each I-millisecond tick. Therefore, this modulation is used to identify when a specific code phase state (i.e., signal wave front) was transmitted by the satellite. Identification of the time of arrival of that same wave front at a receiver location in satellite clock time would provide the data necessary for a distance measurement. The distance would simply be equal to the difference between the time of arrival and the determined time of transmission, multiplied by the speed of light. How-
GPS signals
, Mi,ss_ile __ -,
7
Vo{ume4, Number 2, 1983
Filter/amplifier
ever, as noted previously, the time of arrival is normally measured relative to a receiver clock that is not synchronized with satellite time, and therefore the total measurement process must include a method for computing or removing a receiver clock error.
It is now necessary to consider the nature of the signal process at the missile. The power density of the L]-C/A signal at the missile is approximately 10 - ]4 watt per square meter (i.e., -130 dBm into zerodecibel gain antenna). The missile antenna is made up of a number of elements equally spaced around the circumference of the missile in an attempt to achieve omnidirectional characteristics. The actual design has variable gain from 0 decibel (ideal omnidirectional) to very low values in null regions. 2 An average gain of about - 7 decibels is typical; therefore, the power level at the input to the first signal amplifier in the missile hardware is about - 137 dBm. Remembering the nature of the transmitted spectra, the peak spectral line is - 167 dBm. The noise power density at the input amplifier is about - 170 dBm per hertz. The noise power in the 2-megahertz bandpass is therefore - 107 dBm, which is 30 decibels higher than the total satellite signal power. That is, the signal-to-noise ratio (SNR) in the 2-megahertz missile amplifier bandwidth is - 30 decibels (i.e., the noise power is 1000 times the signal power). As noted previously, the missile hardware converts this noise spectrum to a different output frequency (at approximately 2250 megahertz) and transmits the converted signal. Note that the satellite signals from all satellites are summed with the missile thermal noise in the missile hardware.
Figure 4 shows how the GPS signals are relayed by the missile hardware. Each of the satellite signals (Si ) is received, amplified, and converted to an output frequency of L] + Klo. Actually, the received L] frequency will have a Doppler component so that the actual output frequency for the ith satellite is
(3)
where Pi is the rate of change of distance (i.e., range rate) between the ith satellite and the missile. The input power to the first missile amplifier consists of the combined power of the satellite signals and the missile noise power (N m ). The missile electronics (called a translator in SA TRACK terminology) is designed to have a constant output power, making its gain a
Ship
Figure 4 - Satellite Signal relay. Satellite signals are received by the missile L1 antenna, amplified, and converted by mixing with a frequency Kfo. The upper sideband at L1 + Kfo is filtered and amplified for transmission. The relayed signal is finally received at the support ship where the signal data are recorded.
121
T. Thompson - SA TRACK Instrumentation and Analysis System
function of the input power. However, as noted pre- converter is connected to a sampled zero-crossing de-viously, the input power is dominated by N m ; there- tector. At each sample time, the zero-crossing detec-fore, the missile hardware signal gain (Km) is essen- tors provide a measure of the sign of the noise-like tially constant. The output signal can be expressed as signal. The resulting I-bit samples for each phase are
5
So = Km (E Si + N m) . i = 1
(4)
The signals as received at the ship are again Doppler shifted so that each signal received at the ship can be expressed as
P; ) (5)
where Po is the missile-to-ship range rate. The signal power as received at the first amplifier of the ship's receiver system is reduced by a factor equal to the signal dispersion loss multiplied by the area of the receiving antenna. Letting the product of this factor and the missile hardware gain Km be identified as K~ , the power input to the ship receiver is
5
Sr = Ks (E Si + N m ) (6) i= 1
The receiver noise (NR ) is now also added to the received signal. Therefore, the SNR at the output of the translator receiver process is
Thus, for each value of i, if KsN m (i.e., the missile noise power received at the ship) is much larger than NR (the receiver's own noise), then the output SNRi
is nearly equal to its value at the translator input (i.e., Si I N m ) . The appropriate missile output power is selected so that the actual degradation for this factor does not exceed I decibel.
Establishing the necessary power for this condition was one of the reasons fornot using the P-code signals in the SATRACK system. The receiver thermal noise power, like that of the missile, is directly proportional to the receiver bandwidth; that is, the noise is "white." Therefore reception of a P-code signal would require the received missile noise power (i.e., KsN m) to be 10 times as great as that required for the CIA bandwidth. The current translator output power is approximately 5 watts; to use the P-code signal, the translator output power would need to be 50 watts.
The ship hardware converts the received signal to a center frequency of 120-kilohertz while preserving the 2-megahertz bandwidth. The 120-kilohertz frequency was selected to avoid having the carrier signal pass through zero as a result of Doppler effects. Conversion is actually done with two converters having a quadrature phase relationship. The output of each
122
then recorded. The sampling rate for this process is 4 megabits per second. Timing information is also recorded to allow proper data synchronization on playback.
DATA REDUCTION The first step in reducing the data is to separate
and follow the signals from the different satellites. We remember that each satellite has a separate code that consists of a pattern of 90 0 phase shifts. We generate a replica of the code for a particular satellite and shift it in time until it can be correlated with a received pattern. When the correlation is a maximum, we have found the time of arrival of a satellite timing signal. This separation and tracking of all satellite signals can be carried out in parallel on playback of the digital tape recorded on the ship. The signal-tonoise improvement provided by this tracking process is essentially equal to the ratio of the tracking loop bandwidth to that of the transmitted bandwidth, or about 60 decibels. Therefore, the - 30-decibel signalto-noise ratio at the shipboard receiver is finally increased to plus 30 decibels at the output of the signal tracking process.
The second function of the correlation process is to reconstruct the carrier signal. This signal is then tracked in a phase-locked loop by slaving a replica carrier generated by the receiver to have its phase aligned with the reconstructed carrier. A secondorder phase-locked loop with a 10-hertz bandwidth is used for carrier tracking.
Time-of-arrival data and Doppler count data for each satellite are recorded at the output of the receiver process at 10 samples per second. The data are then corrected for a number of systematic effects that are computed separately, and the corrected data are passed on to the final missile system processor, which is a traditional Kalman filter, as shown in Fig. 5.
The missile guidance model begins with an initial estimate of its guidance parameters and the uncertainty in those parameters, along with an estimate of the missile initial conditions. Using these data and the missile accelerometer measurements (recovered by telemetry), a model for the missile motion computes the velocity and position of the missile as a function of time. The computed missile trajectory, along with satellite trajectories, is used to compute the expected SA TRACK measurement data for the corresponding interval. The estimated and measured data are then compared, and the differences (residuals) are sent to the filter. The filter then adjusts the various parameters in the model, including the initial conditions, in a way that reduces the residuals. We can choose not to adjust some parameters if we feel they are known well enough; for example, we do not usually adjust the parameters of the satellite orbits. When the residuals are reduced as far as possi-
Johns Hopkins APL Technical Digest

T. Thompson - SA TRACK Instrumentation and Analysis System
Missile accelerations
Satellite trajectories
SATRACK measurements
I nitial conditions
Missile trajectory estimate
SATRACK measurement estimate
Measurement residual
Smoothed initial conditions
Model updates
Figure 5 - SATRACK processing concept. Acceleration data from the missile's guidance system are integrated from the submarine's indication of initial conditions to produce an estimated missile trajectory. This trajectory and the satellite trajectories provided by processing of satellite ground station data are combined in the tracking model to provide estimates of the SATRACK measurements. The estimates are then subtracted from the actual SATRACK measurement data to produce the residuals. Finally, the filter uses the residuals to refine the estimation of the parameters needed to calculate the trajectory and refine the initial conditions.
ble, we have the best estimate of the parameters and initial conditions. From this, we can estimate the contribution of each individual error source to the total system error for each flight.
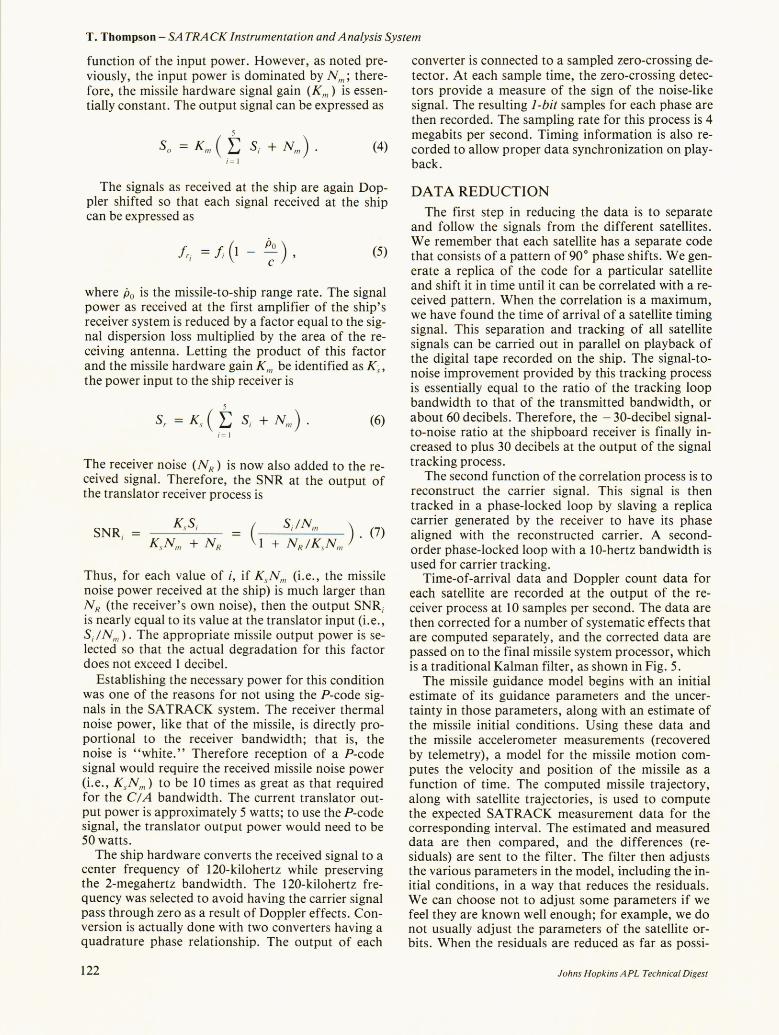
Consider the hypothetical flight test result shown in Fig. 6. This vector diagram describes the SATRACK estimate of error contributions as they might be displayed for an inertially guided missile flight test. The errors are shown as two-dimensional vectors (downrange and crossrange) representing their contribution to impact miss . The origin represents the aim point for the particular reentry body impact being analyzed. The major error groups are those associated with initial conditions, guidance, and another group that contains all known deterministic corrections and such factors as aerodynamic effects that are needed to compute the missile trajectory to impact. An uncertainty ellipse is shown for each of the major error groups. The contribution from the initial conditions is broken down into position, velocity, and orientation contributions; each of these can
Volume 4, N umber 2, 1983
be further reduced to individual components such as errors in latitude, longitude, and launch depth. Similarly, the guidance contribution is broken down into accelerometer and gyro errors that can be further reduced to single error components. The impact point calculated from the best estimates of the system parameters provides a consistency check against the independently measured point. The difference between these two measurements is tested for reasonableness on all tests.
Processed data from each flight test are passed on for further accuracy evaluation. The data from all the flight tests are evaluated and combined with other relevant data to complete the evaluation of the system.
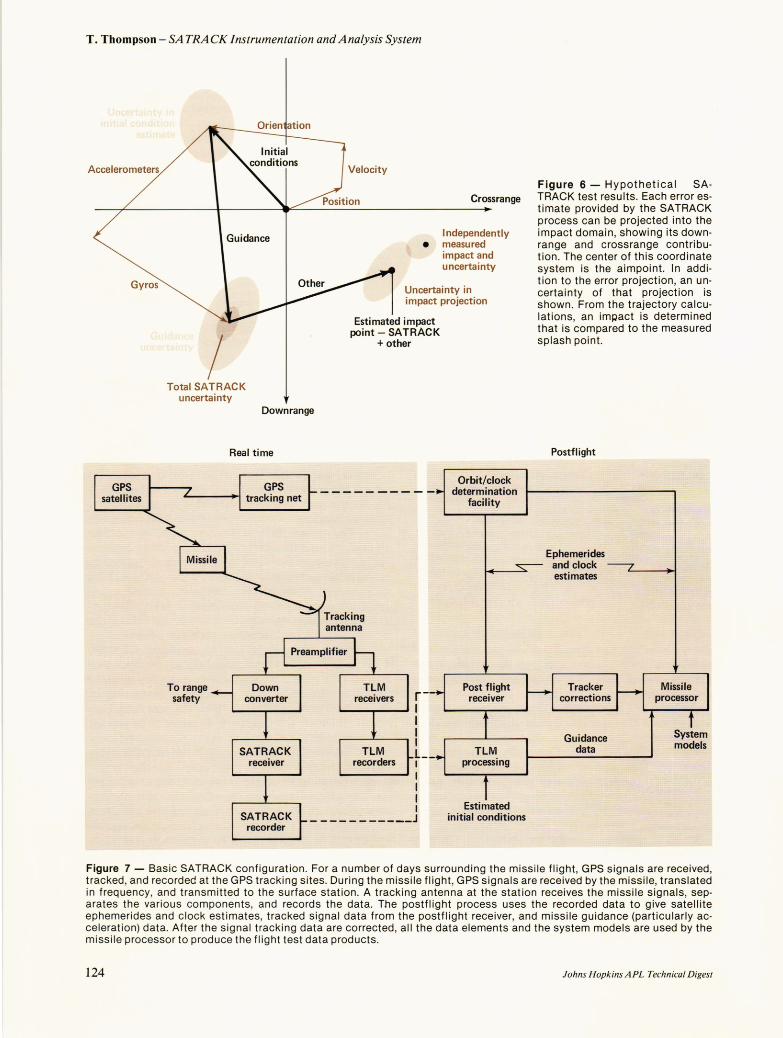
SUMMARY OF SYSTEM OPERATION Basic operating principles of the system are shown
in Fig. 7. The Global Positioning System (GPS) satellites transmit navigation signals that are tracked by the GPS tracking network and relayed by the missile. Satellite tracking data are collected for a period of six or more days, centered on the missile flight time. The orbit determination facility at the Naval Surface Weapons Center in Dahlgren, Va., uses these data to provide a posteriori satellite ephemerides to the SA TRACK processing facility.
During the missile flight time, satellite signals received at the missile are shifted upward in frequency by mixing with a missile oscillator frequency (i.e., upconverted) and then relayed to the data collection sites. The missile GPS antenna receives the satellite signals, and the translator shifts the received 2-megahertz signal spectrum into a new 2-megahertz region in the allocated missile telemetry band (2200 to 2300 megahertz). Actually the translator output signal spectrum contains three components: (a) a pilot carrier signal whose frequency is a direct multiple of the missile's oscillator frequency used for upconverting the received GPS signal; (b) the translated GPS signals; and (c) a second translated signal spectrum that is primarily used for range safety purposes but also provides data to support ionospheric correction of the primary GPS tracking signals. The translator output is allocated a 9-megahertz bandwidth to include the three signal spectra and appropriate margins to avoid interference with the other missile telemetry signals. The translator output signals are then transmitted through the common missile telemetry antenna. Translator signals are recovered with other telemetry signals by the tracking antenna at the collection site. A common wideband preamplifier passes signals to the telemetry system and to a common down converter (i.e., the signal spectrum is again translated, but now to a lower frequency of about 30 megahertz) that is used for the missile translator signals. SATRACK signals are further downconverted, sampled in the SA TRACK receiver, and then recorded. In a typical operational test, the two support ships will collect data from several missiles simultaneously.
123
T. Thompson - SA TRACK Instrumentation and Analysis System
Accelerometers
Guidance
/ Total SATRACK
uncertainty Downrange
Real time
To range safety
Crossrange
Independently • measured
impact and uncertainty
Uncertainty in impact projection
Estimated impact point - SATRACK
+ other
Orbit/clock determination
facility
Estimated initial conditions
Figure 6 - Hypothetical SATRACK test results. Each error estimate provided by the SATRACK process can be projected into the impact domain, showing its downrange and crossrange contribution. The center of this coordinate system is the aimpoint. In addition to the error projection, an uncertainty of that projection is shown. From the trajectory calculations, an im~act is determined that is compared to the measured splash point.
Postflight
Ephemerides and clock estimates
Guidance data
Figure 7 - Basic SATRACK configuration. For a number of days surrounding the missile flight, GPS signals are received, tracked, and recorded at the GPS tracking sites. During the missile flight, GPS signals are received by the missile, translated in frequency, and transmitted to the surface station. A tracking antenna at the station receives the missile signals, separates the various components, and records the data. The postflight process uses the recorded data to give satellite ephemerides and clock estimates, tracked signal data from the postflight receiver, and missile guidance (particularly acceleration) data. After the Signal tracking data are corrected, all the data elements and the system models are used by the missile processor to produce the flight test data products.
124 Johns Hopkins APL Technical Digest
T. Thompson - SA TRACK Instrumentation and Analysis System
After the data tapes have been returned to the postflight processing facility, the missile acceleration history (provided by telemetry) is integrated from the estimated initial condition to provide a guidance-derived missile trajectory. The trajectory, along with the satellite ephemerides, is used to develop tracking aids for pilot carrier tracking. The pilot carrier tracking data are then used to correct the tracking aids, that is, to remove the missile oscillator variations from the translated signals. Finally, the adjusted tracking aids are used to aid the tracking of GPS signals. The tracking aids are needed to accomplish the narrowband tracking of the GPS signals.
After the tracking data are recovered, tracking data corrections are applied. Included are corrections for the estimated ionospheric and tropospheric effects, antenna interferometry and offset effects (i.e., displacement of antennas from the guidance reference position), and relativity effects. The corrected tracking data are passed to the final postflight processor (see Fig. 5) where the satellite-to-satellite differences are formed and used to estimate the missile trajectory and the initial conditions and guidance error estimates. Results of the flight test processing are then passed on to the the accuracy evaluation task and reported in a SA TRACK flight test report.
SYSTEM PERFORMANCE SAT RACK was first tested in one of the Trident I
flight tests launched from Cape Kennedy in June 1978. The test produced only limited data, but the process used for GPS signal recovery was demonstrated. In August 1978, the second flight test resulted in sufficient data from the two available GPS satellites to demonstrate the full processing system. Since the third test, when three GPS satellites were first available, SA TRACK has been used routinely for system evaluation. Results of the early Cape Kennedy and submarine-launched test flights have been reported previously. Since then there have been some model refinements, some of the earlier flight tests have been reprocessed, and additional flight tests have been processed.
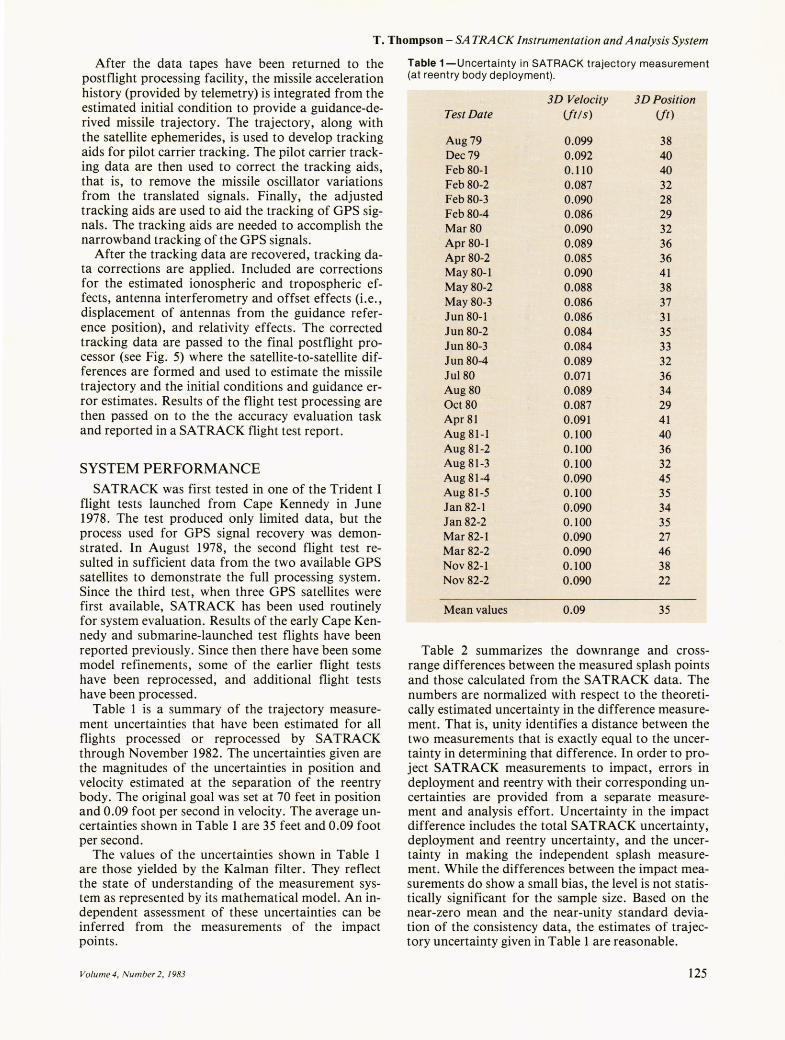
Table 1 is a summary of the trajectory measurement uncertainties that have been estimated for all flights processed or reprocessed by SATRACK through November 1982. The uncertainties given are the magnitudes of the uncertainties in position and velocity estimated at the separation of the reentry body. The original goal was set at 70 feet in position and 0.09 foot per second in velocity. The average uncertainties shown in Table 1 are 35 feet and 0.09 foot per second.
The values of the uncertainties shown in Table 1 are those yielded by the Kalman filter. They reflect the state of understanding of the measurement system as represented by its mathematical model. An independent assessment of these uncertainties can be inferred from the measurements of the impact points.
Volume 4, Number 2, 1983
Table 1-Uncertainty in SATRACK trajectory measurement (at reentry body deployment).
3D Velocity 3D Position Test Date (jt/s) (jf)
Aug 79 0.099 38 Dec 79 0.092 40 Feb 80-1 0.110 40 Feb 80-2 0.087 32 Feb 80-3 0.090 28 Feb 80-4 0.086 29 Mar 80 0.090 32 Apr 80-1 0.089 36 Apr 80-2 0.085 36 May 80-1 0.090 41 May 80-2 0.088 38 May 80-3 0.086 37 Jun 80-1 0.086 31 Jun 80-2 0.084 35 Jun 80-3 0.084 33 Jun 80-4 0.089 32 Jul80 0.071 36 Aug 80 0.089 34 Oct 80 0.087 29 Apr81 0.091 41 Aug 81-1 0.100 40 Aug 81-2 0.100 36 Aug 81-3 0.100 32 Aug 81-4 0.090 45 Aug81-5 0.100 35 Jan 82-1 0.090 34 Jan 82-2 0.100 35 Mar 82-1 0.090 27 Mar 82-2 0.090 46 Nov 82-1 0.100 38 Nov 82-2 0.090 22
Mean values 0.09 35
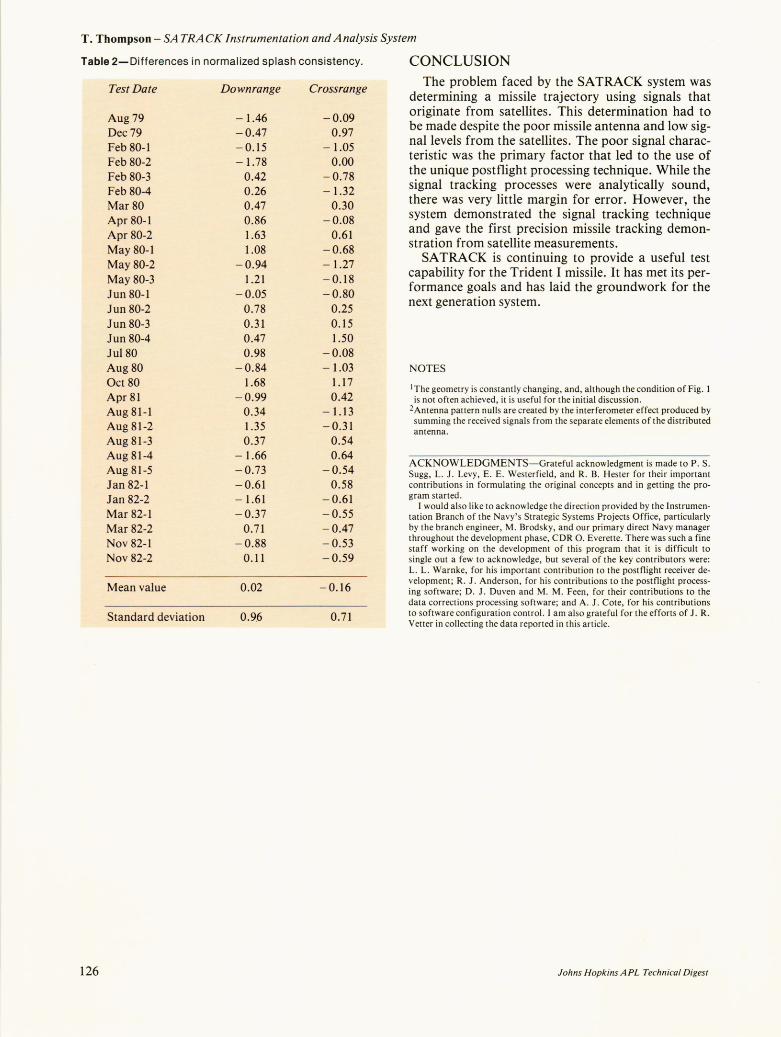
Table 2 summarizes the downrange and crossrange differences between the measured splash points and those calculated from the SATRACK data. The numbers are normalized with respect to the theoretically estimated uncertainty in the difference measurement. That is, unity identifies a distance between the two measurements that is exactly equal to the uncertainty in determining that difference. In order to project SATRACK measurements to impact, errors in deployment and reentry with their corresponding uncertainties are provided from a separate measurement and analysis effort. Uncertainty in the impact difference includes the total SAT RACK uncertainty, deployment and reentry uncertainty, and the uncertainty in making the independent splash measurement. While the differences between the impact measurements do show a small bias, the level is not statistically significant for the sample size. Based on the near-zero mean and the near-unity standard deviation of the consistency data, the estimates of trajectory uncertainty given in Table 1 are reasonable.
125
T. Thompson - SA TRACK Instrumentation and Analysis System
Table 2-Differences in normalized splash consistency.
Test Date Downrange Crossrange
Aug 79 -1.46 -0.09 Dec 79 -0.47 0.97 Feb 80-1 -0.15 -1.05 Feb 80-2 -1.78 0.00 Feb 80-3 0.42 -0.78 Feb 80-4 0.26 -1.32 Mar 80 0.47 0.30 Apr 80-1 0.86 -0.08 Apr 80-2 1.63 0.61 May 80-1 1.08 -0.68 May 80-2 -0.94 -1.27 May 80-3 1.21 -0.18 Jun 80-1 -0.05 -0.80 Jun 80-2 0.78 0.25 Jun 80-3 0.31 0.15 Jun 80-4 0.47 1.50 Jul80 0.98 -0.08 Aug 80 -0.84 -1.03 Oct 80 1.68 1.17 Apr 81 -0.99 0.42 Aug81-1 0.34 -1.13 Aug 81-2 1.35 -0.31 Aug 81-3 0.37 0.54 Aug 81-4 -1.66 0.64 Aug 81-5 -0.73 -0.54 Jan 82-1 -0.61 0.58 Jan 82-2 -1.61 -0.61 Mar 82-1 -0.37 - 0.55 Mar 82-2 0.71 -0.47 Nov 82-1 -0.88 -0.53 Nov 82-2 0.11 -0.59
Mean value 0.02 - 0.16
Standard deviation 0.96 0.71
126
CONCLUSION The problem faced by the SATRACK system was
determining a missile trajectory using signals that originate from satellites. This determination had to be made despite the poor missile antenna and low signallevels from the satellites. The poor signal characteristic was the primary factor that led to the use of the unique postflight processing technique. While the signal tracking processes were analytically sound, there was very little margin for error. However, the system demonstrated the signal tracking technique and gave the first precision missile tracking demonstration from satellite measurements.
SATRACK is continuing to provide a useful test capability for the Trident I missile. It has met its performance goals and has laid the groundwork for the next generation system.
NOTES
I The geometry is constantly changing, and, although the condition of Fig. 1 is not often achieved, it is useful for the initial discussion.
2Antenna pattern nulls are created by the interferometer effect produced by summing the received signals from the separate elements of the distributed antenna.
ACKNOWLEDGMENTS-Grateful acknowledgment is made to P . S. Sugg, L. J. Levy, E. E. Westerfield, and R. B. Hester for their important contributions in formulating the original concepts and in getting the program started.
I would also like to acknowledge the direction provided by the Instrumentation Branch of the Navy 's Strategic Systems Projects Office, particularly by the branch engineer, M. Brodsky, and our primary direct Navy manager throughout the development phase, CDR O. Everette. There was such a fine staff working on the development of this program that it is difficult to single out a few to acknowledge, but several of the key contributors were: L. L. Warnke, for his important contribution to the postflight receiver development; R. J. Anderson, for his contributions to the postflight processing software; D. J. Duven and M. M. Feen, for their contributions to the data corrections processing software; and A. J. Cote, for his contributions to software configuration control. I am also grateful for the efforts of J . R. Vetter in collecting the data reported in this article .
Johns Hopkins APL Technical Digest