Sato Staff Paper Final all pages - UW Center for Cooperatives Papers/staff05.pdf · Milk Marketing...
20
University of Wisconsin Center for Cooperatives 230 Taylor Hall, 427 Lorch Street Madison, Wisconsin 53706-1503 Ph. 608. 262.3981 Fax 608.262.3251 www.wisc.edu/uwcc Family Dairy Farms Under Structural Change In the United States By Kazuko Sato UWCC Staff Paper No. 5 March 2005 STAFF PAPER
Transcript of Sato Staff Paper Final all pages - UW Center for Cooperatives Papers/staff05.pdf · Milk Marketing...

University of Wisconsin Center for Cooperatives230 Taylor Hall, 427 Lorch Street Madison, Wisconsin 53706-1503
Ph. 608. 262.3981 Fax 608.262.3251www.wisc.edu/uwcc
Family Dairy FarmsUnder Structural Change
In the United StatesBy
Kazuko Sato
UWCC Staff Paper No. 5 March 2005
STAFF PAPER

Family Dairy Farms
Under Structural Change in the United States By Kazuko Sato
A Note from the Author
This report was originally written in Japanese and attempted to provide Japanese researchers a picture of the current
dairy situation in Wisconsin. It was published in April 2004 as a chapter of the book “Family Farms and Farmer
Cooperatives under Structural Change”(edited by Takeshi Murata, published by Tukuba Shobo, Tokyo).
This English version is targeted to those who are involved in the U.S. dairy industry. As such, this text summarizes
and omits sections of the earlier (Japanese) version which would be redundant to those more familiar with dairy
production in the United States.
I want to express my appreciation to the University of Wisconsin Center for Cooperatives for hosting my stay, and
to Robert Cropp, Anne Reynolds, and Kim Zeuli for their comments on this paper. My thanks also go to the farmers
who hosted my visits to their dairy operations, and to the Wisconsin co-ops I visited and their helpful staff,
including Joan Behr, David Lohr, and Laura Mihm from Foremost Farms USA, and Joe Pedretti from the Coulee
Region Organic Producer Pool. Finally, I am grateful for the assistance of Vicky Chaput and Maura Schwartz, both
of the Minnesota Association of Cooperatives, and Dan Stowe, of Midwest Coach, Inc.; this study would not have
been possible without their efforts.
Kazuko Sato, Assistant Professor
Seminar for Agricultural Policy
Department of Agricultural and Resource Economics
Faculty of Agriculture, Kyushu University
Fukuoka City, 812-8581 JAPAN
Email [email protected]
____________________________________________________________________
Any opinions, findings, conclusions, or recommendations expressed in this publication are those of the
author and do not necessarily reflect the views of the University of Wisconsin Center for Cooperatives.
Comments on the Paper
This paper’s author, Kazuko Sato, is an assistant professor with the Laboratory of Agricultural Policy and the
Department of Agricultural and Natural Resources, Kyushu University, Fukuoka City, Japan. This paper is based
on research she conducted during her stay as a visiting scholar with the University of Wisconsin Center for
Cooperatives, in February and March 2004.
The paper addresses the present and future economic status of what Professor Sato calls mid-size Wisconsin dairy
farms (100-200 milk cows) as compared to large-scale dairy farms (400 or more milk cows). This economic status
is discussed under the environment of changing U.S. dairy policy and the role of dairy cooperatives.
The information and data for the paper regarding U.S. dairy policy, Wisconsin and U.S. dairy cooperatives, and the
economic status of Wisconsin dairy farms were obtained via library research and interviews Professor Sato
conducted with staff from the University of Wisconsin Center for Cooperatives, with other UW-Madison faculty,
with management personnel from some of the state’s dairy cooperatives, and with dairy farmers who were also
members of a dairy cooperative.
The results and conclusions are those of Professor Sato; they appear to accurately assess the general economic
status of Wisconsin dairy farms and to detail how dairy farmers value dairy cooperatives. However, the farm milk
price received by large-scale dairy farms, as reported here, appears to be low for year 2002. While milk prices were
depressed during 2002, in general the average net milk price for the year for large dairy farmers would have been
about $1.00 per hundredweight higher than that reported by Professor Sato. (Perhaps the milk price she noted was
actually the lowest monthly price received during year 2002.) Nevertheless, the report does reflect the economic
differences between mid-size and large Wisconsin dairy farmers.
Bob Cropp, Interim Director
University of Wisconsin Center for Cooperatives
1. Introduction
The United States ended their quota restriction of dairy product imports and replaced them with tariff
restrictions during the GATT meetings in Uruguay. With the 1996 Farm Bill, the U.S. government planned to repeal
the Milk Price Support Program (MPSP: price support for manufacturing milk) in 1999, but requested that the
United States Department of Agriculture review the provisions of Federal Milk Marketing Orders. In sum, these
efforts were an attempt to help manufacturing milk become more competitive in the international market.
Meanwhile, the policies to protect fluid milk were to continue as before. This transformation of dairy policy took
place against a complex backdrop: a declining number of both dairy farms and small farms (dairy and non-dairy),
an increase in the formation of mega-dairy farms, and an environment of high prices for dairy products in the
international market. Projections at the time suggested that the U.S. could raise their share of the international dairy
market.
Conversely, the Farm Security and Rural Investment Act of 2002 (2002 Farm Bill), re-established the U.S.
dairy policy protection of price supports. First, price supports for manufacturing milk through Milk Price Support
Program (MPSP) -- which the U.S. government had tried to repeal in 1999 -- was continued through December 31,
2007. This policy change reflected in part the fact that the share of U.S. dairy products in the international market
had not increased as much as had been hoped. While international prices for dairy products had peaked in 1995,
they began to decline after that. As a result, the U.S. export fewer dairy products than had been expected.
Meanwhile, the domestic price of manufacturing milk had dropped to a level at or below the price support level
($9.90/cwt.).
Second, the 2002 Farm Bill created a new and innovative National Milk Income Loss Contract (MILC)
Program as a means to provide countercyclical payments to dairy farmers when milk prices fall below a target price
level. This payment is limited to 2.4 million cwt./farm; small- and mid-size farms with fewer than 135 milking
cows may receive full payment when milk yield is estimated at 17,600lb/cow per year. This payment can be
described as being oriented towards small and mid-size farms.

What dairy structure is the background for this policy change in the U.S.? In the mid-1980s, a full report of
the changing U.S. dairy structure was published in Japan [Ozawa1984]. The report mentioned the rise of large
corporation farms in new dairy production areas, especially California, and pondered whether production in
traditional dairy areas could be continued. Today, 20 years after the report, small- and mid-size farms in California
are nearly nonexistent, and mega-size farms have raised the state’s overall milk production. Indeed, milk production
in California is the highest of any state in the U.S. Meanwhile, in Wisconsin, once considered the nation’s dominant
traditional dairy state, mid-size farms are getting bigger gradually. At the same time mega-farms—or those with
1,000 milk cows—have appeared, but are relatively few in number.
This paper attempts to describe the conditions affecting the survival of the family dairy farm, and analyzes
the restructuring of dairy cooperatives in the Midwest, along with the increasing emergence of mid-size dairy farms
in Wisconsin.
2. The Changing Dairy Structure in the U.S.
In 1981, California’s small (fewer than 30 cows) and large (more than 100 cows) dairy farms alike made up
a high portion of the state’s overall dairy picture (59.8% and 31.6%, respectively). Meanwhile, the state’s share of
mid-size farms was relatively low. Just eleven years later, in 2002, 80% of the state’s dairy farms had more than 500
cows; 17% had 200-499 cows, and only 0.5% had fewer than 100 cows.
In Wisconsin, the share of mid-size farms was high during this 20 year span. In 1981, nearly 40% of the
state’s dairy farms had 30-49 cows. By 2002, nearly 40% had 50-99 cows. Farms with 50-99 cows account for most
of the state’s dairy production.
Farms with 50-99 heads are called ‘mid-size farms’ in this paper.

3. New Movement Within Dairy Cooperatives in the Midwest
Since the latter 1990s, dairy cooperatives have been restructuring at a record pace. In most such
reorganizations, mid- or large-size dairy cooperatives merge with each other and form larger regional cooperatives,
some of which are nation-wide. During this period an aggressive restructuring of dairy processing companies and
retailers also took place, becoming a major factor in most decisions to merge. Meanwhile, the reformed Federal
Milk Marketing Order (FMMO) was likely another major impetus.
3a. Characteristics of dairy cooperatives in the Midwest
Dairy cooperatives collect over 90% of the milk in the Midwest. These cooperatives tend to be relatively
large processing cooperatives. In 2002, over 38% (55,146 million pounds) of this milk from the Midwest was also
processed by area cooperatives. The balance (nearly 62%) was processed by dairy processing companies. In the
nation over all, 32.7% of the milk was processed by cooperatives, and 67.3% by other companies.
When we measure cooperatives’ national share by item in 2002, we find that non-fat powder accounted for
86% of overall volume, followed by butter at 71%, natural cheese at 40%, ice cream at 3%, and fluid milk at 7%.
Meanwhile, it is important to note that the items in which cooperatives have the largest involvement are also those
subject to governmental purchase under MPSP.
Cheese has emerged as an especially important dairy commodity, with U.S. demand increasing steadily
since the mid-1980s. This increase reflects a trend among consumers to prefer Italian (mozzarella) cheese instead of
the earlier favorite, American cheese. Indeed, consumption patterns clearly illustrate this change in the U.S., where
per capita consumption has moved from 6.46 pounds for Italian and 12.18 pounds for American cheese in 1985, to
11.97 for Italian and 12.18 pounds for American cheese in 2002. The transformation from processing mostly
American cheese to mostly Italian cheese also continues to be an important strategy for dairy processing
cooperatives. Until recently, the main cheese item to be processed by cooperatives has been American cheese, not

Italian, with cooperatives’ share of mozzarella relatively small in 1997, at 26%. Most cooperatives which process
Italian cheese are relatively large.
3b. Foremost Farms USA: Mergers and Diversification
Foremost Farms USA (headquartered in Baraboo, Wisconsin) is a large regional dairy cooperative which
increased in size through various mergers in the late 1990s. Two dairy cooperatives merged to form Foremost
Farms USA in 1995, and later that year a third dairy cooperative joined the new co-op. Now among the nation’s top
10 dairy cooperatives in terms of milk volume, Foremost Farms had sales over $1.1 billion in 2002. As a diversified
dairy cooperative, Foremost processes and manufactures many kinds of dairy products, including cheese (percent of
net sales is 52.2%), liquid and condensed milk products (18.4%), packaged fluid milk (16.8%), a host of whey
ingredients (8.0%), butter (2.3%), milk powder products (0.3%), and ready-to-serve juices (2.0%). Their volume of
cheese production is within the nation’s top 10 dairy cooperatives and dairy companies.
Foremost Farms embraces three main strategies. First, they prioritize reinvesting in existing plant upgrades,
and most recently have been changing from American to Italian cheese production. In 1996, 55.2% of their cheese
was American and 39.0% was Italian. In 2002, their Italian component had risen to 58.1%, while American was
stable, at 39.2% .
The second strategy is the development and diversification of new products. Foremost Farms has set up a
plant which can manufacture whey products, and at present is the only cooperative in the U.S. which produces
whey for medical use in the U.S. They also produce whey for pizza companies, and produce Mexican cheese.
Foremost’s third strategy is selling the above-mentioned products through many new market channels.
Besides producing non-brand cheese or OEM fluid milk, butter, and cream for supermarket branding, their own
“Golden Guernsey” and “Morning Glory” labels are highly-successful brands, brands established earlier by the
cooperatives which joined to form Foremost Farms. In 1998 Foremost Farms created a new brand for individual

portions of portable fluid milk, called “Grip it. Sip it.” This portable fluid milk is packaged in single portions, a new
concept for the dairy industry, and one experiencing increasing demand.
As explained above, Foremost Farms has invested their expanded, post-merger funds in modernizing and
streamlining their existing facilities, and in embracing a proactive approach to changing demand for dairy goods.
Nevertheless, the cooperative lacks any major advantage in competing with the huge dairy plants found in western
states. Finally, the cooperative continues to diversify their items and fine-tune their marketing strategies in order to
stabilize and boost profits.
3c. CROPP: Getting into the Organic Market
Another co-op which draws our attention is the Coulee Region Organic Producers Pool (CROPP),1 an
organic producers’ co-op headquartered in LaFarge, Wisconsin. As the nation’s largest organic dairy co-op in terms
of size and sales alike, in 2002, 460 total member farms participated; of these, 365 were dairy farms. Farms are
located across the nation, from the Midwest, the Northeast, the Northwest, California, and Florida. Total revenue
was 99.89 million dollars in 2001, and 126 million dollars in 2002. Dairy products account for 90% of this revenue.
In 1995 CROPP created their own “Organic Valley” brand, with distribution throughout supermarket
chains; since then their sales have been increasing favorably, along with the nation’s growing organic market.
Because of their success in the organic market, in 2001CROPP was able to pay their organic milk producers
$17.53/cwt., the highest payment possible since CROPP’s start-up in 1988.
In 1998, CROPP’s member dairy farms averaged approximately 50 cows; the largest was 400 and the
smallest was 17. Meanwhile, Wisconsin’s average dairy farms had about 60 cows, while the average was 78 for the
rest of the nation. In sum, CROPP member farms tended to be smaller than those in Wisconsin or the rest of the
nation.
1 The acronym “CROPP” today stands for Cooperative Regions of Organic Producer Pools, a name that reflects their now
nationwide pool of producers.

Member dairy farmers must meet four main requirements if they hope to ship their milk as organic. First,
all feed--whether grain or hay--must have been organic for more than a year; this means no herbicides, pesticides,
or artificial fertilizers. Second, hormones may not be used at any time on any of the livestock. Third, no antibiotics
may be used on cows after they reach age one. As a fourth and final requirement, the cows must have ample pasture
space outdoors for exercise.
These requirements clearly set some conditions for organic dairy farms. The farms need ample acreage for
crops and cow pasturing alike. Ideally, the farms are self-sufficient, because organic feed is relatively expensive. It
is worth noting the various requirements that must be met for conventional dairy farms to “transform” into organic
dairy farms. At minimum, at least four years must pass after cessation of all non-organic practices before they may
ship their milk as certified organic. To elaborate, the conversion period for growing feed is three years, and for
cows is one year. The ban on hormone use means milk yield per cow is customarily lower than in a conventional
dairy. In case studies below, milk yields on organic farms is 70% that of other farms. Considering these conditions,
cost reducing strategies are important for organic dairy farms, especially for small farms, even though the milk
price is high.
4. Mid-Size Farms
In July 2003 I interviewed four Foremost Farms USA member farms, and six CROPP member farms. All of
the farms are located in southwest Wisconsin. Table 1 provides an outline of each farm. Farms A-D are members of
Foremost Farms, and Farms E-J are members of CROPP. Farms A, B, C, G, H, and I are described as mid-sized
farms. Although Farm C has 150 cows (and hence could be judged a large farm), its labor and feed production
structures are the same as for other mid-size farms, so farm C is analyzed in this section.

4a. Mid-size farms making gradual expansions as family farms (Farms A, B, and C)
Let’s first take a look at Farms A, B, and C, all members of Foremost Farms.
Farms A and B have many things in common. Their herd sizes are both around 80 cows and their acreages
are 430 acres and 380 acres, respectively. Their acreage per milking cow is around five acres. Both grow alfalfa,
corn, wheat, and soybeans as feed, and both sell surpluses of these feed crops.
Farm A has 281 tillable acres and harvests alfalfa four times a year, selling the first such harvest to large
dairy farms nearby. Corn and wheat are sold when they have a surplus. On Farm B most of the corn and soybean
crops are sold, while the hay crop is not.
Farm C has 150 cows, nearly double the size of Farms A and B, and grows crops on 410 acres. On Farm C
the ratio of acreage to milking cow is 2.7 acres, so they cannot afford to sell feed. They grow alfalfa, corn, barley,
and soybeans in the summer and rye grass in the winter. Farm C consumes their entire feed crop, and purchases no
additional feed and only supplemental minerals. We may infer from Farm C’s experience that the ratio of 2.7 acres
per cow is the minimum requirement for self-sufficiency of feed.
Farms A, B and C raise no livestock beyond their dairy cows and replacement heifers. They breed their own
milking cows, and sell only bull calves and old cows which have finished lactation.
When we examine labor on Farms A and B, it becomes apparent that a dairy farm with 80 cows and 400
acres needs two full-time workers, at minimum. A 62 year-old father and his 36 year-old son operate Farm B
together; the father manages the crops and the son manages the dairy operation. During the busy season, the son’s
wife contributes labor.
At the same time, on Farm A the manager (50 years old, male) is the only full-time worker. He makes up
for the shortage of labor on his farm by utilizing help from his wife, who cares for calves, cleans the barn, and
manages the financial accounts. A part-time worker helps with milking chores. In addition, neighbor farmers are
paid to harvest the hay. Farm C, with approximately the same acreage as Farms A and B, has a larger dairy

operation than either, with 150 dairy cows. Two full-time workers are aided by supplemental part-time labor during
harvest.
The milking facilities vary, with a tie-stall and pipeline-milker on Farm A, and a milking parlor on Farms B,
and C. Each farm milks the cows twice a day; the milk is picked up each day.
In 2002 milk yield per cow was between 24,000 and 25,000 pounds for all three farms, while statewide
milk yield averaged 17,367 pounds. In sum, milk yields on these farms was relatively high.
Milk prices ranged between $10.50 and $10.66 /cwt. on these farms in 2002, a year in which Farm A sold
2.19 million and Farm B sold 2.1 million pounds of milk, for an average income from milk sales at $224,000 for the
year.2 Total farm revenue was $250,000 on Farm A and $300,000 on Farm B, and around 10% of total revenue on
each farm came from the sale of other products besides milk, such as feed and bull calves and cull cows.
On Farm C, the volume of milk sales is around 4.25 million pounds (estimated from revenues of milk sales),
and the revenue from milk is $365,400. The revenue from other production besides milk was around 25%. Net farm
incomes for each of the three farms was at the same level, and net farm income per full-time worker was also at the
same level. These incomes, however, included payments from MILC. The income in 2002 was $26,000 less than in
2001 on Farm C, and they received $23,000 from MILC.
Each of these two- or three-generation farms reflects the state’s current pattern of expansion. In addition,
they have ceased other livestock production to concentrate on dairy farming, and expanded their total farm acreage
during the 1980s. These three farms are relatively typical examples of the state’s mid-size dairy farms.
The future paths for these three farms are expected to differ markedly. Farmer A plans to cease dairy
farming within the coming three years, and to transform the farm from dairy to crops. This change reflects the fact
that Farmer A has no successor to take over the farm. Lacking such, and with consequently no long-term plans for
dairy farming, this farmer chose not to modernize the milking facility.
2 2002 was a year of severely depressed milk prices.

Farm B is trying to expand up to 90 milking cows, and invested five years ago in a milking facility to
prepare for that expansion. Meanwhile, because Farm B has surplus acreage, some might think that their 90-cow
goal is not as ambitious as it might be. They would do well do keep in mind that other factors are part of this
scenario, including the shortage of family labor in the long-term; one of the two full-time workers on Farm B is a
family member over age 60.
Finally, Farm C plans to remain at its current size. Indeed, their farm’s capacity is close to its maximum
regarding both labor and land. Farm C is unable to expand operations unless they change their farm structure
dramatically by hiring more labor outside the family and/or purchasing feed.
In the examples presented with Farms A, B, and C, we observe that mid-size farms in Wisconsin have
increased their operations in two major stages. First they expanded their farm acreage, and secondly, they
modernized their milking facilities from a pipeline milker set-up to an innovative milking parlor.
4b. Mid-size organic dairy farms
Major differences between organic and conventional dairy farms are evidenced in farm acreage per cow
ratios, milk yield per cow, and milk price received.
On Farm H, acreage per cow is 3.4 acres, the smallest of any of the organic farms surveyed. In comparison,
on the other organic farms this number averages over 4 acres per cow, a figure higher than that for conventional
farms. Milk yields per cow range from 13,500 to 18,500 pounds, compared to 24,000 to 25,000 pounds for Farms A,
B, and C. This difference also reflects the fact that these organic farms have a mixed herd of Holstein cows and
breeds such as Jersey which have lower production per cow but a higher milk fat and protein composition.
Farm G grows organic grain as a profitable crop. The father of the current manager started Farm G with 50
cows and 270 acres in 1963. The herd size has not changed much so far, but the acreage has more than doubled. His
son, the current manager, took over this farm from his father in 2001, and Farm G was already an organic farm by
that time. The acreage per cow is 10 acres, a figure which is much larger than other organic farms. Farmer G

views the crop sector to be as important as the dairy sector in terms of profit on this farm. Farm G sells surplus feed
to other organic dairy farms, a corn syrup company, and a barley milling company. Percentages of farm revenue are
55% from milk, 20% from feed and crop, 10% from livestock, and 15% from hay harvest custom work. The farm’s
crop sector is profitable because the price of organic crops is relatively high.
Farm H is aiming at greater profit through reduced costs and direct marketing channels. The manager began
working for Farm H in 1990 as a tenant farmer. He studied animal science in Germany, and was interested in
alternative agriculture. He came to the U.S. and worked on farms as an intern. He married his wife who is American
and rented land, a facility, and a house. He started his dairy farm in 1990, with 37 milking cows, expanding the herd
to as many as 120 in 1997, but the shortage of feed prompted him to control the herd size at around 90 cows.
This farm has been reducing milk production costs, diversifying into sectors beyond dairy, and
incorporating direct marketing. In general Farmer H feeds his cows through intensive grazing methods. This in turn
reduces feed costs and the need for labor for harvesting or cleaning the barn. This farm also uses seasonal calving,
and two part-time workers are hired during the calving season months of March and April. In 1996 the milking
facility was upgraded to a New Zealand style “swing over” milking parlor, which is said to be a lower cost milking
facility than the traditional milking parlor.
Farmer H began a cheese making business with dairy farmers nearby who also graze their cows. Besides its
dairy operations, this farm also raises hogs and chickens, and sells meat and eggs directly to consumers, with 55%
of revenue coming from non-dairy operations.
Farm I is expanding in size, up to 160 cows. Farm I’s current manager opened the farm in 1983 as a
conventional farm. In 1985, while spraying weed killer, he accidentally overturned a weed killer tank; no plants
would grow on that site for several years after that. As he describes it, this experience motivated him to change the
farm to organic.
With 150 cows and 480 acres, Farm I manages intensive grazing on 150 acres and grows grains on 132
acres. Lacking the machinery to harvest grain, they pay $25 per acre to a neighbor who harvests as custom work.

The manager and two of his sons work on the farm full-time, and hire a relief milker 15 times a year, on average.
The farm changed its milking facility to a swing over parlor in 2001. They use some cost reducing strategies on
Farm I such as renting no land. As a result they are able to obtain higher net farm income per full-time worker than
the other farms in this report.
Both Farms H and I utilize milking parlors; these labor-saving milking facilities are very important for
Wisconsin’s mid-size dairies. Meanwhile, Farm G has 50 cows and still uses a tie-stall and pipeline milking parlor.
As mentioned earlier, farms with 50-100 cows, about 400 acres, and a milking parlor are the state’s main milk
producers.
While all of the organic farms we studied take great effort to reduce costs, it is clear that the larger acreage
of owned land is a definite financial advantage for Farm I.
5. Large-Scale Farms
Farm D; turning into a corporation. Farm D with 400 cows has a structure which differs from the mid-size
farms which we have seen in this report. Farm D includes 800 acres of land, or an average of two acres per cow.
While they grow corn on 400 acres, it is not enough to feed their large herd, so they must purchase 25% of their
corn feed. Family labor includes the manager (age 66) and his wife, his son (age 36), and the co-manager (age 31).
They hire seven full- or part-time workers, or about double the family labor. Four of the seven hired workers are
Latino, and they cover milking. A couple from Russia work full-time; the husband has a veterinary license, and they
provide general care for the cows and calves, except for milking and feeding.
A 20-cow milking parlor is hooked to a computer, and milk yield is recorded for each cow. Among the 10
farms in this report, Farm D is the only farm which milks the cows three times a day. It takes five hours to milk
each time.
In 2002 Farm D produced 10.95 million pounds of milk, with milk production costs at $11.50 per cwt.
While milk sales accounted for $1.6 million in revenue, profit that year was at a minus, with farm expenses

exceeding milk revenues. This was because of severely depressed milk prices in 2002. This deficit was covered by
government payments received by the farm in 2002 through MILC. To elaborate, since 1996 milk prices in
Wisconsin have remained very unstable, reaching record lows at times. This instability in turn can make business
on large-scale farms unstable indeed.
Farm D was a mid-size operation until the farm’s expansion. From 100 cows and 260 original acres, they
gradually purchased 390 additional acres from 1996 to 2000 in three installments. Meanwhile, they have further
expanded their crop capabilities by renting even more land. During this period they also modernized their milking
facility from a tie stall and pipeline set-up to free stalls and a milking parlor. Finally, they doubled their herd size in
one major step, up to their current herd size of 250.
Farm J is transforming to an organic farms after expansion to a large farm. Farm J’s herd size is close to
that on Farm D. Unlike Farm D, this farm is owned and operated by six families. With 300 cows, Farm J requires
14,000 acres of land at minimum if it hopes to maintain its status as an organic dairy operation. Indeed, expanding
the herd by only 20 cows would create a land shortage. Meanwhile, 2002 milk production at 5.76 million pounds
brought in $1.2 million in revenue.
Farm J changed from a conventional to an organic dairy farm in 1994 in an effort to stabilize farm income
against fluctuating milk price. They built a 30-cow milking parlor in 1990, but in the next year farm income began
to decline, and it has not recovered. This decline reflected depressed milk prices nationwide. Looking back, we see
that milk prices tended to be on the upswing in 1989, but dropped rapidly in 1990, and did not improve until 1993.
In response to low and fluctuating milk prices, the farm changed over to organic, and during the transition had to
endure four years of financial losses. The farm’s income began to recover in 1998, when they were finally able to
ship their milk as organic. In 2001 the farm income recovered to levels similar to those experienced in 1989.
When we examine Farm J’s strategy, it is not clear how the farm will successfully balance its large size
with the cost-cutting requirements of organic farming. According to “Milk Production Costs in 2002 on Selected
Wisconsin Dairy Farms,” milk production costs on large farms (over 150 cows) exceed those on mid-size farms.

Figures from this study detail milk production costs per cwt: $11.02/cwt. on mid-size farms; $11.24/cwt. on farms
with 151-250 cows, and $11.68/cwt. on farms with more than 250 cows. While Wisconsin’s large dairy farms have
balanced these higher costs by producing more milk, they are nevertheless more sensitive than smaller farms to
price fluctuations, especially when milk prices drop to levels near the cost of production.
6. Summary and Conclusions
Changes since the mid-1980s in the nation’s dairy structure continue to the present. While mega-size dairy
farms are increasing, the total number of dairy farms is declining, and small- and mid-size farms have virtually
disappeared in California, the nation’s top milk producer. Meanwhile, mid-size farms are still mainstream in the
nation’s next-ranking dairy state, Wisconsin, where farm sizes are also gradually increasing.
Wisconsin’s typical milk producer of today has around 80 cows, 400 acres, and two full-time workers.
While a farm such as this may increase its herd size up to 100 or 150 cows on the same acreage, there is a major
prerequisite to doing this: having a labor-saving milking facility. And if the farm increases to 150 cows, the two
full-time workers must be able to manage the physical labor demands. It is difficult for a father and son operation to
milk 150 cows unless they have hired help.
Payment from MILC—established in the 2002 Farm Bill—covered nearly all losses from declining milk
prices for most farmers, no matter the size of their farm. In sum, this program has been effective in stabilizing their
net farm income.
The fluctuation of milk prices since 1996 posed more damage to larger farms than to small- and mid-size
farms. This is especially true when the price is so low that it effectively reaches production costs. Most agree that
such milk price fluctuation are due to the overproduction of milk in the U.S. In response, the National Milk
Producers Federation has called for producers to find mechanisms to control the milk supply. We would do well to
observe how these attempts affect milk prices, and how they influence dairy structure in Wisconsin.

The organic strategy is acceptable to small, mid-, and large-size farms in Wisconsin, since many of the
state’s dairy farmers grow their own livestock feed. Meanwhile, becoming certified as organic requires that four
“clean” years pass before the newly established farm may ship their milk as organic. Of course this lag can put a
strain on farm revenues. Nevertheless, during periods of low milk prices, when conventional milk prices may be
only half that of organic milk prices, converting to organic is clearly a survival strategy

Table 1 (Souce: personal interviews.)
Herd Size Farm Acreage Feed Production
(acres) Labor** Milk production and Farm Income in 2002
Far
m
Co-
op *
Bus
ines
s O
rgan
izat
ion
Dai
ry C
ows
Hei
fers
Tot
al
Ow
n La
nd
Ren
t Lan
d
Hay
Gra
ins
Gra
ze
Fam
ily
Labo
r
Hire
d La
bor
Milking Facility
Volume of Milk
Production (1,000 lbs.)
Milk Yield per cow Per Year
(lbs.)
Milk Price
($/cwt.)
Turnover from Milk
($)
Gross Farm
Income ($)
A FM Individual 75 50 430 230 200 140 145 50 M( 50) F( 47)
R1 T1
tie stall, pipeline milker
2,190 25,000 10.25 224,475 250,000
B FM Family Corporation
81 76 380 240 140 80 210 none M( 36) M( 62) F( 34)
none free stall 16-cow milking pallor
2,100 24,000 10.66 223,860 300,000
C FM Partnership LLC
150 70 410 190 220 192 183 50 M (30's) M (40's)
T3 flat barn pallor
4,250 25,000 10.15- 10.50
365,400 490,000
D FM Partnership LLC
400 350 800 650 150 300 450 <=50 M( 33) M( 66) F( 65) M( 31)
R&T total 7
20-cow milking pallor
10,950 - - 1,600,000 -
E CR Individual 21 6 282 132 150 159 83 30 M( 50 F( 40's)
R1 tie stall, pipeline milker
230 15,000 19.70 43,000 -
F CR Individual 23 12 100 50 50 50 none 50 M( 37) T3 26-cow tie stall, pipeline milker
330 15,600 20.60 42,184 -
G CR Partnership 60 - 600 290 310 200 none 25 M( 25) R2 T1
tie stall, pipeline milker
1,500 18,500 20.00 250,000 450,000
H CR Individual LLC
92 74 317 none 317 - none - M( 46) F( 37)
T2+, Intern 1-2
double 12 New Zealand style swing over pallor
1,510 17,000 11.99 181,082 329,724
I CR Partnership 100 100 480 480 none 99 132 150 M( 57) M( 32) M( 30)
R1 double 12 New Zealand style swing over pallor
1,700 13,500 19.00- 19.50
300,000 330,000- 340,000
J CR Family Corporation
320 150 1400 950 350 600 700 150 6M, ages: 56, 47, 46, 44, 43, 37 F( ?)
R2 T1
round 30-cow milking parlor
5,760 18,000 19.20 1,200,000 1,450,000
* FM: Foremost Farms USA, CR: Cooperative Regions of Organic Producer Pools (was Coulee Region Organic Producers Pool). ** M=male, F=female, number in () is age. R=regular, T=temporary; number next to R/T=number of workers in Hired Labor.
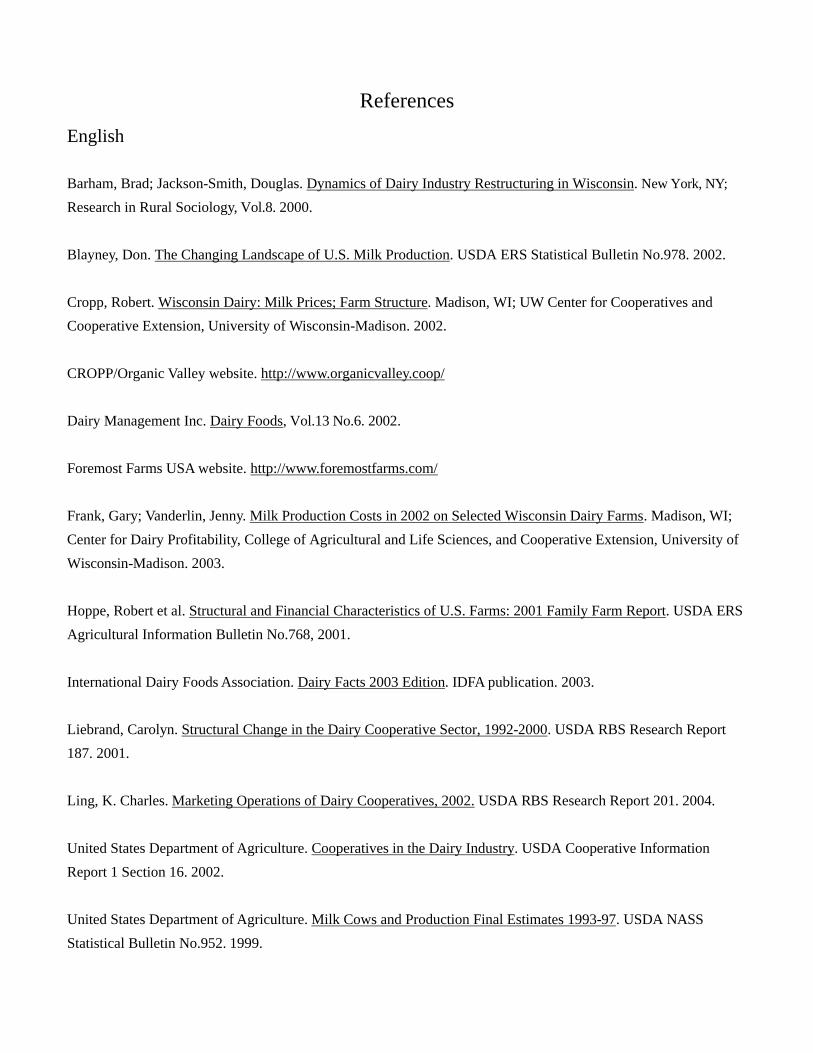
References
English
Barham, Brad; Jackson-Smith, Douglas. Dynamics of Dairy Industry Restructuring in Wisconsin. New York, NY;
Research in Rural Sociology, Vol.8. 2000.
Blayney, Don. The Changing Landscape of U.S. Milk Production. USDA ERS Statistical Bulletin No.978. 2002.
Cropp, Robert. Wisconsin Dairy: Milk Prices; Farm Structure. Madison, WI; UW Center for Cooperatives and
Cooperative Extension, University of Wisconsin-Madison. 2002.
CROPP/Organic Valley website. http://www.organicvalley.coop/
Dairy Management Inc. Dairy Foods, Vol.13 No.6. 2002.
Foremost Farms USA website. http://www.foremostfarms.com/
Frank, Gary; Vanderlin, Jenny. Milk Production Costs in 2002 on Selected Wisconsin Dairy Farms. Madison, WI;
Center for Dairy Profitability, College of Agricultural and Life Sciences, and Cooperative Extension, University of
Wisconsin-Madison. 2003.
Hoppe, Robert et al. Structural and Financial Characteristics of U.S. Farms: 2001 Family Farm Report. USDA ERS
Agricultural Information Bulletin No.768, 2001.
International Dairy Foods Association. Dairy Facts 2003 Edition. IDFA publication. 2003.
Liebrand, Carolyn. Structural Change in the Dairy Cooperative Sector, 1992-2000. USDA RBS Research Report
187. 2001.
Ling, K. Charles. Marketing Operations of Dairy Cooperatives, 2002. USDA RBS Research Report 201. 2004.
United States Department of Agriculture. Cooperatives in the Dairy Industry. USDA Cooperative Information
Report 1 Section 16. 2002.
United States Department of Agriculture. Milk Cows and Production Final Estimates 1993-97. USDA NASS
Statistical Bulletin No.952. 1999.

Japanese
Kaiser, H. Dairy Cooperatives in the U.S., Activation of Dairy Associations under Policy Changing. Japan Dairy
Council. 1999.
Ooe, T.; Sakauchi, H. An alliance between Dairy Cooperatives and Big Dairy Companies in the U.S. The Norin
Kinyu -Monthly Review of Agriculture, Forestry and Fishery Finance, The Norinchukin Bank. 2004
Ozawa, K. Current Situation of Dairy Industry in the U.S., Quarterly Journal of Agricultural Economy. National
Research Institute of Agricultural Economics, Ministry of Agriculture, forestry and Fisheries, Japan. 1984
Suzuki, N. Evaluation of Dairy Policy in the 2002 Farm Bill and Trend of Milk Production and Distribution
Structure. Japan Dairy Council. 2003
Watanabe, Y.; Higuchi, H. Trends and Function of Dairy Cooperatives in the U.S. Dairy Market. Abroad
Information of Animal Husbandry, Agriculture & Livestock Industries Corporation. 2001