SATELLITES FO R CLIMATE SERVICES - E-Librarylibrary.wmo.int/pmb_ged/wmo_1162_en.pdf · SATELLITES...
68
SATELLITES FOR CLIMATE SERVICES CASE STUDIES FOR ESTABLISHING AN ARCHITECTURE FOR CLIMATE MONITORING FROM SPACE WMO-No. 1162
Transcript of SATELLITES FO R CLIMATE SERVICES - E-Librarylibrary.wmo.int/pmb_ged/wmo_1162_en.pdf · SATELLITES...

SATELLITES FOR CLIMATE SERVICES
CASE STUDIES FOR ESTABLISHING
AN ARCHITECTURE FOR CLIMATE MONITORING
FROM SPACE
WMO-No. 1162

BB
WMO-No. 1162
© World Meteorological Organization, 2015
This report was prepared jointly with the European Commission Joint Research Centre and has the following JRC publication number: JRC96139.
The right of publication in print, electronic and any other form and in any language is reserved by WMO. Short extracts from WMO publications may be reproduced without authorization, provided that the complete source is clearly indicated. Editorial correspondence and requests to publish, reproduce or translate this publication in part or in whole should be addressed to:
Chairperson, Publications BoardWorld Meteorological Organization (WMO)7 bis, avenue de la Paix Tel.: +41 (0) 22 730 84 03P.O. Box 2300 Fax: +41 (0) 22 730 80 40CH–1211 Geneva 2, Switzerland E-mail: [email protected]
ISBN 978-92-63-11162-3
Cover illustration: Andrey Armyagov
NOTE
The designations employed in WMO publications and the presentation of material in this publication do not imply the expression of any opinion whatsoever on the part of WMO concerning the legal status of any country, territory, city or area, or of its authorities, or concerning the delimitation of its frontiers or boundaries.
The mention of specific companies or products does not imply that they are endorsed or recommended by WMO in preference to others of a similar nature which are not mentioned or advertised.
The findings, interpretations and conclusions expressed in WMO publications with named authors are those of the authors alone and do not necessarily reflect those of WMO or its Members.
EDITORIAL NOTE
METEOTERM, the WMO terminology database, may be consulted at http://www.wmo.int/pages/prog/lsp/meteoterm_wmo_en.html. Acronyms may also be found at http://www.wmo.int/pages/themes/acronyms/index_en.html.

CONTENTS
Executive summary . . . . . . . . . . . . . . . . . . . . . . . . . . . . . . . . 2
Introduction and context . . . . . . . . . . . . . . . . . . . . . . . . . . . . . . 3
Climate service case studies . . . . . . . . . . . . . . . . . . . . . . . . . . . . . 11
Marine environmental monitoring (Great Barrier Reef, Australia) 12
Sea-level rise and impact on coastal regions 16
Estimating flood climatologies and prediction skills (Australia) 20
Drought monitoring in Eastern Africa 23
Crop monitoring in Eritrea 26
Drought monitoring and assessment (China) 29
Renewable energy resource assessment (USA, Japan) 35
Solar energy potential in complex terrain (Switzerland) 39
Projecting natural gas demand (North-eastern United States) 43
Monitoring tropical deforestation in support of REDD+ 46
Sea-ice edge monitoring for polar navigation (Canada) 49
Malaria early warning system in the Solomon Islands using seasonal climate outlooks 53
Stratospheric ozone monitoring and assessment for determining efficacy of the Montreal Protocol 59
Concluding findings and remarks . . . . . . . . . . . . . . . . . . . . . . . . . . . 63
Appendix . . . . . . . . . . . . . . . . . . . . . . . . . . . . . . . . . . . . 65

22
EXECUTIVE SUMMARY
The report describes case studies that demonstrate the direct or indirect value of Earth observation satellites for climate services Climate services (climate information prepared and delivered to meet a user’s needs (WMO, 2011)) are recognized as vital for decisionmaking in cli-mate-sensitive societal sectors, such as food security, water management, disaster risk reduction and health Against a backdrop of human-induced climate change and the need for adaptation and mitigation, reliable, quality-controlled climate information at a global level is essential to inform decisions Satellites are uniquely placed to provide a global perspective on the climate system, to contribute to the monitoring of the 26 Essential Climate Variables (ECV) (GCOS, 2011), and to inform regional and local climate analyses
The 13 case studies in this report start from a wide range of end users’ perspectives and their needs for climate services, including those of farmers, house owners, ecosystem managers, agriculture and health authorities, river basin managers, coastal protection agencies, energy companies, the finance and insurance industry, development fund agencies, and government and other policy decisionmakers The case studies then demonstrate the importance of satellites for preparing the climate services needed by these communities Satellite-based climate data records provide both a critical baseline and new input into the reanalyses that underpin climate services In many examples, climate
services are generated using a combination of data records from satellites, surface-based observing systems and other sources of information (models, socioeconomic data) The importance to climate services of near-real-time satellite data that do not, or only partially, meet climate standards is also shown
The coordination of climate observing and modelling systems, the integrated use of climate data and effective user-provider feedback mechanisms in all climate- sensitive sectors are therefore essential for advancing the develop-ment of climate services
The objectives of this report are (i) to demonstrate the value of satellite-enabled climate services to decision- makers, funding agencies and climate service users; (ii) to demonstrate to satellite agencies the need for an enhanced coordination within the Architecture for Climate Monitoring from Space (ACMS) that will address the thematic breadth of climate services
This report supplements the Strategy Towards an Architecture for Climate Monitoring from Space (Dowell et al , 2013), a joint coordination effort by space agencies and the World Meteorological Organization (WMO) in support of the Global Framework for Climate Services (GFCS), and provides a basis for validating the logic of the proposed end-to-end Architecture

33
INTRODUCTION AND CONTEXT
The last decades have seen an increasing demand for reliable climate information and services from key sectors, including insurance, agriculture, health, water manage-ment, energy and transportation This demand is expected to grow further against the backdrop of a changing climate (IPCC, 2014) Planning, investment, and policy decisions in climate-sensitive sectors reflect the increasing societal readiness to mitigate greenhouse gas emissions (Lima Call for Climate Action, UNFCCC, 2015) and the urgent need to adapt to the unavoidable (“locked-in”) impacts of climate change (World Bank, 2012)
The importance of high-quality, reliable and timely climate services has been recognized in the Global Framework for Climate Services (GFCS), a UN-led initiative instigated at the World Climate Conference-3 (WCC-3, 2011) In the GFCS high-level plan (WMO, 2011), a climate service is defined as “climate information prepared and delivered to meet a user’s needs” A climate service includes the timely production and delivery of science-based trustworthy climate data, information and knowledge to support
business, policy and other decisionmaking processes To do so effectively, climate services should be primarily end-user driven, designed in collaboration with customers and stakeholders, based on free and open access to essential data, and including user feedback mechanisms In addition, research is essential to better understand and predict the climate and thus improve many climate products, applications and services By exploiting the full potential of the climate observing system, and through improved climate modelling, climate research innovates and stimulates new areas of service development All of the above mentioned elements of climate services are reflected in the five components (“pillars”) of the GFCS (WMO, 2011): User Interface Platform; Climate Services Information System; Observations and Monitoring; Research, Modelling and Prediction; and Capacity Development
Climate services require data from observing and monitor-ing systems such as ground-based weather stations, ocean buoys, and Earth observation satellites Observational
BOX 1 . What are components of a climate service?
Core elements of a climate service include:• Monitoring • Reanalyses • Attribution of phenomena and events, including extremes • Indicators and indices • Forecasts (predictions and projections)
Downstream elements of climate services could include, for example: • Seasonal climate outlooks (3–6 months) over the south-east United States to inform livestock and fruit
farmers • Expected trend in annual rainfall over the next three decades in support of hydropower infrastructure
decisionmaking in India • Assessment of whether a recent drought in the Greater Horn of Africa, by its length and severity, has
been a 1–in–10, 1–in–30 or 1–in–50 years event, to inform the building of resilience against famine and to manage risks
• Insight into how sea-ice parameters are likely to change along the North-east passage in September over the next 20 years
• Food security outlooks, malaria outlooks, etc

44
datasets are the basis for long-term climatologies and statistical analyses of climate; they are essential for detecting climate trends, and for the understanding of processes that enable climate modelling and predic-tion Human-induced climate change leads to shifting probability distributions of some climate variables, with proven increases in the likelihood of “climate extremes”, such as heat waves and heavy rainfall events (Zwiers et al , 2013) The changing climate baseline can only be reliably detected using observations, and poses additional challenges for monitoring, modelling and predicting the climate system Improved knowledge in these areas is a prerequisite for adaptation decisions, and effective disaster risk reduction: an assessment of the risk of extreme events is required, followed by measures to reduce exposure and vulnerability, for example, through planning and policymaking, infrastructure design, and the introduction of insurance schemes
Climate information can be classified by its update fre-quency, from static (e g climatologies) to dynamic (e g near-real-time operational climate monitoring) (Pulwarty and Zillman, personal communication, 2015) Such information has different applications and requires different delivery mechanisms to users In all cases, the best possible climate information optimizes decisions and translates directly into lives saved, property protected, improved economic resil-ience, enhanced security and the well-being of the public
Climate services are distinct from other operational services (such as for weather and environmental assessments) in that the requirements for uncertainty characterization, documentation, traceability and accuracy are particularly demanding Users expect to be able to assess whether the quality of climate information (for example, resolution in time and space) is adequate to support their decisionmaking, or to assess the risks associated with taking a decision based on climate information in terms of, for example, financial implications, or safeguarding property or human life Establishing best practices and standards for character-izing and describing climate datasets is subject of ongoing investigation, often in collaboration with the metrology and computer science communities (WMO–BIPM, 2010; QA4EO, CHARM) 1
Climate monitoring from space
Climate is determined by the combination and statistical aggregation of Earth system processes at a wide range of spatial and temporal scales It is important to monitor climate so that the causes of climate variability and change can be traced, and the predictability of future changes improved A complete characterization of the Earth’s climate system requires observations of the coupled ocean, land, cryosphere
1 See: www qa4eo org and http://charme org uk/
and atmosphere, all of which involve many individual variables The Essential Climate Variables (ECV) defined by the Global Climate Observing System (GCOS)2 provide an internationally agreed priority list to guide the sustained observation of the Earth’s climate (Bojinski et al , 2014)
To characterize climate and climate change, data need to be accurate and homogeneous over long timescales The signals that are important for climate monitoring and the detection of climate variability and change can easily be lost in the “noise” of an evolution observing system 3 This emphasizes the need for continuity in an observing system where observations can be tied to an invariant reference Such a system needs to be maintained over at least several decades (see the GCOS Climate Monitoring Principles (GCOS, 2010))
The GCOS Climate Monitoring Principles are well recognized for establishing the climatology of traditional meteorological parameters (such as air temperature and rainfall), which are measured from the ground using standard meteorological stations However, for global observations of the coupled land-ocean-atmosphere system and of all GCOS ECVs, a multitude of observation systems is required and satellites are indispensable For the global observation of 26 out of the 50 ECVs, satellites make a significant, or the only, contribution to the observational record (GCOS, 2011) Space-based Earth observation has reached a good level of maturity in performance and data-record length: some of the records span 40 years and sensor technologies are increasingly sophisticated and stable As a result, many of the GCOS requirements can technically be met The evolving role of satellites for climate monitoring has been recognized by space agencies (CEOS, 2008), the United Nations Framework Convention on Climate Change (UNFCCC) (2008) and within the GFCS (WMO, 2011; 2014a)
It is within this context that the necessity emerged for a coordinated approach for observing climate and gen-erating climate data from space In turn, this resulted in the call for an Architecture for Climate Monitoring from Space (ACMS)
Global and regional actors
The World Climate Conference-3 in 2009 unanimously decided to establish a Global Framework for Climate Services (GFCS) It is an initiative to guide the development
2 Sponsored by WMO, the Intergovernmental Oceanographic Commission of UNESCO, the United Nations Environment Programme and the International Council for Science
3 Such evolution results from changes in observing systems and data over time Those changes are themselves due to technological evolution, modifications in measurement approach and spatio-temporal coverage, and the shifting, interruption or discontinuation of operations

55
and application of science-based climate information and services in support of decisionmaking in climate-sensitive sectors The Framework is an intergovernmental partner-ship, which is spearheaded by WMO and supported by the United Nations and other international organizations with diverse, cross-cutting mandates and competences
The four initial priority areas of the GFCS are water, disaster risk reduction, health, and agriculture and food secu-rity, which are also Societal Benefit Areas of the Group on Earth Observations (GEO) In November 2014, the Intergovernmental Board on Climate Services (the GFCS main governing body) decided to add the energy sector as an additional priority,4 and urban activities related to climate as a cross-cutting element The GFCS provides a framework which envisages service provision at global, regional and national levels In many areas, these efforts are not starting from scratch as there are already existing service components at different scales in several countries and regions Implementation of the GFCS is underway,
4 Subsequently endorsed by the Seventeenth World Meteoro-logical Congress in 2015
with project-based activities being implemented in various countries in Africa, the Caribbean, Asia, and Pacific small island developing States 5
Although all five components of the GFCS are important, the basis for the provision of climate services on global, regional and national levels is a strong observation and monitoring pillar (WMO, 2014a) Core contributions to this pillar are the WMO Integrated Global Observing System (WIGOS) and GCOS Information on current and planned observing systems, including satellites, can be found in the WMO Observing Systems Capability Analysis and Review (OSCAR) tool 6 A significant part of the required observations can only be provided by satellite systems, especially in less developed regions The implementation plan for the GFCS (WMO, 2014b) therefore calls for the implementation of the ACMS One of the major driving forces for the ACMS will be the observational requirements of climate services, such as within the GFCS This report helps build the foundation for identifying and formulating those requirements
5 http://gfcs wmo int/projects-list6 http://www wmo int/oscar
Table 1 . Key policy areas of the European Union, linked to applications, climate data records, and Earth observation data sources
Policy area Application Climate data record generation Earth observation data sources
Climate Risk Management Floods
Surface waterAMSR-E and TRMM Visible imagery – Copernicus emergency management service
Meteorology/precipitation ECMWF forecasts/analyses
Climate Risk Management
Flash floods/landslides
Landslide scar/ surface water
Visible imagery – Copernicus emergency management service
Climate Risk Management/ Adaptation
Droughts
Normalized Difference Water Index MODIS
FAPAR MERIS, SPOT-VGT
Standardized Snowpack Index Nimbus-7, DMSP
Standardized Precipitation Index In situ synoptic stations, GPCC
Soil moisture ECMWF-Lisflood, SMOS
Adaptation Sea-level rise Sea-surface height Poseidon, Jason
Adaptation Agriculture Meteorology/precipitation, FAPAR
Meteorological forecasts/analyses, In situ stations, MERIS, SPOT-VGT
Adaptation Forestry Meteorology/precipitation, FAPAR
Meteorological forecasts/analyses, In situ stations, MERIS, SPOT-VGT
Adaptation Air quality Short-lived gases, aerosols SCIAMACHY, GOME, OMI, In situ stations
Mitigation REDD Land cover Landsat, Sentinel-2

66
One example of a regional actor is the Copernicus Climate Change Service (C3S) of the European Union Copernicus programme The Service responds to environmental and societal challenges associated with human-induced climate change It will give access to information for monitoring and predicting climate change, and will therefore help to support the adaptation and mitigation policies of the European Union The Service will benefit from a sustained network of in situ and satellite-based observations and reanalysis of Earth climate and modelling scenarios based on a variety of climate projections Table 1 links key policy priorities of the European Union to applications, related climate data records and underlying Earth observation data sources
The Architecture for Climate Monitoring from Space
Initiatives to address gaps in satellite-based climate obser-vation and climate dataset generation in a coordinated fashion have been taken over the past ten years by space agencies through the frameworks of the Committee on Earth Observations (CEOS) and the Coordination Group for Meteorological Satellites (CGMS), as well as by WMO in response to GCOS requirements
With the objective of more efficient coordination, a strategy report (Dowell et al , 2013) was produced by a joint CGMS, CEOS and WMO team The report forms the basis of the Architecture for Climate Monitoring from Space (ACMS) and provides the background to the present document The strategy report focuses on satellite observations for climate monitoring and the need for an international architecture that ensures delivery of these observations over the timeframes required for the long-term analysis of the Earth’s climate system
The strategy report describes the ACMS in terms of infor-mation flow and logical dependencies, which includes: measuring relevant quantities from satellites (“sensing”); the production of climate data records; and the application of those records by various end users, often for policy and decisionmaking purposes (Figure 1)
The proposed ACMS specifically calls for a constellation of research and operational satellites, for broad, open, data-sharing policies and for contingency planning and agreements Such arrangements are considered essential to secure the same continuity of long-term, sustained climate observations that we have today for weather observations While the longevity of essential climate records needs to be ensured, observing systems also need to evolve, taking advantage of scientific and tech-nological progress Research and operational agencies need to closely collaborate in the framework of the ACMS to achieve this goal
Furthermore, whilst the emphasis of the initial strategy report had been on space-based observations, it was also recognized that, during the implementation phase, space agencies and associated programmes would start to address in earnest how the in situ components of the climate monitoring system could be represented within the ACMS That integration process should take advan-tage of existing international activities and frameworks which independently coordinate the in situ observation networks With this long-term ambition in mind, the Architecture presented in this document has been made intentionally generic, so that it can be readily adjusted to describe the functional components of an integrated, in situ space-monitoring system in the future
The strategy report identifies a way forward and the associated roadmap is currently being implemented through the joint efforts of CEOS, CGMS and WMO Implementation activities include specifying a physical architecture that captures, among others, the current and planned availability of datasets of each ECV An initial step in this process is the population and maintenance of an ECV inventory to provide a detailed overview of current and planned capabilities The inventory is available at http://ecv-inventory com/
The World Meteorological Congress at its seventeenth session (WMO, 2015) stressed the linkage of the ACMS to the policy framework of the UNFCCC and highlighted the
Figure 1 . Architecture for Climate Monitoring from Space (ACMS), “Logical view” (Dowell et al ., 2013)
SENSE EARTH ENVIRONMENT
CLIMATE DATA RECORD
CREATIONAPPLICATIONS
DECISION- MAKING
ObservationsClimate data
recordsReports and
data

77
important role of the Joint CEOS-CGMS Working Group on Climate The session further identified the following as key objectives of the ACMS: seamless continuity of climate monitoring satellite programmes; comparability of measurements; provisions for continuity and contingency; and traceability to reference standards
Additionally, it is recognized that a fundamental value of the Architecture is its end-to-end nature For the user, that nature flows from a decisionmaking/policy perspective, back through the required applications, to the necessary datasets and ultimately the required observational capacity needed to sustain this information chain Furthermore, the section of the strategy report about the way forward concludes by underlining that “as the architecture matures and the development of climate services at the global (i.e. the Global Framework for Climate Services), regional and national level becomes further defined, then the continued mapping of dedicated case studies resulting from the climate service requirements onto both the logical and physical views should be undertaken”
The relevance of performing such case studies was emphasized during a February 2013 meeting, entitled “Climate from Space Week”, held at the WMO head-quarters in Geneva, Switzerland The WMO Expert Team on Satellite Utilization and Products (seventh session, May 2013) discussed the matter and decided to develop case studies to demonstrate the value of satellite data for climate services A task group of the Team, together with the Joint CEOS-CGMS Working Group on Climate, subsequently led the preparation of the present report, jointly produced by WMO, the GFCS and the European Commission Joint Research Centre
Scope and purpose of the report
Using 13 case studies (Table 2 and Figure 3), the present report illustrates the fundamental importance of satel-lite observations for climate monitoring and building climate services In doing so, the report supplements the Strategy Towards an Architecture for Climate Monitoring from Space (Dowell et al , 2013)
The objectives of this report are (i) to demonstrate the value of satellite-enabled climate services to decisionmakers, funding agencies and climate service users; (ii) to demon-strate to satellite agencies the need to address a wide range of climate service requirements, and to provide for enhanced coordination within the Architecture that will enable the agencies to effectively address those requirements
The material presented also assists in the efforts of the GEO to demonstrate the benefits of Earth observations to society and to play a brokering role in the incubation and enabling of end-to-end systems and services
The case studies have been selected to be representative and include examples of: services provided at global, regional and national levels; services in developing and developed countries; services used in research, operational and policy arenas (Figure 3) The case stud-ies also include: a description of the end users’ needs for climate-related information in a particular societal sector, where possible through user testimonials; an identification of the importance of satellite-based (and other) climate datasets for generating climate-related information; and a description of the observing system(s) required to generate those datasets
Figure 2 . Case studies analysed in this report show the need for additional data sources in preparing and delivering a climate service (modified Figure 1) .
SENSE EARTH ENVIRONMENT
CLIMATE DATA RECORD
CREATIONAPPLICATIONS
DECISION- MAKING
ObservationsClimate data
recordsReports and
data
ADDITIONAL DATA (EO data, model results, socioeconomic data, terrain models)

88
Table 2 . Overview of case studies (see appendix for author affiliations)
No . Title Author(s) Geographic focus Thematic area
1Marine environmental monitoring (Great Barrier Reef)
Anthony Rea AustraliaMarine ecosystems, agriculture/fisheries, tourism
2 Sea-level rise and impact on coastal regions Anny Cazenave Global
Adaptation, mitigation, coastal management, disaster risk reduction (DRR)
3Estimating flood climatologies and prediction skills
Guy Schumann, Stephen English Australia Flood management, DRR
4 Drought monitoring in Eastern Africa
Ignatius Gitonga, Peter Omeny, James Muhindi East Africa Food security, DRR
5 Crop monitoring in Eritrea Mark Dowell Eritrea Agriculture, DRR
6 Drought monitoring and assessment in China
Xiang Fang and Yiping Zhang China Food security, DRR
7Renewable energy resource assessment in the USA and Japan
Richard Eckman, Terry Nakajima, Toshiyuki Kurino
USA, Japan Energy
8 Solar energy assessment in complex terrain Reto Stöckli Switzerland Energy
9Projecting natural gas demand in NE United States
Ed Kearns, John Bates USA Energy
10Monitoring tropical deforestation in support of REDD+
Mark Dowell, Frédéric Achard
Sub-tropics, global Mitigation
11 Sea-ice edge monitoring for polar navigation
Pascal Lecomte, Marcus Engdahl Canadian Arctic Adaptation (agriculture/
fisheries, transport, water)
12
Prototype malaria early warning system in the Solomon Islands using seasonal climate outlooks
Yahya Abawi and BOM Australia co-authors; Lloyd Tahani
Solomon Islands Health
13
Stratospheric ozone monitoring and assessment for the Montreal Protocol
Paul Newman, Richard Eckman Global Protocol monitoring,
mitigation, health
The case studies include end users’ perspectives from farmers, house owners, ecosystem managers, agriculture and health authorities, coastal protection agencies, energy companies, the finance and insurance industry, development aid agencies, researchers, and government policy and decisionmakers
The case studies provide a practical demonstration of the logical structure of the ACMS in terms of its functions, information flows and dependencies It is intended to demonstrate the validity of the Architecture, its robustness to new applications and its possible shortfalls The case studies follow a common template:

99
functional elements of each case are mapped against the logical view of the ACMS
The case studies show that satellite-based climate data records provide a critical baseline and input to reanalyses that underpin climate services In several cases, satellite data records (climate and non-climate) are complemented by climate data records from sur-face-based observing systems and other sources of information (models, socioeconomic data) to generate the service To account for the importance of comple-mentary information, Figure 2 (an adapted version of Figure 1) maps the information flow and dependencies within each case study The geographic scope of the case studies is shown in Figure 3
References
Bojinski S , M Verstraete, T C Peterson, C Richter, A Simmons and M Zemp, 2014: The Concept of Essential Climate Variables in Support of Climate Research, Applications, and Policy Bull. Am. Met. Soc., 95(9):1431–1443, http://dx doi org/10 1175/BAMS-D-13-00047 1
CEOS, 2008: The Earth Observation Handbook: Climate Change Special Edition 2008. ESA Rep , SP-1315, http://www eohandbook com/eohb2008/
Dowell, M , P Lecomte, R Husband, J Schulz, T Mohr, Y Tahara, R Eckman, E Lindstrom, C Wooldridge, S Hilding, J Bates, B Ryan, J Lafeuille and S Bojinski, 2013: Strategy Towards an Architecture for Climate
Monitoring from Space, http://www wmo int/pages/prog/sat /documents /ARCH_strategy-climate-architecture-space pdf
GCOS, 2010: Implementation Plan for the Global Observing System for Climate in Support of the UNFCCC 2010 update GCOS Report No 138, www wmo int/pages/prog/gcos/Publications/gcos-138 pdf
GCOS, 2011: Systematic Observation Requirements for Satellite-based Products for Climate 2011 update GCOS Rep 154, www wmo int/pages/prog/gcos/Publications/gcos-154 pdf
IPCC, 2014: Climate Change 2014: Impacts, Adaptation, and Vulnerability. Part A: Global and Sectoral Aspects. Contribution of Working Group II to the Fifth Assessment Report of the Intergovernmental Panel on Climate Change (C B Field, V R Barros, D J Dokken, K J Mach, M D Mastrandrea, T E Billir, M Chatterjee, K L Ebi, Y O Estrada, R C Genova, B Girma, E S Kissel, A N Levy, S MacCracken, P R Mastrandrea and L L White (eds ) Cambridge and New York, Cambridge University Press
UNFCCC, 2008: Reporting on Global Observing Systems for Climate. Report of the Conference of the Parties on its Thirteenth Session, Held in Bali from 3 to 15 December 2007 http://unfccc int/resource/docs/2007/cop13/eng/06a02 pdf#page=1
UNFCCC, 2015: Report of the Conference of the Parties on its twentieth session, Held in Lima from 1 to
Figure 3 . Geographic scope of the case studies considered in this report
7 . Renewable energy assessment
(Japan)
10 . Monitoring deforestation for climate
change mitigation (Tropical)
9 . Projecting natural gas demand (USA)
7 . Renewable energy assessment
(USA)
11 . Ice-edge monitoring for polar navigation
(Canada) 8 . Solar energy assessment
(Switzerland)
13 . Montreal Protocol monitoring and climate
(Global)
2 . Sea-level change and coastal protection
(Global)
6 . Drought monitoring for food security
(China)
5 . Crop monitoring (Eritrea)
4 . Drought monitoring for food security
(East Africa)
12 . Climate outlooks for malaria prevention
(Solomon Islands)
3 . Flood risk assessment(Australia)
1 . Ecosystem (reef) management
(Australia)

1010
14 December 2014. Addendum – Part two: Action taken by the Conference of the Parties at its Twentieth Session (Decision 1/CP.20 – Lima Call for Climate Action) http://unfccc int/resource/docs/2014/cop20/eng/10a01 pdf
World Bank, 2012: Turn Down the Heat: Why a 4°C Warmer World Must be Avoided Washington, D C , http://documents worldbank org /curated /en /2012/11/17097815/turn-down-heat-4°c-warmer-world-must-avoided
WCC-3, 2011: Conference statement http://gfcs-climate org/sites/default/files/WCC-3_Statement_07-09-09%20mods pdf
WMO, 2011: Climate Knowledge for Action: A Global Framework for Climate Services – Empowering the Most Vulnerable (WMO-No 1065) Geneva, http://library wmo int/pmb_ged/wmo_1065_en pdf
WMO, 2014a: Annex to the Implementation Plan of the Global Framework for Climate Services – Observing and Monitoring Component Geneva, http: / /gfcs wmo int /sites /default /files /Components /Observations%20and%20Monitoring / /GFCS- ANNEXES-OBS-FINAL-14208_en pdf
WMO, 2014b: Implementation Plan of the Global Framework for Climate Services Geneva, http://gfcs wmo int /sites /default / f iles / implementation-plan /GFCS-IMPLEMENTATION-PLAN-FINAL-14211_en pdf
WMO, 2015: Abridged Final Report with Resolutions of the Seventeenth World Meteorological Congress (WMO-No 1157) Geneva, http://library wmo int/pmb_ged/wmo_1157_en pdf
WMO-BIPM, 2010: Report on the WMO-BIPM Workshop on Measurement Challenges for Global Observation Systems for Climate Change Monitoring 30 March – 1 April 2010, (WMO/TD-No 1557, IOM-Report No 105, Rapport BIPM-2010/08) Geneva, http://www bipm org/utils/common/pdf/rapportBIPM/2010/08 pdf
Zwiers, F W , L V Alexander, G C Hegerl, T R Knutson, J Kossin, P Naveau, N Nicholls, C Schär, S I Seneviratne and X Zhang, 2013: Challenges in estimating and understanding recent changes in the frequency and intensity of extreme cli-mate and weather events In: Climate Science for Serving Society: Research, Modelling and Prediction Priorities (G Asrar and J Hurrell, eds ), 339–389, doi:10 1007/978-94-007-6692-1 13

11
CLIMATE SERVICE CASE STUDIES
11

12
MIK
E M
CCO
Y
CASE STUDY 1
MARINE ENVIRONMENTAL MONITORING (GREAT BARRIER REEF, AUSTRALIA)
Title eReefs
ServiceMarine environmental monitoring
End usersGovernment agencies, reef managers, policymakers, researchers, industry, local communities
Intermediate users– Queensland and Australian governments (Reef
Report Card)– Integrated Marine Observing System
Application(s)– Marine ecosystem monitoring through Marine Water
Quality Dashboard and ReefTemp tools – Climate impact monitoring and assessment– Adaptation to climate change
Models usedWater optical property models for deriving in-water optical properties and concentrations of optically active constituents from satellite imagery
Climate data records used– SST– Ocean colour (chlorophyll levels, suspended sediments,
dissolved organic matter)
Satellite observations used– MODIS daytime cloud-free VIS/NIR imagery (1x1km)
(for ocean colour)– AVHRR cloud-free imagery (2x2 km) on board
NOAA-18, -19 (for SST)
Agencies that produce records– Bureau of Meteorology as implementing agency,
in conjunction with CSIRO, Australian Institute of Marine Science, Great Barrier Reef Foundation and the Queensland Government
– NASA (MODIS), NOAA (AVHRR)
Sustainability of service (demonstration or ongoing)eReefs commenced in 2012 and is a five year project; it is expected to successfully move to a fully operational information and modelling system
Hardy Reef on the Great Barrier Reef, Australia
SUMMARY

13
NOAA AVHRR
NASA MODIS
NOAA VIIRS
Sea-surface temperature
Ocean colour (dissolved organic matter, chlorophyll)
(>10yrs)
eReefs:– Marine Water
Quality Dashboard: chlorophyll concentration, other water constituents
ReefTemp: – sea-surface
temperature and anomaly
Monitoring of marine water quality and coral bleaching
Climate impact assessment; adaptation for shipping, fishing and tourism
Environmental, socioeconomic data
Integrated Marine Observing System framework
sense create climate data apply decide
use additional data
The eReefs project is a collaboration that contributes to the protection and preservation of the iconic Great Barrier Reef A number of threats, including water quality, climate change, shipping, fishing and coastal development have the potential to detract from the Reef’s natural, cultural and economic value It combines government commitment to Reef protection and science innovation and operation with contributions from leading Australian businesses Using the latest technologies to collate data and leading-edge integrated modelling, eReefs produces powerful visual-isation, communication and reporting tools
The Marine Water Quality Dashboard (Figure 1) is a tool designed to access and visualize a range of water-quality indicators, including near real-time data, more than ten years of records of sea-surface temperatures, chlorophyll levels, sediments and dissolved organic matter derived from ocean-colour observations for the entire Great Barrier Reef Data from the Dashboard can be displayed in various formats including maps, tables and charts Users are able to download data for further analysis and interpretation
Using data captured through satellite remote-sensing, water quality indicators help to determine the type and amount of matter in the water and consequently, how much light is available in the water The amount of light in the water, and concentrations of chlorophyll and sediments can assist in managing sea grass beds and the production of large algae, which may compete with coral for space
These indicators are important to monitor as they can have a great impact on the state and health of the Great Barrier Reef ecosystem
ReefTemp Next Generation is a high-resolution mapping product that provides information on coral bleaching risk for the Great Barrier Reef region Bleaching is a stress response of coral in unfavourable conditions High ocean temperatures are the primary cause of mass coral bleach-ing events Coral mortality appears to increase with the intensity of the bleaching event; intensity is determined by how much and for how long temperatures remain above the maximum mean summer temperatures With future climate change projections indicating increased frequency and severity of mass coral bleaching events, ReefTemp improves our ability to monitor heat stress on the Great Barrier Reef
Linking temperature characteristics to measures of bleach-ing response severity has revealed that multiple heat stress indices allow for a better estimate of bleaching risk than any single measure ReefTemp indices include SST, SST anomaly (+SST), Degree Heating Days (DHD) and Heating Rate DHD are a measure of the accumulation of heat stress, while Heating Rate represents the rate of accumulation of heat stress The combination of indices used has provided consistent and effective estimates of bleaching risk during recent bleaching events in the Great Barrier Reef Marine Park (Figure 2)
INFORMATION FLOW
DESCRIPTION

1414
The eReefs project started in 2012 and is being implemented in three phases over five years Phase one focuses on delivering the building blocks for the project Monitoring, modelling and visualization platforms form the basis of eReefs: they enable the delivery of primary datasets and information to reef managers, scientific researchers and the broader public A key deliverable of phase one was the release of the Marine Water Quality Dashboard and ReefTemp Next Generation products
Phase two of the project comprises extending the capa-bilities established in phase one, including the application of VIIRS spectral data to replace MODIS Aqua Secondary products and services will be developed in consultation with various end users Phase three will incorporate the transition to a fully integrated operational information and modelling system The eReefs project will deliver:
• Expanded and improved monitoring data through the application of the latest measurement technologies
and data delivery tools, such as mobile and internet applications;
• A suite of new and integrated models across paddock, catchment, estuary, Reef lagoon and ocean;
• A framework to research the impact of multiple factors such as temperature, nutrients, turbidity and pH, and to communicate the results of that research to those who will be affected;
• An interactive visual picture of the Reef and its com-ponent parts, accessible to all;
• Public science initiatives to engage the broader community on the health of the Reef;
• Targeted communication products to allow the public to interact with and learn about the Reef, and to contribute monitoring information
Figure 1 . Marine Water Quality Dashboard displaying a monthly composite image of chlorophyll-a concentration, an important indicator of the presence of
green algae (phytoplankton) in the Great Barrier Reef region (April 2015)

1515
Figure 2 . Example of an SST anomaly map for the Great Barrier Reef region obtained through the ReefTemp Next Generation system (http://www .bom .gov .au/environment/activities/reeftemp/reeftemp .shtml)
–4 –3 –2 –1 0 1 2 3 4 °C
16
FLIC
KR
CASE STUDY 2
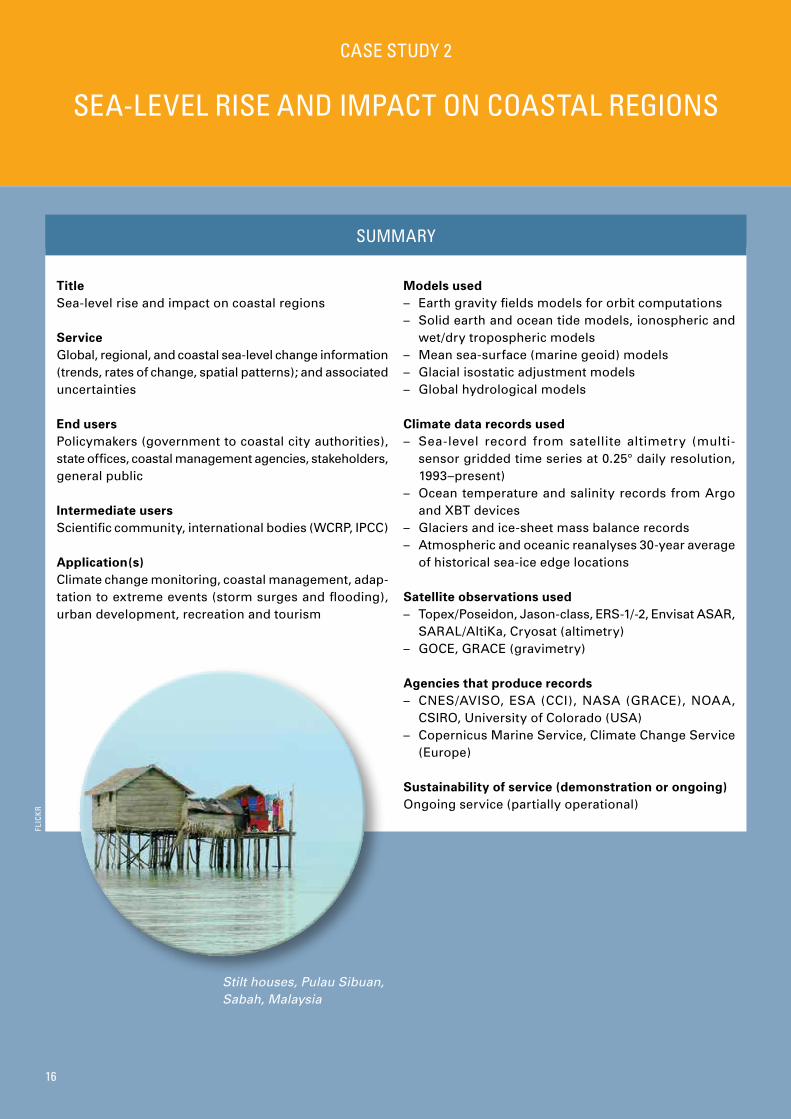
SEA-LEVEL RISE AND IMPACT ON COASTAL REGIONS
Title Sea-level rise and impact on coastal regions
ServiceGlobal, regional, and coastal sea-level change information (trends, rates of change, spatial patterns); and associated uncertainties
End usersPolicymakers (government to coastal city authorities), state offices, coastal management agencies, stakeholders, general public
Intermediate usersScientific community, international bodies (WCRP, IPCC)
Application(s)Climate change monitoring, coastal management, adap-tation to extreme events (storm surges and flooding), urban development, recreation and tourism
Models used– Earth gravity fields models for orbit computations – Solid earth and ocean tide models, ionospheric and
wet/dry tropospheric models – Mean sea-surface (marine geoid) models – Glacial isostatic adjustment models – Global hydrological models
Climate data records used– Sea-level record from satellite altimetry (multi-
sensor gridded time series at 0 25° daily resolution, 1993–present)
– Ocean temperature and salinity records from Argo and XBT devices
– Glaciers and ice-sheet mass balance records– Atmospheric and oceanic reanalyses 30-year average
of historical sea-ice edge locations
Satellite observations used– Topex/Poseidon, Jason-class, ERS-1/-2, Envisat ASAR,
SARAL/AltiKa, Cryosat (altimetry)– GOCE, GRACE (gravimetry)
Agencies that produce records– CNES/AVISO, ESA (CCI), NASA (GRACE), NOAA,
CSIRO, University of Colorado (USA)– Copernicus Marine Service, Climate Change Service
(Europe)
Sustainability of service (demonstration or ongoing)Ongoing service (partially operational)
Stilt houses, Pulau Sibuan, Sabah, Malaysia
SUMMARY

17
Satellite altimetry: Topex/Poseidon, Jason class, ERS-1/2, Envisat, SARAL/AltiKa, Cryosat
Space gravimetry: GOCE (static), GRACE (time-variable field)
In situ systems: Floating buoys (Argo) Tide gauges (GLOSS) Ships carrying expendable bathythermographs (XBT)
Sea-level records from radar altimetry
Ocean-temperature and salinity records
Glacier and ice-sheet mass balance
Atmospheric and ocean reanalyses
Global mean sea levelRegional sea levelRate of sea-level change and related uncertaintyMaps of spatial trend patternsComponents of sea-level budget (ocean mass and thermal expansion)Global climate monitoring
Coastal management including coastal city planning
Adaptation to storm surges and other flood events
Mitigation decision support
Earth gravity field models; solid Earth and ocean tide models; ionospheric and wet/dry tropospheric models; marine geoid; glacial isostatic adjustment model
sense create climate data applydecide
use additional data
Sea levels are presently rising at a sustained rate They will continue to do so in future decades and centuries in response to anthropogenic climate change Sea-level rise is one of the most threatening consequences of global warming and a major concern for populations living in low-lying coastal regions (about 25% of the world’s population) Sea-level rise causes in permanent inunda-tion, shoreline erosion, wetland loss, saltwater intrusion into surface water bodies and aquifers, and rising water tables Figure 1 (IPCC SREX, 2012) shows current and future population exposure to inundation in low-level coastal areas in the case of a 1-in-100-year extreme storm for different sea-level rise scenarios Moreover, in many coastal regions of the world, the impact of sea-level rise is exacerbated by other natural and/or anthropogenic factors (for example, decreased rate of fluvial sediment deposition in deltaic areas, ground subsidence due to tectonic activity or ground-water pumping and hydrocarbon extraction)
Monitoring sea-level variations from global to local levels is essential to estimate how fast sea levels are rising, to understand the physical processes at work and to validate climate models used for projecting future changes This is a major goal and an essential need for the development of coastal adaptation to climate change The service therefore consists of:
• Sea-level records at global, regional and coastal levels (with associated uncertainties);
• Secondary products:– Rate of sea-level rise with associated uncertainties;– Maps of spatial trend patterns in sea levels with
associated uncertainties;– Components of the global mean sea-level budget
(ocean mass based + ocean thermal expansion changes) with associated uncertainties
Background
Sea level is the height of the sea surface expressed either in a geocentric reference frame (absolute sea level) or with respect to the moving Earth’s crust (relative sea level) Absolute sea-level variations result from changes in the volume of water filling ocean basins (either due to water density or mass changes) Relative sea-level variations denote sea-surface height changes with respect to the ground (thus accounting for both absolute sea-level changes and vertical ground motions) Sea-level variations occur on a very broad range of spatio-temporal timescales Sea level is a very good indicator of climate change and variability As the ocean heats up in response to global warming, sea waters expand, which causes sea levels to rise Mountain-glacier melting and ice-mass loss from the ice sheets also
INFORMATION FLOW
DESCRIPTION

1818
cause sea levels to rise In addition, modifications of the land hydrological cycle due to climate variability and direct anthropogenic forcing lead to sea-level variations
Since the early 1990s, satellite altimetry has become the main tool for precisely and continuously measuring absolute sea level with quasi-global coverage and a few days’ revisit time The concept of satellite altimetry measurement is simple: an on-board radar altimeter transmits microwave radiation towards the sea surface, which partly reflects back to the satellite Measurement of the round-trip travel time provides the height of the satellite above the instantaneous sea surface (called ‘range’) The relevant measurement is the sea-surface height above a fixed reference surface (e g the mean sea surface) Sea-surface height is obtained by calculating the difference between the altitude of the satellite above the reference surface (deduced from precise orbitography) and the range measurement The estimated sea-surface height needs to be corrected for various factors due to atmospheric delays, instrumental drifts and bias between successive altimetry missions Other corrections due to geophysical effects, such as solid-Earth, pole and ocean tides are also applied
High-precision satellite altimetry started with the launch of Topex/Poseidon in 1992, followed by several other missions The precision of an individual sea-surface height measurement has now reached 1–2 cm, allowing the global mean rate of rise to be estimated to within ~0 4 mm/yr The temporal evolution of the global mean sea level from
satellite altimetry since early 1993 shows an almost linear increase, at a mean rate of 3 2 ±0 4 mm/yr (Figure 2) For the altimetry period, rises in the sea level result from ocean thermal expansion (~38%), land-ice melt (~50%) and land-water storage change (~12%, mostly due to ground-water pumping) As evidenced by satellite altimetry, sea levels are not rising uniformly (Figure 3) The regional variability in sea-level trends is dominated by large-scale changes in the density structure of the oceans (mainly temperature changes) Those changes are a response to forcing factors (e g heat and fresh water exchange at the sea-air interface and wind stress) and their interactions with the ocean circulation
Figure 1 . For low-elevation coastal areas, current and future (2050) population exposure to inundation in the case of the 1-in-100-year extreme storm for a sea-level rise of 0 .15 m and for a sea-level rise of 0 .50 m
due to the partial melting of the Greenland and West Antarctic Ice Sheets (Handmer et al ., 2012; data from Lenton et al ., 2009)
Figure 2 . Global mean sea-level evolution from multi-satellite altimetry (1993–2015)
Global mean sea level altimetry (LEGOS/CLS)
Sea
leve
l (m
m)
Time (year)

1919
Coastal cities adapting to sea-level rises
With sea-level rise adding to the risk of coastal inundation, in particular during storm surges events, a number of cities have decided to reinforce their coastal protection schemes An illustration is given in Figure 4 of the Netherlands coastline near Rotterdam (Jonkman et al , 2013) More generally, as concerns grow over sea-level rise impacts in coastal areas (temporary and permanent submersion, shoreline erosion), more precise information on projected sea-level rises and the probability of storm surges need to be developed to better inform coastal planning policies Available simulations show that sea-level rises drastically increase storm surge-related flooding in low-lying coastal areas (Figure 5, Pedreros et al , 2011) For efficient and timely adaptation planning, coastal managers require a range of advanced sea-level products based on observations and modelling, including regional and/or probabilistic projections and global to local observations
References
Handmer, J , Y Honda, Z W Kundzewicz, N Arnell, G Benito, J Hatfield, I F Mohamed, P Peduzzi, S Wu, B Sherstyukov, K Takahashi and Z Yan, 2012: Changes in impacts of climate extremes: human systems and ecosystems In: Managing the Risks of Extreme Events and Disasters to Advance Climate Change Adaptation. Special Report of the Intergovernmental Panel on Climate Change (C B Field, V Barros, T F Stocker, D Qin, D J Dokken, K L Ebi, M D Mastrandrea, K J Mach, G -K Plattner, S K Allen, M Tignor, and P M Midgley, eds ) Cambridge and New York, Cambridge University Press
Jonkman, S , M Hillen, R Nicholls, W Kanning and M van Ledden, 2013: Costs of adapting coastal defences to sea-level rise — new estimates and their implications Journal of Coastal Research, 29(5):1212–1226
Lenton, T , A Footitt, and A Dlugolecki, 2009: Major Tipping Points in the Earth’s Climate System and Consequences for the Insurance Sector Gland, World Wide Fund for Nature and Munich, Allianz SE
Pedreros, R , C Vinchon, E Delvallée, S Lecacheux, Y Balouin, M Garcin, Y Krien, G Le Cozannet, B Poisson, J Thiebot, F Marche and P Bonneton, 2011: Using a multi models approach to assess coastal exposure to marine inundation within a global change context Geophys. Res. Abstr., 13:EGU2011–13679
Rijkswaterstaat, 2009: Nourishment presentation of Mr Alex Roos (Ministry of Transport, Public Works and Water Management, the Netherlands) for the municipality of The Hague
Figure 3 . Spatial trend patterns in sea level from multi-satellite altimetry, 1993–2014 (mm/yr)
Figure 5 . Simulation of local coastal flooding in a low-lying area of the north-western Mediterranean
(Languedoc-Roussillon, France) during a storm surge event (the 1982 storm) for different sea-level rise scenarios; maximum water height (m) reached
for each scenario is shown (By permission, BRGM; Pedreros et al ., 2011)
Figure 4 . Maeslant storm surge barrier (near Rotterdam) and the Eastern Scheldt barrier
(Rijkswaterstaat, 2009 and Jonkman et al ., 2013)

20
MIC
HA
EL S
PEN
CER
Title Establishing flood climatologies and prediction skills
ServiceFlood management and climate change; disaster risk reduction in high-impact weather
End usersGovernments (Australia initially), river basin management authorities, Global Flood Partnership, European Flood Awareness System, provincial and local authorities, international donor agencies such as the World Bank, humanitarian relief services such as the World Food Programme
Intermediate usersResearch institutes and academia
Application(s)Flood risk assessment and forecasting
Models used– Variable Infiltration Capacity (VIC), a macroscale
hydrological model which solves full water and energy balances and uses reanalysis precipitation datasets to simulate flows into the coupled
– LISFLOOD-FP, a 2D hydrodynamic model, specifically designed to simulate floodplain inundation in a compu-tationally efficient manner over complex topography (Bates et al , 2010; Neal et al , 2012)
Climate data records used– Benchmarking with continent-wide flow gage records
spanning 40 years (1973–2012) – Reanalysis of precipitation incorporating a range of
climate data records– ICESat canopy (Simard et al , 2011)– Lakes and reservoirs from the Global Lakes and
Wetlands database
Satellite observations used– Landsat flooded area, MODIS flood product, MODIS
snow, MODIS evaporation, SAR flood maps, radar and ICESat altimetry for water levels and canopy heights, SRTM-DEM topography
– Planned within the VIC model: SMAP soil moisture, MODIS snow cover
Agencies that produce recordsJPL, NASA, WWF
Sustainability of service (demonstration or ongoing)Proof of concept; intended for open-access use of flood-event climatologies
Flash flooding in Perth, Australia, 2010
SUMMARY
CASE STUDY 3
ESTIMATING FLOOD CLIMATOLOGIES AND PREDICTION SKILLS (AUSTRALIA)

21
SRTM-DEM Landsat
MODIS, SAR, radar and ICESat altimetry
SMOS, Aquarius, SMAP
Landsat imagery record
Intermittent and short-term records from other missions
40-year floodplain inundation climatology for Australia
Comparison of observed flood events using Landsat, MODIS and SAR with model
Insurance sector, water and flood management, civil protection, adaptation to climate change
Humanitarian aid
2D hydrodynamic model (LISFLOOD-FP), using SRTM-DEM corrected with ICESat canopy heights, MODIS evaporation, SMAP soil moisture and others
sense create climate data apply decide
use additional data
To improve flood climatologies and flood prediction skills, a database is being generated new which deals with observed or simulated flood-event inundation and magnitude at continental to global scales The only dataset compiled to date which shows a consistent but spatially and temporally discontinuous history of flood-inundation area and extent at a near-global scale is provided by the Dartmouth Flood Observatory at MODIS and the NASA GSFC near real-time flood mapping archive The proof of concept study for the flood event database was presented by Schumann et al (2014a) It uses a computationally efficient 2-D hydrodynamic model (LISFLOOD-FP; Bates et al (2010), Neal et al (2012)) complemented with a sub-grid channel formulation to generate a complete flood inundation climatology of the past 40 years (1973–2012) It will initially be for the entire Australian continent (Figure 1) at 1-km floodplain resolution and based on gauged stream-flow records This dataset can easily be downscaled if a higher-resolution digital elevation model is available (Schumann et al , 2014b)
Generating the flood-event database is based on SRTM-DEM topography, MODIS and Landsat flood
records, ICESat and radar altimeters (water levels), SAR-derived flood maps, and a range of other snow and soil moisture-related products Use of SMOS and SMAP soil moisture data and the planned SWOT mission is being explored The floodplain inundation climatology has been compared to Landsat flood-event observations
The modelling chain used for generating the flood-event database is similar to that used for the operational European Flood Awareness System (EFAS (Thielen et al , 2009)) and the Global Flood Awareness System (GLOFAS (Alfieri et al , 2013)) EFAS was improved by assimilating satellite data, such as MODIS snow cover (Thirel et al , 2013) EFAS has been operational since 2012 and works under the auspices of the European Copernicus emergency management service
The flood-climatology database allows for the con-tinental-scale assessment of flood-event impacts, improves forecasting and reanalysis of such events and is potentially very useful for the research, industrial and humanitarian sectors
INFORMATION FLOW
DESCRIPTION

2222
References
Alfieri, L , P Burek, E Dutra, B Krzeminski, D Muraro, J Thielen and F Pappenberger, 2013: GloFAS – global ensemble streamflow forecasting and flood early warning Hydrol. Earth Syst. Sci., 17:1161–1175, doi:10 5194/hess-17-1161-2013
Bates, P D , M S Horritt and T J Fewtrell, 2010: A simple inertial formulation of the shallow water equations for efficient two-dimensional flood inundation modelling Journal of Hydrology, 387(1–2):33–45
Neal, J , G Schumann and P D Bates, 2012: A subgrid channel model for simulating river hydraulics and floodplain inundation over large and data sparse areas Water Resources Research, 48 (W11506), doi:10 1029/2012WR012514
Schumann, G , K M Andreadis, J C Neal and P D Bates, 2014a : A 40-year flood inundation climatology at
continental scale Global Flood Working Group Meeting, 4–6 March 2014, ECMWF, Reading, UK
Schumann, G J -P , K M Andreadis and P D Bates, 2014b : Downscaling coarse grid hydrodynamic model sim-ulations over large domains Journal of Hydrology, 508:289–298
Simard, M , N Pinto, J Fisher and A Baccini, 2011: Mapping forest canopy height globally with spaceborne lidar Journal of Geophysical Research, 116:G04021, doi:10 1029/2011JG001708
Thielen, J , J Bartholmes, M -H Ramos and A De Roo, 2009: The European Flood Alert System – Part 1: Concept and development Hydrol. Earth Syst. Sci., 13:125–140
Thirel, G , P Salamon, P Burek and M Kalas, 2013: Assimilation of MODIS Snow Cover Area Data in a Distributed Hydrological Model Using the Particle Filter Remote Sens 5:5825–5850
Figure 1 . Maximum flood hazard in Australia over 40 years based on gauged flow records . Maximum hazard is here defined as H(V+1 .5), where V is the maximum velocity in each cell over the simulation
time and H is the water depth in each cell at the time of maximum velocity . Hazard is increasing from white-yellow-orange to red; the purple patches are lakes and reservoirs that do not represent a hazard .

2323
OX
FAM
EA
ST A
FRIC
A
CASE STUDY 4
DROUGHT MONITORING IN EASTERN AFRICA
Title Drought monitoring in Eastern Africa
ServiceSeasonal climate outlook for the Greater Horn of Africa countries
End usersDecision- and policymakers from a variety of sectors in the member countries of the Intergovernmental Authority on Development (IGAD)
In Kenya: County directors of meteorology, hydroelectric power sector, Ministry of Agriculture, Ministry of Water and Irrigation, farming community (large- and small-scale), general public, commerce sector, transport sector, researchers, academia, Red Cross, Ministry of Health, Ministry of Devolution and Planning, private sector
Intermediate usersNMHSs in IGAD member countries, ICPAC, ACMAD, UKMO, International Research Institute for Climate and Society, University of Nairobi
Application(s)Seasonal forecasting, adaptation to climate variability and change
Models used– Empirical statistical models– Models from Global Producing Centres (UKMO, NCEP)
Climate data records used– Precipitation, air temperature, wind speed and direc-
tion, water vapour, pressure, sea-surface temperatures, cloud cover, NDVI, outgoing longwave radiation
– Derived climate indices (e g , Indian Ocean Dipole)
Satellite observations usedIn addition to the use of many satellite data used in Global Producing Centres, the service uses:– Quantitative precipitation estimates (SEVIRI, TRMM);– Cloud cover, NDVI (SEVIRI)
Agencies that produce records– All satellite operators providing data to Global
Producing Centres– NASA (TRMM), NOAA (AVHRR), EUMETSAT (SEVIRI)
Sustainability of service (demonstration or ongoing)Operational and ongoing
The village chairman, Waridaad,Somalia
SUMMARY

2424
MSG SEVIRI
TRMM
AVHRR
Climatological time series of temperature, precipitation, wind speed, humidity
Climate indices (MJO, QBO, ENSO)
Seasonal climate outlook
Adverse warning for both drought and potential floods
– Drought mitigation
– Food security– Agriculture– Water resource
management– Hydropower
generation– Health sector– Environment– Provincial
and local communities
Forecasts by Global Producing Centres using a wide range of satellite (and other) data
sense create climate data apply decide
use additional data
Context
Drought leads to serious consequences The severity of drought, often defined by its length, affects many sectors of society, such as agriculture (in terms of crop production and livestock rearing: Figure 1), water resource manage-ment, hydropower generation, and the health sector This can lead to significant economic, environmental and societal loss if preventive or mitigating measures are not taken in time Seasonal forecasts, together with satellite monitoring products such as a vegetation index, can help to detect drought conditions at an early stage and to assess the likelihood and extent of droughts in the Greater Horn of Africa region
Satellite-derived sea-surface temperature measurements play a major role in seasonal forecasting in the region, especially when extreme climate events take place A La Niña occurs when sea-surface temperatures fall below average over the eastern and central Pacific Ocean This is usually echoed by a similar fall over the western Indian Ocean The net effect is a decrease in precipitation over most of the Greater Horn of Africa region, which in turn leads to drought When similar conditions occur in consecutive seasons, the result is a devastating drought
The opposite conditions during El Niño result in increased rainfall over the region Sea-surface temperatures rise above average over the eastern and central Pacific while similar conditions occur in the western Indian Ocean
Empirical statistical models usually derived from linear regres-sion analyses make use of independent variables or predic-tors to estimate seasonal rainfall probability Those include sea-surface temperature, sea-surface temperature gradients, other climate indicators (such as the Indian Ocean Dipole, the Southern Oscillation Index, and the Quasi-Biennial Oscillation) and outgoing longwave radiation Seasonal forecasts provided by WMO Global Producing Centres for Long-Range Forecasts (GPC) assist further
The position, orientation and intensity of the intertropical convergence zone, which is a seasonal weather-determin-ing feature, is easily identified by cloud imagery from the EUMETSAT geostationary satellite, Meteosat Though such imagery is best for short-range weather forecasts, its strength, activity and evolution in a given season is a good indicator of the likely severity of an impending drought or flood
The satellite-derived normalized difference vegetation index (NDVI) is a biomass indicator over a region and
INFORMATION FLOW
DESCRIPTION

2525
is obtained from a climate time series derived from the geostationary Meteosat The NDVI and its anomalies play a big role in the determination of the amounts of vegetation likely to grow In case of impending drought, vegetation indices from previous season(s) can be used to project the degree of the drought severity
Flow of information
Satellite data from a wide range of instruments con-tributing to the WMO Global Observing System are received by various data-processing and numerical weather prediction centres, including GPCs It is from these centres that the described service receives vari-ous datasets relevant to seasonal forecasting Besides satellite observations and derived products, the service makes use of a variety of climatological data from in situ observation stations
Long-term datasets of measurements derived from sat-ellite observations of relevant variables are combined with atmospheric models and the model output from GPCs to generate tailored datasets of measurements relevant to drought, flood or general seasonal forecasting In conjunction with ICPAC, the Kenya Meteorological Department and all other IGAD members organize regular sessions, usually corresponding to the main seasons in the Greater Horn of Africa region There are normally two rainy seasons in most of the eastern African countries, corresponding to the seasonal shift of the Inter-Tropical Convergence Zone
The seasonal forecasts start with a meeting known as Pre-COF, which is to prepare for a main meeting, the Climate Outlook Forum Weather experts share their knowledge
and make use of all the available tools, expertise and data to develop a seasonal outlook for the IGAD region
Pre-COF plays the double role of developing the seasonal forecasts and delivering training to new professionals from the IGAD region Local and international forecasters from the region thus ensure that professional capacity continues to be built up across the region During pre-COF, prognoses are also referred to as a consensus forecast, since they involve resources and expertise from many countries
Pre-COF is followed by the main Climate Outlook Forum usually held on a rotational basis in one of the IGAD member countries Other partners are from time to time invited to the Forum, including NCEP, IRI, UK Met Office and WMO
Based on the outcomes of the Forum, the Kenya Meteorological Department immediately calls a wide vari-ety of meteorological application users for a briefing on the seasonal forecast These include county directors of meteorology and radio and television media organizations The Department goes a step further and translates the seasonal weather forecast into various local languages which are then aired on television and radio channels The Department also broadcasts weather briefings via internet radio to local communities in their mother tongues, of which there are so many in Kenya
Seasonal climate monitoring and forecasting has been going on for a long time in the region Since the formation of ICPAC in the 1980s, both the Kenya Meteorological Department and ICPAC have always joined hands in developing seasonal forecasts for the Greater Horn of Africa region Sustainability is achieved via funding from ICPAC member countries and other funding organizations and partners
Figure 1 . Impacts of drought: herdsmen in search of water in a drying well for starving cattle, with vegetation also in dry condition

26
NEI
L PA
LMER
(CIA
T)
Title Crop monitoring in Eritrea
ServiceBulletins of crop yield forecasts
End users– Local authorities in the region concerned (Eritrean
institutions, national agencies)– European policy entities and development funds
providers such as DG DEVCO
Intermediate usersEuropean Commission Joint Research Centre (EC-JRC)
Application(s)– Anomalies of meteorological and vegetation conditions
for Eritrea in the Kremti season (main annual harvest) – Climate monitoring
Models usedECMWF reanalysis data for precipitation
Climate data records usedTime-series and climatologies for precipitation and NDVI
Satellite observations used– Satellites (and other) data used in ECMWF reanalysis– Metop, SPOT-VGT, AVHRR (for NDVI), PROBA-V
Agencies that produce records– All satellite operators providing data to ECMWF– EUMETSAT (Metop), NOAA (AVHRR), SPOT-Image
(SPOT-VGT)– EC-JRC (crop products)
Sustainability of service (demonstration or ongoing)Sustained service for European users; ad-hoc service to third-party countries
A farmer at work,Eritrea
SUMMARY
CASE STUDY 5
CROP MONITORING IN ERITREA

27
Satellite data used in ECMWF reanalysis
Metop, SPOT-VGT, AVHRR
Precipitation reanalysis
NDVI
Bulletins of crop-yield forecast for Eritrea
Development policy and implementation
CAP (Europe)
Agriculture and food security (Eritrea)
Commodity markets
Ancillary data layers in JRC crop mask uses global land-cover analyses
sense create climate data apply decide
use additional data
The Monitoring Agricultural Resources (MARS) Unit of the European Commission Joint Research Centre has been devel-oping and running a crop-yield forecasting system since 1992 in order to provide timely crop production forecasts at European level The Unit, also known as the MARS Crop Yield Forecasting System, monitors crop vegetation growth (including cereal, oil seed crops, protein crops, sugar beet, potatoes, pastures and rice) It also monitors the short-term effects of meteoro-logical events on crop production, and provides seasonal yield forecasts of key European crops The Unit’s activities contribute to the evaluation of global production estimates for crops such as wheat and maize and support the management decisions of the Common Agricultural Policy (CAP) The MARS Crop Yield Forecasting System is a complex, integrated analysis tool, comprising remote sensing and meteorological observations, meteorological forecasts, agrometeorological and biophysical modelling, and statistical analysis capabilities
While the crop-yield forecasts for Europe are produced on a regular basis, other main producing areas of the world receive increasing attention, since global commodity markets increasingly influence the CAP Therefore, the MARS Crop Yield Forecasting System is being extended in its simulation capacities to methodologies tailored to other crop-producing regions Its crop-yield forecasts are also being gradually extended towards key regional production areas across the world
The present example focuses on Eritrea The country’s economy largely depends on subsistence agriculture, with
two thirds of the population earning their living through subsistence farming and pastoralism This makes them vulnerable to climate variability
There are three distinct rainy seasons in Eritrea: Bahri rains from December to February in the eastern coastal lowlands, Azmera rains between March and May in the highlands (Debub and Maekel regions) and the Kremti rains from June to September over the whole country apart from the coastal plain The Kremti crops form the basis of the main annual harvest
Bulletins of crop-yield forecast for Eritrea provide a rapid overview of the meteorological and vegetation conditions of the Kremti season, focussing on cultivated areas, due to the Kremti’s importance for agricultural production Major crops that grow during that season include wheat, barley and teff in the highlands, maize at intermediate altitudes, short-cycle sorghum and pearl millet at lower altitudes and sesame, which is mainly grown in the Gash Barka region
The analyses based on satellite imagery and meteoro-logical data (Figure 1) indicate above-average vegetation conditions and no major concerns for the 2014 Kremti season Moreover, the abundant and well-distributed rains throughout the season could ensure the first good harvest in years Harvesting is expected to start normally at the beginning of November with a good production forecast for the main agricultural areas
INFORMATION FLOW
DESCRIPTION

2828
Figure 1 . Monthly vegetation conditions (NDVI) compared to the historical average (2007–2013) . “1st July 2014” denotes the first 10 days of July 2014, “2nd July 2014” the second 10 days of July 2014, etc .
Source: METOP-NDVI
Very poorPoor
NormalGood
Very goodNo data

29
AU
SAID
, AU
STR
ALI
AN
GO
VERN
MEN
T
CASE STUDY 6
DROUGHT MONITORING AND ASSESSMENT (CHINA)
Title Drought Monitoring and Assessment (China)
ServiceMonitoring of drought indicators (basic service), gen-eration of additional products and analyses in case of drought (special service)
End usersDecisionmaking service of the China Meteorological Administration (CMA); provincial governments and agriculture services
Intermediate usersNational Climate Centre; provincial meteorological bureaus
Application(s)Operational climate monitoring
Models usedThermal inertia soil model
Climate data records used– Land surface temperature (2002 onwards)– NDVI (2002 onwards)
Satellite observations used– NOAA AVHRR, FY-2E (basic service)– FY-3 MWRI (special service)
Agencies that produce recordsNational Satellite Meteorological Center, National Climate Center
Sustainability of service (demonstration or ongoing)– Operational service – Dissemination of information via reports and website – Improvements concerning spatial, seasonal and phys-
ical geography – Construction of long-term drought monitoring database
Blowing sand, China
SUMMARY

3030
NOAA AVHRR
In situ temperature, precipitation and soil moisture observations
Land surface temperature record (2002–present)
NDVI record (2002–present)
Temperature and precipitation records (in situ)
Analysis of vegetation and soil state
Drought indices (PDI, MPDI)
Nationwide drought monitoring image
Drought mitigation measures in agriculture and water management
Precipitation estimates (FY-2E) Soil moisture (FY-3/MWRI) Soil thermal inertia model
sense create climate data apply decide
use additional data
Introduction
The National Satellite Meteorological Center (NSMC) of the China Meteorological Administration (CMA) began to devise a drought-monitoring operation involving satellite-based remote sensing in 2002 A complete drought-monitoring system is now operating, including research into and the application of several drought-mon-itoring methods, the development of software, optimi-zation of data-process flow and the dissemination of drought-monitoring products and services
Services provided
The goal of the NSMC/CMA drought-monitoring operation is to provide satellite remote sensing products and services to the public and to support national and local governments to plan prevention measures End users of NSMC/CMA satellite drought-monitoring products include the CMA department of decisionmaking, the Ministry of Agriculture of China and the general public Intermediate users of the products include the CMA National Climate Center and provincial meteorological bureaus The application division of the Center uses surface observation data to monitor and assess the effect of severe climate events, including severe drought
Two kinds of service are provided:
(1) Basic services
Under normal conditions, a nationwide drought-monitoring remote-sensing image using polar-orbit meteorological satellite data and a corresponding analytical report are generated and disseminated by the NSMC every ten days The image and report are published on the website of the NSMC remote sensing application and released to several operational service systems The products can therefore be explored and referred to by decisionmakers at the CMA, drought-monitoring and early warning specialists at the National Climate Center and staff at provincial meteorological bureaus
(2) Special services
If a severe drought event occurs, the CMA pays special attention to the drought area and monitors and assesses the intensity and the development of the drought CMA increases monitoring frequency in the drought area and deploys other satellite products, such as those that deal with precipitation estimation, land-surface temperature, evapotranspiration, vegetation, fire spot and water body area This enables CMA to monitor the change of the severe drought and evaluate its effect NSMC disseminates analytical reports to the CMA department of decision-making Within two days, CMA provides a special report to the Ministry of Agriculture and the State Council of
INFORMATION FLOW
DESCRIPTION

3131
China with recommended actions for drought mitiga-tion The provinces and local meteorological bureaus where the drought has occurred are then advised to take action Monitoring information is therefore useful to help decisionmakers to understand the impact of the severe drought in order to propose effective prevention measures
Example
The benefits of the service are illustrated using the example of a severe drought that occurred in south-west China from autumn 2009 until early summer 2010
The extreme lack of precipitation during that period caused a severe and lasting drought in the provinces of Yunnan, Guizhou and Sichuan, in Chongqing City and the Guangxi Autonomous Region Water supplies from reservoirs were insufficient and many rivers, brooks, wells, springs and lakes dried out Residents and livestock suffered from the shortage of drinking water, and local agriculture sustained significant losses
According to the accumulation of precipitation estima-tion using data derived from the FY-2E geostationary meteorological satellite (Figure 1), total rainfall from 1 November 2009 until 28 February 2010 in the south of
Sichuan, most of Yunnan, the mid-west of Guizhou and Guangxi, was less than 100mm
Images of ten-day land-surface temperature anomalies (Figure 2) demonstrated that temperatures between 1 September 2009 and the end of March 2010 had been higher than the average for the same period since 2002 in the south-west of China
The drought began to develop from the beginning of November 2009 The meteorological satellite drought-mon-itoring images (Figure 3) showed that there had been a mild drought on a large scale in the north and middle part of Yunnan in the first ten days of January Since then, the drought area in the south-west of China enlarged and the drought gradually intensified The severe phase of the drought reached its peak during the middle ten days of March 2010 After light precipitation in the last ten days of March, the drought began to weaken The severe phase weakened dramatically in early May and ended completely in the first ten days of July 2010 The anomalies in the vegetation index images (Figure 4) showed that vegeta-tion growth was affected by the long-term phase of the drought The drought also caused a significant increase fire risk According to NSMC satellite monitoring results, from January until March 2010, fire spots in Yunnan and in Guizhou reached an eight-year high (Figure 5)
Figure 1 . Accumulation of precipitation estimation in south-west China for the period 1 September 2009–28 February 2010,
based on data from the geostationary satellite FY-2E
Unit: mmno rain1 ~ 1010 ~ 2525 ~ 5050 ~ 100100 ~ 200200 ~ 400400 ~ 800
> 800
Legend

3232
Figure 2 . Anomaly of land surface temperature in south-west China for March 2010 (left: first ten days, center: middle ten days, right: last ten days)
severe drought moderate drought slight drought non-drought water body desert cloud/snow
Figure 3 . Drought monitoring image for south-west China using NOAA/AVHRR (first ten days of each month, 2010)
January February March
April May June
>11
10
8
6
4
2
0
–2–4–6
–8
–10
<–11
unit: °C

3333
Figure 5 . Fire hot-spot statistics using meteorological satellite (October 2009–June 2010)
Figure 4 . Vegetation monitoring image for south-west China using NOAA/AVHRR (first ten days of each month, 2010)
January February March
April May June
–0.65
–0.06
0.06
0.15
0.23
0.29
1.00
Monthly number of hot spots in south-west of ChinaOct . 2009–Jun . 2010
Nu
mb
er o
f h
ot
spo
ts
3434
Models and satellite data used
In drought-monitoring operations CMA applies a thermal inertia model (resistance of soil to thermal change) Soil moisture correlates positively with thermal inertia in the soil but negatively with diurnal temperature difference of the upper soil layers Diurnal temperature difference of the upper soil layers can be obtained from meteoro-logical satellite data CMA uses the regression method to construct a model that integrates agrometeorological sample observing data and remote satellite data
CMA also tries to adopt the Perpendicular Drought Index and the Modified Perpendicular Drought Index by using reflectances in the Red and near-infrared spectral bands to monitor severe drought events Soil moisture data from FY-3/MWRI has been used to monitor severe drought events since 2012
Land-surface temperature (2002 until the present, NOAA/AVHRR, NSMC, 1 1 km) and NDVI (2002 until the present, NOAA/AVHRR, NSMC, 1 1 km) are used to compile satellite-derived climate data records If a severe drought occurs, FY-3/MWRI is used
Further developments
(1) Improvements in remote sensing drought-monitoring methods and its accuracy The construction of specific models that take into consideration spatial, seasonal and physical geographical differences
(2) Construction of a long-term drought database using remote sensing products, such as NDVI, LST and evapotranspiration
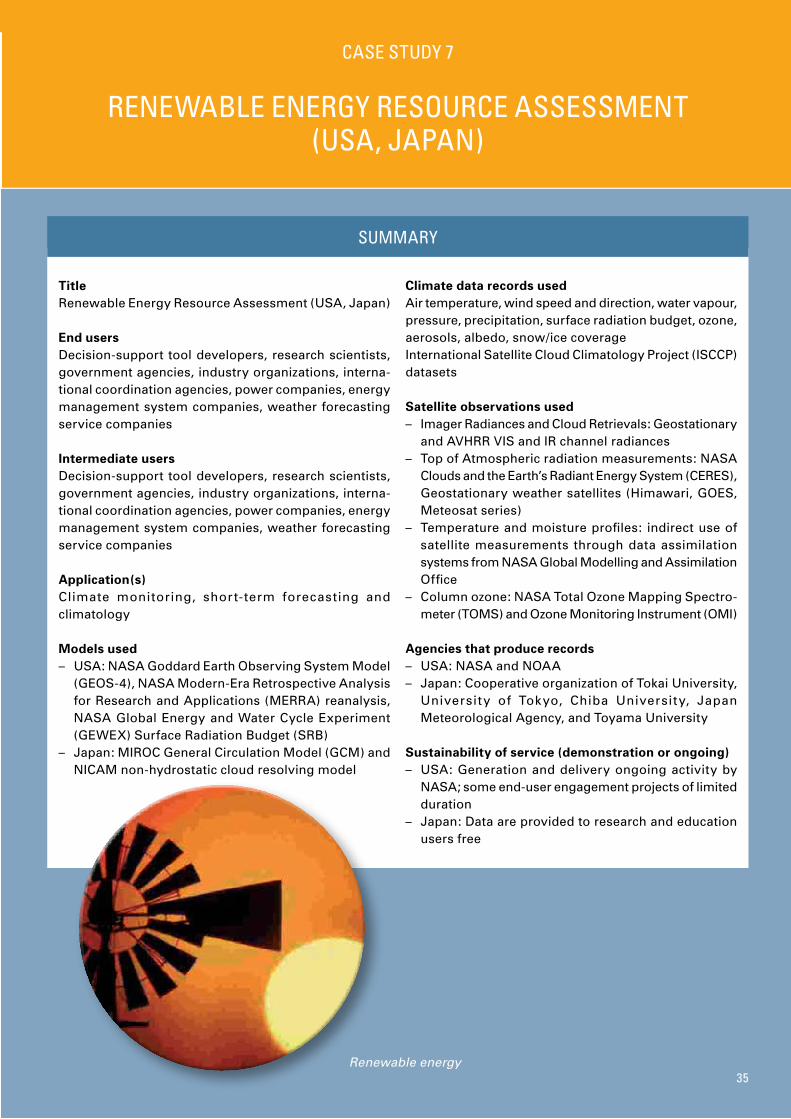
353535
CASE STUDY 7
RENEWABLE ENERGY RESOURCE ASSESSMENT (USA, JAPAN)
TitleRenewable Energy Resource Assessment (USA, Japan)
End usersDecision-support tool developers, research scientists, government agencies, industry organizations, interna-tional coordination agencies, power companies, energy management system companies, weather forecasting service companies
Intermediate usersDecision-support tool developers, research scientists, government agencies, industry organizations, interna-tional coordination agencies, power companies, energy management system companies, weather forecasting service companies
Application(s)Climate monitoring, short-term forecasting and climatology
Models used– USA: NASA Goddard Earth Observing System Model
(GEOS-4), NASA Modern-Era Retrospective Analysis for Research and Applications (MERRA) reanalysis, NASA Global Energy and Water Cycle Experiment (GEWEX) Surface Radiation Budget (SRB)
– Japan: MIROC General Circulation Model (GCM) and NICAM non-hydrostatic cloud resolving model
Climate data records usedAir temperature, wind speed and direction, water vapour, pressure, precipitation, surface radiation budget, ozone, aerosols, albedo, snow/ice coverageInternational Satellite Cloud Climatology Project (ISCCP) datasets
Satellite observations used– Imager Radiances and Cloud Retrievals: Geostationary
and AVHRR VIS and IR channel radiances– Top of Atmospheric radiation measurements: NASA
Clouds and the Earth’s Radiant Energy System (CERES), Geostationary weather satellites (Himawari, GOES, Meteosat series)
– Temperature and moisture profiles: indirect use of satellite measurements through data assimilation systems from NASA Global Modelling and Assimilation Office
– Column ozone: NASA Total Ozone Mapping Spectro-meter (TOMS) and Ozone Monitoring Instrument (OMI)
Agencies that produce records– USA: NASA and NOAA– Japan: Cooperative organization of Tokai University,
University of Tokyo, Chiba University, Japan Meteorological Agency, and Toyama University
Sustainability of service (demonstration or ongoing)– USA: Generation and delivery ongoing activity by
NASA; some end-user engagement projects of limited duration
– Japan: Data are provided to research and education users free
Renewable energy
SUMMARY

3636
NASA CERES, TOMS; OMI
AVHRR
Geostationary VIS/IR imagery
In situ: Air temperature, wind speed and direction, water vapour, pressure, precipitation, surface
Top-of-atmosphere radiation
Column ozone
Earth radiation budget
ISCCP datasets
Reanalyses
Climatology, near real-time monitoring or short-term forecast of variable used for renewable energy site (wind, surface irradiance)
Renewable energy sector decisionmaking (site selection)
Crop yield forecasting
Building design
Financial sector
Power companies
Atmospheric models
MTSAT/Himawari-8 radiances and derived cloud, aerosol, water vapour
sense create climate data apply decide
use additional data
Background
As renewable energy is increasingly used in electric power systems, there has been increasing interest in the instability of renewable energy sources such as solar radiation and wind The availability of these resources varies over time, independent of power demands; mete-orology and geophysics can contribute to solving this problem Clouds, aerosols, and water vapour are the most important atmospheric components that affect levels of solar irradiance reaching the ground These components have been well examined and can be estimated
Satellite-derived measurements
• Estimates of solar radiation (derived from multiple imagers and Earth radiation budget satellite sensors) scaled to the Earth’s surface using measurements and satellite-derived climatologies of clouds, ozone, and aerosols;
• Measurements of surface winds (derived from mete-orological reanalyses);
• A range of other atmospheric parameters, such as temperature and relative humidity used to assess the potential of renewable energy resources at a given location across a variety of scales ranging from the individual household to large solar thermal power generation projects
Cloud cover is an important atmospheric phenomenon that affects ground-level solar radiation The optical thick-ness and particle size of clouds are primary parameters for estimating solar irradiance They are retrieved from multi-spectral images obtained from satellite sensors One application for such cloud properties is to estimate the solar irradiance penetrating the atmosphere which subsequently reaches the ground Ground-level solar irradiance can be estimated by fast radiative transfer calculations using inputs of cloud properties retrieved from satellite imagery
In addition to the constellation of low Earth orbiting sat-ellites, the constellation of meteorological geostationary satellites are useful for gathering such information because they observe the Earth (except for the Polar Regions) at high temporal frequency and moderate spatial resolution (around 1 km) A new generation of geostationary sat-ellites, due to be introduced between 2015 and 2020 will dramatically improve performance They will observe 16 spectral bands from visible to infrared every 10 minutes or more frequently Satellite measurements such as from Himawari-8 will therefore be increasingly useful for wide-area monitoring of ground-level solar radiation at high spatial and temporal resolutions (Takenaka et al , 2009)
Global models
Developing global models that investigate cloud sys-tems and solar radiation is important for renewable
INFORMATION FLOW
DESCRIPTION

3737
energy-related short-term forecasting Non-hydrostatic cloud-resolving models are efficient for this purpose Japan has been developing a model that is composed of the Nonhydrostatic Icosahedral Atmospheric Model and the Spectral Radiation-transport Model for Aerosol Species for estimating solar irradiance for a given time and location Since the cloud evolution process is influenced by the existence and species of aerosols, it is important that models consider aerosol inventories and transport in addition to cloud evolution processes Ground-level solar irradiance is currently estimated using global models However, further improvements related to the cloud evolution process are needed, such as the downsizing of the grid system and assimilation of in situ data and other data sources A general circulation model commonly used for estimating the climate system is also used for estimating solar radiation over ten-day time periods Output from the general circulation model is useful for investigating power demands and estimating potential renewable energy over tens or hundreds of years Models for short- and long-term forecasting of solar radiation need to be used for energy management systems, and relevant methods are still being improved (Nakajima et al , 2013) Those questions are addressed in the Terrestrial Energy Estimation by Diurnal Data Analyses project The project investigates energy management systems and forms part of a research programme under the Japan Science and Technology Agency
Weather forecasts at various time scales (from daily to seasonal to climatic) are used to optimize load forecasts by power utilities, to better integrate intermittent sources of energy into the electrical grid and to aid longer-term infrastructure planning While not strictly related to terrestrial climate change, space weather observations (made in the near space environment) assist in the pre-diction of potential damage to national grids, due to solar energetic particle precipitation, a phenomenon which follows multiple time scales
Validation
Validation of solar radiation estimated from satellite measurements and model simulations is important for the quality control of data Japanese researchers use the SKYNET ground validation system, which includes pyranometers, sun photometers and other kinds of radi-ometers This provides not only measurements of direct and diffuse components of solar radiation, but also mea-surements of atmospheric parameters, such as aerosol and cloud properties that affect solar irradiance due to scattering and absorption Solar radiations obtained from SKYNET have been compared with results estimated from geostationary weather satellites The results showed that the root mean square error (RMSE) was around 80 W/m2 Cumulus clouds with a spatial scale of several hundred
metres increase the RMSE, because the horizontal spatial resolution of geostationary weather satellite imagery is generally 1 km or larger More information about SKYNET can be found at http://atmos cr chiba-u ac jp/
Research and end-use examples
In the United States of America, the need for customized data projects that are easily accessible and useable by non-technical end users was recognized through stakeholder engagement (Zell et al , 2008) The NASA Langley Research Center produced a 22-year dataset of energy-relevant quantities called the Surface Meteorology and Solar Energy (SSE) dataset The long data time series allows for examination of the effects of interannual vari-ability and long-term trends which are possibly related to climate change impacts NASA is presently funding a project to add Geographic Information System capability to SSE and support mobile device access The project will enable expanded usage while still supporting the older text based delivery systems and will provide simpler pathways for future data enhancements
NASA, DLR, the École des Mines de Paris and other organizations have worked with the International Energy Agency to improve solar resource standardization using space-based and surface-based data sources (http://task46 iea-shc org/) As a boundary organization with connections to multiple government and industry end users International Energy Agency can improve the uptake and enhance the value of space-based measurements for a large set of decisionmaking purposes
The RETScreen clean energy project analysis software is run by Natural Resources Canada It is an example of an end-to-end project where data from Earth observations are directly ingested into a decision support tool NASA has partnered with Natural Resources Canada since 2000 by providing data from the SSE dataset as input into the RETScreen system The global NASA SSE dataset augments input parameters in regions where ground-based data are sparse or non-existent RETScreen uses both ground-based and satellite-derived climate data in a seamless fashion, via a city database or a direct query to SSE in the case of queries submitted online As a result, the end-user is not concerned with the IT challenges of importing unfamiliar datasets into the decision support system RETScreen is freely available on the Web at http://www retscreen net and is used globally Natural Resources Canada provides manuals, video tutorials, and on-site training throughout the world The decision support tool is used to evaluate a wide range of renewable energy and energy efficiency technologies from resource assessment, emission reduction and financial viability perspectives for small-scale projects to large-scale power generation projects (Eckman and Stackhouse, 2012)
3838
RETScreen director Greg Leng commented: “The RETScreen Clean Energy Management Software now has more than 430 000 users in every country and is available in 36 lan-guages that cover two-thirds of the world’s population Solar and climate data are key inputs into the software Satellite-derived data provided by NASA has been used by most of these users to implement thousands of renewable energy, energy efficiency, and cogeneration projects across the globe ”
NASA has also maintained a partnership with the United States National Renewable Energy Laboratory (NREL) and provided data products for use in the HOMER dis-tributed power optimization model While this deci-sion support tool is now being developed privately, a version continues to be available free of charge at http://www homerenergy com/ HOMER is a computer model that enables the evaluation of design options for both off-grid and grid-connected power systems for remote, stand-alone and distributed generation applications HOMER uses a variety of NASA data products, including the SSE dataset, as meteorological and solar energy inputs to the model These data products are obtained via a direct query to the SSE web service (similar to the RETScreen link to SSE) making them readily available to the user The HOMER system is now maintained and distributed by Homer Energy LLC and has been downloaded by over 50 000 users worldwide
Researchers at the NASA Langley Research Center are work-ing with the heating and air conditioning industry, and the United States Department of Energy to explore the utility of space-based observations to improve and update standards manuals for the heating and air-conditioning industries
References
Eckman, R S and P W Stackhouse Jr , 2012: CEOS contributions to informing energy management and policy decisionmaking using space-based Earth observations Appl. Energy, 90:206–210
Nakajima, T , H Takenaka, D Goto, S Misawa, J Uchida and T Y Nakajima, 2013: Measurements and modelling of the solar radiation budget Journal of the Japan Society for Simulation Technology, 199–207
Takenaka, H , T Y Nakajima, A Higurashi, A Higuchi, T Takamura and R Pinker, 2011: Estimation of solar radiation by neural network based on radiative transfer J. Geophys. Res., 116, doi:10 1029/2009JD013337
Zell, E , J Engel-Cox, R Eckman and P Stackhouse Jr , 2008: Application of satellite sensor data and models for energy management IEEE JSTARS, 1–17, doi: 10 1109/JSTARS 2008 2001142

393939
SHU
TTER
STO
CK.C
OM
CASE STUDY 8
SOLAR ENERGY POTENTIAL IN COMPLEX TERRAIN (SWITZERLAND)
Title Solar energy potential in complex terrain (Switzerland)
ServiceMSG SEVIRI-based Solar Energy Mapping including the radiative effects of topography and bright surface targets, by use of the Heliomont algorithm
End usersRenewable energy companies, communal and regional infrastructure planners, home owners, architects, climate research scientists, agriculture (farmers, wine growers), regional NWP and climate modellers
Intermediate users– Solar energy professionals – Electricity grid operators – Government agencies – Agricultural and hydrological modellers – Solar cadastre builders – Private meteorological companies
Application(s)Climate monitoring and analysis; generation of climatology
Models usedTotal column water vapour and ozone data from the operational forecast and the ERA interim reanalysis provided by the European Centre for Medium Range Weather Forecasts (ECMWF)
Climate data records usedGround-based surface solar irradiance measurements of the SwissMetNet national meteorological observa-tion network and the global Baseline Surface Radiation Network (BSRN), for development and validation
Satellite observations usedMSG SEVIRI inter-calibrated radiances from the High Resolution Visible and 0 6, 0 8, 1 6, 10 8, 12 0 μm channels, at 15-minute temporal resolution
Agencies that produce records– EUMETSAT (MSG SEVIRI) and ECMWF (atmospheric
boundary conditions)– MeteoSwiss (climatological solar energy maps)
Sustainability of service (demonstration or ongoing)– Operational service: monthly mean and anomaly
radiation maps for Switzerland– Demonstration service: Near real-time direct beam
diffuse and direct normal irradiance for customer-de-fined areas in Europe and Africa
Solar panel
SUMMARY

4040
MSG SEVIRI geostationary imagery
Atmospheric data based on ECMWF reanalyses
Surface solar irradiance (2004–present)
Mapping roof-level spatio-temporal solar energy exploitation potential
Monthly updated surface solar irradiance including topographic effects
Renewable energy sector
Home owners
Agriculture
National grid operators
Electricity companies
Digital elevation modelRoof area, tilt and orientation
sense create climate data apply decide
use additional data
Description
Renewable energy sources have started to play an increas-ing role in the energy infrastructure of our society However, compared to traditional energy sources, the production, transport and use of renewable energy from solar, wind and hydropower has a higher dependency on meteorological and climatological boundary conditions Therefore, the precise knowledge of such conditions and their variability through space and time is important in order to optimize decentralized production, to synchronize it to actual usage and to secure the stability of networks which transport energy across national boundaries Supporting the energy sector with knowledge and tailored information useful for planning and operational purposes is one of the activities of the National Centre for Climate Services (NCCS) of Switzerland, which the Centre implements according to GFCS recommendations
Geostationary satellite data has complemented sparse station-based Surface Solar Irradiance (SSI) measure-ments since the early 1980s, particularly for mapping spatio-temporal solar energy potential Compared to monthly mean station-based SSI measurements, the Heliosat method (Cano et al 1986) can achieve uncertainty levels of below 5%
The availability of a scientific method does not, however, guarantee consistent and continuous multi-decadal climate data records Very few SSI climate data records exist that provide a climatologically homogeneous time series
between heritage satellite systems (such as Meteosat First Generation (MFG) Meteosat Visible and InfraRed Imager (MVIRI)) and more recent systems (such as Meteosat Second Generation (MSG) Spinning Enhanced Visible and Infrared Imager (SEVIRI)) Heliosat, like other satellite-based retrieval algorithms, makes the simplified assumption of a plane-parallel dark surface target which offers visual contrast to bright clouds These basic requirements are not met in complex, snow-covered terrain, such as the Swiss Alps and other high-altitude and high-latitude areas MeteoSwiss thus engages as a partner of the EUMETSAT Satellite Application Facility on Climate Monitoring (CM SAF) to further develop algorithms and climate data records that satisfy climatological homogeneity criteria and can be used in all terrain A 28-year SSI climate data record (1983-2010) covering the entire Meteosat disc has been produced (Posselt et al , 2012) MeteoSwiss has also developed the Heliomont method (Stöckli, 2013)
Heliomont derives SSI maps from MSG SEVIRI data, model data of total column water vapour and ozone data from the operational ECMWF forecast and the ERA interim reanalysis SEVIRI data are used at 15-minute, hourly, daily, monthly and yearly intervals Special care is taken over snow-cloud separation using infrared channels and topography shading effects at the sub-kilometre spatial scale (Figure 1) Monthly updated visualizations of SSI mean and anomaly data across Switzerland are publicly available (MeteoSwiss, 2015) Monthly updated SSI mean and anomaly data at 2-km resolution for Switzerland are available through the MeteoSwiss data subscription service Near real-time
INFORMATION FLOW
DESCRIPTION

4141
direct and diffuse normal irradiance at 15-minute intervals, downscaled to 25-m spatial resolution for a customer-defined geographic region within Europe and Africa is currently in demonstration mode and can be provided on request
The Heliomont climate data records are available for the MSG period since 2004 It features realistic SSI estimates for mountainous regions with the highest SSI levels occurring over snow-covered mountain peaks (Figure 1) The real socioeconomic value of such a satellite-based SSI dataset was demonstrated for two Alpine regions during the EU Interreg project PV ALPS This project created solar potential maps for regional decisionmakers by merging the Heliomont climate data records with land-use planning and photovoltaic power production estimates As a consequence, the Heliomont climate data records are now applied in a country-wide solar cadastre showing the roof-level photovoltaic and solar heating potential for the whole of Switzerland (Figure 2) They also support national climate monitoring activities (Figure 3), are used for deriving agricultural suitability maps, and enable the evaluation of the COSMO NWP model
References
Cano, D , J M Monget, M Albuisson, H Guillard, N Regas and L Wald, 1986: A method for the determination of the global solar-radiation from meteorological satellite data Solar Energy, 37:31–39
MeteoSwiss, 2015: http://www meteoswiss admin ch/home/climate/present-day/monthly-and-annual- maps html
Posselt, R , R W Müller, R Stöckli and J Trentmann, 2012: Remote sensing of solar surface radiation for climate monitoring – the CM-SAF retrieval in international comparison Remote Sens. Environ., 118:186–198
Stöckli, R , 2013: The HelioMont Surface Solar Radiation Processing Scientific Report 93, MeteoSwiss
Figure 1 . Annual mean surface solar irradiance (kWh m–2) for Switzerland calculated from MSG SEVIRI data using the Heliomont method; cropped area: 25-m resolution downscaled data including the local-scale radiative
effects of topography surrounding the Monte Rosa alpine hut (circle)
1 600
1 550
1 500
1 450
1 400
1 350
1 300
1 250
1 200
1 150
1 100
1 050
1 000
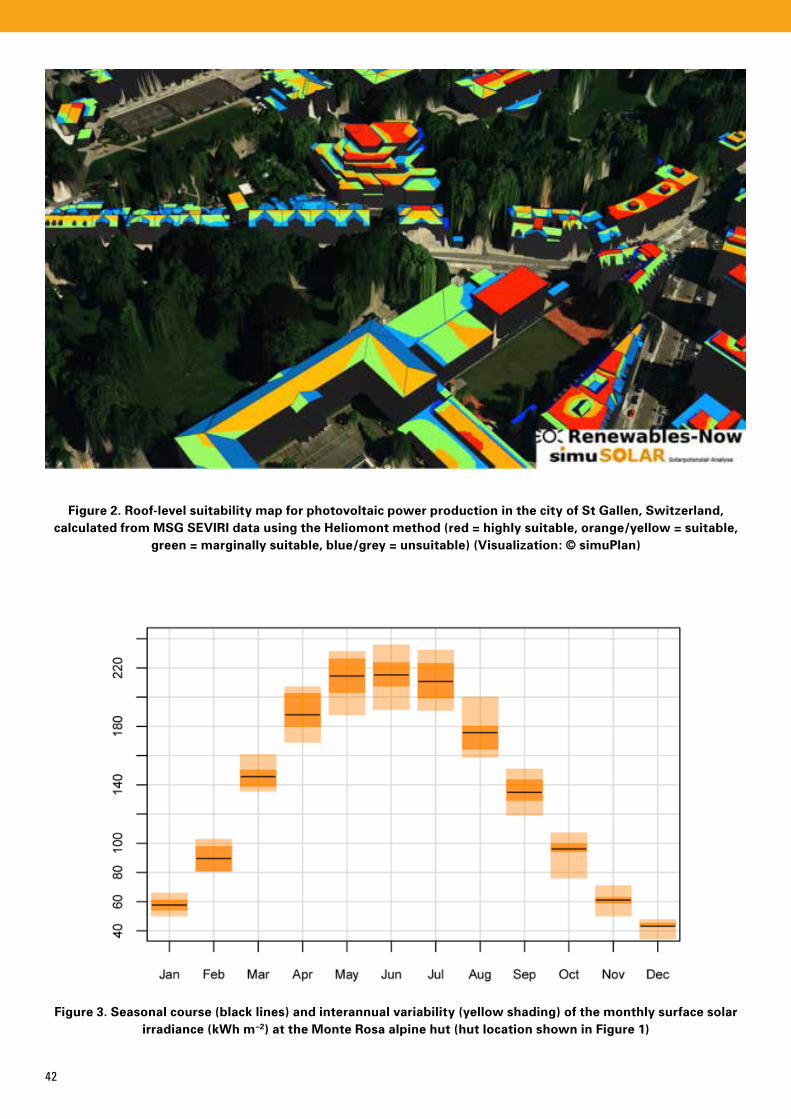
4242
Figure 2 . Roof-level suitability map for photovoltaic power production in the city of St Gallen, Switzerland, calculated from MSG SEVIRI data using the Heliomont method (red = highly suitable, orange/yellow = suitable,
green = marginally suitable, blue/grey = unsuitable) (Visualization: © simuPlan)
Figure 3 . Seasonal course (black lines) and interannual variability (yellow shading) of the monthly surface solar irradiance (kWh m–2) at the Monte Rosa alpine hut (hut location shown in Figure 1)

434343
CASE STUDY 9
PROJECTING NATURAL GAS DEMAND (NORTH-EASTERN UNITED STATES)
Title Natural gas production and pricing using Madden-Julian Oscillation (MJO) satellite analyses
Service2–6 week forecast of natural gas demand in the north- eastern United States of America
End usersHome owners and businesses using natural gas
Intermediate usersConsulting meteorologists
Application(s)Short-term statistical climate forecasting and climate monitoring
Models usedStatistical model of satellite-derived Madden-Julian Oscillation state and surface temperatures
Climate data records usedOutgoing longwave radiation
Satellite observations usedHIRS (1978–present)
Agencies that produce recordsNOAA and Cooperative Institute for Climate and Satellites North Carolina (CICS-NC)
Sustainability of service (demonstration or ongoing)Ongoing (http://monitor cicsnc org/mjo/current)
Natural gas stove
SUMMARY
FLIC
KR

4444
NOAA HIRS (1978–present)
In situ air temperature sensors
Outgoing longwave radiation
Near-surface air temperature
Statistical 2–6 week forecast of temperature regime in NE USA
Energy sector (users of natural gas, gas supply companies, power companies)
N/A
sense create climate data apply decide
use additional data
It is no surprise that energy demand in the United States of America is driven by changes in temperatures Forecasting those temperatures as far in advance as possible is a top priority for energy companies Numerical models are useful for predictions of up to about a week, but their accuracy drops off after that For longer-term predictions, forecasters in the energy sector often rely on statistical techniques and historical analogues
Climate data records are ideal inputs into those statistical models As climate data records have been homogenized, forecasters can be sure that the model will not be affected by data changes through time Satellite proxies for tropical rainfall, like outgoing longwave radiation, are particularly valuable They can identify patterns in the tropics that drive a significant part of the global circulation These patterns also evolve slowly enough to provide higher levels of accuracy for the longer-term predictions that the energy sector needs
Figure 1 shows an example of how outgoing longwave radiation can be used to anticipate weather patterns over the United States The Madden–Julian Oscillation is a large area of tropical rainfall that takes about 30 days to move eastward around the globe In both panels, the rainfall is enhanced near Indonesia and Australia (green shading), although there is a noticeable difference near
Hawaii The lower panel has a large area of enhanced rainfall that is not in the upper panel
The contours identify changes in the global circulation The red contours generally correspond to areas that are warmer than usual, while the blue contours are cooler than normal The patterns in the two panels are practically reversed over North America
As those differences can be persistent, they have been identified with a newly developed index, the Multivariate Pacific–North American index (MVP) (Schreck et al , 2013), in order to infer temperature anomalies in the continental United States Satellite observations of outgoing longwave radiation play a key role in this index By using the MVP and other Madden–Julian Oscillation diagnostics on the website monitor cicsnc org/mjo, forecasters in the energy industry will be better prepared to meet the demands of future temperature extremes
Reference
Schreck, C J , J M Cordeira and D Margolin, 2013: Which MJO events affect North American temperatures? Mon. Wea. Rev., 141:3840–3850, doi:10 1175/MWR-D-13-00118 1
INFORMATION FLOW
DESCRIPTION

4545
Figure 1 . Composite outgoing longwave radiation anomalies (shading) and 200-hPa streamfunction anomalies (red and blue contours every 5x10⁶ m2s–1) for real-time multivariate Madden–Julian Oscillation phase 5
when MVP >0 .75 (top) and MVP <0 .75 (bottom) . Only outgoing longwave radiation anomalies that are 95% significant are shaded . Red contours (for example, in lower panel over the North-eastern United States) are
generally associated with warm surface temperature anomalies . The numbers in the top right denote how many events were used in each composite .
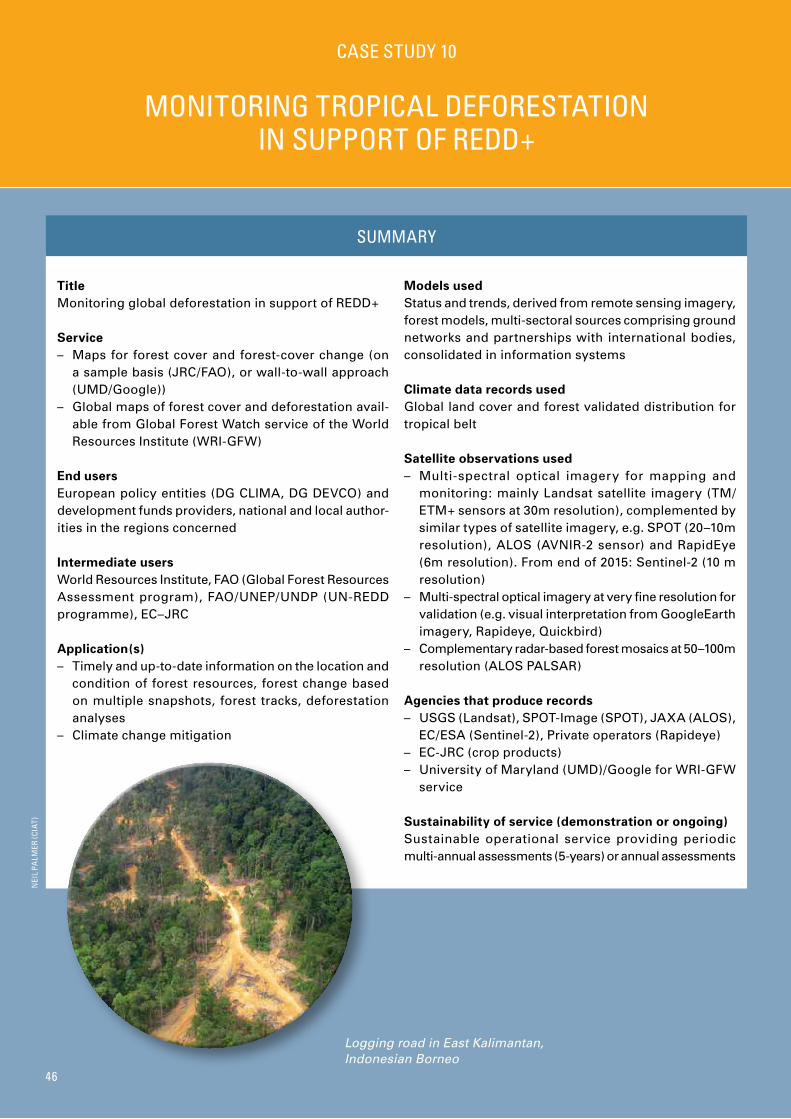
4646
CASE STUDY 10
MONITORING TROPICAL DEFORESTATION IN SUPPORT OF REDD+
46
NEI
L PA
LMER
(CIA
T)
Title Monitoring global deforestation in support of REDD+
Service– Maps for forest cover and forest-cover change (on
a sample basis (JRC/FAO), or wall-to-wall approach (UMD/Google))
– Global maps of forest cover and deforestation avail-able from Global Forest Watch service of the World Resources Institute (WRI-GFW)
End usersEuropean policy entities (DG CLIMA, DG DEVCO) and development funds providers, national and local author-ities in the regions concerned
Intermediate usersWorld Resources Institute, FAO (Global Forest Resources Assessment program), FAO/UNEP/UNDP (UN-REDD programme), EC–JRC
Application(s)– Timely and up-to-date information on the location and
condition of forest resources, forest change based on multiple snapshots, forest tracks, deforestation analyses
– Climate change mitigation
Models usedStatus and trends, derived from remote sensing imagery, forest models, multi-sectoral sources comprising ground networks and partnerships with international bodies, consolidated in information systems
Climate data records usedGlobal land cover and forest validated distribution for tropical belt
Satellite observations used– Multi-spectral optical imagery for mapping and
monitoring: mainly Landsat satellite imagery (TM/ETM+ sensors at 30m resolution), complemented by similar types of satellite imagery, e g SPOT (20–10m resolution), ALOS (AVNIR-2 sensor) and RapidEye (6m resolution) From end of 2015: Sentinel-2 (10 m resolution)
– Multi-spectral optical imagery at very fine resolution for validation (e g visual interpretation from GoogleEarth imagery, Rapideye, Quickbird)
– Complementary radar-based forest mosaics at 50–100m resolution (ALOS PALSAR)
Agencies that produce records– USGS (Landsat), SPOT-Image (SPOT), JAXA (ALOS),
EC/ESA (Sentinel-2), Private operators (Rapideye) – EC-JRC (crop products)– University of Maryland (UMD)/Google for WRI-GFW
service
Sustainability of service (demonstration or ongoing)Sustainable operational service providing periodic multi-annual assessments (5-years) or annual assessments
SUMMARY
Logging road in East Kalimantan, Indonesian Borneo

4747
Satellite optical imagery (Landsat, SPOT, ALOS), very fine resolution data
Synthetic aperture radar
Global land cover
Forest validated distribution for tropical belt
Maps of forest cover and change, deforestation on annual and 5-yearly basis
Climate mitigation policy REDD initiative
Development funds providers
National and local policy and forest authorities
Forest validation data
sense create climate data apply decide
use additional data
As global environmental problems affect the security and prosperity of European Union (EU) citizens, the EU is a key player in global efforts towards sustainable development and climate change mitigation The EU uses its various instruments which facilitate its engagement with third world countries on issues that are of global concern, such as climate change and environmental protection
The outcome documents of the Rio+20 United Nations Conference on Sustainable Development include a frame-work for action on forests (UN, 2012) The framework includes three elements First, it calls for enhanced efforts to achieve sustainable forest management, reforestation, restoration and afforestation Second, it supports all efforts that slow, halt and reverse deforestation and forest degradation in an effective manner Third, it notes the importance of ongoing international initiatives such as activities for Reducing Emissions from Deforestation and Forest Degradation in Developing Countries (REDD+) under the United Nations Framework Convention on Climate Change (UNFCCC)
The service presented here contributes to the assessment of EU and global forest resources Timely and up-to-date infor-mation on the location and condition of forest resources, and internationally-agreed methods for the monitoring, reporting and verification component of REDD+ are needed to properly define, target, implement and evaluate policies related to the UNFCCC and the EU Forest Law Enforcement Governance and Trade scheme (FLEGT)
The information derived provides quantitative measure-ments of changes in global forest resources with a focus on Eurasia and the tropics A single system consolidates information on status and trends derived from remote sensing, forest models, multi-sectoral sources comprising ground networks, and partnerships with international bodies These can be synthesised into data maps such as those in Figure 1 From a technical aspect, the European Commission Joint Research Centre provides tools for the monitoring of forest ecosystems which rely heavily on data from Earth-observing satellites The system generates regional forest maps, tracks areas of rapid forest change and produces estimates of changes in forest cover for the current and previous decades Other forest monitoring initiatives using satellite data, such as the DETER and PRODES programmes of the Brazilian National Institute for Space Research (INPE) and the World Resources Institute (using MODIS, CBERS and Landsat data) are complemented by the service
The service supports the development of the European climate change policy, especially concerning REDD+ Biomass maps and carbon emission estimates will be produced for selected tropical forest ecosystems The Joint Research Centre products will be made available as input to future climate change impact scenarios in support of the UNFCCC The products also play a role in developing internationally-agreed methods to estimate greenhouse gas emissions that result from deforestation in developing countries
INFORMATION FLOW
DESCRIPTION
Logging road in East Kalimantan, Indonesian Borneo

4848
The Joint Research Centre’s activities, products and services presented here also support the EuropeAid programme of the European Commission Directorate-General for Development and Cooperation (DG DEVCO) The Centre’s objectives for EuropeAid are to strengthen the capacity of tropical countries and the tropical region to monitor forest resources (in the framework of REDD+ or FLEGT)
Remote sensing data is essential in monitoring deforesta-tion Deforestation monitoring is crucial so that countries may benefit from REDD+ Products and services derived from remote sensing data provide vital information that can be used for the National Greenhouse Gas Inventories in the forestry sector and that will contribute to spatially explicit national reporting in line with IPCC guidelines
To enhance the Global Forest Resource Assessment using satellite data, FAO and the Joint Research Centre produced the Global Remote Sensing Survey (FAO, 2009; 2015) Remote sensing is complementary to Forest Resource Assessments: until 2015 they have mainly been based on national data that countries have provided to FAO
in response to a common questionnaire FAO would then compile and analyse the information and present the current status of the world’s forest resources and their changes over time The assessments have a wide scope and a comprehensive perspective on global forest resources, their management and use
References
FAO, EC-JRC, SDSU and UCL, 2009: The 2010 Global Forest Resources Assessment Remote Sensing Survey: an outline of the objectives, data, methods and approach Forest Resources Assessment Working Paper 155 Rome, FAO and FRA RSS partners
FAO, 2015: Global Forest Resources Assessment – The Global Remote Sensing Survey, http://www fao org/forestry/fra/remotesensingsurvey/en/
United Nations, 2012: The future we want United Nations General Assembly Resolution 66/288, http:/ /sustainabledevelopment un org/futurewewant html
Figure 1 . Time 1, 2 and 3 imagery (above) combined into a multi-data image (below) with segmentation polygons overlaid (in yellow) . Clearings present in time 1 (1990) appear red, new clearings in time 2 (2000) appear blue, and new clearings in time 3 (2005) appear light green . The single polygon layer from segmentation includes all of this
information and will contain classification labels for each time period .

494949
CASE STUDY 11
SEA-ICE EDGE MONITORING FOR POLAR NAVIGATION (CANADA)
Title Sea-ice edge monitoring for polar navigation (Arctic Canada)
ServiceAssessment of sea-ice conditions in support of Inuit communities’ access to safe travel routes and hunting areas
End usersInuit communities
Intermediate users– Noetix Research Inc – Environment Canada
Application(s)– Navigation planning– Fishing and wildlife harvest support– Climate monitoring, climate change adaptation
Models usedN/A
Climate data records used30-year average of historical sea-ice edge locations
Satellite observations usedRADARSAT–1/–2, ASAR/Sentinel–1
Agencies that produce recordsCSA, ESA, MDA Canadian Data Processing Facility (for pre-processing)
Sustainability of service (demonstration or ongoing)Ongoing service (initiated during International Polar Year 2007–2008)
Polar bear, Spitsbergen, Norway
SUMMARY
SHU
TTER
STO
CK.C
OM

5050
Synthetic aperture radar imagery (CSA RADARSAT–1/-2, Envisat ASAR, EC/ESA Sentinel-1)
Optical imagers (AVHRR)
30-year historical record of sea-ice edge (floe) locations
Open water, land-fast, and moving ice location
Floe edge position
Maps of variability in sea-ice extent
Marine transport and navigationArctic travel routesAgriculture, fisheries and huntingClimate modelling Climate change adaptation
Near-real time satellite-based sea-ice products
sense create climate data apply decide
use additional data
Long-term satellite observations of the Arctic Ocean show trends in reduced sea-ice extent and thickness (Figure 1) However, these trends are not easily transformed into local consequences for sea-ice conditions, which are dependent on geographical contexts The unpredictability of local sea-ice conditions has raised concerns among Canada’s
Inuit and other indigenous Arctic communities Sea ice is critical to the ways in which they travel and hunt It determines wildlife harvest destinations, travel routes, modes of transport, amounts of fuel needed and travel safety In Canada, Inuit communities have started to use satellite products to evaluate safe on-ice travel routes
INFORMATION FLOW
DESCRIPTION
Figure 1 . Decrease in minimum sea-ice extent (observed: upper two figures) and climate projections (modelled: bottom three figures)
Source: Hugo Ahlenius, UNEP/GRID-Arendal
–2010–2030 2040–2060 2070–2090
1982 2007

5151
Traditionally, weather conditions and geographic refer-ence points were used to determine travel routes In the past, the latter were used to evaluate sea-ice conditions That assessment was based on an interpretation of how terrestrial characteristics influence sea-ice formation, stability and decay However, the nature of the changes in sea-ice conditions is becoming increasingly unpredictable
The initiative of Canada Ice Services focuses on sup-plementing traditional Inuit knowledge with Synthetic Aperture Radar data on sea-ice conditions The final product is accessible to non-technical end users
Synthetic Aperture Radar is an active microwave sat-ellite sensor that can operate day and night, and is not obstructed by clouds The underlying physical principles of the sea-ice edge (Floe-Edge) product rely on differences in surface and volume scattering of the radar beam The contrasts between water, wet first-year ice and multi-year ice are enhanced by the use of both horizontal and vertical polarisation with varying incidence angles
Data post-processing is undertaken by Noetix Research Inc, which provides the Web-based Floe-Edge service
under the auspices of Canadian Ice Service/Environment Canada, a division of the Meteorological Service of Canada
Periodic satellite data are necessary in order to provide a useful service to the Inuit communities Product updates may be as frequent as 3–5 times per week across the Northwest Territories, Nunavut and Nunavik (Figure 2; Figure 3 with details of a product)
Jimmie Qaapik from the Inuit community says that climate change is affecting the daily lives of Inuit communities in the high latitudes of Canada, but that they are adapting to these changes with the help of new technology:
“During the dark season and after storms, radar images are a necessity: they allow us to safely navigate through smooth and rough ice and tell us where the floe edge is We now know better and faster what happened to the ice This is important also for fishing, hunting and getting drinking water This technology keeps us safe ” (http://www bio-medicine org/biology-news-1/Climate---the-hot-topic-in-Doha-27767-2/)
Figure 2 . Regions for which Canada Ice Service provides the latest known ice cover information in Canadian waters; Noetix Research Inc analyses data across the Northwest Territories (Western Arctic),
Nunavut (Eastern Arctic) and Nunavik, Quebec (Hudson Bay)
Moins de 1/101 – 3/10
4 – 6/107 – 8/10
9 – 9+/1010/10
Terre
Aucunes données
ICE IN CANADIAN WATERS
GLACES DANS LES EAUX CANADIENNES
Legend / LégendeLess than 1/10
1 – 3/10
4 – 6/107 – 8/10
9 – 9+/1010/10
Land
No data
Moins de 1/101 – 3/10
4 – 6/107 – 8/10
9 – 9+/1010/10
Terre
Aucunes données
Scale /echelle

5252
Figure 3 . Example of Floe-Edge Service product
Legend
Floe Edge
Moving ice open water
Land fast ice
30 year average
© RADARSAT-2 MacDonaldDettwiler and Associates LTD .,
2013 All Rights Reserved
Supported by:Canadian Space AgencyEuropean Space AgencyCanadian Ice Services /Environment Canada

535353
CASE STUDY 12
MALARIA EARLY WARNING SYSTEM IN THE SOLOMON ISLANDS USING SEASONAL CLIMATE OUTLOOKS
Title Malaria early warning system in the Solomon Islands using seasonal climate outlooks
Service– Use of relationship between El Niño/Southern
Oscillation (ENSO) index and malaria incidence to build a prototype early warning system for public health authorities
– Satellite-derived sea-surface temperature data (a crit-ical component of the ENSO index)
End usersMinistry of health, local public health organizations
Intermediate usersSolomon Islands Meteorological Service
Application(s)– Seasonal climate outlooks and predictions– Prediction of malaria incidence– Warnings and advisories to public health authorities
Models usedN/A
Climate data records used– Precipitation, temperature (maximum, minimum), rel-
ative humidity 1975–2007 (in situ records on Solomon Islands)
– AVHRR-derived SST 1982–present (used in calculating SST anomalies for the ENSO index)
– ICOADS SST
Satellite observations usedAVHRR instrument flown on NOAA POES series and EUMETSAT Polar System
Agencies that produce records– Solomon Islands Meteorological Service (for in situ
CDRs)– NOAA, EUMETSAT (for AVHRR)
Sustainability of service (demonstration or ongoing)Pilot project, with prospect for transition into an opera-tional information and warning service
Close-up of a mosquito
SUMMARY
SHU
TTER
STO
CK.C
OM

5454
In situ systems:– Rain gauges– Temperature
and relative humidity sensors
TAO ocean buoy array
Satellite imagery:Advanced Very High Resolution Radiometer (AVHRR) on NOAA POES series and EUMETSAT Polar System
Precipitation, temperature (max, min), and relative humidity records 1975–2007
Sea-surface temperature records and anomalies
Seasonal climate outlooks and predictions using the ENSO index
Warnings and advisories on positive incidence ratios for malaria per geographical subregion
Preventive measures to curb malaria incidence
Public health management
Adaptation to climate variability
Malaria incidence ratios 1975–2008Population dataOrography, geographic specifics
sense create climate data apply decide
use additional data
Climate variability and malaria incidence
Malaria is a leading cause of death in the Solomon Islands (WMO, 2011) The age-adjusted death rate of approximately 30 per 100 000 of population ranks the tropical western Pacific islands as 33rd in the world Malaria continues to have high economic and social costs including low pro-ductivity at work and absenteeism in schools The impact of climate change on the health sector is also significant (WMO/WHO, 2012)
Mosquitoes can carry Plasmodium falciparum, a life-threat-ening form of malaria parasite, which accounts for 60–70% of all confirmed cases in the Solomon Islands Epidemics tend to occur when environmental conditions such as rainfall, temperature and relative humidity create optimal conditions for mosquito breeding
The climate of the Solomon Islands is significantly influenced by the El Niño/Southern Oscillation (ENSO) phenomenon El Niño conditions are generally associated with below-aver-age rainfall and above-average temperatures, while La Niña conditions are generally associated with above-average rainfall and below-average temperatures The tendency for the ENSO phenomenon to develop and then persist makes it possible to forecast seasonal rainfall and other hydroclimatic variables with some accuracy, employing
key climate indices such as the Southern Oscillation Index and patterns of sea-surface temperature anomalies
The Niño3 4 central equatorial sea-surface temperature anomaly index is an important and commonly accepted indicator of central tropical Pacific El Niño conditions (Reynolds and Smith, 1994; IOC, 2015) The index is used for detecting and predicting the ENSO phenomenon (Figure 1) It is calculated using satellite-derived sea-surface tempera-tures (mainly from AVHRR data), and in situ observations from the Tropical Atmospheric Ocean project moored buoy array The sea-surface temperature anomaly is calculated relative to climatological seasonal cycle-based data col-lected between 1982 and 2005 and using the International Comprehensive Ocean-Atmosphere Dataset (ICOADS; Woodruff et al , 2011) Climate satellite records with higher precision (for example, (A)ATSR) but less geographical and temporal coverage are used to correct biases in the AVHRR record (GHRSST, 2015)
In combining local climate records of temperature and rainfall, malaria incidence data and a standard ENSO sea-surface temperature anomaly, there is potential to forecast elevated risk periods of malaria outbreaks in the Solomon Islands with a sufficient lead time to reduce the potential incidence of the disease through targeted control strategies
INFORMATION FLOW
DESCRIPTION

5555
Figure 1 . Ocean-temperature (surface and subsurface) and rainfall patterns over the Pacific during El Niño, La Niña and normal conditions (NOAA, 2015) . The ENSO phenomenon has a significant
impact on weather conditions in the Pacific Ocean and beyond, changing the likelihood of heavy rainfall and droughts in many parts of the world .
A prototype malaria early warning system
The application of seasonal forecasts to the development of a prototype malaria early warning system in the Solomon Islands has been the objective of a project funded by the Australian government The project was defined and carried out in close collaboration with key users of the system, the Solomon Islands Meteorological Service and the Solomon Islands Medical Training and Research Institute, so that climate information could be effectively integrated into decisionmaking The project formed part of a larger pilot programme funded by Australia to support Pacific islands’ management of and responses to climate variability and change in vulnerable sectors, such as health
A principal objective of the project was to develop malaria outlooks based on the historical relationship between malaria incidence and the effects of the ENSO phenomenon on rainfall and temperature The influence of temperature on malaria development appears to be non-linear (IPCC, 2014) and vector-specific (Alonso et al , 2011) Analyses in East Africa show that abundance, distribution and disease transmission are affected in different ways by precipitation and temperature (Kelly-Hope et al , 2009) Determining the precise nature of those relationships in the Solomon Islands was therefore a key component of the project and the subject of lengthy investigation
Once the relationships were well understood, it became possi-ble to develop a prototype early warning system: the National Meteorological Service could issue bulletins signalling periods in which future climate conditions were likely to favour high malaria incidence; medical services and residents could then take measures to minimise infection It is also expected that such forecasts would provide sufficient lead time for healthcare services to efficiently incorporate into their planning the need for additional medical resources during these periods
Lessons from data
In collaboration with the Solomon Islands Medical Training and Research Institute, records of both confirmed and suspected malaria cases for nine provinces were obtained for the period 1975–2007 Corresponding climate data for this period, including rainfall, maximum and minimum temperature and relative humidity data, were prepared by the Solomon Islands Meteorological Service Records were collected for each of the country’s nine provinces and were collated into five regions for the purpose of this study
Region-specific grouping of data gave significant consid-eration to geographical location, orographic effects and the availability of malaria outpatients and climate data Considerable adjustments were made to population data and associated malaria incidence records to take account of the data grouping Malarial incidence was calculated as a Positive Incidence Ratio, which is defined as the number of positive cases per 1 000 persons
The numbers of confirmed malaria cases were identified using data from the period 1975–2008 during the peak infection period (December to May) Linear and non-lin-ear regression techniques were used to relate Positive Incidence Ratio to climate factors (such as temperature and rainfall) and non-climate factors (such as population growth) The analyses (Figure 2 ) show that the incidence of malaria peaks during the wet season (December to April) Somewhat counter-intuitively, however, it was also evident that above-median rainfall during the wet season tends to suppress the number of malaria cases: mosquito breeding sites are likely flushed out by the above-average rainfall in such cases Below-median rainfall during the wet season tends to increase the incidence of malaria

5656
Figure 2 . Relationship between Positive Incidence Ratio for malaria on the Solomon Islands and rainfall during the year
Sources: Australian Bureau of Meteorology and WMO, 2012
Those results indicate that malaria tends to be more prevalent during El Niño events and less so during La Niña events The maximum correlation between rainfall and Positive Incidence Ratio is subject to a significant lag time: the Ratio lags behind rainfall by approximately two months This makes rainfall a useful parameter for forecasting Positive Incidence Ratio with sufficient lead time to inform planning and management decisions On the other hand, the influence of temperature on numbers of malaria cases tends to have a shorter lag time This means that lower than normal rainfall from November to January, followed by higher than normal temperatures in December and January would trigger a high incidence of malaria
In summary, climate factors (rainfall and temperature) explained up to 70% of variability in the number of malaria cases An early warning system for malaria based on sea-sonal climate forecasts for the peak infection period was therefore assessed to be viable for the Solomon Islands
Towards an operational service
This project has been a pioneering case study of the impact of climate variability and possible climate change on the health of a Pacific community A prime example of the use of climate information to facilitate improvements in malaria management is the Malaria Early Warning System in sub-Saharan Africa, developed over the last decade by the Roll Back Malaria partners under the auspices of WMO Now that a robust relationship between ENSO phenomena and malaria incidence in the Solomon Islands has been established, the development of a similar system for the Solomon Islands is considered feasible
The results of the research described here were presented in a workshop in the capital of the Solomon Islands, Honiara, and received wide coverage in the local media Following the workshop, Dr Jennifer Mitini, Director of National Health Research and Training, said:
“The research has answered one of the burn-ing questions we have really tried to answer in the past, but we didn’t get results as compre-hensive as this [study] The most important next step is for [the health community] to start working with the Meteorological Services to use the information they collect to help guide us in our control actions, planning and management of malaria cases ”
An operational early warning system will require the establishment of a number of protocols and procedures for ensuring the rapid and timely exchange of information between the national meteorological service and relevant health providers, as well as an effective means of informing key government entities and the wider population The end results will be improved healthcare outcomes for residents of the Solomon Islands and a more appropriate provision of health services during periods of high malaria incidence Those results will improve the standard of care, the quality of healthcare outcomes, and lead to cost savings due to a more efficient use of resources In turn, those improvements will likely lead to benefits in the overall well-being of the local population, particularly during periods of high malaria risk and infection potential There will also be long-term benefits to work and education output (due to a reduction in lost productivity from illness and incapacity), as well as
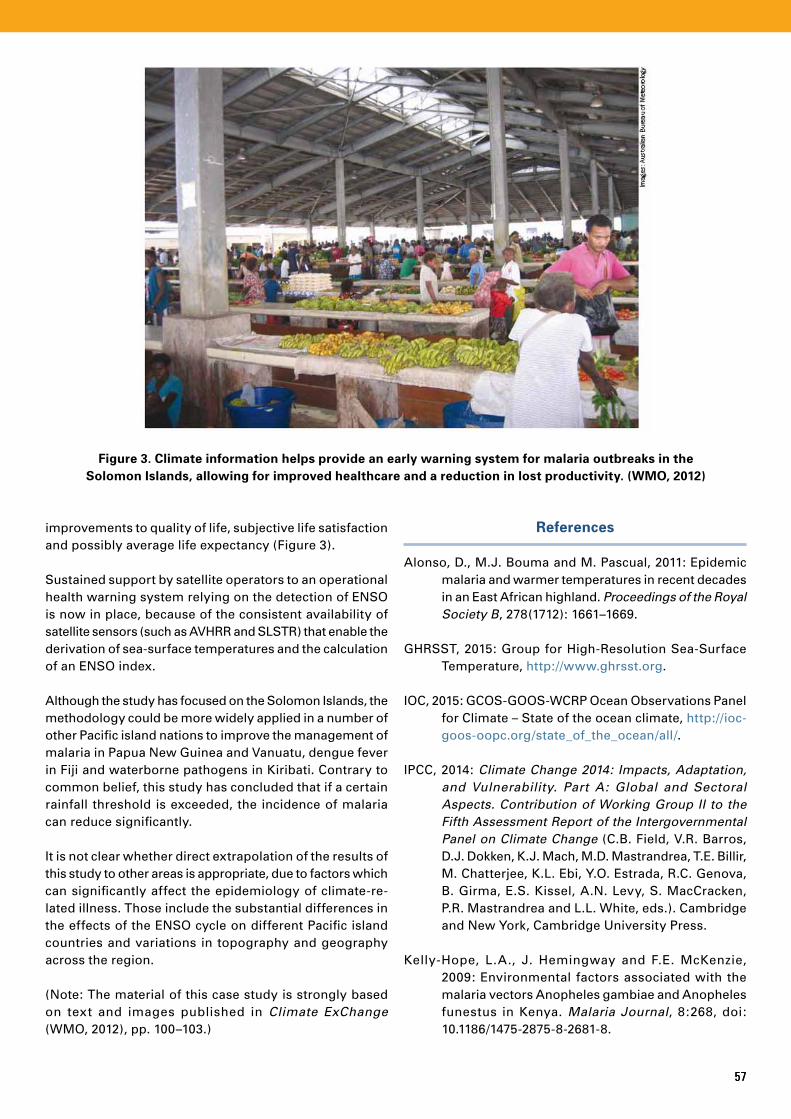
5757
Figure 3 . Climate information helps provide an early warning system for malaria outbreaks in the Solomon Islands, allowing for improved healthcare and a reduction in lost productivity . (WMO, 2012)
improvements to quality of life, subjective life satisfaction and possibly average life expectancy (Figure 3)
Sustained support by satellite operators to an operational health warning system relying on the detection of ENSO is now in place, because of the consistent availability of satellite sensors (such as AVHRR and SLSTR) that enable the derivation of sea-surface temperatures and the calculation of an ENSO index
Although the study has focused on the Solomon Islands, the methodology could be more widely applied in a number of other Pacific island nations to improve the management of malaria in Papua New Guinea and Vanuatu, dengue fever in Fiji and waterborne pathogens in Kiribati Contrary to common belief, this study has concluded that if a certain rainfall threshold is exceeded, the incidence of malaria can reduce significantly
It is not clear whether direct extrapolation of the results of this study to other areas is appropriate, due to factors which can significantly affect the epidemiology of climate-re-lated illness Those include the substantial differences in the effects of the ENSO cycle on different Pacific island countries and variations in topography and geography across the region
(Note: The material of this case study is strongly based on text and images published in Climate ExChange (WMO, 2012), pp 100–103 )
References
Alonso, D , M J Bouma and M Pascual, 2011: Epidemic malaria and warmer temperatures in recent decades in an East African highland Proceedings of the Royal Society B, 278(1712): 1661–1669
GHRSST, 2015: Group for High-Resolution Sea-Surface Temperature, http://www ghrsst org
IOC, 2015: GCOS-GOOS-WCRP Ocean Observations Panel for Climate – State of the ocean climate, http://ioc-goos-oopc org/state_of_the_ocean/all/
IPCC, 2014: Climate Change 2014: Impacts, Adaptation, and Vulnerability. Part A: Global and Sectoral Aspects. Contribution of Working Group II to the Fifth Assessment Report of the Intergovernmental Panel on Climate Change (C B Field, V R Barros, D J Dokken, K J Mach, M D Mastrandrea, T E Billir, M Chatterjee, K L Ebi, Y O Estrada, R C Genova, B Girma, E S Kissel, A N Levy, S MacCracken, P R Mastrandrea and L L White, eds ) Cambridge and New York, Cambridge University Press
Kelly-Hope, L A , J Hemingway and F E McKenzie, 2009: Environmental factors associated with the malaria vectors Anopheles gambiae and Anopheles funestus in Kenya Malaria Journal, 8:268, doi: 10 1186/1475-2875-8-2681-8

5858
WMO, 2012: Climate ExChange Leicester and Geneva, Tudor Rose
WMO and WHO, 2012: Atlas of Health and Climate (WMO- No 1098) Geneva
Woodruff, S D , S J Worley, S J Lubker, Z Ji, J E Freeman, D I Berry, P Brohan, E C Kent, R W Reynolds, S R Smith and C Wilkinson, 2011: ICOADS Release 2 5: Extensions and enhancements to the surface marine meteorological archive Int. J. Climatol., 31:951–967, doi:10 1002/joc 2103

595959
CASE STUDY 13
STRATOSPHERIC OZONE MONITORING AND ASSESSMENT FOR DETERMINING EFFICACY OF
THE MONTREAL PROTOCOL
TitleStratospheric ozone monitoring and assessment for determining efficacy of the Montreal Protocol
ServiceRegular assessment of the state of the ozone layer (includ-ing levels of ozone and ozone-depleting substances, many of which are greenhouse gases)
End users– International bodies (e g UNEP, Meeting of the Parties
of the Montreal Protocol)– National governments– Environmental agencies– Compliance monitoring agencies– Health agencies
Intermediate users– Research scientists– Policymakers, economists
Application(s)– Protocol monitoring and compliance verification – Scientific assessment
Models used– Global climate models– Atmospheric models with coupled chemistry
Climate data records used– Ozone (total column and vertical profile)– Long-lived greenhouse gases (e g chlorofluorocarbons
(CFCs)), other constituents relevant to ozone chemistry (e g chlorine and bromine containing gases)
– Methane
Satellite observations used– Ozone: SBUV, OMI, MLS, GOME-2, Sciamachy, IASI,
OMPS-Limb, OSIRIS, SAGE-II, SAGE-III– Hydrochloric acid: MLS, HALOE– CFCs: ACE-FTS, TES– Methane: ACE-FTS, Sciamachy
Agencies that produce records– USA: NASA and NOAA– Europe: ESA, EUMETSAT
Sustainability of service (demonstration or ongoing)Satellite measurements of ozone and other constituents relevant to ozone chemistry have been conducted since the 1970s National space agencies have current and planned missions that will continue the high-quality mea-surements needed to maintain long-term time series of ozone and shorter records of other important atmospheric constituents needed to improve our understanding of ozone chemistry
Ozone depletion over Antarctica
SUMMARY

6060
Ozone (total column and vertical profile), proxies for ozone depleting substances, other gases relevant to ozone (e g methane)
40-year record of total ozone, 30+ year record of ozone vertical profiles, long-term records of chlorine-containing gases
Compare historical and predicted trends in ozone from models with satellite-based measurements
Understand ozone-climate relationship
Montreal Protocol compliance and verification (state of recovery of the ozone layer)
Mitigation of greenhouse gases
Public health forecasts of UV exposure
Surface-based measurements of ozone-depleting substances, other emissions used by predictive models
sense create climate data apply decide
use additional data
In 1974, Molina and Rowland first suggested that human-produced CFCs could deplete stratospheric ozone By the early 1980s, policymakers had taken on the chal-lenge of regulating the production and consumption of these ozone depleting substances and a number of countries had combined their efforts to produce reports on ozone depletion
In 1985, the atmospheric community was surprised by the published confirmation of a severe downward trend in ozone
levels over Antarctica at the British Antarctic Survey’s Halley Station (Farman et al , 1985) Figure 1 shows the first image of this depleted Antarctic region (WMO, 1985) This image most likely led to the coining of the term “Antarctic ozone hole ” The combination of the strong downward trend of ozone levels over Halley Station and the continental-scale image of this depleted region spawned an immediate scramble by atmospheric scientists to unravel the puzzle of this polar ozone depletion In the same year, the first major report on ozone depletion “Atmospheric Ozone:
INFORMATION FLOW
DESCRIPTION
Figure 1 . False colour image of total column ozone from the Nimbus-7 satellite’s Total Ozone Mapping Spectrometer (TOMS) . This is the first image made of the Antarctic ozone hole .

6161
1985” was published under the auspices of the United Nations Environmental Programme and WMO with the assistance of scientists and government science agencies across the world
The nations of the world responded to the growing body of scientific research by negotiating the Vienna Convention for the Protection of the Ozone Layer In 1987, the Montreal Protocol on Substances that Deplete the Ozone Layer was finalized In subsequent years, the Montreal Protocol has been strengthened and CFC production and consumption is now banned throughout the world
The Montreal Protocol is the primary customer for the sci-entific assessments of ozone depletion These assessments are mandated under the Protocol every 4 years (the most recent is “The Scientific Assessment of Ozone Depletion: 2014 (WMO, 2014)”) The terms of reference agreed on by the parties to the Protocol ask for information on amounts of ozone depleting substances, on ozone levels and on general stratosphere-related climate issues While the Montreal Protocol is primarily a treaty that deals with ozone depletion, CFCs and their substitutes also have a powerful impact on the climate The Montreal Protocol is therefore evolving as climate issues become a major factor in regulating the consumption and production of fluorinated species such as hydrofluorocarbons
The ozone depletion issue has now entered an “account-ability phase” Scientists predicted large ozone losses from ozone depleting substances, governments acted, and levels of such substances have declined since the mid-1990s Models have projected that the ozone layer will recover by the middle of the century, but these projections must be verified by observations Current satellite-based observations of total column ozone and ozone profiles (such as the ozone monitoring and profiler suite, OMPS) are the primary measures for validating these projections, and for observing anomalies (such as volcanic forced ozone losses) Ozone observations in the upper stratosphere show hints of recovery, but these results are preliminary (WMO, 2014)
Projections of future ozone levels are thrown off balance by increasing levels of greenhouse gases In particular, increasing carbon dioxide levels lead to a cooling of the stratosphere That cooling slows ozone catalytic cycles and should lead to a more rapid increase of ozone over the course of the 21st century Observations of greenhouse gases, mid-to-upper stratospheric temperature and ozone are key to separating the effects of ozone-depleting substances and greenhouse gases Figure 2 shows the future projected ozone levels for various greenhouse gas scenarios While the decline in levels of ozone-depleting substances will cause ozone levels to increase, stratospheric ozone levels will be strongly affected by future greenhouse gas levels
Figure 2 . Total column ozone (60˚S–60˚N) . Satellite observations in black, with coupled chemistry climate model simulations in colour . The model is forced with various greenhouse gas scenarios, known as representative
concentration pathways (RCPs) . A low greenhouse gas level is associated with RCP 2 .6, while the highest levels of greenhouse gases are with RCP 8 .5 . The brown solid line (RCP 6 .0) shows the model simulation forced by
observed levels of ozone-depleting substances and greenhouse gas levels up to 2013, with a “high” greenhouse gas simulation up to 2100 . The brown dashed line shows simulated total column ozone under a RCP 6 .0 scenario
assuming zero emission of ozone depleting substances .

6262
The Montreal Protocol contributed to limiting greenhouse gas levels, since many ozone-depleting substances that have been phased out under the Protocol are potent greenhouse gases On the other hand, some replacement substances such as hydrofluorocarbons are strong green-house gases and their concentration levels have increased rapidly It is therefore important that the Montreal Protocol develops in order to estimate future greenhouse gas levels and climate projections
In addition to ozone and temperature data, satellite obser-vations provide key information to the Montreal Protocol on stratospheric water vapour and aerosol levels (key surface radiative forcings) Satellite observations also allow the tracing of stratospheric chlorine levels by obser-vations of hydrochloric acid in the upper stratosphere Observations by the Atmospheric Chemistry Experiment (ACE) instrument on SCISAT also provide hydrochloric acid observations and include measurements for CFCs and other gases that can be used to trace the annual cycle
of stratospheric species and year-to-year changes of the stratospheric circulation
Satellite observations are key to ensuring that the interna-tional regulation of ozone-depleting substances is working correctly As levels of ozone in the stratosphere control surface ultraviolet levels, changes in ozone are critical for understanding environmental changes of surface ultraviolet as the stratosphere evolves over the 21st century
References
Farman, J C , B G Gardiner and J D Shanklin, 1985: Large losses of total ozone in Antarctica reveal seasonal ClOx/NOx interaction Nature, 315:207–210, doi:10 1038/315207a0
WMO, 2014: Scientific Assessment of Ozone Depletion: 2014 Geneva, http://www wmo int/pages/prog/arep/gaw/ozone_2014/full_report_TOC html
6363
CONCLUDING FINDINGS AND REMARKS
The 13 case studies show that the main elements of the Architecture for Climate Monitoring from Space (ACMS) are consistent and an effective means of capturing infor-mation flow from observations to services
The case studies cut across different climate domains, spatial scales and geographic areas They reflect the various levels of decisionmaking in climate-sensitive sectors and show the variety and complexity of contexts in which satellite data can support climate services
The case studies demonstrate that satellite-based climate data records provide a critical baseline for many climate services Such records are also very important for climate reanalyses, which in turn underpin a wide range of climate services In many cases, climate services are generated using a combination of data records from satellites, surface-based observing systems and other sources of information, such as models or socioeconomic data
In addition to satellite-based climate data records, the importance to climate services of near-real-time satellite data that do not, or only partially, meet climate standards can be seen in several climate service case studies, including on operational drought monitoring, short-term forecasting of renewable energy supply (levels of wind and solar irradiance), or in analysis of anomalies (such as forest cover, sea-ice structure, ozone concentration) Complementary climate data records from surface-based observing systems and other data sources are additionally required for many services
The case studies reflect the various levels of decision-making in climate-sensitive sectors at global, regional, national, and local scales However, while an organized information flow from global to national and local scales is in place for weather services, such an information flow does not universally exist for climate services
The case studies rely on datasets from both research and operational missions That makes clear that research datasets are an integral part of many operational services, as acknowledged and taken into consideration in the strategy report 1 While research missions are essential
1 Dowell et al (2013), p28: “The climate community has stressed that the overarching goal of observing and monitoring the climate system requires […] the continued effort of both research and operational agencies Research agencies have invested in the creation of consistent time-series satellite
to advance the state-of-the-art, space agencies operating such missions should consider engaging with broader user communities in defining mission requirements for sustained observations
In a variety of case studies, services heavily depended on climatological products in estimating anomalies for specific geophysical variables It is recommended that both data providers and users establish better linkages to technical communities working on climatology devel-opment This will ensure that state-of-the-art methods are being adopted by climate service providers, and that climatologies of geophysical parameters beyond meteorology, which are of interest to the users of climate services, are being generated
In a number of the case studies, classical meteorological variables are used as well as additional geophysical, biophysical and atmospheric composition variables It is likely that the demand for such a combination of variables will only increase further as the scope of, and demand for, climate services widens It is important that the oper-ational data providers (such as national meteorological services) become increasingly aware of these additional requirements and datasets, and that these are taken into consideration in the context of their future missions and programmes
Several case studies highlight the importance of ancillary socioeconomic and demographic information For exam-ple, disaster risk reduction requires data on exposure, population, urban infrastructure, crop information and subsidence due to groundwater extraction Impacts at a local level are invariably context-dependent: their assessment requires that such contextual data be provided specifically at that level (Some of these data are also directly or indirectly satellite-derived, such as high-preci-sion digital elevation models, population density estimates from high-resolution imagery or mapping of night-time light sources )
datasets over decades, both through mission science, team-based and measurement-based climate product processing and reprocessing Research agencies have also made and will maintain significant investment in calibration laboratories, airborne sensors, processing facilities, and ground networks that support calibration and validation activities for satellite programmes These contributions to climate science will need to continue to be a vital element of a collaborative climate observation and processing architecture as operational climate services move forward to emerge in operational agencies ”

6464
Looking forward, the report shows that:
At the WMO and wider international level, there is currently no process in place to systematically capture climate and GFCS-related service requirements that could be translated into product, observation and instrument requirements This is a serious issue, since end users of climate services expect effective services from climate information providers in response to their problems and requirements It is also an issue in many countries, where the systematic identification of climate service require-ments and service-driven observation requirements for all climate-sensitive sectors are in their infancy
Depending on the user’s technical expertise, requirements themselves span across the different levels set out in the Architecture (sensing – applying – deciding) and are not limited to any particular level Those levels, for example, include climate data records (such as a 40-year infrared radiance time series), indicators (an El Niño/Southern Oscillation index, a drought index or a seasonal climate outlook) or synthesized reports (on issues such as annual deforestation rates or crop yield forecasts)
User requirements need to be captured at the different levels of the ACMS, translated into technical delivera-bles, and addressed through the future development of the Architecture This should be done through gap analyses and dedicated action to respond to these gaps Positive contributions could be made by existing WMO programmes (such as the World Climate Services Programme (WCSP)), GCOS, the emerging GFCS User Interface Platform, GEO and the work of the CEOS-CGMS Working Group on Climate
Several case studies show the use of satellite and in situ data, model output and reanalysis; most are dependent on a range of data sources Further development of the ACMS
should be compatible, as appropriate, with the generic flow of information for a range of data sources (reflected by the modified information flow diagram in Figure 2)
To ensure that climate services are fit for purpose, feedback mechanisms between service users and providers are essential Several case studies show that climate services are under active development and further improvement is necessary The ACMS currently reflects a static information flow through the “pillars” of the Architecture Looking to the future the ACMS also needs to include a feedback loop that assesses the extent to which observing systems and products developed for specific applications are fit for purpose
One advantage of the Architecture lies in the common structure and terminology it provides This should facilitate dialogue between data producers and users of climate services across sectors The Architecture helps producers to improve the way in which they support users’ needs as observing systems and derived data products develop The dialogue should include not only meteorological services, but also the many entities with thematic competencies in relevant sectors such as agriculture, health, forestry, energy and water resource management
Within the producer–user dialogue, the capacity-build-ing needs of actual and potential climate service users should be systematically identified The ACMS provides a framework for identifying capacity-building needs at all levels of the information flow, which is consistent with the emerging GFCS User Interface Platform
An online platform should be established that allows interactive exploration of the region- and country-spe-cific climate service case studies, including key actors, information flows, dependencies, societal benefits and other details
6565
APPENDIX
Authors of the report (in alphabetical order)
Writing and Editing Team
Stephan Bojinski (WMO) Mark Dowell (European Commission Joint Research Centre) Richard Eckman (NASA) Ignatius Gitonga Gichoni (Kenya Meteorological Department) Robert Husband (EUMETSAT) Pascal Lecomte (ESA) Wenjian Zhang (WMO)
Contributors Frédéric Achard (European Commission Joint Research Centre) John Bates (NOAA/NCEI, USA) Anny Cazenave (LEGOS CNES/Observatoire Midi-Pyrénées, France) Marcus Engdahl (ESA) Stephen English (ECMWF) Xiang Fang (CMA, China) Ed Kearns (NOAA/NCEI, USA) Toshiyuki Kurino (JMA, Japan) James Muhindi ((Kenya Meteorological Department) Terry Nakajima (University of Tokyo, Japan) Paul Newman (NASA/GSFC, USA) Peter Omeny (Kenya Meteorological Department) Anthony Rea (Bureau of Meteorology, Australia) Guy Schumann (NASA/JPL, USA) Reto Stöckli (MeteoSwiss, Switzerland) Yiping Zhang (CMA, China) Solomon Islands Meteorological Service (Lloyd Tahani) Bureau of Meteorology, Australia (Yahya Abawi and co-authors)
The authors wish to thank all reviewers of this report for their comments

JN 1
5160
0
For more information, please contact:
World Meteorological Organization7 bis, avenue de la Paix – P.O. Box 2300 – CH 1211 Geneva 2 – Switzerland
Communications and Public Affairs Office
Tel.: +41 (0) 22 730 83 14 – Fax: +41 (0) 22 730 80 27
E-mail: [email protected]
www.wmo.int