Satellite Oceanography and Applications 1: Introduction ... · PDF fileSatellite Oceanography...
46
Satellite Oceanography and Applications 1: Introduction, SST, Ocean color RMU Summer Program (AUGUST 24-28, 2015) Ebenezer Nyadjro US Naval Research Lab
Transcript of Satellite Oceanography and Applications 1: Introduction ... · PDF fileSatellite Oceanography...

Satellite Oceanography and Applications 1: Introduction, SST, Ocean color
RMU Summer Program (AUGUST 24-28, 2015)
Ebenezer Nyadjro
US Naval Research Lab
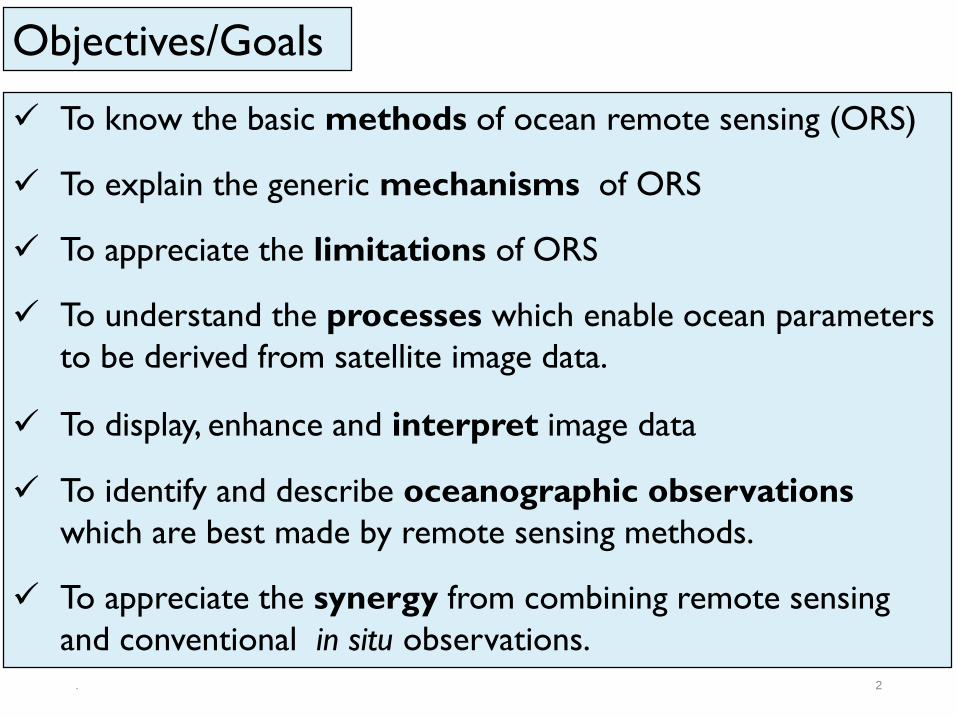
Objectives/Goals
To know the basic methods of ocean remote sensing (ORS)
To explain the generic mechanisms of ORS
To appreciate the limitations of ORS
To understand the processes which enable ocean parameters
to be derived from satellite image data.
To display, enhance and interpret image data
To identify and describe oceanographic observations
which are best made by remote sensing methods.
To appreciate the synergy from combining remote sensing
and conventional in situ observations.2.

Jensen, 2009
A remote sensing instrument
collects information about an
object or phenomenon within the
instantaneous-field-of-view (IFOV)
of the sensor system without
being in direct physical
contact with it.
The sensor is located on a
suborbital or satellite platform

Remote Sensing: Primary components

Satellites and Sensors: A brief history
5.

Remote Sensing: A brief history
6
Hot-air Balloons
Invented by the
Montgolfier Brothers
in 1783
1858 Gaspard Felix Tournachon
(Nadar) takes first aerial
photograph near Paris, using a
captive balloon and a collodion
plate. Unfortunately, this first aerial
photograph did not survive.
Gaspard Felix
Tournachon (Nadar)
.

Remote Sensing: A brief history
7
In 1903, Julius
Neubronner patented
a breast-mounted
camera for carrier
pigeons that weighed
only 70 grams.
A squadron of
pigeons is equipped
with light-weight 70-
mm aerial cameras.
.

Satellites and Sensors: A brief history
1957 – Soviet Union launches first satellite Sputnik
1978 – NASA launches three ocean-observing satellites:
TIROS-N (Television and InfraRed Operational Satellites)
on NOAA 6-7 Satellite with AVHRR (Advanced very high
Resolution Radiometer) radiometer measuring SST
Seasat Satellite with radar-altimeter measuring sea surface
height; microwave scatterometer and synthetic aperture
radar (SAR). both measuring ocean roughness;
Nimbus-7 Satellite with ocean color sensor -Costal Zone
Color Scanner (CZCS).
8.

Importance of satellite oceanography
Observes the distribution of certain ocean surface
properties in exquisite spatial detail: allows the true
spatial structure to be examine
Captures a “snapshot” of the spatial distribution.
“Freezes” the continually changing ocean
Offers a repeated view: consistent measurements by a
single sensor
Observes part of the ocean other methods miss Shipping routes are concentrated in certain zones
Ships tend to avoid poor weather hazardous regions
Drifting buoys tend to avoid regions of divergent currents 9.

Limitations of satellite oceanography
Can observe only some of the ocean's properties and
variables
Measures the ocean only at or near the surface
-- Although the surface is the most critical place to measure
Ocean measurements may be corrupted by the
atmosphere
Some satellites/methods cannot see through clouds at all
Can make measurements only when the satellite is in the
right place at the right time
All measurements require calibration and validation using
in situ data 10.

11.
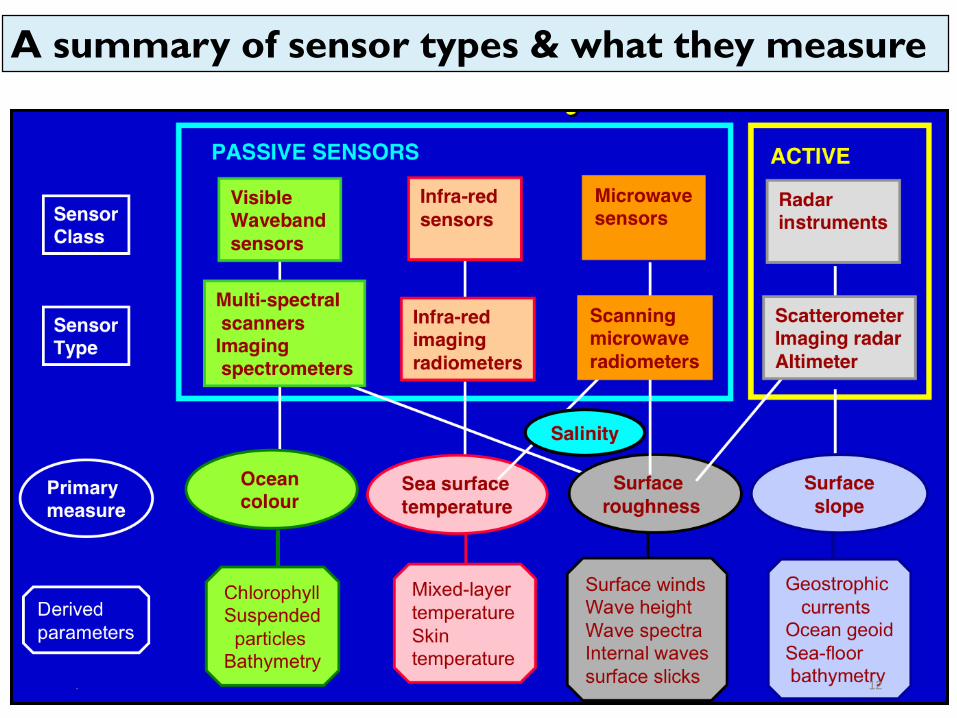
A summary of sensor types & what they measure
12.

Basic physics and principles
13.

Satellite orbital dynamics
Geostationary orbit (Geosynchronous)These satellites are used for weather obs.
The satellite orbits in the same direction
as the Earth with a period of one day. The disadvantage of this type of orbit is
that since these satellites are very far away, they have poor resolution. Also, have trouble
monitoring activities near the poles.
Polar orbit (Sun-Synchronous)These satellites are good for Chl, SST.
Scans from north to south over one face, and
Reverse in other face. A period of 1-2 hours.
Nearly polar sun- synchronous orbit These satellites are used for TRMM.
Near Equatorial low inclination orbit. This orbit covers half of the
globe. 14.

Sources of energy for remote sensing
The Sun---Visible waveband
--- Near Infra red waveband
Thermal emission by the ocean surface--- Thermal infra red
--- Microwaves
Energy source on the satellite--- Microwaves (Radar)
---Visible (Lidar)15.
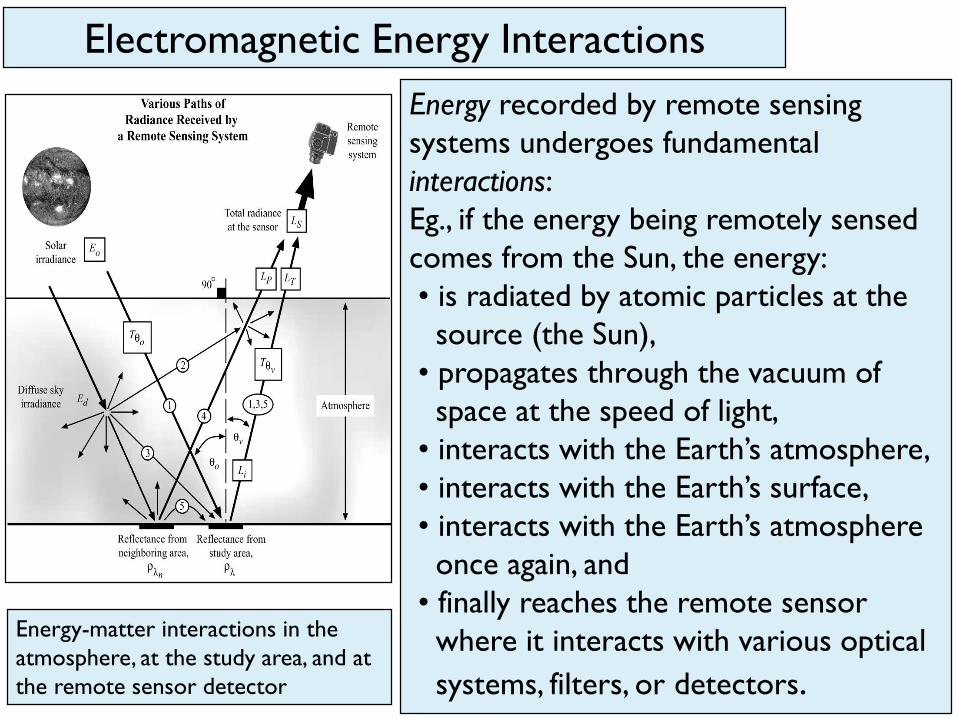
Energy-matter interactions in the
atmosphere, at the study area, and at
the remote sensor detector
Electromagnetic Energy Interactions
Energy recorded by remote sensing
systems undergoes fundamental
interactions:
Eg., if the energy being remotely sensed
comes from the Sun, the energy:
• is radiated by atomic particles at the
source (the Sun),
• propagates through the vacuum of
space at the speed of light,
• interacts with the Earth’s atmosphere,
• interacts with the Earth’s surface,
• interacts with the Earth’s atmosphere
once again, and
• finally reaches the remote sensor
where it interacts with various optical
systems, filters, or detectors.

How is Energy
Transferred?
Energy may be transferred 3 ways: conduction, convection, and radiation:
(a) conduction: one body (molecule or atom) transfers its kinetic
energy to another by colliding with it (direct contact).
(b) convection: the KE of a body is transferred from one place to
another by physically moving the bodies. E.g. the convectional
heating of air in the atmosphere in the early afternoon
(c) Electromagnetic energy in the form of electromagnetic waves
(radiation) transmitted through the vacuum of space from
the Sun to the Earth.

Electromagnetic Spectrum The Sun produces a
continuous spectrum of
energy from gamma rays to
radio waves that continually
bathe the Earth in energy.
The visible portion of the
spectrum may be measured
using wavelength
(micrometers or
nanometers) or electron
volts (eV).
All units are
interchangeable.
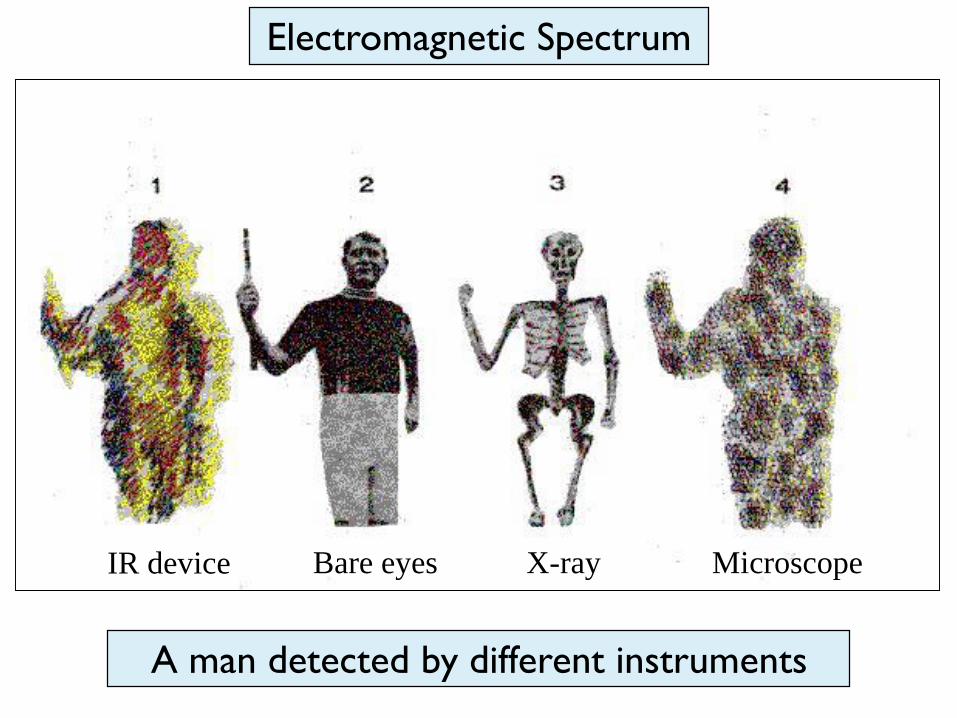
A man detected by different instruments
Electromagnetic Spectrum
IR device Bare eyes X-ray Microscope

Scattering Once electromagnetic
radiation is generated, it is
propagated through the
earth's atmosphere almost
at the speed of light in a
vacuum.
• Unlike a vacuum in which
nothing happens, however,
the atmosphere may affect
not only the speed of
radiation but also its
wavelength, intensity,
spectral distribution, and/or
direction.

• Absorption is the process by which radiant energy is absorbed
and converted into other forms of energy.
• An absorption band is a range of wavelengths (or frequencies) in
the electromagnetic spectrum within which radiant energy is
absorbed by substances such as water (H2O), carbon dioxide
(CO2), oxygen (O2), ozone (O3), and nitrous oxide (N2O).
• The cumulative effect of the absorption by the various
constituents can cause the atmosphere to close down in certain
regions of the spectrum. This is bad for remote sensing because
no energy is available to be sensed.
Absorption
~ 40% of sunlight is reflected by clouds
~ 20% of sunlight is absorbed by the atmosphere
~ 40% of sunlight is absorbed by the Earth’s surface

Reflectance: radiation “bounces off” an
object like a cloud or the terrain.
• Reflection exhibits fundamental
characteristics that are important in
remote sensing:
(a) First, the incident radiation, the
reflected radiation, and a vertical to the
surface from which the angles of
incidence and reflection are measured
all lie in the same plane.
(b) Second, the angle of incidence
and the angle of reflection are equal.
Reflectance

Remote Sensor Resolution Considerations
• Spatial - the size of the field-of-view,
e.g. 10 10 m.
• Spectral - the number and size of spectral regions
(or frequencies) the sensor records data in,
e.g. blue, green, red, near-infrared, thermal infrared.
• Temporal - how often the sensor acquires data,
e.g., every 30 days.
• Radiometric - sensitivity of detectors to small
difference in electromagnetic energy.
B G R NIR
Jan
16
Feb
16
10 m
10 m
8-bit
(0 - 255)
10-bit
(0 - 1023)

Spatial Resolution
Variations of IFOV
(spatial resolution)
with view angle
24
.

Ocean scale
25.
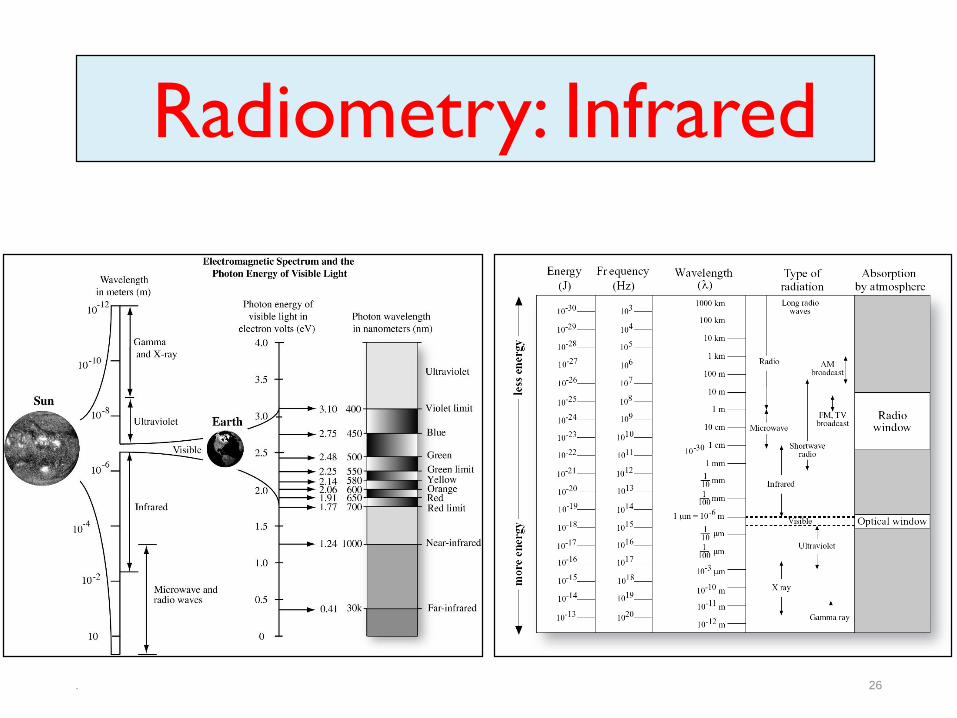
Radiometry: Infrared
26.

Thermal Infrared Remote Sensing
Thermal infrared energy is emitted from all objects that have a
temperature greater than absolute zero. Radiometry is the techniques
of measuring electromagnetic radiation.
Humans sense thermal energy primarily through the sense of touch.
Our eyes cannot detect differences in thermal infrared energy because
they are primarily sensitive to short wavelength visible light from 0.4
µm to 0.7 µm. Our eyes are not sensitive to the reflective infrared (0.7
- 3.0 µm) or thermal infrared energy (3.0 - 14 µm).

Why SST from space?
• From satellite SST we can identify and monitor surface
disturbances that cross entire ocean basins, track ocean
eddies and map ocean fronts
• It can also reveal striking features such as ‘storms’ in the
upper ocean, known as eddies.
– These are typically ~100 km wide and carry large
amounts of energy around the globe. They play an
important role in ocean circulation and climate.
28
.

Why SST from space?
• Space-borne IR sensors estimate SST by measuring
heat radiation from the ocean surface.
– This gives the temperature of the surface ‘skin’, the top
mm or so, rather than the bulk of the water.
– The skin temperature is critical. It controls the exchange
of heat and moisture between the ocean and atmosphere.
29
.

IR: basics and SST
• SST is measured using a radiometer (like “night vision goggle”)
– Infrared (mainly)
– microwave
• Spectral bands used are near the peak of surface
emission – the peak ones aren’t used due to
atmospheric effects
• It is measured by: – taking the intensity of radiation at top of atmosphere
– removing the atmospheric contribution
– results in the brightness temperature (TB) at the
surface. TB is approximately equal to the SST 30
.

IR: basics and SST
• Popular SST products:
– NOAA Multi-channel (MC)/Pathfinder SST global.
AVHRR sensor has been available since 1978
– ATSR ASST (Along-Track Scanning Radiometer Average
Sea Surface Temperature Products) on ERS-1& ERS-2
– TRMM (Tropical Rainfall Measuring Mission)
TMI (TRMM Microwave Imager) SST
31
.

Cloud detection
• Temperature thresholds
• Visible waveband threshold (daytime only)
– various things in image - land sea cloud have
different spectral characteristics - different
intensities in different spectral bands
• spatial coherency
testing
• multi-spectral
tests
• problems with
sub-pixel clouds32
.

Applications of satellite-measured SST
33.
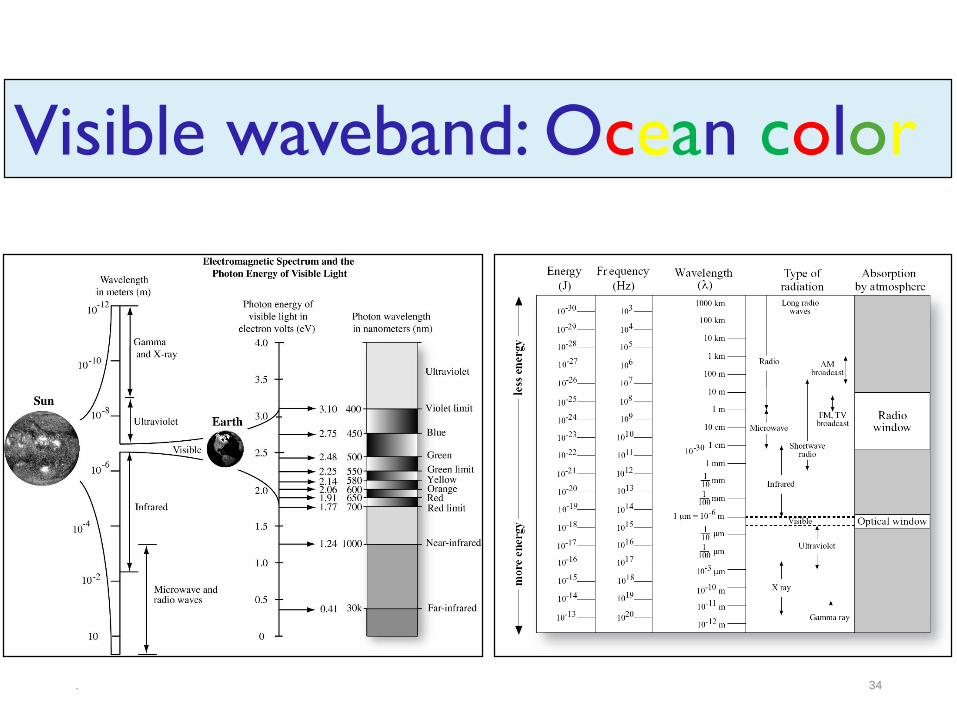
Visible waveband: Ocean color
34.

What is the color of the ocean?
• The color of the ocean appears
BLUE in clear water.
• But it changes due to :
-- Phytoplankton patchiness
-- Inorganic/Organic matter
35.

What is the color of the ocean?
• Clean ocean water absorbs red light, i.e., sun radiation of
long wavelength and transmits and scatters the light of
short wavelength. That is why ocean surface looks blue.
• Phytoplankton cells contain chlorophyll that absorbs other
wavelengths and contributes green color to ocean water.
• In coastal areas suspended inorganic matter backscatters
sunlight, contributing green, yellow and brown to water
color.
36
.

Why ocean color from space?
Locates and enables monitoring of regions of high and
low bio-activity. Synoptic Scales of Pigments
Food–primary production (phytoplankton linked with chl);
marine fisheries
Climate (phytoplankton, possible CO2 sink-carbon budget)
Seasonal influences; phytoplankton blooms; upwelling
River and Estuary plumes and influences
Boundary currents. Reveals current structure & behavior.
Reveals Anthropogenic influences (pollution); oil spills
Remote sensing reveals large and small scale structures
that are very difficult to observe from the surface. 37
.

Major Ocean Color Data Products
Chlorophyll
Suspended Sediments
Yellow Substances
Aerosol
38
.

Principles of satellite measurements of ocean color
39.

Basic principles of satellite measurements of ocean color
40
.
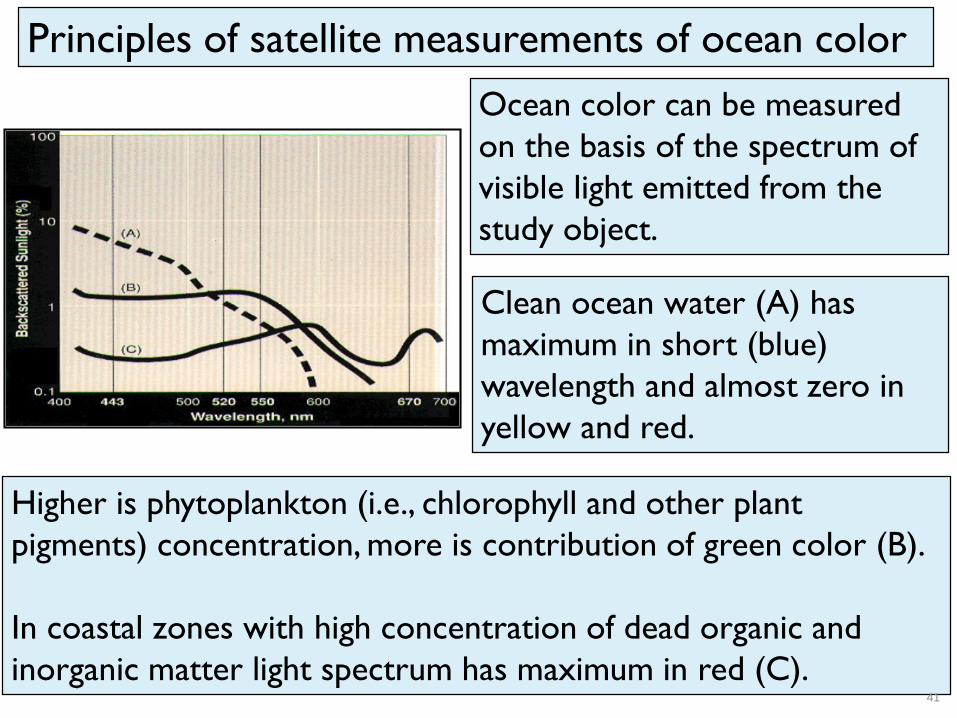
Principles of satellite measurements of ocean color
Ocean color can be measured
on the basis of the spectrum of
visible light emitted from the
study object.
Clean ocean water (A) has
maximum in short (blue)
wavelength and almost zero in
yellow and red.
Higher is phytoplankton (i.e., chlorophyll and other plant
pigments) concentration, more is contribution of green color (B).
In coastal zones with high concentration of dead organic and
inorganic matter light spectrum has maximum in red (C). 41
.

Sources of ocean color change
• Phytoplankton and its pigments
• Dissolved organic material
-- Colored Dissolved Organic Material (CDOM, or yellow matter,
or gelbstoff) from decaying vegetable matter (land) and
phytoplankton degraded by grazing of photolysis.
• Suspended particulate matter -- The organic particulates (detritus) consist of phytoplankton and
zooplankton cell fragments and zooplankton fecal pellets.
-- The inorganic particulates consist of sand and dust created by
erosion of land-based rocks and soils. These enter the ocean
through:
-- River runoff.
-- Deposition of wind-blown dust.
-- Wave or current suspension of bottom sediments.42
.

Current ocean color sensors
43.

CZCS -- Coastal Zone Color Scanner (1978 - 1986)
• was a multispectral line scanner
developed by NASA to measure
ocean color.
• Sun-synchronous, near polar
• CZCS was launched aboard
Nimbus-7 satellite platform in
October 1978
44
.

SeaWiFS-- Sea-viewing Wide Field-of-view Sensor (since 1997)
• The SeaWiFS program was started in 1980s,
immediately after the end of the CZCS
mission.
• Sun Synchronous orbit
• launched on August 1, 1997 by SeaStar
Space Craft.
Ocean Chl and Normalized Digital Vegetation Index (NDVI)
computed from SeaWiFS 45
.
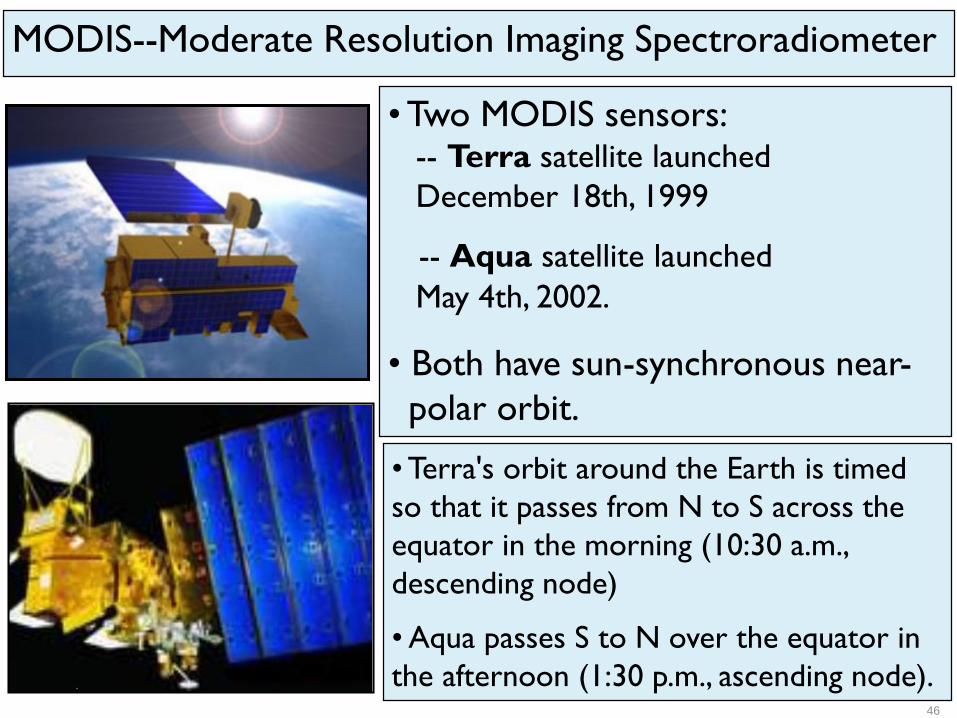
MODIS--Moderate Resolution Imaging Spectroradiometer
• Two MODIS sensors:-- Terra satellite launched
December 18th, 1999
-- Aqua satellite launched
May 4th, 2002.
• Both have sun-synchronous near-
polar orbit.
• Terra's orbit around the Earth is timed
so that it passes from N to S across the
equator in the morning (10:30 a.m.,
descending node)
• Aqua passes S to N over the equator in
the afternoon (1:30 p.m., ascending node). 46
.