SAS Capital Planning and Management 2...Capital Planning and Management 2.2 Banking Framework. Use...
56
SAS ® Capital Planning and Management 2.2 Banking Framework User’s Guide
Transcript of SAS Capital Planning and Management 2...Capital Planning and Management 2.2 Banking Framework. Use...

SAS® Capital Planning and
Management 2.2 Banking Framework User’s Guide

The correct bibliographic citation for this manual is as follows: SAS Institute Inc. 2015. SAS® Capital Planning and Management 2.2: Banking Framework User’s Guide. Cary, NC: SAS Institute Inc.
SAS® Capital Planning and Management 2.2: Banking Framework User’s Guide
Copyright © 2015, SAS Institute Inc., Cary, NC, USA
All rights reserved. Produced in the United States of America.
For a hard-copy book: No part of this publication may be reproduced, stored in a retrieval system, or transmitted, in any form or by any means, electronic, mechanical, photocopying, or otherwise, without the prior written permission of the publisher, SAS Institute Inc.
For a web download or e-book: Your use of this publication shall be governed by the terms established by the vendor at the time you acquire this publication.
The scanning, uploading, and distribution of this book via the Internet or any other means without the permission of the publisher is illegal and punishable by law. Please purchase only authorized electronic editions and do not participate in or encourage electronic piracy of copyrighted materials. Your support of others’ rights is appreciated.
U.S. Government License Rights; Restricted Rights: The Software and its documentation is commercial computer software developed at private expense and is provided with RESTRICTED RIGHTS to the United States Government. Use, duplication or disclosure of the Software by the United States Government is subject to the license terms of this Agreement pursuant to, as applicable, FAR 12.212, DFAR 227.7202-1(a), DFAR 227.7202-3(a) and DFAR 227.7202-4 and, to the extent required under U.S. federal law, the minimum restricted rights as set out in FAR 52.227-19 (DEC 2007). If FAR 52.227-19 is applicable, this provision serves as notice under clause (c) thereof and no other notice is required to be affixed to the Software or documentation. The Government's rights in Software and documentation shall be only those set forth in this Agreement.
SAS Institute Inc., SAS Campus Drive, Cary, North Carolina 27513-2414.
March 2015
SAS® and all other SAS Institute Inc. product or service names are registered trademarks or trademarks of SAS Institute Inc. in the USA and other countries. ® indicates USA registration.
Other brand and product names are trademarks of their respective companies.
iii
Contents
Chapter 1 Introduction 1 Introduction 1
SAS Capital Planning and Management Banking Framework Overview 1 Capital Planning Process Overview 3
Chapter 2 Dimensions 7 Dimensions Overview 7 Account 8
Balance Sheet Members 9 Income Statement Accounts 12 Rates 14 Measures 15
Scenario 15 DFAST Template Mapping 16 CCAR FR Y-14A Mapping 16 Analysis 16
Custom Properties 17 Formulas 18 Business 18 Custom Properties 18
Counterparty 19 Currency 19 Organization 20 Rating 21
Scenario 21 Time 22 Custom Properties 22
Chapter 3 Rate Types 23 Rate Types Overview 23 Forecast Rates and What If Scenario Rates 23
Chapter 4 Form Sets 27 Form Sets Overview 27 Capital Aggregation Phase 28 Credit Data Form Set 28 ALM Balances and NII Form Set 28
Management Review – Baseline Credit and ALM (NII) Data Form Set 29 Capital Projection Phase 29 Scenario Library Form Set 30 Business Rates Form Set 30

iv Contents
Trading Asset Projections Form Set 31
Loan Projections Form Set 32 Off Balance Sheet Projections Form Set 33 Deposit Projections Form Set 34 Debt Projections Form Set 35
Operating Budget Form Set 35 Other Balance Sheet Projections Form Set 36 Capital Actions Form Set 37 Capitalization Parameters Form Set 38
Study Definition Form Set 39 Management Overrides Baseline Form Set 39 CPnM Allocation Phase 39 Risk Appetite Phase 39
Configuration and Administration Phase 39 All Scenario Driver Formula Calculations Form Sets (V1000, V2000, V3000, and V4000) 40
Chapter 5 Reports 41 Reports Overview 41
Capital Report 42 Capital Ratios 42 Available Capital 44 Required Capital 44
Capital Surplus 45 Financial Statements – Audit View 46 Financial Statements 47 Financial Statements – Historical 47
Economic Factors – Scenario Library 47 Scenario Summary 48 Financial Statements – Forecast 49 Forecasted Capital Ratios 49
Limits and Risk Tolerance 50 Scenario Comparison 50 Version Comparison 50 Gross Loan Impact Review 1 51
Gross Loan Impact Review 2 51 FR Y 14A Template 52 OCC DFAST 10-50B 52 Risk Profile 52

1
1 Introduction
Introduction ................................................................................................................................................... 1 SAS Capital Planning and Management Banking Framework Overview ................................................... 1 Capital Planning Process Overview .............................................................................................................. 3
Introduction The SAS Capital Planning and Management 2.2 Banking Framework is implemented by using SAS Financial Management 5.5. This document provides an overview of the SAS Capital Planning and Management 2.2 Banking Framework. Use this document with the SAS Financial Management documentation.
For detailed information about the tasks that are described in this book, see the SAS Financial Management 5.5 documentation, which is available at: http://support.sas.com/documentation/onlinedoc/fm
Note: The SAS Financial Management product documentation page is password-restricted. You can find the user name and password in the pre-installation checklist, the Instructions.html file, or by contacting SAS Technical Support at
http://support.sas.com/techsup/
SAS Capital Planning and Management Banking Framework Overview The SAS Capital Planning and Management Banking Framework provides all of the capabilities that are necessary for proactive capital planning. Proactive capital planning requires that banks comprehensively understand and assess the impact of their business portfolios on a wide range of measures.
A capital management system manages the data between different units to enable banks to perform risk and profitability planning under stress or strategic macroeconomic conditions. For example, Comprehensive Capital Analysis and Review (CCAR), European Banking Authority (EBA), and Australian Prudential Regulation Authority (APRA) stress tests.
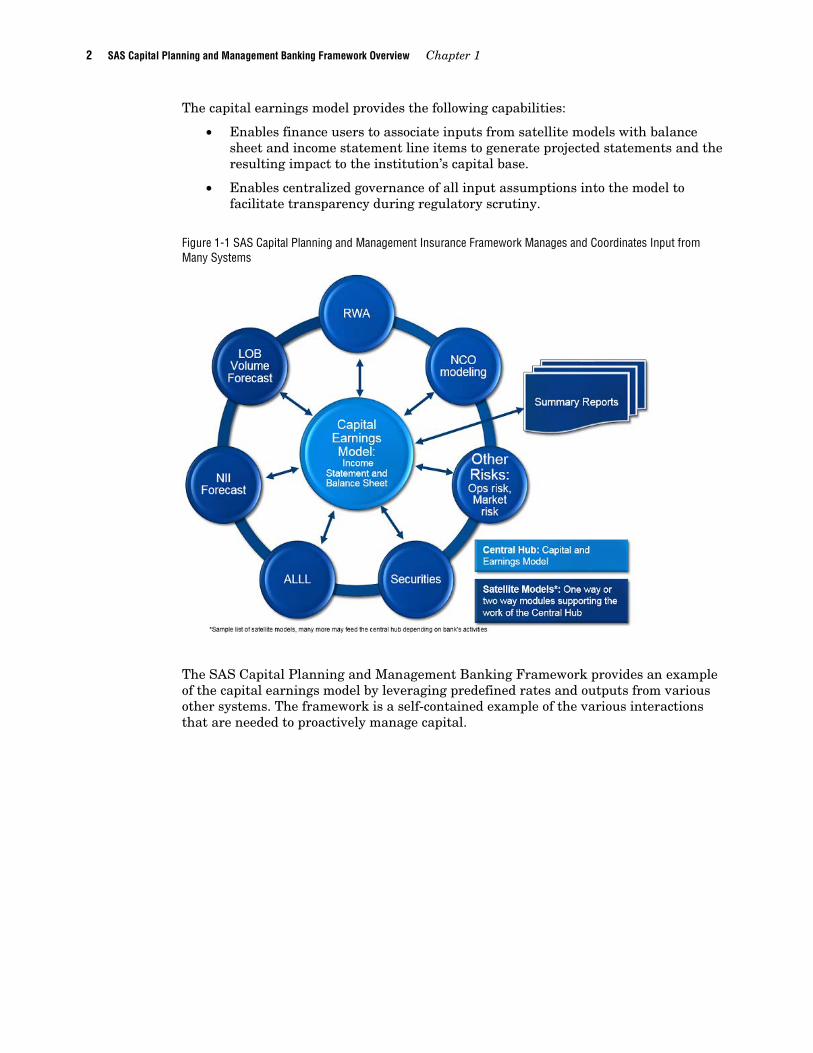
You can describe the capital planning exercise under a different macroeconomic scenario as a hub and spoke collaboration model. (See Figure 1-1) The hub is the central aggregation framework that is designated as the capital earnings model; all assumptions for the base case and stressed scenarios are aggregated according to financial rules for balance sheets and income statements.
C H A P T E R
2 SAS Capital Planning and Management Banking Framework Overview Chapter 1
The capital earnings model provides the following capabilities:
• Enables finance users to associate inputs from satellite models with balance sheet and income statement line items to generate projected statements and the resulting impact to the institution’s capital base.
• Enables centralized governance of all input assumptions into the model to facilitate transparency during regulatory scrutiny.
Figure 1-1 SAS Capital Planning and Management Insurance Framework Manages and Coordinates Input from Many Systems
The SAS Capital Planning and Management Banking Framework provides an example of the capital earnings model by leveraging predefined rates and outputs from various other systems. The framework is a self-contained example of the various interactions that are needed to proactively manage capital.

Introduction Capital Planning Process Overview 3
Figure 1-2 SAS Capital Planning and Management Banking Framework Contents
Figure 1-2 illustrates the elements of the SAS Capital Planning and Management Banking Framework:
• An extensive model of dimensions and formulas that describes the interaction between various elements. For example, based on prepayment or charge-off rates, future loan portfolio balances are computed, as well as the accompanying impact on monthly income statements.
• A set of predefined reports for reviewing ex-ante balance sheets, income statements, cash flow, and various capital measures.
• Various data collection and review phases and form sets that you can use to review, override, and collect input from many constituents.
Capital Planning Process Overview The process of planning capital through a time horizon involves a number of inputs and tasks. The capital planning process depicted in Figure 1-3 describes the necessary interface with other source environments for actual historic data.
Analytical models that are external to the SAS Capital Planning and Management Banking Framework are also addressed with the results of these models loaded through staging tables.
The SAS Capital Planning and Management Banking Framework supports an iterative methodology that enables you to review reports and make changes at any time.
Note: The definition and the production of finished regulatory support is outside the scope SAS Capital Planning and Management Banking Framework. However, it is available through a Customer Care Agreement (CCA) with SAS Professional Services.

4 Capital Planning Process Overview Chapter 1
Figure 1-3 outlines the tasks that you must complete as a part of the Capital Planning Process.
Figure 1-3 The Capital Planning Process
When completing the tasks that make up the capital planning process, note the following:
• The most recent set of actual historic data must be imported. Note that all historical data must be loaded into the appropriate SAS Financial Management staging table before starting this task.
• A custom property of the Time dimension indicates the quarterly time period that is the first period of the projected time horizon. This property is CPnM_FirstPeriod. The property identifies the period to use within the formula as the most current actual data.
Note: Ensure that the CPnM_FirstPeriod property is set to true for only one leaf member of the Time hierarchy. Also, ensure that the CPnM_FirstPeriod property is either removed or set to false for the prior period. (See Figure 1-4.)
Figure 1-4 Time Dimension, Monthly Period Type – CPnM_FirstPeriod Custom Property

Introduction Capital Planning Process Overview 5
• Ensure that you modify the As-Of Date in the properties of the CPnM Banking Model Time Hierarchy to reflect this change of the Time dimension. In addition, ensure that you click Make Current on the As-Of Data dialog box to reflect this change of the dimension. (See Figure 1-5.)
Figure 1-5 CPnM Banking Model Properties – Time Hierarchy
• Each of the rate types require that data be loaded for each scenario. Since the data source of each rate type might be from a different source, each rate type is a separate sub-task that you can run in any order. You must load all rates before proceeding to the next step
• The Business Rates form (Capital Projection form set) provides an opportunity for business users to review and override rates that have been loaded. Publish and complete the form set.
Note: It is good practice and strongly recommended that you rerun all scenario drivers before proceeding to the next task to ensure that all calculations are evaluated. To rerun all scenario drivers, select Run Driver Formulas for the Scenario Driver Formula Calculations form set as shown in Figure 1-6.

6 Capital Planning Process Overview Chapter 1
Figure 1-6 Form Sets – Scenario Driver Formula Calculations
• When specifying the Capitalization Parameters, ensure that they are set centrally to identify the capital ratios with respect to risk weighted assets (RWAs). These parameters include basis capital to risk (weighted) assets ratio (CRAR), as well as conservation and cyclicality buffers broken down by capital type (for example, Core Tier 1, Additional Tier 1, and Tier 2), as shown in Figure 1-7.
Figure 1-7 Capitalization Parameters
• Capital actions define the projected dividend payments, as well as stock issuance and repurchases. These actions have a direct result on available capital reserves.
7
2 Dimensions
Dimensions Overview .................................................................................................................................... 7 Account........................................................................................................................................................... 8
Balance Sheet Members ......................................................................................................................... 9 Balance Sheet Logic Flow ............................................................................................................. 10
Income Statement Accounts ................................................................................................................. 12 Capital Accounts ........................................................................................................................... 12
Rates ..................................................................................................................................................... 14 Measures ............................................................................................................................................... 15 Scenario ................................................................................................................................................ 15 DFAST Template Mapping .................................................................................................................. 16 CCAR FR Y-14A Mapping ................................................................................................................... 16
Analysis ........................................................................................................................................................ 16 Custom Properties ................................................................................................................................ 17 Formulas .............................................................................................................................................. 18
Business ....................................................................................................................................................... 18 Custom Properties ................................................................................................................................ 18
Counterparty ................................................................................................................................................ 19 Currency ....................................................................................................................................................... 19 Organization ................................................................................................................................................ 20 Rating .......................................................................................................................................................... 21 Scenario ....................................................................................................................................................... 21 Time ............................................................................................................................................................. 22
Custom Properties ................................................................................................................................ 22
Dimensions Overview The SAS Capital Planning and Management Banking Framework is organized into a single cycle that is named CPnM Banking. (See Figure 2-1.) The CPnM Banking cycle includes the following dimension types:
• Account—financial account or measure being analyzed
• Analysis—version of data such as historic actuals, forecast version 1, or forecast version 2
• Business—line of business (business unit) and product hierarchy
• Counterparty—placeholder for containing details about counterparty (not supported)
• Currency—monetary currency
• Organization—organization hierarchy
• Rating—rating grade
• Scenario— projected scenario used in combination with the analysis version (for example, baseline scenario and adverse scenario)
• Time—quarterly time periods
C H A P T E R

8 Account Chapter 2
Figure 2-1 CPnM Banking Cycle Dimensions
Note: In the Dimension workspace of the CPnM Banking cycle, each dimension type within the SAS Capital Planning and Management Banking Framework is prefixed with “CPnM.”
The following sections describe each of the CPnM dimension types as shown in Figure 2-1.
Account The Account dimension includes the various financial accounts and contains the greatest amount of formula logic within the SAS Capital Planning and Management Banking Framework.
The Account dimension consists of the following eight sections:
• Balance Sheet—members begin with “PB”
• Income Statement—members begin with “IS”
• Rates—members begin with “R”
• Capital—members begin with “C”
• Measures—members begin with “M”
• Scenario Factors—members begin with “F” (macroeconomic scenario factors)
• DFAST Template Mapping—members begin with “DFAST” (regulatory placeholder)
• CCAR FR Y-14A Mapping—members begin with “CCAR” (regulatory placeholder)

Dimensions Account 9
Figure 2-2 CPnM Account Hierarchies
Balance Sheet Members Balance sheet members begin with the prefix PB.
Balance Sheet accounts are all flow accounts (either revenue or expense) rather than balance accounts. This is required for the following reasons:
• Child members of each balance sheet account include members to capture period activity, such as new business or charge-offs. Decedents of balance accounts must also be balance accounts.
• In many instances, planning is done at an annual or quarterly level. Balance accounts do not allow data entry of parents of Time members.
• Balance account members that contain formulas cannot be scoped by time.

10 Account Chapter 2
To imitate the necessary behavior of balance accounts, the following combination of driver formulas are used by the SAS Capital Planning and Management Banking Framework:
• Opening Balance—sets the value to the ending balance of the previous period. If the period is the first projected period (as indicated by a custom property on the Time dimension), then the opening balance is equal to the ending balance of the NA Analysis/Scenario.
Figure 2-3 Opening Balance – First Projected Period
• First Projected Period—an important behavior of balance accounts is that they do not aggregate across time and they show the final period balance for time rollup members.
To imitate this behavior with flow accounts, a formula exists for each Analysis member that shows the last Time leaf member (or the first for opening balance members) for a time rollup, depending on the setting of the custom properties CPnM Ending and CPnM Opening.
Note: For actual periods, balance forwarding does not exist.
For example, all Opening Balance members show the first Time leaf member value; whereas, all top level balance sheet accounts such as Net Loans show the ending balance.
Balance Sheet Logic Flow The following sections outline the logic that is used for several sections of the balance sheet. For each section a series of inputs and output are identified.

Dimensions Account 11
Cash and Deposits with Banks The Cash section on the balance sheet contains details that are derived from many other sections. Most changes to other sections of the balance sheet have some equal and opposite impact on the cash balance.
Note: The purpose of the Cash section is to enable users to balance the balance sheet as projection values are interactively changed. If a new asset, liability, or equity account is introduced in the Cash section without a counter balancing entry, then the balance sheet does not tally.
The Cash account is divided into the following three broad categories:
• Cash Flow from Operations—consists primarily of inputs from the income statement
• Cash Flow from Investing—consists of inputs from changes to asset balances
• Cash Flow from Financing—consists of inputs from changes to liabilities and equity accounts
Figure 2-4 illustrates an overview of the Cash section on the balance sheet, including the various inputs.
Figure 2-4 Balance Sheet - Cash Section Overview
Net Loans Net Loans on the balance sheet consist of the gross loan balance by portfolio type and rating category, less the allowance for loan losses. Calculating the projected Net Loans balance involves a number of inputs in the form of rates and the From form.
Figure 2-5 illustrates the Net Loan logic as well as the impacting account sections.

12 Account Chapter 2
Figure 2-5 Balance Sheet - Net Loans Logic Overview
Note: The Form Input has calculated the total ALL, which is the sum of the future four quarter losses.
Income Statement Accounts Income statement accounts begin with the prefix IS.
Many of the members within the Income statement section contain driver formulas that depend on the values of balance sheet members. This requires that the affected income statement account member be visible on any forms where the balance sheet member might be modified.
For example, the Income statement member related to interest income that is related to Loans and Mortgages is a formula based on the Gross Loans multiplied by a rate type. Therefore, the Loans and Mortgages account member must be included on any forms that impact the Gross Loans value.
Capital Accounts Capital Accounts all begin with the prefix C.
There are three categories of capital members:
• Available Capital
• Required Capital
• Allocated Capital
Available Capital Available Capital contains a reclassification of various members from the balance sheet into Tier 1 and Tier 2 capital classification.
Required Capital Required Capital contains various formulas to provide a calculation of regulatory capital following the Basel III advanced approach for banking book instruments.
In addition, the SAS Capital Planning and Management Banking Framework provides a sample methodology of risk-weighted asset (RWA) projection based on historic RW and a

Dimensions Account 13
migration factor that is applied by the scenario. The scope of this method applies only to mortgage accounts in first lien position.
Table 2-1 outlines the formulas involved in the Required Capital member.
Table 2-1 Required Capital Member Formulas
Member Description Logic Scope
C00110 (Exposure at Default)
Approximate EAD based on the current balance
Gross Loans * rate type “EAD:Principal Ration”
• Balance sheet members with a Basel Asset class
• Forecast versions
• Projected time periods
C00120 (Risk Weighted Assets)
Calculates RWA based on advanced Basel III IRB RWA formula specific to each asset category
Function of EAD and rate types for LGD and PD, differing by asset category
• Balance sheet members with a Basel Asset class
• Forecast versions
• Projected time periods
C00131 (RC Credit Risk)
Calculates regulatory capital for credit risk based on RWA and various capitalization parameters by capital type
RWA * Sum(CRAR % + Conservation Buffer + Cyclicality Buffer)
• Balance sheet members with a Basel Asset class
• Forecast versions
• Projected time periods
C00141 (Non-diversified EC)
Calculates EC by multiplying RC by a ratio of EC:RC stored as a rate
RC * rate type EC:RC Ratio
• Forecast versions
C00143 (Diversification)
Calculates the benefit resulting from a diversification factor
Non-diversified EC * (1 – rate type Diversification factor)
• Forecast versions
• Projected time periods
C00142 (Diversified EC)
Calculates a diversified EC value using a rate type for diversification factor
Non-diversified EC * rate type Diversification factor)
• Forecast versions
• Projected time periods

14 Account Chapter 2
Allocated Capital Allocated Capital is an entered or allocated value that is independent of either available or required capital.
Rates All Rates members begin with the prefix R.
Most rate members are also defined as a rate type and exist as an account member for display and override purposes.
Because the values in a rate table cannot be modified from within a data-entry form, rates that are to be overridden on a data-entry form include a child member that uses a modeling formula to look up the value from the rate table. The changes are captured at the parent virtual child.
Note: A virtual child (VC member) is automatically assigned to any member that has child members that roll up to it. In a data-entry table, the virtual child is a writable member whose values contribute to the parent member.
Driver formulas that use the rate need to explicitly reference the difference captured in the virtual child since modeling formulas execute after modeling formulas.
Figure 2-6 illustrates an example for prepayments.
Figure 2-6 Driver Formula – Prepayments Example

Dimensions Account 15
Measures All Measures members begin with the prefix “M” and are organized into the following categories:
• Balance Sheet (M01)
• Balance Sheet (M02)
• Capital (M03)
• Liquidity (M04)
• Margin Analysis (M05)
• Growth Rates (M06)
• Operations (M07)
• Other Measures (M08)
The Measures members include a reporting formula to summarize and display various key measures in context of capital planning.
To view the logic and scope of each Measures member, complete the following steps in SAS Financial Management Studio:
1. In the Dimensions workspace, right-click CPnM Account and select Hierarchies in the pop-up menu.
2. In the list of CPnM Account Hierarchies, click to expand the M category.
3. Expand the Measure (M01, M02, and so on) for which you want to view members.
4. Right-click on the member in the list of members and select Properties from the pop-up menu.
5. In the Properties window, select Formulas. Note: The logic used by the Employees member of the Operations measure is an example of using macro factor-based regression to project the number of employees going forward. This serves as a good way to represent how a user performs such a projection.
Scenario Scenario members begin with the prefix F and include the following macroeconomic scenario factors:
• F001—Federal Factors
• F002—Domestic Federal Factors
• F003—International Federal Factors

16 Analysis Chapter 2
DFAST Template Mapping DFAST Template Mapping members begin with DFAST and include the following categories:
• Bal Sheet and Capital
• Income Statement
Note: DFAST Template Mapping is a regulatory placeholder.
CCAR FR Y-14A Mapping Comprehensive Capital Analysis and Review (CCAR) FR Y-14A Mapping members begin with the prefix CCAR and include the following:
• Income Statement Worksheet
• Balance Sheet Worksheet
• Capital Worksheet – CCAR
• Retail Balance and Loss Projections Worksheet
• Retail Accounting Standards Codification (ASC) 310-30 Worksheet
• Securities Other Than Temporary Impairment (OTTI) by Portfolio
• Securities Available-For-Sale (AFS) Market Shock
• Pre-Provision Net Revenue (PPNR) Projections Worksheet
• PPNR Net Interest Income (NII) Worksheet
• PPNR Metrics Worksheet
Note: CCAR FR Y-14A Mapping is a regulatory placeholder.
Analysis The Analysis dimension identifies the version of the data that is being analyzed. The Analysis dimension contains the following members:
Table 2-2 Members of the Analysis Dimension
Code Name/Description Purpose
ACT Actual Historic actual values
LIM Limit Capture of a limit
V1000 Forecast – Version 1 Projected values
V100-LIM Ver 1 – Limit Status Compares limit to projection
V2000 Forecast – Version 2 Projected values, second/alternative version
V3000 Forecast – Version 3 Rate-based version of entire projection
V4000 Forecast – Loaded Values Value-based version of entire projection

Dimensions Analysis 17
Custom Properties The Custom properties of the Analysis dimension members are the following (see Figure 2-7):
• CPnM_Forecast_Version (Forecast Version)–Boolean property set to true for Analysis dimension members that represent projected values (for example V1000). This property is used within formula scoping rules to identify a formula that is used for projecting values.
• CPnM_Limit_Version (Limit)—Boolean property set to true for Analysis dimension members.
• CPnM_Source (Source)–Character property that identifies the source system for data that is contained within the analysis member. For example, GL is identified as the source for Actual data.
• Forecast_Method—Character property that identifies whether the projections are computed with internal rates or computed with values that are loaded from an external system.
Note: V4000 is an example of values that are loaded from an external system. The SAS Capital Planning and Management Banking Framework provides a series of form sets that you can use to load data and review data in the Forms workspace. These form sets are located under the Capital Aggregation phase in the Forms workspace.
Figure 2-7 Analysis Dimension Custom Properties
18 Business Chapter 2
Formulas To view the formulas of the Analysis dimension, complete the following steps in SAS Financial Management Studio:
1. In the Dimensions workspace, right-click CPnM Analysis and select Hierarchies in the pop-up menu.
2. In the list of CPnM Analysis Hierarchies, right-click on the member for which you want to view the formula and select Properties in the pop-up menu.
3. In the Properties window, select Formulas.
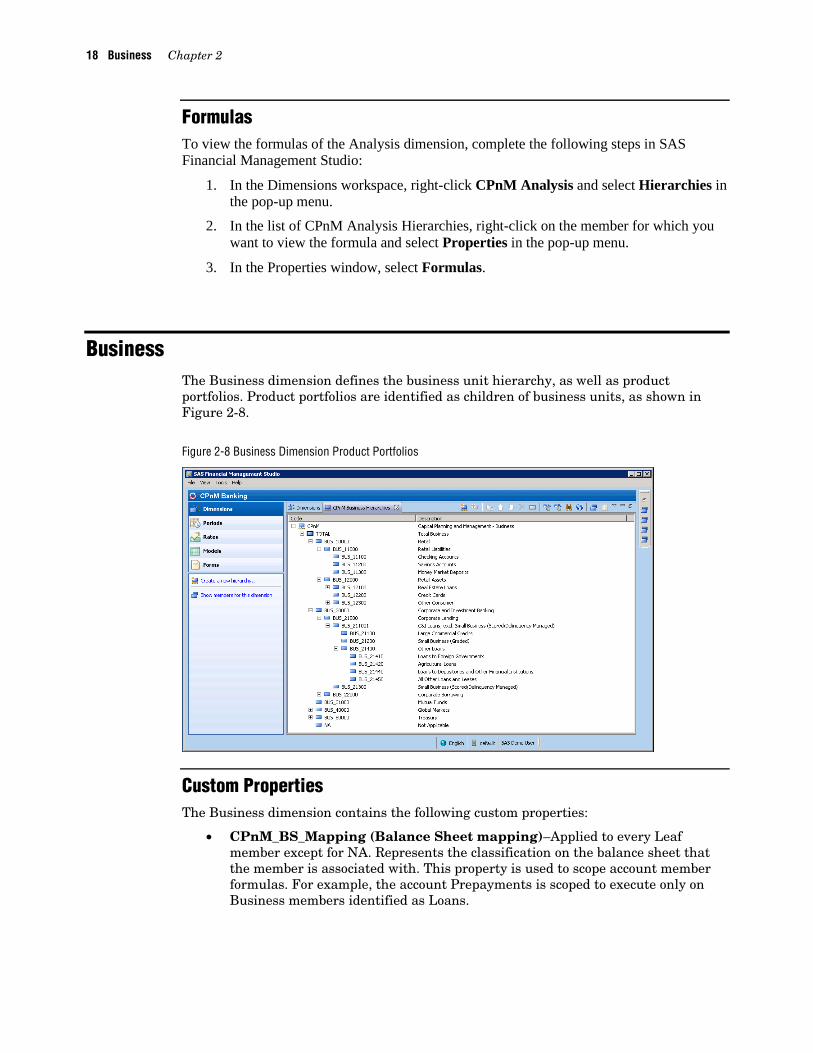
Business The Business dimension defines the business unit hierarchy, as well as product portfolios. Product portfolios are identified as children of business units, as shown in Figure 2-8.
Figure 2-8 Business Dimension Product Portfolios
Custom Properties The Business dimension contains the following custom properties:
• CPnM_BS_Mapping (Balance Sheet mapping)–Applied to every Leaf member except for NA. Represents the classification on the balance sheet that the member is associated with. This property is used to scope account member formulas. For example, the account Prepayments is scoped to execute only on Business members identified as Loans.

Dimensions Currency 19
The following custom properties apply:
• Deposits
• Loans
• Off balance sheet
• Commercial Paper
• Trading Assets
• Cash
• CPnM_Basel_Asset_Class (Basel III Asset Class)–Applied to every Leaf member subjected to calculation of risk weighted assets. This property is used in scoping of the risk weighted asset formula.
The following custom properties apply:
• Residential Mortgages
• High Volatility Commercial Real Estate (HVCRE)
• Corporate
• Qualifying Revolving Retail Exposure (QRRE)
• Other Retail
• Banks
Counterparty The Counterparty dimension is a placeholder dimension to capture optional counterparty details. The banking framework hierarchy includes the following:
• Total
NA–Not Applicable. This is the default member.
Note: The Counterparty dimension has been removed from the cycle. However, it still exists in the SAS Financial Management Studio Dimension workspace.
Currency The Currency dimension has been preloaded with 21 significant currency members. Each member uses the standard ISO 4217 standard currency code.
The members of the Currency dimension include the following:
• USD US Dollar(this is the default currency)
• CAD Canadian dollar
• EUR Euro
• BRL Brazilian real
• ARS Argentine peso
• DKK Danish krone

20 Organization Chapter 2
• NOK Norwegian krone
• PLN Polish zloty
• RUB Russian ruble
• ZAR South African rand
• SEK Swedish krona
• CHF Swiss franc
• GBP British Pound
• INR Indian rupee
• CNY Chinese Yuan
• SGD Singapore dollar
• MYR Malaysian ringgit
• AUD Australian dollar
• JPY Japanese yen
• KRW South Korean won
• NZD New Zealand dollar
No exchange rates have been preloaded for any time periods. To use a currency other than the default currency, which is USD, you must load a valid set of exchanges.
Organization The Organization dimension represents the bank organization structure. Within the banking framework, each member represents a reporting entity with functional currency of USD. (See Figure 2-9.)
Note: Business units or lines of business are represented in the Business dimension rather than the Organization dimension.
Figure 2-9 Organization Dimension

Dimensions Time 21
Rating The Rating dimension comprises the following members:
• Total Rating
• Average All Rating Grades
• Internal Grade 1 through 10
• NA
Scenario The Scenario dimension provides the details for each planning scenario within a given analysis version. In a capital planning process, a bank creates a capital projection for a number of alternative scenarios.
The Scenario dimension functions similarly to the Analysis dimension. The primary difference is that the Analysis dimension identifies the version of a particular scenario. For example, a bank might plan many versions of its baseline or expected scenario as well as multiple versions of an adverse scenario.
Note: Each scenario includes a base member to which data is loaded and an adjustment member, which is used to capture management or other types of adjustments beyond computed projections. The structure for scenarios enables you to report on projections with and without adjustment for management reviews.
The Scenario dimension contains the following members:
Table 2-3 Members of the Scenario Dimension
Code Name/Description Purpose
T_SCN_1000 SCN_1000 SCN_1000_A
Total Baseline Baseline Adjustment
Most likely or expected scenario
T_SCN_2000 SCN_2000 SCN_2000_A
Total Adverse Adverse Adjustment
Scenario depicting adverse macroeconomic conditions
T_SCN_3000 SCN_3000 SCN_3000_A
Total Severely Adverse Severely Adverse Adjustment
Scenario depicting very adverse macroeconomic conditions
NA Not Applicable Used for historic and actual data (Analysis = Actual)

22 Time Chapter 2
Time The Time dimension comprises 12 years of quarterly time members.
The two levels of the hierarchy are the following:
Level Code Name Description
Quarterly Year#Q# Example: Year3Q3
Q# YYYY Example: Q3 2013
Quarter # YYYY Example: Quarter 3 2013
Custom Properties The Time dimension contains the following custom properties:
• CPnM_TimePerspective (Perspective)–Character property used for reporting and formula scoping purposes. Many formulas are scoped to execute only on monthly members that are identified as projected time periods. There are two possible values: Historic or Projected. Every member must belong to either one of the two possible values.
• CPnM_InitialPlanningPeriod (Initial Planning Period)–Boolean property set to true for a single monthly time member that represents the first planning period. This property is used within the formula to establish starting balances going forward for each version and scenario.
• CPnM_FirstPeriod—Boolean property set to true for the first projected period.
23
3 Rate Types
Rate Types Overview .................................................................................................................................... 23 Forecast Rates and What If Scenario Rates ........................................................................................ 23
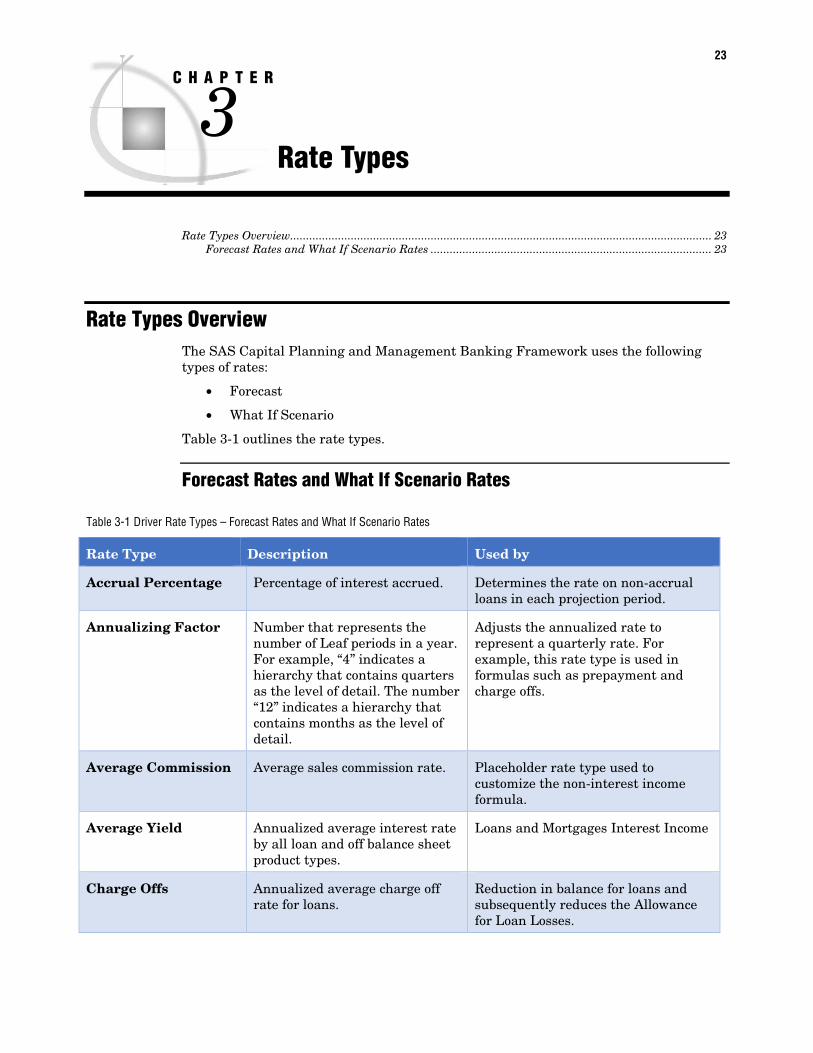
Rate Types Overview The SAS Capital Planning and Management Banking Framework uses the following types of rates:
• Forecast
• What If Scenario
Table 3-1 outlines the rate types.
Forecast Rates and What If Scenario Rates
Table 3-1 Driver Rate Types – Forecast Rates and What If Scenario Rates
Rate Type Description Used by
Accrual Percentage Percentage of interest accrued. Determines the rate on non-accrual loans in each projection period.
Annualizing Factor Number that represents the number of Leaf periods in a year. For example, “4” indicates a hierarchy that contains quarters as the level of detail. The number “12” indicates a hierarchy that contains months as the level of detail.
Adjusts the annualized rate to represent a quarterly rate. For example, this rate type is used in formulas such as prepayment and charge offs.
Average Commission Average sales commission rate. Placeholder rate type used to customize the non-interest income formula.
Average Yield Annualized average interest rate by all loan and off balance sheet product types.
Loans and Mortgages Interest Income
Charge Offs Annualized average charge off rate for loans.
Reduction in balance for loans and subsequently reduces the Allowance for Loan Losses.
C H A P T E R

24 Rate Types Overview Chapter 3
Rate Type Description Used by
Collateral Haircut Percentage by which an asset's market value is reduced for the purpose of calculating capital requirements, margin and collateral levels.
Determines the amount of collateral required under different scenarios, thereby requiring the bank to increase or decrease their projections based on margin call requirements.
Convexity Sensitivity The magnitude of a financial instrument’s reaction to convexity.
Projects convexity values for fixed income instruments.
Note: This is a partially developed example rate set.
Deposit Rate Annualized average interest rate for all deposit accounts.
Deposits Interest Expense
Diversification Factor
Drawdown Percentage of off-balance sheet product that is drawn in a given period.
The drawdown percentage is applied against the opening balance of off-balance sheet amount. The resulting drawdown amount appears on the balance sheet within the Loans as either a new loan amount or as a reduction.
Duration Sensitivity The magnitude of a financial instrument’s reaction to duration.
EAD: Principal Ratio Ratio used to translate current exposure at default (EAD).
EAD given the projected loan balance as needed for subsequent risk weighted assets (RWA) calculations.
EC:RC Ratio Ratio used to compare the economical capital (EC) with the regulatory capital (RC).
Projects economic capital based on relationship to regulatory capital.
Factor Adjustment Note: Not currently used.
Factor Adjustment - Yield
Factor to adjust the yield on Trading Asset Related Interest Income.
Used in the projection of the interest income category for trading assets.
Growth Index Growth index used for the top-down stress testing example. Enables you to shock macro factor and the impact on loan growth.
In the loan growth account member, this rate relates macro shocks to increases or decreases in loan volumes.
LGD Loss given default RWA

Rate Types Rate Types Overview 25
Rate Type Description Used by
MTM Sensitivity Mark-to-market sensitivity. Used for projection of mark to market in the trading book, which is then used to compute the forecast of trading revenues and losses from period to period.
New Business Spread Interest rate spread for new business.
Used in the forecast of Net Interest Income on Loans, which is the rate applied to all new business volumes throughout the projection period.
New Growth Rating Distribution
Distribution of new loans by rating grade that will be applied.
Distribution rate across rating grade for projections.
PD Probability of default. Loan associated probability of default.
Prepayments Annualized average repayment rate for loans.
Loan Reduction in Balance
Rating Migration The migration of credit rating (up or down) over a period of time.
Captures the rate of migration across rating grades from period to period.
Risk Weight Actual Risk Weight for all asset types that are used as a starting point for RWA projection of first lien mortgages.
Used in the forecast of RWA over the stress horizon.
Run Off Annualized run-off rate of deposit accounts.
Deposit Run Off
RW Adjustment Factor
Risk weighted Migration factor applied to Risk Weight in the Projection of RWA.
Service Charge Average service charge rate applied to all deposit accounts.
Non-interest income of service charges on deposit accounts
Tax Deferral Rate Rate of tax deferred investments. Projects deferred tax assets (DTA) as a percentage of the current taxes paid.
Tax Rate Estimated tax rate for actual and projected period.

26 Rate Types Overview Chapter 3
27
4 Form Sets
Form Sets Overview ..................................................................................................................................... 27 Capital Aggregation Phase .......................................................................................................................... 28
Credit Data Form Set ........................................................................................................................... 28 ALM Balances and NII Form Set ........................................................................................................ 28 Management Review – Baseline Credit and ALM (NII) Data Form Set ............................................. 29
Capital Projection Phase ............................................................................................................................. 29 Scenario Library Form Set .................................................................................................................. 30 Business Rates Form Set ...................................................................................................................... 30 Trading Asset Projections Form Set .................................................................................................... 31 Loan Projections Form Set ................................................................................................................... 32 Off Balance Sheet Projections Form Set .............................................................................................. 33 Deposit Projections Form Set ............................................................................................................... 34 Debt Projections Form Set .................................................................................................................... 35 Operating Budget Form Set ................................................................................................................. 35 Other Balance Sheet Projections Form Set .......................................................................................... 36 Capital Actions Form Set ..................................................................................................................... 37 Capitalization Parameters Form Set ................................................................................................... 38 Study Definition Form Set ................................................................................................................... 39 Management Overrides Baseline Form Set ......................................................................................... 39
CPnM Allocation Phase ............................................................................................................................... 39 Risk Appetite Phase ..................................................................................................................................... 39 Configuration and Administration Phase................................................................................................... 39
All Scenario Driver Formula Calculations Form Sets (V1000, V2000, V3000, and V4000) .............. 40
Form Sets Overview Form sets are organized into five phases as shown in Figure 4-1:
• Capital Aggregation—form sets to load and review Analysis member V4000 where you can load by using forms, directly computed forecast by an external system. In these form sets none of the rate calculations are effective. The Property member in the V4000 Analysis member forecast method is set to “value” instead of “rate” for other analysis members.
• Capital Projection—form sets to collect all necessary inputs to project the balance sheet and income statement three years.
• Allocation—form sets for allocating capital to business units.
• Risk Appetite—form set for determining the level and types of risk a firm is willing to assume within its risk capacity to achieve its strategic objectives and business plan.
• Configuration and Administration–form sets for setup as well as running driver formulas.
Note: A phase is a collection of form sets.
C H A P T E R

28 Capital Aggregation Phase Chapter 4
Figure 4-1 CPnM Banking Form sets
Capital Aggregation Phase The CPnM Capital Aggregation phase contains all of the form sets that are needed to X.
The CPnM Capital Aggregation phase contains the following form sets:
• Credit Data Aggregation
• ALM Balances and NII
• Management Review – Baseline Credit and ALM (NII)
Credit Data Form Set The Credit Data form set enables you to review and validate that the charge off data loaded to the SAS Capital Planning and Management Banking Framework is accurate, and meets the data validation criteria set by the treasury aggregation team.
This form is used to either enter data directly into the form or review the data entered by using SAS Data Integration Studio.
Note: You can override certain data to pass validation rules.
ALM Balances and NII Form Set The ALM Balances and NII form set enables ALM users to enter new loan and deposit balances directly into the system as well as interest income and expense data for these accounts.
The data validation rules include a check to make sure that any growth rate does not put the user in a negative cash position.

Form Sets Capital Projection Phase 29
This form is used to either enter data directly by using the form or to review the data entered by using the SAS Data Integration Studio process.
Note: You can override certain data filed to meet validation rules.
Management Review – Baseline Credit and ALM (NII) Data Form Set The Management Review – Baseline Credit and ALM (NII) form set enables management to review and override numbers entered in V4000 by using the adjustment Scenario dimension member. This feature enables management overrides to be captured and reported on separately from the data that is entered by the business lines.
Capital Projection Phase The CPnM Capital Projection phase contains all of the form sets that are needed to collect inputs to project out the balance sheet and income statement values for three years.
The CPnM Capital Projection phase contains the following form sets:
• Scenario Library
• Business Rates
• Trading Asset Projections
• Loan Projections
• Off Balance Sheet Projections
• Deposit Projections
• Debt Projections
• Operating Budget
• Balance Sheet Projection – all other items
• Capital Actions
• Capitalization Parameters
• Study Definition
• Management Overrides Baseline
The following sections provide information about each of these form sets.

30 Capital Projection Phase Chapter 4
Scenario Library Form Set The Scenario Library form set enables you to review and update macro factors directly into the form. It is used to vet the different macro factor values from the regulators, as well as any expanded scenario variables.
Figure 4-2 Scenario Library Form Set
Business Rates Form Set The Business Rates form set enables you to modify various rates that are leveraged by subsequent forms. The rates are sourced from rate types within rate tables for each.
You can enter or modify the rate by entering at a parent rate member, which stores a modified amount in the virtual child. Formulas using this rate need to reference both the rate type and any value that is stored in the virtual child.
Figure 4-3 Business Rates Form Set
Form Sets Capital Projection Phase 31
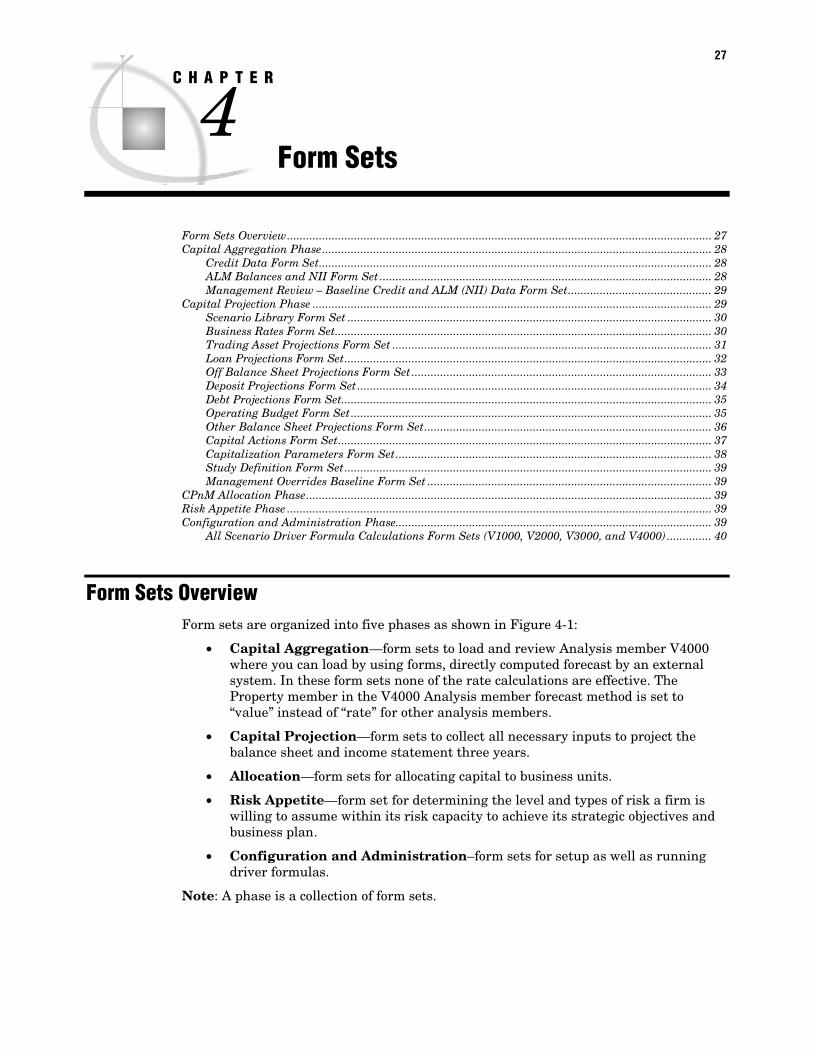
A number of form sets contain driver formulas that are dependent on values modified in the Business Rates form set. Each of the form sets shown in Figure 4-4 require that you rerun the driver formula after making changes to Business Rates. Alternatively, the driver formulas can be run in the administrative Scenario Driver Formula Calculations form set.
Figure 4-4 Form Sets That Are Dependent on the Business Rates Form Set
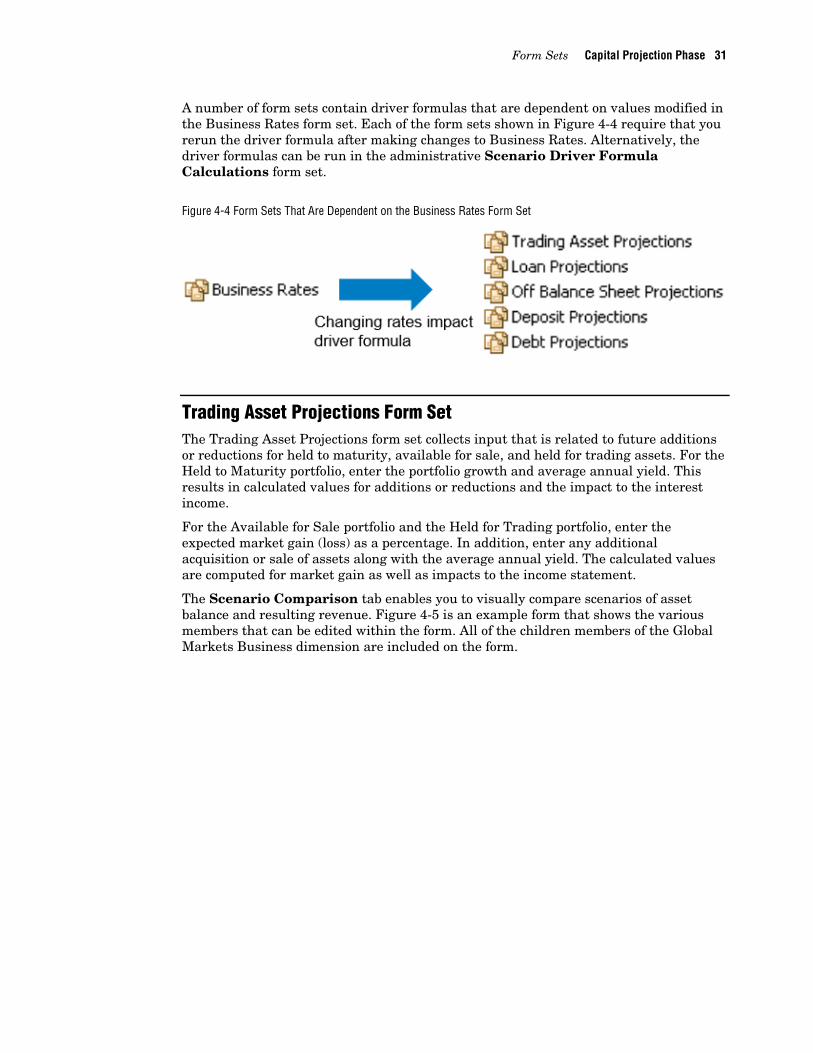
Trading Asset Projections Form Set The Trading Asset Projections form set collects input that is related to future additions or reductions for held to maturity, available for sale, and held for trading assets. For the Held to Maturity portfolio, enter the portfolio growth and average annual yield. This results in calculated values for additions or reductions and the impact to the interest income.
For the Available for Sale portfolio and the Held for Trading portfolio, enter the expected market gain (loss) as a percentage. In addition, enter any additional acquisition or sale of assets along with the average annual yield. The calculated values are computed for market gain as well as impacts to the income statement.
The Scenario Comparison tab enables you to visually compare scenarios of asset balance and resulting revenue. Figure 4-5 is an example form that shows the various members that can be edited within the form. All of the children members of the Global Markets Business dimension are included on the form.
32 Capital Projection Phase Chapter 4
Figure 4-5 Trading Assets Projections Form Set
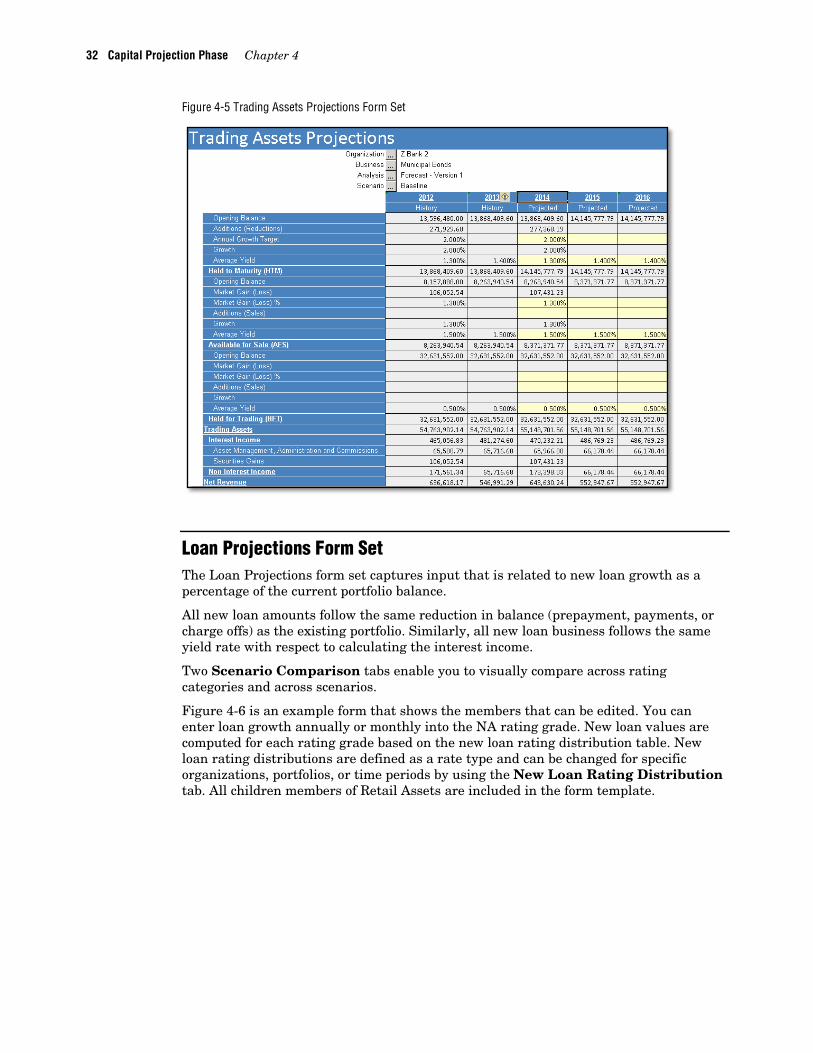
Loan Projections Form Set The Loan Projections form set captures input that is related to new loan growth as a percentage of the current portfolio balance.
All new loan amounts follow the same reduction in balance (prepayment, payments, or charge offs) as the existing portfolio. Similarly, all new loan business follows the same yield rate with respect to calculating the interest income.
Two Scenario Comparison tabs enable you to visually compare across rating categories and across scenarios.
Figure 4-6 is an example form that shows the members that can be edited. You can enter loan growth annually or monthly into the NA rating grade. New loan values are computed for each rating grade based on the new loan rating distribution table. New loan rating distributions are defined as a rate type and can be changed for specific organizations, portfolios, or time periods by using the New Loan Rating Distribution tab. All children members of Retail Assets are included in the form template.
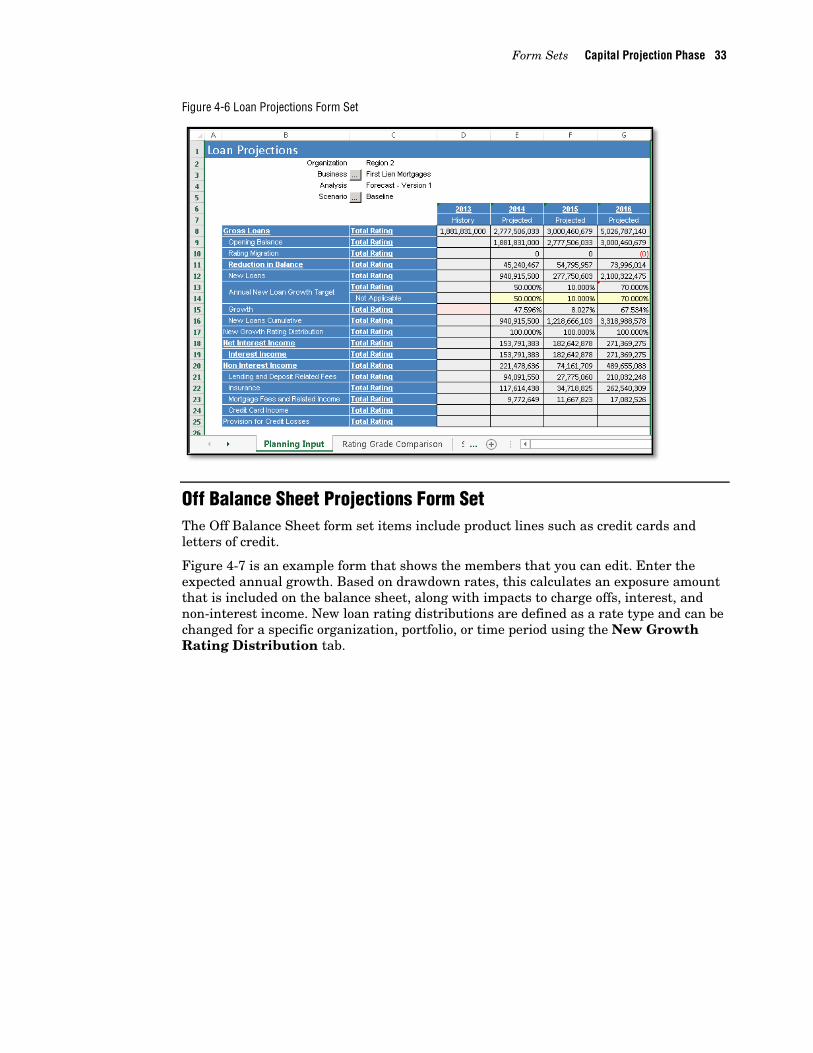
Form Sets Capital Projection Phase 33
Figure 4-6 Loan Projections Form Set
Off Balance Sheet Projections Form Set The Off Balance Sheet form set items include product lines such as credit cards and letters of credit.
Figure 4-7 is an example form that shows the members that you can edit. Enter the expected annual growth. Based on drawdown rates, this calculates an exposure amount that is included on the balance sheet, along with impacts to charge offs, interest, and non-interest income. New loan rating distributions are defined as a rate type and can be changed for a specific organization, portfolio, or time period using the New Growth Rating Distribution tab.

34 Capital Projection Phase Chapter 4
Figure 4-7 Off Balance Sheet Commitment Projections Form Set
Deposit Projections Form Set The Deposit Projections form set captures the input related to annual deposit growth as a percentage of the deposit balance. All new deposit amounts follow the same run off and interest expense rate as the existing balances.
The Scenario Comparison tab provides a visual comparison across scenarios.
Figure 4-8 is an example form that shows the members that you can edit. The annual deposit growth target results in a calculated value for new deposits. The growth calculation is net growth after the run off has been accounted for.
Figure 4-8 Deposit Projections Form Set

Form Sets Capital Projection Phase 35
Debt Projections Form Set The Debt Projections form set enables input that details short-term and long-term debt. Short-term debt is divided into business lines for CDs, bonds, and long-term deposit accounts. Long-term debt is in the form of subordinated debt, each as a separate account.
Figure 4-9 is an example form that indicates the data that is collected for Debt Projections. For each item, any new debt (or reduction or retired) is indicated. Also entered on the Debt Projections form set is the annual average rate paid on the debt. The annual average rate paid on the debt is used in calculating the interest expense items on the income statement.
Figure 4-9 Debt Projections Form Set
Operating Budget Form Set The Operating Budget form set captures various non-interest related expense items. The Operating Budget form set is a simplified operating budget form with broad categories of expense captured. All items are entered in the form with no formulas or projected calculations occurring.

36 Capital Projection Phase Chapter 4
Figure 4-10 is an example of the form that shows the various items that are captured on the form.
Figure 4-10 Operating Budget Form Set
Other Balance Sheet Projections Form Set The Other Balance Sheet Projections form set captures changes to items that are typically centrally managed or change very little (for example, items such as Goodwill, Intangibles, and other assets and liabilities).
Figure 4-11 is an example of the form that shows input related to changes to Premises and Equipment.

Form Sets Capital Projection Phase 37
Figure 4-11 Other Balance Sheet Projections Form Set
Capital Actions Form Set The Capital Actions form set captures all changes that are related to shareholder equity. This includes stock issuance/buy back, dividend policy, and subordinate debt.
Figure 4-12 is an example form that outlines the various items input for both Preferred and Common Stock.
Figure 4-12 Capital Actions Form Set

38 Capital Projection Phase Chapter 4
Capitalization Parameters Form Set The Capitalization Parameters form set captures the percentage capital to the risk weighted asset (RWA) ratio and additional buffers. These ratios are multiplied by the RWAs to determine the required capital amount. A bank can select to increase and drawdown its buffers under different scenarios.
Figure 4-13 is an example form that indicates the various items collected. The three main sections consist of the main capital to RWA ratio and two capital buffers for Conservation and Cyclicality. Each section is decomposed into Core Tier 1, Additional Tier 1, and Tier 2 percentages.
Figure 4-13 Capitalization Parameters Form Set

Form Sets Configuration and Administration Phase 39
Study Definition Form Set The Study Definition form set captures the top-down macro factor changes to be applied to the balance sheet in the event that you want to run an ad hoc scenario.
The Study Definition form set is used with the new study process found in the Processes tab in the SAS Financial Management Studio web application.
Once you have made an update, you can complete the task in the Process Manager function of the SAS Financial Management web application, then the stress values are fed to the internal lookup table and a new balance sheet forecast is computed.
Management Overrides Baseline Form Set The Management Overrides Baseline form set captures management overrides for the baseline forecast for analysis members for which the forecast method is set to “rate.”
CPnM Allocation Phase The CPnM Allocation phase consists of the following two sample form sets for allocating capital:
• Capital Allocation-Top Down Auto Allocation
• Capital Allocation-Optimization Method
Risk Appetite Phase The Risk Appetite phase provides a form set to define and establish limits for certain Account dimension members for which limit comparison is important.
Accounts such as Tier 1 Capital Ratio are included in this form set.
Configuration and Administration Phase The form sets in the Configuration and Administration phase provide a method to enter some initial starting values, and they provide a mechanism to run all driver formulas in a single location.
The Configuration and Administration Phase contains the following five form sets:
• All Scenario Driver Formula Calculations-V1000
• All Scenario Driver Formula Calculations-V2000
• All Scenario Driver Formula Calculations-V3000
• All Scenario Driver Formula Calculations-V4000
• Baseline Scenario Driver Formula Calculations-V2000
The following section briefly describes each of the five form sets that make up the Configuration and Administration phase.

40 Configuration and Administration Phase Chapter 4
All Scenario Driver Formula Calculations Form Sets (V1000, V2000, V3000, and V4000) Use the All Scenario Driver Formula Calculations form sets to run the driver formula associated with all projected scenarios.
Run the driver formula for these form sets at the outset of the planning cycle to set the initial balances of all scenarios with the last actual balance. Also, run the driver formula if any rates have been modified (either reloaded to a rate table or changed in the Business Rates form set).

41
5 Reports
Reports Overview ......................................................................................................................................... 41 Capital Report ............................................................................................................................................. 42
Capital Ratios ...................................................................................................................................... 42 Available Capital ................................................................................................................................. 44 Required Capital .................................................................................................................................. 44 Capital Surplus .................................................................................................................................... 45
Financial Statements – Audit View............................................................................................................. 46 Financial Statements................................................................................................................................... 47
Financial Statements - Historical ........................................................................................................ 47 Economic Factors – Scenario Library .................................................................................................. 48 Scenario Summary ............................................................................................................................... 48 Financial Statements – Forecast .......................................................................................................... 49 Forecasted Capital Ratios .................................................................................................................... 49 Limits and Risk Tolerance ................................................................................................................... 50 Scenario Comparison ........................................................................................................................... 50 Version Comparison ............................................................................................................................. 50 Gross Loan Impact Review 1................................................................................................................ 51 Gross Loan Impact Review 2................................................................................................................ 51
FR Y 14A Template...................................................................................................................................... 52 OCC DFAST 10-50B .................................................................................................................................... 52 Risk Profile .................................................................................................................................................. 52
Reports Overview The SAS Capital Planning and Management Banking Framework provides the following principal reports, each of which contains one or more tabs or sheets:
• Capital Report–contains various views of capital ratios, measures, and details about available and required capital projections.
• Financial Statements–contains a balance sheet, an income statement, and a cash flow report.
• FR Y 14A Template—contains sample federal reserve templates that SAS provides as a part of a Customer Care Agreement (CCA). The SAS Capital Planning and Management Banking Framework contains a generic version of the templates, which are not completely mapped to the balance sheet and income statement. However, complete FR Y 14A templates are available through a Professional Services Agreement.
• OCC DFAST 10-50B- contains sample federal reserve Office of the Comptroller of the Currency’s (OCC) templates that SAS provides as a part of a Customer Care Agreement (CCA). The SAS Capital Planning and Management Banking Framework contains a generic version of the templates. However, complete OCC templates are available through a Professional Services Agreement.
• Risk Profile–contains a report that rates category of risk weighted assets and exposure at default.
C H A P T E R

42 Capital Report Chapter 5
You can view these reports by using the SAS Visual Analytics Viewer, which you can access from the SAS Financial Management web application. To access the reports from the SAS Financial Management web application, click the home icon and then select Open in the Common Actions section.
In the Open dialog box, select Products > SAS Capital Planning and Management > 2.2 Standard Reports.
Figure 5-1 SAS Capital Planning and Management Banking Framework Standard Reports
Capital Report The Capital Report consists of the following tabs that you can use for reviewing capital ratios and available and required capital:
• Capital Ratios
• Capital Surplus
• Available Capital
• Required Capital
Capital Ratios The Capital Ratios tab provides a summarized view of the various key measures and ratios for the projected periods. A scenario comparison chart shows a comparison between different scenarios for one selected measure. Figure 5-2 is an example of the information on the Capital Ratios tab.

Reports Capital Report 43
Figure 5-2 Capital Ratios Tab

44 Capital Report Chapter 5
Available Capital The Available Capital tab provides projected available capital broken down by the type of capital (Core Tier 1, Additional Tier 1, and Tier 2).
Figure 5-3 is an example of the information on the Available Capital tab.
Figure 5-3 Available Capital Tab
Required Capital The Required Capital tab is a report that shows the necessary capital given the anticipated portfolio. The necessary capital is based on calculation of risk weighted assets in combination with capital buffer parameters.
Figure 5-4 is an example of the information available on the Required Capital tab.
Figure 5-4 Required Capital Tab

Reports Capital Report 45
Capital Surplus The Capital Surplus tab combines both available and required capital and provides details about projected surplus or deficits of capital over the projected time horizon.
Figure 5-5 is an example of the information available on the Capital Surplus tab.
Figure 5-5 Capital Surplus Tab
46 Financial Statements – Audit View Chapter 5
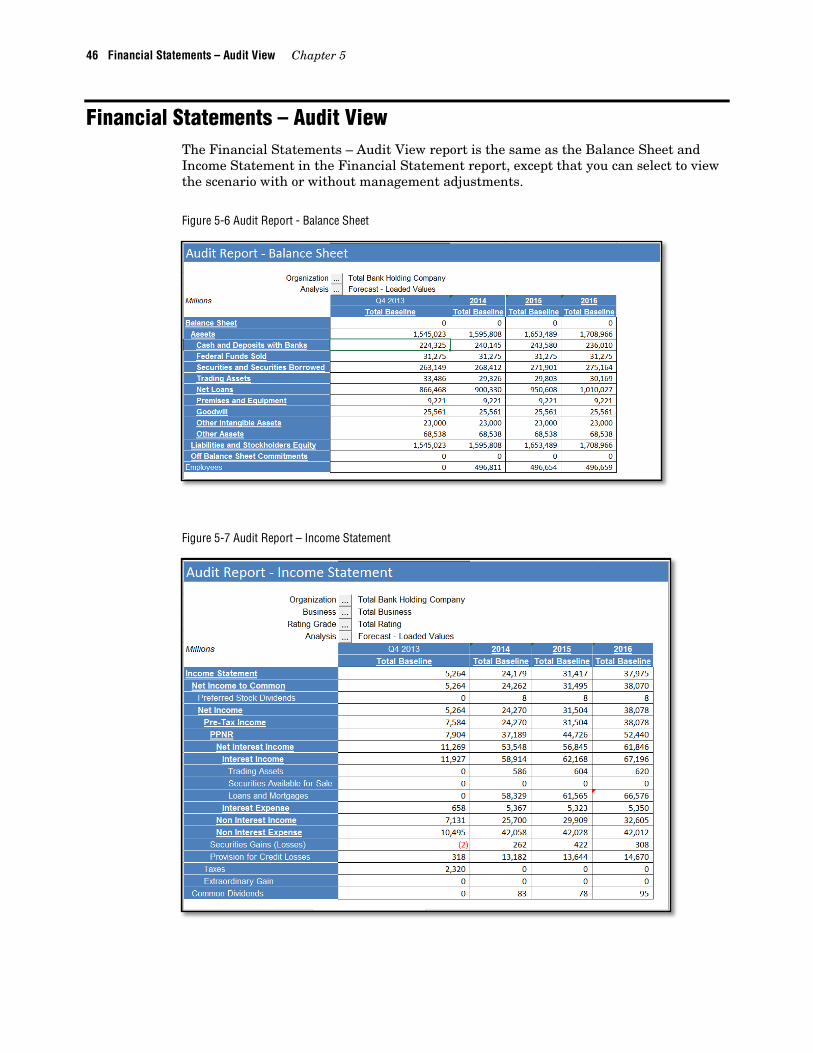
Financial Statements – Audit View The Financial Statements – Audit View report is the same as the Balance Sheet and Income Statement in the Financial Statement report, except that you can select to view the scenario with or without management adjustments.
Figure 5-6 Audit Report - Balance Sheet
Figure 5-7 Audit Report – Income Statement

Reports Financial Statements 47
Financial Statements The Financial Statements report combines both available and required capital. It provides details about projected surplus or deficits of capital over the projected time horizon. The Financial Statements report contains the following:
• Financial Statements – Historic
• Economic Factors – Scenario Library
• Scenario Summary
• Financial Statements – Forecast
• Forecasted Capital Ratios
• Limits and Risk Tolerance
• Scenario Comparison
• Version Comparison
• Gross Loan Impact Review 1
• Gross Loan Impact Review 2
Financial Statements – Historical
Figure 5-8 Financial Statements – Historical

48 Financial Statements Chapter 5
Economic Factors – Scenario Library
Figure 5-9 Economic Factors – Scenario Library
Scenario Summary
Figure 5-10 Scenario Summary
Reports Financial Statements 49
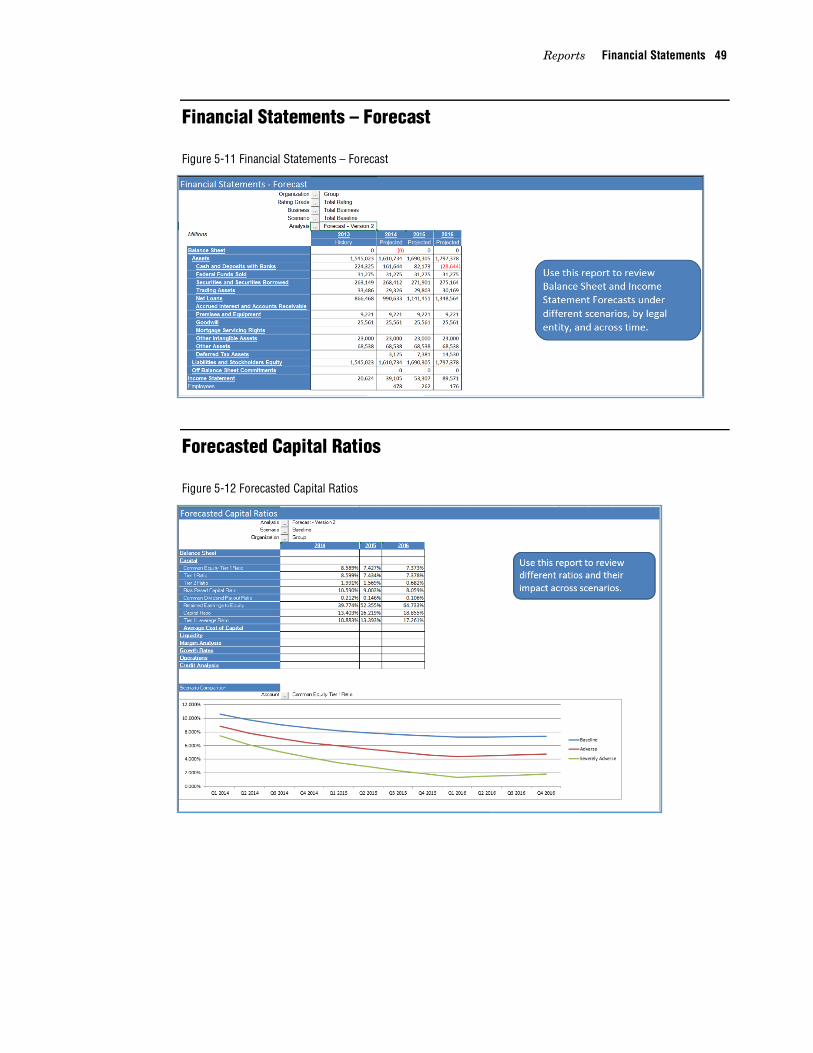
Financial Statements – Forecast
Figure 5-11 Financial Statements – Forecast
Forecasted Capital Ratios
Figure 5-12 Forecasted Capital Ratios

50 Financial Statements Chapter 5
Limits and Risk Tolerance
Figure 5-13 Limits and Risk Tolerance
Scenario Comparison
Figure 5-14 Scenario Comparison
Version Comparison Use the Version Comparison report to quickly investigate where the impact of running a macro stress scenario is most influential on the Balance Sheet and Income Statement.
Reports Financial Statements 51
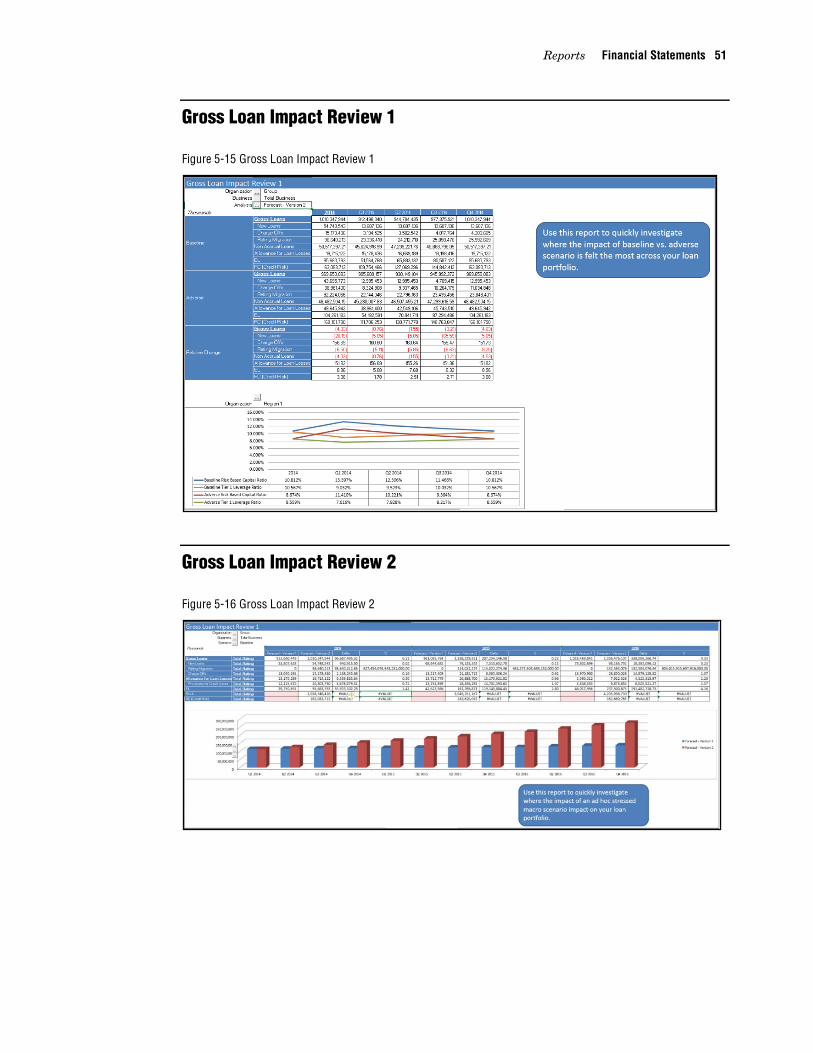
Gross Loan Impact Review 1
Figure 5-15 Gross Loan Impact Review 1
Gross Loan Impact Review 2
Figure 5-16 Gross Loan Impact Review 2

52 Risk Profile Chapter 5
FR Y 14A Template The FY Y 14A Template is an out-of-the-box sample FR Y 14A summary schedule from the Federal Reserve. You can obtain updated versions and maintenance through a SAS Professional Services Agreement. In addition, with a Professional Services Agreement, you can obtain the XML macro to generate filing forms.
OCC DFAST 10-50B The OCC DFAST 10-50B is an out-of-the-box sample DFAST 10-50b schedule from the OCC. You can obtain updated versions and maintenance through a SAS Professional Services Agreement. In addition, with a Professional Services Agreement, you can obtain the XML macro to generate filing forms.
Risk Profile The Risk Profile report shows the distribution of credit exposures at default (EAD) and corresponding risk weighted assets (RWA) across the internal rating categories. This information is used to help review, analyze, and optimize risk distribution and risk profile of portfolios.
Figure 5-17 is an example of the Risk Profile report.
Figure 5-17 Risk Profile Report