SARVEKSHANA - Ministry of Statistics and Program...
286
SARVEKSHANA 89th Issue Vol. XXVI No. 2 Journal of National Sample Survey Organization National Sample Survey Organisation Ministry of Statistics & Programme Implementation Government of India New Delhi
Transcript of SARVEKSHANA - Ministry of Statistics and Program...

SARVEKSHANA89th Issue
Vol. XXVI No. 2
Journal of
National Sample Survey Organization
National Sample Survey OrganisationMinistry of Statistics & Programme Implementation
Government of IndiaNew Delhi

Journal of National Sample Survey Organisation
Editorial Advisory BoardProf. Dipankar Coondoo, Indian Statistical Institute, Kolkata (Chairman)Prof. T.J. Rao, Indian Statistical Institute, KolkataProf. Ravi Srivastava, Centre for the Study of Regioinal Development, Jawahar Lal Nehru University,New Delhi.Dr. Manoj Panda, Indira Gandhi Institute of Development Research, A.K. Vaidhya Marg, Goregaon (East),Mumbai-400065.Dr. K.V. Rao, Director General & Chief Executive Officer, NSSO, Sardar Patel Bhavan, Sansad Marg,New Delhi-110001.Deputy Director General, Survey Design & Research Division, NSSO, 164, G.L.T. Road, MahalanobisBhavan, Kolkata.Deputy Director General, Coordination & Publication Division, NSSO, Sardar Patel Bhavan, Sansad Marg,New Delhi-110001 (Managing Editor)
Editorial Secretariat - Coordination and Publication Division, National Sample Survey Organisation,Sardar Patel Bhavan, New Delhi-110001.Mr. Ramkripal, DirectorMr. Bhupinder Kumar, S.S.O.Mr. S.A. Beg, J.I.
Frequency and Subscription‘Sarvekshana’ is published twice a year
The subscription rate is Rs. 200 per issue.Mail subscription to: Controller of Publications, Department of Publication, Civil Lines, Delhi-110054.Ph. 23819689, 23813302, 23817823
Manuscript Submission‘Sarvekshana’ is aimed at encouraging research and analysis of NSS data to bring about a deeper understanding ofsocio-economic development of the country. For details about manuscript submission refer to back of cover page.
Opinions expressed in ‘Sravekshana’ are those of the authors and not necessarily reflect the views or policies of theNSSO or the Government of India. NSSO is not responsible for the accuracy of the data and information included inthe technical papers nor does it accept any consequence for their use. Material in ‘Sarvekshana’ may be freely quotedwith appropriate acknowledgement and a copy of the publication sent to the Managing Editor.
Suggestions for improvement of the Journal may be addressed to:
The Managing Editor, Sarvekshana,Coordination and Publication DivisionNational Sample Survey OrganisationSardar Patel Bhawan, Sansad Marg, New Delhi.
SarvekshanaVol. XXVI No2Issue No. 89

CONTENTS
PART – I : TECHNICAL PAPERS
Page1. Employment in Unorganised Manufacturing in India: Post-Reform Trends 1-23
and Future Directions (G. K. Chadha and P. P. Sahu)2. Small Area Estimation Using GIS 24-29 ( Roma Choudhury Sahu, Kasturi Basu and Shibdas Bandyopadhyay)
3. Informal non-agricultural enterprise – NSS 55th round – Gujarat State 30-58 ( D E S Gujarat)4. Unorganised Sectors and its contributions in India 59-68
(Pankaj K P Shreyaskar)
PART – II : SUMMARY AND MAJOR FINDINGS OF SURVEYS
5. An Integrated Summary of the results of the survey on UnorganisedManufacturing Sector, NSS Fifty-Sixth Round (July 2000 – June 2001)
(A. J. Roy and M. Mallick)
1. Introduction 70-72
2. Summary of findings 73-116
Annex I : Sample design and estimation procedure 118-126
Annex II : Concepts and definitions 128-131
Annex III : Facsimile of Unorganised Manufacturing Schedule (Sch. 2.2) 134-143
Annex-IV : Appendix Tables (1 – 16) 146-265
PART – III : HINDI SECTION
Hindi Section fg- 1 & fg- 15

PART - I
TECHNICAL PAPERS
SARVEKSHANA 1
Employment in Unorganised Manufacturing in India:Post-Reform Trends and Future Directions
G. K. Chadha and P. P. SahuJ.N.U., New Delhi
1. Introduction
The release of detailed reports of the 56th round (2000-2001) on unorganised manufacturing enterprises, coveringnumerous aspects such as employment, input-use,destination of product sale and other characteristics (i.e.nature of operation, type of ownership, registration status,type of contracts, growth status and so on) by NationalSample Survey Organistaion (NSSO), has opened up avast canvas for the researchers to operate on. Perhaps, anumber of studies are likely to follow in due course, mostostensibly because of the sheer weight of the unorganizedsegment in the industrial sector, from the point of view ofnon-farm employment. This is especially true for India’srural economy. To bring forth the newer insightsemanating from the 2000-2001 NSS data, we had morethan one choice to settle on. Nonetheless, we choose tofocus on employment, since for some time now, it hasbeen an issue of intense public debate, especially because,in terms of the 1993-94 and 1999-2000 reports publishedby NSSO itself, the post-reform situation on theemployment front has not been encouraging. (Chadha-Sahu, 2002; Sundaram, 2001; Govt. of India, 2001a)
In official parlance, the manufacturing sector in India isdivided into two segments, organised and unorganised.The organised segment constitutes all industrial enterpriseswhich are registered under sections, 2 m (i) and 2 m (ii),of Factories Act 1948 and under the Bidi and Cigarworkers (condition of employment) Act 1966 while therest of the industrial enterprises are categorized as theunorganised manufacturing units. The unorganizedmanufacturing enterprises consist of three categories:own-account manufacturing enterprises (OAMEs), non-directory manufacturing establishment (NDMEs) anddirectory manufacturing establishments (DMEs); thisclassification is essentially based on the criterion ofemployment size. Own-account manufacturingenterprises are the units run without any outside worker,hired on a fairly regular basis, and the total number ofworkers does not exceed five. Non-directory
manufacturing establishments are establishments thatemploy up to six workers, at least one of them is a hiredworker employed on a fairly regular basis. Finally,directory manufacturing establishments are theenterprises that employ six or more workers, at least oneof them is a hired worker (Govt. of India, 2002: 4).
1.1 The Dominating Position of Unorganised Manufacturing Segment
At the beginning of the new millennium, i.e. 2000-01,more than 99.0 per cent of manufacturing enterprises werein the unorganized segment alone. Table 1 clearly showsthat this has been so way back in 1984-85, and remainedso even a decade later in 1994-95. The preponderance ofthe unorganized segment is true in respect of employmentas well. In 1984-85, this segment accommodated nearly84.0 per cent of the workers engaged in manufacturing;in 2000-01, this proportion stood at 82.5 per cent. In otherwords, the organized segment did not account for morethan 16.0 per cent of manufacturing employment in 1984-85 and 18.0 per cent in 2000-01. It is thus abundantlyclear that the unorganized manufacturing nearlycompletely sums up the total industrial scenario in India,most especially from the point of view of the number ofenterprises. This is particularly true about the unorganizedmanufacturing in rural India, and consequently, all issuesrelated to rural industrial growth and efficiency,technology-in-use and technology-linkages includingancillarization and vertical-hookups, market outfits,employment, rural incomes and well-being, etc., are moremeaningfully answered if unorganized manufacturingis the focus. The importance of this segment is thusobvious.
Traditionally, the linkages between the organizedand the unorganized segments have generally beenweak and diffused. Until recently, a very substantialpart of the manufacturing activity in theunorganised sector has been operating independentof the organised sector; it has been producing final

SARVEKSHANA2
products for the consumer market rather thanintermediate products and parts for the organisedsector (Papola, 1991: 5). It is no more so. A fairlysizeable, and growing, proportion of theunorganised manufacturing is expanding throughinducement lent by the growth of the organisedsector; the inducement often takes the form of sub-contracting involving technology-linkage, forwardmarket contracts, financial support, and so on(Chadha, 2001:119-123)
2. Data and Concepts
The paper takes note of a few salient features relating to,or associated with, employment in the unorganisedmanufacturing sector, based on the National SampleSurvey (NSS) data over different rounds. In the main,we use NSS data at three points of time, i.e. 40th round(July 1984-June 1985), 51st round (July 1994-June 1995)and the latest 56th round (July 2000-June 2001; data for2000-01 are extracted from the household level data onCD-ROM. These surveys cover all the units of theunregistered manufacturing sector (i.e. units not coveredby ASI) and provide a large variety of estimates for theentire unregistered manufacturing sector, for the concernedproduction years. To see through the pre- and the post-reform contrasts in employment structure and growth,we have divided the whole period into two sub-periods;the period 1984-85/1994-95 surrogates the pre-reformyears while the period 1994-95/2000-01 is expected tocapture the changing realities of the post-reform years.In addition to the NSSO data on unorganized manufacture,we also draw upon NSSO data on Employment andUnemployment for three points of time, i.e. 38th round(January-December 1983), 50th round (July 1993- June1994) and 55th round (July 1999- June 2000).
Until recently, information on unregistered segment ofthe manufacturing sector has been rather scanty. Nowonder, therefore, most of the studies on industrialdevelopment in India, have been concentrating on theorganized segment which, as we have argued above, didnot touch a vast proportion of the total industrial sector.However, in recent years, thanks to the initiative of theNSSO, more systematic surveys of the unorganizedmanufacturing have been forthcoming and that has ledmany a researcher to shift their attention from theorganized to the unorganized segment. Nonetheless, thisdoes not distract from a few problems that the data on the
unorganized segment pose. First, variations in coverage,for example, inclusion of ‘repair services’ and/or ‘repairof capital services’ in the 40th and 51st rounds and theirexclusion in the 56th round, pose some problems ofcomparison. Second, changes in industrial classificationthrow up problems of their own. The 40th round is basedon the National Industrial Classification (NIC) of 1970,the 51st round goes by the NIC of 1987 while the latest56th round adheres to the NIC devised in 1998. While thechanging classification between the 40th and the 51st rounddoes not pose serious problems of comparability, the sameis not true of the 51st and 56th rounds. Some clubbing ofindustrial groups under the 1998 classification has to beresorted to, to make individual activity groups comparablewith their counterparts under the 1987 NIC classification(for details, see Govt. of India, 1998a: 73-82).
Using detailed data available in NSS reports, the paperattempts to highlight some aspects of growth andstructural changes in employment in the unorganisedmanufacturing sector. In all, 16 industrial groups, at two-digit level of dis-aggregation are used for the purpose ofanalysis. The available information permits us to studythe above aspects both in rural and urban areas, by majorindustry groups and for the seventeen major Indian states.
The paper is spread over six sections. In Section 1, weexamine the dominating position of the unorganisedmanufacturing segment in total industry. Section 2 brieflydescribes the data sources and framework of analysis.Changes in the structure of the unorganised manufacturingis sketched out in Section 3. Section 4 discusses the recentemployment setbacks in the Indian economy; the post-and pre-reform contrasts are brought forth in respect ofmajor sectors, separately for rural and urban workers.Section 5 analyses the growth of employment in theunorganised manufacturing sector by type of enterprisesand broad group of industry and in 17 major Indian states.Finally, Section 6 gives a summary of the main findings.
3. Structure of Unorganised ManufacturingEmployment:
Table 2 shows the changes in the unorganizedmanufacturing sector during the eighties and the nineties.We look at changes in respect of four important variables,namely, number of manufacturing units, number ofworkers, fixed capital and gross value added, separatelyfor rural and urban areas, in respect of each of the three

SARVEKSHANA 3
layers of the enterprises: OAMEs, NDMEs and DMEs.Many interesting insights come forth.
First, a very big proportion of the unorganizedmanufacturing units have continued to be located in therural areas; more than 74.0 per cent of these units werelocated in the rural areas in 1984-85, more than 72.0 percent in 1994-95, and no fewer than 70.0 per cent in 2000-01. The same is true of the number of workers; theproportion of workers employed in the rural unorganizedmanufacturing was 71.0 per cent in 1984-85, 67.0 percent in 1994-95, and 65.0 per cent in 2000-01. In contrast,the share of rural areas in fixed capital and gross valueadded has been rather low. The rural unorganizedmanufacturing units had only 58.0 per cent of fixed capitalin 1984-85, 37.0 per cent in 1994-95 and 32.0 per cent in2000-01; likewise, their share in gross value added was44.0 per cent in 1984-85, 41.0 per cent in 1994-95 and44.0 per cent in 2000-01. In brief, the rural areas continuedto dominate the unorganized manufacturing sector in termsof the number of units and the number of workersemployed, while the urban areas did the same in respectof fixed capital and gross value added. Most importantly,the rural units have witnessed a steady decline in theirrelative position in terms of all aspects of their existence,first between 1984-85 and 1994-95, and then between1994-95 and 2000-01. To the extent that a fairly sizeableproportion of the unorganized manufacturing sector is apart of the informal economy, the Indian experience clearlypoints towards a relatively faster expansion of the urbaninformal sector, during the eighties and the nineties. Anurban-ward movement of rural work seekers, dulyhighlighted by different population censuses, has a nicheof corroboration through our data and analysis.
Second, there are marked rural-urban differences in termsof the internal structure of the unorganized manufacturingsector. Within rural areas, the group of the tiniest self-employing enterprises (OAMEs) dominate in respect ofeach of the four variables. For example, in 2000-01, 93.0per cent of the units, more than 80.0 per cent of workers,59.0 per cent of fixed capital and 63.0 per cent of grossvalue added, in the unorganized manufacturing sector,were to be found among the tiniest of the enterprises;these percentages are tiny figures of 5.0, 8.0, 17.0 and14.0 for NDMEs and 2.0, 12.0, 24.0 and 23.0 for DMEs.The dominance of OAMEs is discernible in urban areasas well, but it is on a much lower scale. For example,within urban areas, 71.0 per cent of the units, 45.0 per
cent of workers, 25.0 per cent of fixed capital and 26.0per cent of gross value added, in the unorganizedmanufacturing sector, belonged to OAMEs. In sharpcontrast to the rural situation, the urban-NDMEscommanded 21.0 per cent of the units, 28.0 per cent ofworkers, 37.0 per cent of fixed capital, and 34.0 per centof gross value added. For the top layer of the urbanunorganized manufacturing sector (DMEs), thesepercentages were 8.0, 27.0, 38.0 and 40.0, respectively.It is thus abundantly clear that in rural India, the tiniestenterprises reflect a clean sweep in terms of the numberof units and persons employed, with a highly subdued, ifnot nominal, presence of NDMEs and DMEs; on the otherhand, in the urban areas, NDMEs and DMEs do have asizeable presence even in the midst of the dominance ofOAMEs. In brief, in relative terms, the urban unorganizedmanufacturing sector is structurally more balanced thanits rural counterpart. In still more plain terms, the issueof ‘economies of scale’ continues to affect the ruralindustrial sector more severely than its urban counterpart.
Third, over time, the share of rural enterprises has beendeclining, practically in each aspect of their existence,most discernibly among the tiniest of the enterprises(OAMEs). For example, the share of rural-OAMEsamong the number of units has been declining from 79.0per cent in 1984-85 to 78.0 per cent in 1994-95 and furtherdown to 75.0 per cent in 2000-01; their share in respectof the number of workers employed has been decliningfrom 81.0 per cent to 79.0 per cent, and to 76.0 per cent,during the same period; and their share in fixed capitalhas been declining from 64.0 per cent to 59.0 per cent,and finally to 52.0 per cent, and so on. Similar, but withvarying magnitude, declines have been occurring in thecase of rural-NDMEs. Most interestingly, the situation isstrikingly different in respect of the top layer of theunorganized manufacturing enterprises, namely, DMEs.Here, the share of rural areas has not been declining,across the board, especially during the post-reform years.For example, the share of rural-DMEs in the number ofworkers employed has increased from 42.0 per cent in1984-85 to 43.0 per cent in 1994-95, and further on to45.0 per cent in 2000-01, and in gross value added, from19.0 per cent to 26.0 per cent, and finally to 31.0 percent, during the same period. This reinforces our earlierconclusion about the greater vulnerability of the tiny(OAMEs) rural enterprises, in relation to their urbancounterparts, and not many special disadvantages inrespect of the higher categories of rural enterprises such

SARVEKSHANA4
as the rural-DMEs. In simple terms, the disadvantages ofrural-location clearly seem to overtake the tiniest of theenterprises far more severely than the bigger sized units;the DMEs are summarily a mingle of small-scale non-household enterprises, many operating with improvedproduction technologies and commanding a non-localmarket outreach, and their commercial sustainability ismuch less under doubt, contrasted to the big lump of tiny,usually household run, enterprises nearly perpetuallyhandicapped by technological backwardness, and limitedmarket access.
Finally, even a casual perusal of the absolute figures showsthat the post-1994 years ushered in improvement, invarying form and content, in each of the four variables,in respect of each of the three layers of the unorganizedmanufacturing. For example, among the rural-OAMEs,the number of units increased from 9.53 million in 1994-95 to 11.06 million in 2000-01, the number of workersemployed from 17.84 million to 19.15 million, fixedcapital from Rs. 3069.8 crores to Rs. 5657.7 crores, andgross value added improved from Rs. 3142.8 crores to4879.0 crores. The corresponding changes among theurban-OAMEs were from 2.71 million to 3.61 millionfor the number of units, from 4.82 million to 5.91 millionfor the number of workers, from Rs. 2176.5 crores to Rs.5147.4 crores for fixed capital, and from Rs. 1984.4 croresto Rs. 2503.8 crores for gross value added. Changes ofsimilar nature are discernible for rural-and urban-NDMEs, as well as rural- and urban-DMEs.
In some sense, these trends should dispel the fears of thepro-reform protagonists, especially because employmentseems to have improved across the board. But then, thereare two strong countervailing facts which instill a muchneeded caution in interpretation, and demand a bit moreof a probe. The caution is clearly called for when we lookback at the pre-1994 trends. The so-called cheersunleashed by the post-1994 improvements getsubstantially dampened if we look at 2000-01 in relationto 1984-85, rather than 1994-95. Clearly, the absolutefigures for 2000-01 are lower than those for 1984-85,practically for each segment of the unorganizedmanufacturing sector, both for rural and urban areas. Inother words, the post-1994 improvements could notrecover the ground that was earlier lost during 1984-85/1994-95. Admittedly, it should not be a matter of rejoicing.
Again, as we would see soon under Section 5, there was
a substantial change in the composition of workforce, say,between full- and part-time workers, during 1994-95/2000-01, contrasted with 1984-85/1994-95. During thepost-1994 years, it is the part-time workers thatoverwhelmingly dominated the additions accruing to eachconstituent of the unorganized manufacturing, mostmarkedly the OAMEs, both in the rural and urban areas.Clearly, the post-reform years have unleashed, inter alia,distress of some kind that fuels stronger propensities tolaunch self-employing manufacturing enterprises justbecause the workless or the under-worked have somehowto create some avenues of earnings. An across the boardrise in the proportion of part-time workers, during 1994-95/2000-01, puts a formidable question that the pro-reform proponents would find hard to explain.
4. Recent Employment Setbacks in IndianEconomy
The proponents of economic reforms would make usbelieve that employment was expected to pick up primarilybecause the output growth was likely to pick up aftereconomic reforms took roots. Dwelling more on thelabour-displacing effects of these reforms, the criticswould, however, believe that employment would not growin the same proportion in which output would grow, giventhe compulsion of installing a more capital-intensivetechnology in many branches of production. Sincetechnological changes of the above type are likely to comeabout only in selected production sectors, and labour-intensive technologies are likely to dominate in manyothers, a mixed overall picture on employment growthwas likely to emerge for some years after the arrival ofthe reforms. This is what is happening currently in theIndian economy in general and rural areas in particular.
Table 3 clearly throws up a mixture of gains and lossesin employment growth rates, for rural and urban areas,during 1993-94/1999-2000 compared with 1983/1993-94. As said earlier, for notional convenience, we take thesetwo sub-periods as pre- and post-reform phases. AlthoughTable 3 gives a disparate picture across differentproduction sectors, in rural and urban areas, yet, in overallterms, one tends to gather the impression that, during thepost-reform years, all has not been well on the employmentfront. On the one hand, the rate of growth of employmenthas witnessed a varying degree of decline, in many sectors,both in rural and urban areas, and for male and femaleworkers. On the other, in some sectors, the post-reform

SARVEKSHANA 5
employment growth rate has been higher, compared withwhat it was during the pre-reform years. On balance,however, the improved employment growth rates do notcompensate for the declining rates firstly because thenumber of sectors associated with the former is smalland secondly because these are not the major absorbersof workforce in general, and rural workforce in particular;the setbacks are more widely spread and more grievousin magnitude. The post-reform concern for employmenthas, therefore, its own empirical logic. Let us look formore details in Table 3.
The overall rate of growth of employment for ruralworkers declined from 1.75 per cent per annum during1983/1993-94 to a low of 0.66 per cent per annum duringthe post-reform years, and from 3.27 per cent to 2.27 percent for urban workers. This is hardly a reflection of anemployment-friendly scenario. On the contrary, the post-reform years clearly point towards an employmentsetback. Again, even in the midst of the post-reformsetback, the rate of growth of urban employment,continued to be much higher than that in the rural areas.In other words, the recent years have inflicted much biggeremployment setbacks in rural compared with the urbanareas. In sum, it is pretty much clear that the rosyemployment-friendly picture, that was believed by somereform protagonists to follow during the post-reformyears, has not yet come off; in fact, it is the contrary thatseems to have happened, during the first 6-7 years of thereform period. That the overall employment growth ratesuffered a varying degree of setback, during the post-compared with the pre-reform years, for every section ofthe work-force, most visibly in the rural areas, lendssupport to the thesis of a negative fallout of economicreforms as far as the overall employment growth rate isconcerned. We must, however, look into the post-reformemployment scenario in individual sectors before framinga final view.
Highly disparate trends are discernible for employmentgrowth, during 1993-94/1999-2000 over 1983/1993-94,in various sectors of India’s rural and urban economies.For example, for rural workers, transport-storage-communications, construction and agro-basedmanufacturing were clearly the cheering spots, whileagriculture, mining, utilities, trade (especially the whole-sale trade), finance-insurance-real estate, and community-social-personal services, showed negative growth or slow-downs in employment.The benefit of improved
employment growth rate during the post-reform years wasnot available to both sections of the rural work force (fordetails of male:female differences, see Chadha-Sahu,2002: 2014-15). While employment for rural maleworkers in the transport-storage-communications sectorincreased sizably from 4.51 per cent per annum duringthe pre-reform years to as high as 7.45 per cent duringthe post-reform period, for their female counterparts, itwitnessed a steep decline from 8.30 per cent to 0.15 percent only. The fast pace of expansion that this sector haswitnessed in recent years has generally been moreconducive to male job seekers, partly because of thephysical labour involved and partly because of the shiftinglocale of the underlying activities. On the other hand, thebenefits of improved employment growth rate in theconstruction sector are duly shared, albeit unevenly, bymale and female workers, primarily because of theconvenient locale of the construction activities.
Another striking feature of the post-reform employmentscenario which, in our view, makes the situation lessdisappointing, is that the pace of employment growth inthe manufacturing sector slackened but only marginally,from 2.10 per cent during 1983/1993-94 to 1.79 per centduring 1993-94/1999-2000 for rural males, from 2.21per cent to 1.75 per cent for rural females, and from 2.14per cent to 1.78 per cent for the total of rural workers(ibid: 2014). Summarily, the same kind of story unfoldsitself for urban manufacturing; the rate of growth ofmanufacturing employment declined from 2.17 per centto 1.77 per cent for urban male workers, from 2.39 percent to 2.07 per cent for urban female workers, and from2.21 per cent to 1.83 per cent for urban workers as awhole (ibid: 2014). The post-reform rate of growth ofemployment in this sector was nearly the same for ruralmale and female workers. This connotes a positivedevelopment for the latter inasmuch as it is generallyfeared that, under the new economic regime, entry of ruralfemale job seekers in the manufacturing sector becomesparticularly difficult. Perhaps, only a more detailed sub-sector break-up would throw bare the branches ofmanufacturing where the rural females are gainingadvantages over their male counterparts, and vice versa.
The fact that the rural economy stands well enmeshedwith the rest of the economy, or the rural job aspirantscan no more operate outside the precincts of the nationallabour market is authenticated, albeit indirectly andmeekly, by a pattern of employment growth commonly

SARVEKSHANA6
shared by rural and urban workers. It cannot be acoincidence that employment growth rates in transport-storage-communications, construction, and agro-basedmanufacturing sectors, improved during the post-reformyears, both for rural and urban workers; likewise, thedecline or slow-down in the mining, utilities, finance-insurance-real estates, and community-social-personalservices, was the common fate of both the groups. It isonly for trade that, during the post-reform years, the urbanworkers surged much ahead of their rural counterpartswhen the retail trade activity gained additional momentumunder the informal sector of the urban economy, in additionto a high pace of employment expansion in the hotel-restaurant segment.
Let us look inside the major non-farm sectors. Amingle of improved and shrunken employmentgrowth rates was the fate of the manufacturingsector. Employment growth rates for rural workerswitnessed a varying degree of improvement duringthe post-reform years in textile products, wood andwood products, leather and leather products,chemicals and chemical products, non-metallicmineral products, basic metal industries, metalproducts, and agro-industries as a whole, whilethe opposite was true for food products, beverages,cotton and wool products, paper and paperproducts, rubber and rubber products, machinetools and electrical machinery, othermanufacturing, repair services, and non-agroindustries. Improved employment growth rateswere particularly striking for textile products,leather and leather products, basic metal products,and metal products, while the squeeze in the paceof employment growth was substantially high forcotton and wool products, other manufacturing andrepair services. The combined effect of thesedevelopments is that for the total of manufacturing,employment growth rate did not witness a bigdecline; in our view, the mild decline from 2.14per cent during the pre-reform period to 1.78 percent in the post-reform years is reflective of theadjustment process that the rural industry in Indiawas involved in during the 6-7 years of the post-reform phase. Perhaps, in the next phase, someproduct lines, especially those which fared wellduring the period 1993-94/1999-2000, may furtherconsolidate their production base and throw upaugmented avenues of employment; our hope stems
from the fact that industries such as textile products,leather and leather products, chemicals andchemical products, basic metal products andmetal products, have already demonstratedtheir remarkable employment-expandingcapabilities, during 1993-94/1999-2000 contrastedto their dismal performance during 1983/1993-94,even while many other branches, includingthe conventional agro-based segments, lost theirverve.
The employment setbacks reported in community-social-personal services, are fairly widely spread acrossindividual segments. For example, for rural workers,employment growth suffered severe setbacks in sanitaryservices, community services, recreational and culturalservices, and personal services; it is only in respect ofeducation and scientific personnel that a mild improvementfrom 2.90 per cent to 3.01 per cent in employment growthrate occurred in the post- compared with the pre-1993period. A more or less similar fate overtook the urbanworkers. The all-round setback in this sector is a matterof worry, firstly because, in the non-farm segment of theIndian economy, it is the most dominant segment thatprovides a very substantial chunk of employment, bothin the rural and urban areas, and secondly because,employment in such segments as sanitary services, medicaland health, community services, and recreational andcultural services is largely sustained by the pace andpattern of public expenditure which, as all writings onthe post-reform developments testify, came under seizein recent years. The fact that the employment setback inthis sector has summarily assumed the same shape inurban areas also lends credence to our contention on theall-round post-reform public expenditure seize.
5. Employment in Unorganised Manufacturing
An economy-wise survey of the post-reform employmentgrowth rates (Table 3) threw up some consolation, albeitmeek and tentative, about employment in themanufacturing sector; here, the post-reform decline inemployment growth rate was rather marginal. To whatextent, the consolation is operative for the unorganizedsegment of the manufacturing sector must be seen ingreater detail; in particular, the rural-urban contrasts needto be brought out in bold relief. This is what Table 4 isset to do.

SARVEKSHANA 7
5.1 Industry-wise Analysis: All-India Picture
Table 4 provides growth rates of employment, among 16major unorganized manufacturing groups, separately forrural and urban areas. To gain more meaningful insights,especially for the rural unorganized manufacturing,growth estimates are given in respect of each of the threecategories, i.e. OAMEs, NDMEs and DMEs. A numberof insights come forth.
First, during 1984-85/1994-95, employment in ruralunorganized manufacturing as a whole witnessed anannual decline of 1.7 per cent. The decline was not uniformamong the three layers of the unorganized manufacturingsector. For the total of the tiniest enterprises (OAMEs), itwas 2.0 per cent followed by 2.5 per cent for the middle-level units (NDMEs); only for the ‘bigger’ sized units(DMEs which roughly correspond to ‘modern’ small scaleindustries under the VSI sector), employment witnesseda positive growth of 2.1 per cent per annum. In plainterms, the process of mushrooming of self-employing tinymanufacturing enterprises seems to have come underarrest; to a slightly lower extent, this seems to have beenhappening in urban areas as well. On the basis of theexperience during 1984-85/1994-95, it was probably pre-mature, and somewhat risky, for some analysts, to havedeclared that the tiniest of the unorganized manufacturingenterprises (OAMEs) had started losing their ground,much more in rural than in the urban areas, as a sourceof non-farm self-employment; it is only throughsubsequent data/developments, and that too interpretedin a careful manner, that one could pass judgement on theemployment effects of economic reforms. Perhaps, thebest signals that could be extracted out of the 1984-85/1994-95 changes was that the scale economies had startedcoming in, that proliferation of self-employing numbers(typical of OAMEs) was not a sustainable proposition,that employment expansion independent of productivitygrowth could not go for long, and that technologyupgrading was the life vein for production units to survivein an open market economy (Chadha, 2003: 62-77).
The post-1994 developments seemed to give a kind ofnew lease of life to rural-OAMEs although the onwardmarch earlier registered by rural-DMEs during the pre-1994 years, continued as well. For example, among rural-OAMEs, the growth rate of capital:labour ratio improveddramatically from –12.1 per cent during 1984-85/1994-95 to as high as 9.4 per cent during 1994-95/2000-01,
the growth rate of real labour productivity improved from1.3 per cent to 6.4 per cent, and the rate of growth ofemployment too improved sizably from –2.0 to 1.2 percent. But then, varying degree of improvement, in eachof these development indicators, had occurred among thetwo upper layers (NDMEs and DMEs) of the ruralunorganized manufacturing as well; For example, forrural-DMEs, improvement in the rate of growth ofcapital:labour ratio from 7.2 per cent during 1984-85/1994-95 to 9.9 per cent during 1994-95/2000-01, oflabour productivity from 4.3 per cent to 6.1 per cent,and of employment from 2.1 per cent to 2.9 per cent,clearly point towards further strengthening of theirposition in the rural industrial sector (Chadha, 2003: 62-77).
Second, during 1984-85/1994-95, at the level of theunorganized manufacturing as a whole, both rural andurban units commonly suffered employment setbacks infood products, cotton textiles-woolen synthetic, textileproducts, chemical products, basic metal and alloys, andmachine tools and electrical machinery. The commonsetback is very clearly discernible for most of thesesectors, in respect of OAMEs also. And it is visible forfour sectors of NDMEs and five of DMEs as well. Inplain words, there are a number of unorganizedmanufacturing branches where employment had beenshrinking, by varying degree, during 1984-85/1994-95,both in rural and urban units, irrespective of the scale oftheir operation or the nature and degree of technologicalupgradation effected by them. To put it differently, a fairlybig proportion of the unorganized manufacturing sector,irrespective of its rural or urban locale, was throwingmany of their workers out of job; the axe seemed to havefallen far too heavily on self-employing workers ( a lamuch higher negative employment growth rates in thedeclining OAME segments). In short, during 1984-85/1994-95, a big part of the unorganized sector was thusbleeding under rising dis-employment.
But then, the situation seemed to have improved during1994-95/2000-01, compared with 1984-85/1994-95, ifwe keep aside, for a moment, the reality of the risingproportion of part-time workers during the post-1994years. For rural unorganized manufacturing as a whole(Cols.9-10, Table 4), the growth rate of employmentimproved dramatically in a majority of production sectors.The most striking improvement was from –5.54 per centto 11.87 per cent in textile products, from –4.98 per cent

SARVEKSHANA8
to 11.98 per cent in chemicals and chemical products,from –4.25 per cent to 17.48 per cent in basic metal andalloys, from –3.42 per cent to 5.03 per cent in metalproducts, from –2.95 per cent to 9.67 per cent in machinetools and parts, and from –6.62 per cent to 1.08 per centin transport equipment and parts; on the other hand, thetwo most disappointing sectors were other manufacturingand repair of capital goods, both of which suffered hugesetbacks in growth rate of their employment. In any case,on the whole, the post-1994 gains in the growth rate ofemployment were far more substantial than the losses sothat at the aggregate level, employment growth rate forthe total of rural unorganized manufacturing improvedfrom –1.70 per cent during 1984-85/1994-95 to 1.35 percent during 1994-95/2000-01. The pace and pattern ofthe post-1994 recovery in urban employment growth rateswas relatively much better, although reverses too werediscernible in some sectors. This development, by itself,lends some weight to the rising pace of informalization ofthe urban economy, partly contributed by disquiet on ruralemployment front, and partly under the rising incidenceof sub-contracting in the urban industrial sector;incidentally, in 2000-01, no fewer than 38.0 per cent ofthe urban unorganized manufacturing were working undersub-contracting arrangements against 28.0 per cent amongtheir rural counterparts (Govt. of India, 2002a: A247-A270). That, during 1994-95/2000-01, in the urbanindustrial sector, as many as 0.69 million of theincremental workers were employed on part-time against0.41 million on full-time basis, indirectly testifies to theexpansion of the urban informal economy, in recent years.
Third, the employment setbacks during 1984-85/1994-95, were far too widely spread among rural comparedwith urban units. For example, among the sixteenproduction branches, employment declined, in varyingdegree, in as many as nine of rural-OAME branchesagainst only seven in their urban counterparts, in tengroups of rural against only six of urban-NDME branches,and in nine in rural against seven in urban unorganizedmanufacturing as a whole. As pointed out earlier, onlyfor DMEs, the rural and urban enterprises were doingequally unwell; in either locale, nearly one-half ofproduction branches showed a decline in employment.But then, going plainly by the number of workers, thingsimproved substantially, during the post-1994 phase, fromthe bottom to the top of the unorganized sector, both inthe rural as well as urban areas. Consequently, therelatively severer sufferance of the rural areas, carried
over from the pre-1994 phase, appeared to have gotmitigated, in varying degree, in a number of productionlines. For example, during 1994-95/2000-01, amongrural-OAMEs, a negative employment growth rate wasregistered by six branches against five among urban-OAMEs; during 1984-85/1994-95, it was nine branchesamong rural-OAMEs against seven among urban-OAMEs. Similar improvements are clearly discerniblefor rural-NDMEs, rural-DMEs, and the total of ruralunorganized manufacturing enterprises as also amongtheir urban counterparts. Going by the sheer number ofworkers, we may be tempted to declare that employmentscenario improved, during the post-reform period, in manybranches of the rural unorganized manufacturing sector,in tandem with its urban counterpart. Nonetheless, it ispretty much clear that in terms of the rate of growth ofemployment, the rural unorganized manufacturing sectoris still suffering a relative disadvantage, both in terms ofthe number of sectors involved, and the relative gaps inthe growth rates of employment. And most importantly,the vastly changing composition of workers between full-and part-time workers, during 1994-95/2000-01, bringsin new dimensions on the employment front.
Finally, it is advisable also to look at employment situationin terms of absolute numbers and in terms of part- andfull-time workers (Table 4A); as we see in a while,absolute numbers do convey the sufferance of rural-OAMEs in a more telling manner. It is at once clear that,in terms of the sheer magnitude of job losses, during 1984-85/1994-95, the bleeding was more profuse in ruralagainst urban enterprises. For example, at the aggregatelevel, between 1984-85 and 1994-95, as many as 4.15million of the rural unorganized manufacturing units wereclosed and 4.14 million rural workers lost their jobs while0.40 million additional jobs became available to theirurban brethren in spite of the closure of 1.07 million units.It is especially disconcerting that 90.6 per cent of the ruralworkers losing their jobs were full-time workers while inthe urban areas, the job loss was confined exclusively topart-time workers. Understandably, because of theirnumerical preponderance, rural-OAMEs bore anoverwhelmingly big share of the job losses; as high as92.0 per cent of the unorganized manufacturing unitsfacing closure in the rural areas came from the OAMEsegment alone and 88.4 per cent of rural workers facingdis-employment belonged to this segment alone; theremaining job losses went to the share of rural-NDMEssince no job loss was reported by rural-DMEs. Inasmuch

SARVEKSHANA 9
as the job losses in the rural areas were very largelybecause of closure of units, nearly 91.0 per cent of thejob losers in the rural-OAME segment were full-timeworkers while their percentage in the urban areas wasaround 50.0 per cent only. Yet again, the proportion ofpart-time workers engaged in rural-OAMEs increasingfrom 14.8 per cent in 1984-85 to 16.2 per cent in 1994-95 (contrasted to its decline from 10.3 per cent to 6.2 percent in urban areas) against a 20.0 per cent decline in thenumber of full-time workers, unambiguously testifies tothe distress of the self-employing rural tiny sector againsta ‘market-savvy’ wage-employment restructuring thathad been the main-stay of the urban labour market.
As observed earlier, going by a surface view, thingsappeared to be improving during the post-1994 years. Itis evident now that for rural-OAMEs, this was rather amyopic illusion. Perhaps, looking at the numbers, in adetailed manner, would show how this is so. During 1994-95/2000-01, the number of rural-OAMEs increased by1.52 million units (a net increase of 16.0 per cent) whilethe number of rural-NDMEs and rural-DMEs declinedby 0.04 million (a net decline of 5.82 per cent) and 0.05million units (a net decline of 16.12 per cent), respectively.Employment in rural-OAMEs increased as well, by 1.3million workers (5.62 per cent); it increased by 0.10million and 0.45 million in rural-NDMEs and rural-DMEsalso. But then, the real caveat comes in. The whole lot of1.3 million incremental workers, coming up in the rural-OAME segment, during 1994-95/2000-01, were part-timeworkers; more than one-third of the incremental workerscoming up in rural-NDME segment but none in the rural-DME segment were on part-time basis. In other words,what was lost by the most domineering segment of therural unorganized manufacturing sector (rural-OAMEs)during 1984-85/1994-95 was 3.7 million of full-time jobs,and what was later recouped during 1994-95/2000-01was 1.39 million of part-time jobs; in fact, rural-OAMEslost another 0.09 million full-time jobs even during 1994-95/2000-01.
The statistical delusion is thus broken. It is clear that themost domineering segment of the rural unorganizedmanufacturing sector (rural-OAMEs), consisting of self-employing household enterprises, did not come off so wellduring the post-reform years, as did another segment(rural-DMEs), especially from the point of thecomposition and level of employment. We are thuspersuaded to say that, in the case of rural-OAMEs, it is
largely a case of expansion under duress. After losing atotal of 3.9 million rural-OAME units during 1984-85/1994-95, only 1.5 million rural-OAME units wererecouped during 1994-95/2000-01. In other words, in2000-01, compared with 1984-85, as many as 2.38 millionrural-OAME units had evaporated, showing a netdecline of nearly 18.0 per cent, instead of an netexpansion expected under the normal process of ruralindustrialization. Again, after losing as many as 4.07million (3.71 million full-time and 0.36 million part-time)jobs during 1984-85/1994-95, the rural-OAMEs couldrecoup 1.3 million ( -0.09 million full-time and 1.39million part-time) jobs during 1994-95/2000-01. In plainterms, in 2000-01, compared with 1984-85, the numberof self-employed workers in rural-OAMEs was lower by2.77 millions, showing a net decline of 12.63 per cent.Further, the number of full-time workers, engaged inrural-OAMEs, declined from 18.66 millions in 1984-85to 14.96 millions in 1994-95 and further down to 14.87millions in 2000-01 while the number of those engagedon part-time basis declined from 3.25 millions in 1984-85 to 2.89 millions in 1994-95 but recouped to 4.28millions in 2000-01. In other words, in 2000-01, comparedwith 1984-85, the number of full-time workers employedin rural-OAMEs was more than 20.0 per cent lower, whilethe number of their part-time counterparts was 31.7 percent higher. Still more pointedly, the whole lot of additionalrural-OAMEs coming up during 1994-95/2000-01 wasmanned by part-time workers only. The distress isobvious.
What led to the massive closure of rural-OAMEs andthe associated steep decline in employment, during 1984-85/1994-95, and the subsequent revival of some of them,and a sizeable tilt in favour of part-time work, during1994-95/2000-01? It seems, when agricultural growthpicked up well during the 1980s, especially in the laggingeastern states, non-farm activities including a host of ruralindustries too grew fast. The initial spurt was in the natureof ad hoc response to rising demands from agriculture,partly for production and partly for consumptionpurposes. The hard yardsticks of price efficiency, productquality, rural-urban competitiveness, etc. did notimmediately intervene. But then, after a while, marketconsiderations seemed to be overtaking the initial ad hocresponses and adjustments. This tendency gained strengthwhen the early phase of limited economic reforms andmarketization ensued in the late eighties, and got moreintensified after full-fledged economic reforms came in

SARVEKSHANA10
July 1991. What came up as an ad hoc source of additionalhousehold income during the eighties, could not beinterpreted as a market creature. When the economystarted maturing, and markets started expanding, non-market creatures naturally faced a varying degree ofsqueeze, if not outright extinction. A part of the rural-OAME story is indeed of the kind caricaturized above.
But then, the recent story of nearly the whole lot of theadditional rural-OAMEs coming up during 1994-95/2000-01, being manned by part-time family workers only,must essentially be seen, inter alia, in terms ofemployment setbacks suffered by other sectors of therural economy, most pointedly, by agriculture and its alliedsectors. It needs hardly to be emphasized that ifemployment in other sectors was not growing, or wasgrowing at a much slower pace during the post-1994,compared with the pre-1994 years, rural job aspirantswould have started self-employing themselves, in a varietyof ways. For those additional job seekers not getting self-employed in agriculture, or not wishing to be absorbed inagriculture, the next best choice to get self-absorbed wasto go to the other commodity sectors. Rural industry isthe most obvious choice. Admittedly, for a majority ofrural job aspirants, self-employment is not as muchnegotiable in the services/tertiary sector as it is in thecommodity sectors of agriculture or industry. On thecontrary, if services/tertiary sector employment too issuffering serious setbacks, and wage-paid employmentis not easy to come by, people would flock back either toagriculture or the other commodity sectors including‘industry’. It is the sum total of many-sided employmentsetbacks that seems to have ushered rural work seekersinto the self-employing segment of the rural industrialsector (OAMEs) without, at the same time, severing theirconnection with agriculture. That is how, nearly the wholelot of incremental workforce joining rural-OAMEs during1994-95/2000-01 consists of part-time workers. That,during 1994-95/2000-01, nearly 63.0 per cent of theincremental workers, employed in urban-OAMEs, werealso on part-time basis, is a pointer towards expandinginformalization of the urban industrial economy some ofwhich is possibly contributed by employment stress onthe countryside.
To buttress our argument of many-sided employmentsetbacks leading to the increased incidence of part-timeemployment among rural-OAMEs, let us revisit the recentrates of growth of employment in the major economic
sectors. As we saw earlier in Table 3, the rate of growthof employment in agriculture fell from 1.38 per centduring 1983/1993-94 to 0.18 per cent only during 1993-94/1999-2000; it fell more depressingly among non-cropsegments, e.g. from 1.89 per cent to –1.12 per cent inforestry-logging, from 4.09 per cent to –6.37 per cent infishing, and from 3.84 per cent to –2.28 per cent inmining-quarrying. It fell in many other, non-agricultural,sectors as well, e.g. from 3.72 per cent to 1.81 per centin trade, from 5.99 per cent to 2.51 per cent in finance-insurance-real estate, from 3.13 per cent to 0.32 per centin community-social-personal services, and so on. In fact,the employment squeeze in community-social-personalservices encompassed nearly each one of its constituents;for example, the rate of growth of employment fell from4.92 per cent during 1983/1993-94 to –15.60 per centduring 1993-94 in sanitary services, from 2.27 per centto 0.73 per cent among medical and health functionaries,from 3.74 per cent to –4.62 per cent in communityservices, from 7.72 per cent to –10.07 per cent inrecreational and cultural services, and from 3.75 per centto –0.63 per cent in respect of personal services (Table3). Most certainly, the extraordinary squeeze inemployment in a wide range of community-social-personalservices owes itself to curtailed public expenditure afterthe onset of economic reforms, and for a number ofworkers relieved from these services, as also from othersectors in the rural economy. Venturing into some self-employing rural industrial activities, albeit on a part-timebasis, was a more acceptable choice, both becauseagriculture could not absorb them as full-time workersand because the other option of remaining unemployedcould never be acceptable. But then, the most convincingpart of our argument about their absorption into the ruralindustrial sector, as part-time entrepreneurs, in additionto being part-time helpers in family-based agriculture,comes from noting that the rate of growth of employmentin the agro-based segment indeed improved from 1.45per cent during 1983/1993-94 to 2.16 per cent during1993-94/1999-2000 while in the more difficult,technology-savvy, education- and skill-intensive non-agrobased segment, it declined from 3.58 per cent to as lowas 1.03 per cent (Table 3). We are thus led to a depressingscenario. Rural-OAMEs are acting as a sponge; theyare holding on a sizeable proportion of their workers onpart-time basis perhaps as an adjunct to agriculture,independent of what the market for industrial goodsmay brook in the days to come. This poses a policydilemma.

SARVEKSHANA 11
The foregoing analysis unambiguously shows that theoperational disadvantages among the tiniest of the ruralmanufacturing units ( OAMEs) could not be overcome,all these years, through the package of protective statesupport; such rural units have to stand on their own, notonly in competition with their urban counterparts, butotherwise also. For this, improvement in productivity isthe most inescapable pre-requisite. In recent years,productivity improvement did occur among rural-OAMEs, just as it did among rural-NDMEs and rural-DMEs. Nonetheless, a high growth rate of productivityamong rural-OAMEs could not hide the extremely lowlevels at which their productivity was operating even in2000-01, most ostensibly, in comparison with rural-DMEs. It can thus be concluded that relatively bigger-sized rural manufacturing units, unorganized though theymay be, are likely to fare well in competition with theirurban counterparts, in sharp contrast to the tiniest ofthe rural units which continue to reel under numeroustechnological ,institutional and marketing infirmities.Perhaps, in the same product line, the tiniest units(OAMEs) are more deeply embedded into local rural lifeand economy, and face a dwindling demand prospect whiletheir bigger-sized counterparts (say, DMEs), manyamongst them being located in the ‘rural areas’ out of adifferent set of considerations, are more easily linked withthe nearby and/or distant urban economy, and sometimeswith external market. While, in most cases, it is theeconomic distress which causes a local proliferation ofrural-OAMEs, as it was indeed the case during the post-1994 years, it is a well-calculated economic choice tolocate some DMEs out of the urban-municipal limits, innumerous cases, not far from the economic heartland oftowns and cities. The two groups of rural manufacturingare thus totally different entities. That it is indeed so isalso proved through the differential behaviour ofemployment during recent years. In brief, the rural OAMEsegment is in trouble, most visibly on the employmentfront, and the policy administrators can no more take itsso-called ‘vast employment potential’ for granted. Suchillusions must go.
5.2 State-Level Employment Scenario
Table 5 gives state-wise growth rates of employmentduring 1984-85/1994-95 and 1994-95/2000-01, for eachof the three segments of the unorganised manufacturing.Let us first look at the employment growth scenario duringthe pre-reform (1984-85/1994-95) decade. It is only in
five of the seventeen states, namely Assam, Gujarat,Himachal Pradesh, Karnataka and Orissa thatemployment among rural-OAMEs registered positivegrowth of any consequence during 1984-85/1994-95; asmany as ten states witnessed a varying degree of negativeemployment growth during these years. Somewhatsurprisingly, even in the green revolution states of Punjab,Haryana and Uttar Pradesh, employment growth in rural-OAMEs was negative. It really seems that OAMEs werelosing their appeal as an important source of non-farmemployment in rural India. The situation is not muchdifferent with the NDMEs either. Except for MadhyaPradesh and Karnataka, all other states witnessed anegative growth rate of employment that varied from –14.21 per cent for Jammu-Kashmir to –1.04 for Kerala;in as many as nine states, the per year loss of employmentwas 5.0 per cent and more. Happily, the house of directoryestablishments (DMEs) performed markedly better interms of employment growth. The negative, andsubstantially heavy, growth rate of employment wasconfined to five states only (Assam, Jammu-Kashmir,Kerala, Madhya Pradesh and Rajasthan); for theremaining twelve states, employment grew positively,ranging from 1.00 per cent in West Bengal to as high as10.01 per cent in Gujarat. Interestingly, the three greenrevolution states registered fairly high employment growthrates among DMEs against negative rates among theirNDMEs and OAMEs. The employment scenario, for eachof the three segments, was much less frightening in theurban areas. While a negative growth of employment wasdiscernible for many states, among each segment, yet theoverall situation was a shade better than in the rural areas.
Looking at OAMEs, NDMEs and DMEs together, it isclear that the negative growth rate of employment in ruralareas, among each of the three segments, occurred onlyin three states, namely Jammu-Kashmir, Rajasthan andKerala; for Andhra Pradesh, it was more a situation ofnon-growth rather than negative growth. In other words,DMEs were proving to be the saviour of employment inrural India. But then, the sheer size of the rural-OAMEsegment that witnessed wide-spread squeeze inemployment growth rate, robbed away the pleasingscenario of wide-spread expansion of employment growthin the small-sized rural-DME segment. Nonetheless, itsignalled the beginning of a significant development inthe rural industrial sector; the process of industrialrestructuring in favour of non-household type enterprises(here typified by DMEs) seemed to have set in well before

SARVEKSHANA12
the arrival of economic reforms during the early 1990s.It was not a trivial development that against a negativegrowth of employment in OAMEs in as many as ten ofthe seventeen states, the employment grew not onlypositively but at fairly high rates among DMEs, in asmany as eleven of the sixteen states. Perhaps, the ruralindustrial sector had started coming of age, partly becauseof the onslaught of the urban competition facing the ruralindustry as a whole and partly because of the scaleeconomies that had probably started asserting themselvesin favour of DMEs compared with NDMEs/OAMEs. Inone word, a switch-over from tiny production units(OAMEs) to units of higher size (most ostensibly DMEs),although as yet on a limited scale, was clearly at workeven within the unorganised segment of the manufacturing,both in the rural and urban areas; that this has beenhappening more demonstrably in the urban areas is hardlya surprise.
The post-1994 scenario did witness some setbacks as well;the pre-1994 roles were now inter-changed between rural-OAMEs and rural-DMEs. During 1994-95/2000-01,employment among the rural-OAMEs grew negativelyonly in three states (Assam, Orissa and Uttar Pradesh;we leave aside Bihar and Himachal Pradesh whichwitnessed virtually no employment growth) while it didso among rural-DMEs in as many as seven states ( Bihar,Gujarat, Haryana, Karnataka, Orissa, Tamil Nadu andWest Bengal). But then, it cannot be denied thatemployment growth among rural-DMEs was positive andof a very high order among many states ( e.g. Assam,Himachal Pradesh, Jammu-Kashmir, Kerala, MadhyaPradesh, Punjab, Rajasthan, Uttar Pradesh andMaharashtra). For India as a whole, the process ofsize upgradation continued with its forward marchinasmuch, during the post-1994 years, the rate ofgrowth of employment among rural-DMEs was as highas 2.87 per cent against 1.18 per only among rural-OAMEs.
The above tendency is likely to magnify itself in the timesahead, firstly because the rural industry can no moreoperate in isolation, under the changing export-importregime, and secondly because, some ‘weeding’ is a naturalcorollary of a maturing economy. It is time to realise thatrural industry too is carving out some moorings outsideagriculture; the agriculture-industry linkage is still thebest source of employment multiplier, yet, in recent years,the character of rural industry itself has been undergoing
a drastic change, thanks to the policy of industrial re-location away from the congested urban centres andspecial emphasis on the development of industriallybackward regions, on the one hand, and the reality ofsteadily expanding rural tertiary sector with its ownforward and backward linkages with industry, on the other.If this were not so, the green revolution states of Punjaband Haryana would not have flipped over from negativegrowth rate of employment during 1984-85/1994-95 topositive and very impressive rates during 1994-95/2000-01; in Punjab, it was from –4.28 per cent during the pre-to 6.53 per cent during the post-reform years among rural-OAMEs, from –1.99 per cent to 6.21 per cent amongrural-NDMEs and from 6.84 per cent to as high as 15.06per cent among rural-DMEs. In Haryana, it was from –6.86 per cent to 1.65 per cent among rural-OAMEs, andfrom –1.50 per cent to 6.05 per cent among rural-NDMEs,and so on.
For the unorganised rural manufacturing as a whole,employment growth rate witnessed a varying degree ofimprovement during the post-, compared with the pre-reform period, in as many as fourteen of the seventeenstates. In many states, the improvement was rathermarked; for example, the change-over from –11.38 percent to 34.47 per cent in Jammu-Kashmir, from –4.77per cent to 7.87 per cent in Kerala, from -0.06 per centto 7.94 per cent in Madhya Pradesh, from -3.11 per centto 7.71 per cent in Punjab, from -4.57 per cent to 3.80per cent in Rajasthan, and from -.3.25 per cent to 2.30per cent in Tamil Nadu, bears some testimony to theprocess of an all-round bettering of employment growthrate in the rural unorganised manufacturing sector. Similarimprovements are discernible for urban areas as well.Here too, in many states, the negative employment growthrates of 1984-85/1994-95 changed over to positive growthrates during 1994-95/2000-01; the most strikingimprovement was registered by Andhra Pradesh, Haryana,Jammu-Kashmir, Karnataka, Kerala, Madhya Pradesh,Rajasthan, Tamil Nadu and West Bengal. Perhaps, it isin the fitness of things to point out that some of theseimprovements may be a mere statistical delusion a la amuch higher proportion of part-time workers overtakingthe full-time workers, during the post-1994, in many ofthe states. We have not looked at the part- versusfull-time break-up of workers for individual states, as wedid earlier for the national-level analysis underSection 5.1.

SARVEKSHANA 13
6. Concluding Remarks
The arrival of the NSS survey data for the 56th round hasopened up vast research opportunities. So much iscontained in this round that one can venture to addressnumerous questions connected with the organization andstructure, production and employment, market outfits andtechnology contracts, etc., in respect of the three layersof the unorganised manufacturing (OAMEs, NDMEs andDMEs), under each industrial category, separately forrural and urban areas. The gender differentials can alsobe looked into, in as fine a detail as one wishes. Perhaps,such a wide canvas of information has never been coveredunder any of the earlier NSS rounds. The community ofresearchers and those public analysts interested in thefuture of tiny and small industrial enterprises must thankthe NSS Organisation for meeting the long-felt informationneed. The most redeeming fact is that many questionsconnected with the impact of economic reforms on thissegment of the national economy can now be answeredwith concrete empirical rigour and confidence.
In the present paper, we have set a limited purpose forourselves. It is to look into the employment situation inthe unorganised manufacturing sector, both temporallyand cross-sectionally. In this concluding note, werecapitulate some of the insights that have emerged in thepaper, and, at the same time, we pose a few associatedquestions that need further indepth probing. The idea isto initiate a public debate on the unorganisedmanufacturing sector in general, and the recent changesin its employment scenario, in particular.
It is plainly true that the unorganised manufacturingactivities occupy a place of great significance, both in therural and urban economies of India. Within theunorganised sector, the group of tiny and household-runenterprises (OAMEs) in the rural areas, occupy anoverwhelmingly dominant position, both in terms of thenumber of enterprises and the number of workersemployed; the dominance of this group is no less evidentin the urban industrial economy. It should thus be clear tothe policy makers that no meaningful, and people-oriented,strategy of industrialisation can be visualized withoutassigning central focus to the unorganised segment ofmanufacturing. And, more crucially, within this segment,the overbearing significance of the bottom layer, OAMEs,especially the rural-OAMEs, cannot be lost sight of, mostmarkedly because the future of rural industrialization in
India, under the on-going process of globalisation, wouldlargely be connected with the survival and growth of therural-OAMEs.
It is a little disturbing to see that, over time, the share ofrural areas in the number of enterprises, employment andfixed capital, in the unorganised manufacturing sector, isdecreasing, in favour of the urban areas. This is happeningmore conspicuously in the domineering OAME segment,and not at all happening in the small, but well-organized,DME segment. That rural areas are losing their share inthe bottom layer, and keeping their hold in the top layer,is perhaps an indication of the distress-type rural to urbanmovement of work seekers who accommodate themselvesin the urban economy as self-employing industrialworkers. On the other hand, DMEs being surrogates ofnon-household type industrial enterprises, being biggerin size and enjoying some economies of scale, do not reflectany special locational disadvantage. The market signalsare thus clear. Manufacturing enterprises, run withimproved production technology, deriving pecuniary andscale benefits, and having an expanding market outreach,as many among the DMEs would have, have no serioushandicaps being rurally located. Clearly, a sizeableproportion of OAMEs are bereft of such advantages; formany of them, the sustainability would remain a perpetualquestion mark.
The post-reform period has brought quite a few jitters onthe employment front. For many sectors of the Indianeconomy, the rate of growth of employment during 1993-94/1999-2000 slumped down sizeably from the levelsachieved during 1983/1993-94. It was, however, amarginal decline in the case of manufacturing, both inthe rural and urban areas. To some observers, this maylook like a silver lining amidst dark clouds. Interestingly,the post-reform growth rate of employment in the agro-based segment was higher than its pre-reform counterpart,while it was the reverse in the case of the non-agro basedmanufacturing. This seemed to work better for ruralindustrial employment, heavily influenced as it is by theagro-based, rather than the non-agro based manufacturing.Sadly enough, it has a statistical delusion attached to it.The delusion is broken when we shift our analysis, first,from total manufacturing to unorganised manufacturing,and, then, within the latter segment, into the post-reformchanging composition of workforce in terms of part- andfull-time workers.

SARVEKSHANA14
During the pre-reform decade (1984-85/1994-95), manyof the unorganised manufacturing units, most visibly theOAMEs, had closed down, both in the rural and urbaneconomies. Likewise, many workers got dis-employed,again, both in rural and urban areas. Crucially, while anoverwhelming proportion of those losing their jobs in therural areas were full-time workers, the job loss in theurban areas was confined to part-time workers only. It isclear that the impact of the selective economic reformsthat occurred towards the closing part of the eighties washighly uneven between the rural and the urban industrialeconomies. But then, the real distress for the rural areasset in after the full-fledged economic reforms came forthin 1991-92. During 1994-95/2000-01, both the rural andthe urban areas recouped their lost ground, but,qualitatively, it was a much better performance in thecase of urban unorganised manufacturing. For example,during the post-1994 years, the rural areas could notrecoup more than a small proportion of their unorganisedmanufacturing enterprises, most noticeably among therural-OAME segment, while almost the whole of the lostground was recovered in the urban areas. This was trueof employment as well. For example, against a loss of3.75 million full-time jobs during 1984-85/1994-95, therural unorganised manufacturing could not recoup morethan 0.38 million of such jobs during 1994-95/2000-01,while with the urban manufacturing, it was a gain of 0.74million part-time jobs against the earlier loss of 0.27million such jobs; earlier, urban areas did not suffer anyloss of full-time jobs. The story of job losses and gains isunfolded most tellingly in respect of rural-OAMEs againsturban-OAMEs.
In plain terms, there is a tendency for the proportion ofpart-time workers to increase both among the rural andurban unorganised manufacturing, most markedly amongthe OAME segment, but the rural-urban differencemanifests itself in terms of the deployment of the post-1994 incremental workforce. In the rural areas, anextremely high proportion of the post-1994 incrementalworkforce came in on part-time basis while in the urbanareas, it was not more than one-third of the totalincremental workforce that got employed on part-timebasis. In plain terms, during the post-reform years, thestructure of employment got worsened in the rural areas,
especially when looked at from the point of view of self-employing household-type enterprises typified byOAMEs.
Many explanations may be framed to understand thisphenomenon. The quickest explanation that comes forthis that it is the slow-down in the rate of growth ofemployment, in many sectors of the rural economy,coupled with an increasing incapability of agriculture totake on many additional hands, that has triggered off theprocess of part-time self-employment of most of theincremental workers, in the rural unorganisedmanufacturing. In contrast to 1984-85/1994-95, a higherpost-1994 rate of growth of employment among the agro-based manufacturing activities, lends additional credenceto our inference. In any case, the hypothesis of distressmigration of job seekers, from rural to urban areas, therebycontributing further to the proliferation of the urbaninformal economy, seems to hold true. Undoubtedly, amore systematic, and detailed probe is called for.
Before we conclude, we must admit that much moreresearch on numerous other aspects of the unorganisedmanufacturing needs to be undertaken. We have used theavailable information rather sketchily, and have not goneinto many other issues that would have weighty bearingon the working, and the future, of the unorganisedmanufacturing, especially its bottom layer (OAMEs). Forexample, an in-depth analysis of technology outfits (a lacapital:labour or capital:output ratios), productivityperformance, sub-contracting hook-ups, market outreach,etc., can generate some sobering insights, but then, evenon the basis of our preliminary, and sketchy, analysis, itis pretty much clear that the rural unorganisedmanufacturing in general, and rural-OAMEs in particular,are not in a good shape. The policy makers have to sparesome concern for these vital segments of our economy.Perhaps, rural-DMEs are not as much a source of concern,but, ironically, it is the DMEs’ surrogate of ‘modernsmall scale’ industry, under the umbrella of the VSI sector,that has occupied the most cherished attention so far. Ourpolicy orientation must change now; India’s ruralindustrial world is really much beyond ‘modern smallindustry’.

SARVEKSHANA 15
References
Chadha, G.K. (2001), Rural Industry in India and China:Exchanging Technological and Institutional Lessons,report submitted to SSE-NIWL-JNU.
————— and Sahu, P.P. (2002), “Post-ReformSetbacks in Rural Employment: Issues That Need FurtherScrutiny”, Economic and Political Weekly, Vol.36, No.21, May 25.
———— (2003), Rural Industry in India: PolicyPerspectives, Past Performance and Future Options, ILO,New Delhi.
Govt. of India (1989), Tables with Notes onSurvey of Unorganized Manufacture:Non-Directory Establishments and Own-AccountEnterprises, July 1984- June 1985, Part-1,All-India, NSS Report No.363/1.
———— (1990), SARVEKSHNA, Vol. XIV, No1 and 2, NSSO, New Delhi.
———— (1997), Employment and Unemployment inIndia, 1993-94, NSS Fiftieth Round (July 1993- June1994), NSS Report No. 409, NSSO, New Delhi.
———— (1998), Unorganized Manufacturing Sector inIndia: Its Size, Employment and Some Key Results, NSSReport No. 433, NSSO, New Delhi.
———— (1998a), National Industrial Classification (AllEconomic Activities): 1998, CSO, New Delhi.
———— (2001), Employment and UnemploymentSituation in India, 1999-2000, NSS Fifty-fifth Round(July 1999-June 2000), NSS Report No. 458, NSSO, NewDelhi.
———— (2001a), Report of Task Force on EmploymentOpportunities, Planning Commission, New Delhi.
———— (2002), Unorganised Manufacturing Sector in2000-01: Key Results, NSS Report No. 477, NSSO, NewDelhi.
———— (2002a), Unorganised Manufacturing Sectorin India- 2000-01: Characteristics of Enterprises, NSSReport No 478, NSSO, New Delhi.
———— (2003), Annual Survey of Industries: 2000-2001, Vol. I, CSO (Industrial Wing), Kolkata.
Papola, T.S. (1991), “Industry and Employment: recentIndian Experience”, ISID Foundation Lecture, (mimeo),ISID, New Delhi.
Sundaram, K. (2001), “Employment-UnemploymentSituation in the Nineties: Some Results from NSS 55th
Round Survey”, Economic and Political Weekly, Vol. 35,March 17.

SARVEKSHANA16
Table 1: Structure of Manufacturing Sector in India: 1984-85/2000-01
1984-85 1994-95 2000-01
% Share % Share % Share
1 2 3 4 5 6 7
Organised Segment
No. of Units 0.9 0.5 1.2 0.8 1.3 0.7
No. of Workers 68.7 15.7 81.1 19.6 78.8 17.5
Fixed Capital 26193.7 48.5 71057.4 83.5 114354.2 79.3
Gross Value Added 18093.4 62.6 41550.5 77.6 51057.6 74.5
1) Unorganised Segment
No. of Units 197.2 99.5 145.0 99.2 170.2 99.3
No. of Workers 369.5 84.3 332.0 80.4 370.8 82.5
Fixed Capital 27813.0 51.5 14023.8 16.5 29854.4 20.7
Gross Value Added 10791.7 37.4 12007.1 22.4 17458.5 25.5
All Manufacturing
No. of Units 198.1 100 146.2 100 171.5 100
No. of Workers 438.2 100 413.1 100 449.6 100
Fixed Capital 54006.7 100 85081.2 100 144208.6 100
Gross Value Added 28885.1 100 53557.6 100 68516.1 100
Note: 1. For organised segment workers imply total number of persons engaged.
2. For no. of units and no. of workers, the figures are in lakhs; for fixed capital and gross value added, theseare in Rupees in crores at constant 1981-82 prices.
Source: 1. Govt. of India, N.S.S. Report No. 363/1, June 1989; Report No. 433, September 1997; and HouseholdLevel Data (for 2000-01) on CD-ROM, supplied by NSSO New Delhi.
2. Govt. of India, Annual Survey of Industries: 2000-2001, Vol. I, Industrial Wing Kolkata, CSO, July2003.

SARVEKSHANA 17
Table 2 Structure of Unorganised Manufacturing Sector in India: 1984-85/2000-01
Rural Urban All
OAMEs NDMEs DMEs Total OAMEs NDMEs DMEs Total Unorganised
1 2 3 4 5 6 7 8 9 10
Number of Units (in Lakhs)
1984-85 134.4 10.3 1.8 146.4 36.5 11.3 3.0 50.8 197.2
% 91.8 7.0 1.2 100.0 71.8 22.3 5.8 100.0
1994-95 95.3 6.7 2.9 105.0 27.1 9.3 3.6 40.1 145.0
% 90.8 6.4 2.8 100.0 67.8 23.3 9.0 100.0
2000-01 110.6 6.3 2.5 119.3 36.1 10.8 4.0 50.9 170.2
% 92.7 5.3 2.1 100.0 70.9 21.3 7.9 100.0
Share of Rural/Urban Area
1984-85 78.6 47.5 37.7 74.3 21.4 52.5 62.3 25.7
1994-95 77.8 41.7 45.0 72.4 22.2 58.3 55.0 27.6
2000-01 75.4 36.8 38.2 70.1 24.6 63.2 61.8 29.9
Number of Workers (in Lakhs)
1984-85 219.1 23.6 19.9 262.7 53.2 26.6 27.0 106.8 369.5
% 83.4 9.0 7.6 100.0 49.8 24.9 25.3 100.0
1994-95 178.4 18.3 24.5 221.3 48.2 30.6 32.0 110.8 332.0
% 80.7 8.3 11.1 100.0 43.5 27.6 28.9 100.0
2000-01 191.5 19.3 29.1 239.9 59.1 36.3 35.5 131.0 370.8
% 79.8 8.1 12.1 100.0 45.2 27.7 27.1 100.0
Share of Rural/Urban Area
1984-85 80.5 47.0 42.4 71.1 19.5 53.0 57.6 28.9
1994-95 78.7 37.4 43.4 66.6 21.3 62.6 56.6 33.4
2000-01 76.4 34.8 45.0 64.7 23.6 65.2 55.0 35.3
Fixed Capital(Rs. in crores)
1984-85 13614.7 2011.9 443.9 16070.4 7521.7 3213.9 1007.0 11742.5 27813.0
% 84.7 12.5 2.8 100.0 64.1 27.4 8.6 100.0
1994-95 3069.8 1066.8 1098.5 5235.1 2176.5 2803.6 3808.6 8788.7 14023.8
% 58.6 20.4 21.0 100.0 24.8 31.9 43.3 100.0
2000-01 5657.7 1608.9 2296.7 9563.2 5147.4 7445.9 7697.8 20291.2 29854.4
% 59.2 16.8 24.0 100.0 25.4 36.7 37.9 100.0
Share of Rural/Urban Area
1984-85 64.4 38.5 30.6 57.8 35.6 61.5 69.4 42.2
1994-95 58.5 27.6 22.4 37.3 41.5 72.4 77.6 62.7
2000-01 52.4 17.8 23.0 32.0 47.6 82.2 77.0 68.0
Contd...

SARVEKSHANA18
Gross Value Added (Rs. in crores)
1984-85 3404.8 762.2 566.0 4733.0 1668.5 2016.1 2374.1 6058.7 10791.7
% 71.9 16.1 12.0 100.0 27.5 33.3 39.2 100.0
1994-95 3142.8 726.8 1057.1 4926.8 1984.4 2122.4 2973.4 7080.3 12007.0
% 63.8 14.8 21.5 100.0 28.0 30.0 42.0 100.0
2000-01 4879.0 1070.7 1788.1 7737.7 2503.8 3297.4 3919.6 9720.7 17458.5
% 63.1 13.8 23.1 100.0 25.8 33.9 40.3 100.0
Share of Rural/Urban Area
1984-85 67.1 27.4 19.3 43.9 32.9 72.6 80.7 56.1
1994-95 61.3 25.5 26.2 41.0 38.7 74.5 73.8 59.0
2000-01 66.1 24.5 31.3 44.3 33.9 75.5 68.7 55.7
Note: Fixed capital and gross value added are at constant (1981-82) prices.
Source: Govt. of India, N.S.S. Report No. 363/1, June 1989; Report No. 433, September 1997; and HouseholdLevel Data (for 2000-01) on CD-ROM, supplied by NSSO New Delhi.
Table 2 Contd...
Rural Urban All
OAMEs NDMEs DMEs Total OAMEs NDMEs DMEs Total Unorganised
1 2 3 4 5 6 7 8 9 10

SARVEKSHANA 19
Table 3 Annual Compound Growth Rate of Employment for Usual Status (Principal+Subsidiary) Workersby Residence and Production Sectors: 1983/1999-2000
Rural Workers Urban Workers All Workers
NIC Code Production Sector 1983/ 1993-94/ 1983/ 1993-94/ 1983/ 1993-94/1993-94 1999-00 1993-94 1999-00 1993-94 1999-00
1 2 3 4 5 6 7 8
0 Total Agriculture 1.38 0.18 1.54 -3.40 1.39 0.05
00 Field Crop Production 1.68 0.23 1.60 -3.23 1.68 0.12
01 Plantation 2.01 -3.35 6.95 -14.07 2.44 -4.27
02 Livestock -2.70 -0.83 -0.76 -3.75 -2.54 -1.08
03 Agricultural Services 23.40 13.42 11.88 6.73 21.67 12.90
05 Forestry & Logging 1.89 -1.12 0.74 2.27 1.79 -0.81
06 Fishing 4.09 -6.37 2.26 2.51 3.75 -4.53
Non-Crop Activities (01-06) -0.78 -0.23 1.38 -3.84 -0.59 -0.56
1 Mining & Quarrying 3.84 -2.28 4.15 -3.71 3.95 -2.78
20-21 Food Products 3.36 2.26 1.89 3.60 2.78 2.78
22 Beverages, etc. 3.35 2.62 1.68 -0.01 2.80 1.83
23+24+25 Cotton, Wool, Jute etc. 2.46 -3.32 0.38 -5.13 1.32 -4.24
26 Textile Products -4.09 7.22 -1.47 6.21 -2.80 6.69
27 Wood Products 1.89 3.66 1.71 4.04 1.84 3.77
28 Paper Products 2.56 0.94 1.98 4.42 2.09 3.78
29 Leather Products -5.27 0.94 5.06 8.19 1.03 6.54
30 Rubber Products 22.31 3.38 15.03 1.23 16.94 1.97
31 Chemical Products -3.37 0.94 -1.76 6.95 -2.17 5.67
32 Non-metallic Mineral Products 1.26 2.74 0.19 -1.07 0.97 1.81
33 Basic Metal Industries -2.06 13.30 0.79 -0.40 0.18 2.95
34 Metal Products 1.99 8.13 3.17 4.04 2.74 5.54
35+36 Machine Tools & Elect. Machinery 2.14 -1.89 4.56 4.34 3.71 2.54
37 Transport Equipment - - 2.24 -2.73 0.33 -2.73
38 Other Manufacturing 6.49 -2.86 4.12 3.20 5.05 0.86
39+97+99 Repair Services 6.74 -3.18 6.22 0.42 6.45 -1.11
2 & 3 Total Manufacturing 2.14 1.78 2.21 1.83 2.17 1.80
(a) Agro-based (20-21 to 29) 1.45 2.16 0.83 1.72 1.18 1.97
(b) Others (30-38,97) 3.58 1.03 3.98 1.95 3.81 1.56
4 Utilities 4.70 -5.65 4.46 -4.19 4.56 -4.77
5 Construction 5.18 6.43 6.20 6.26 5.60 6.36
6 Trade 3.72 1.81 3.94 5.54 3.84 3.99
60-64 Wholesale Trade 9.14 0.88 5.91 -1.84 6.91 -0.86
65-68 Retail Trade 3.39 1.60 3.69 6.96 3.55 4.66
69 Hotel+Restaurant 2.55 3.91 3.34 4.40 3.01 4.20
7 Transport, Storage and 4.58 7.29 2.90 3.91 3.53 5.31Communication
Contd...

SARVEKSHANA20
8 Finance, Insurance & 5.99 2.51 5.63 7.05 5.71 6.07
Real Estate
9 Community, Social and 3.13 0.32 4.16 0.13 3.69 0.21
Personal Services
90 Public Admin, Defence etc 2.11 1.35 3.06 -0.46 2.73 0.17
91 Sanitary Services 4.92 -15.60 2.36 -6.35 3.47 -10.10
92 Education, Scientific etc 2.90 3.01 4.04 4.65 3.44 3.82
93 Medical & Health etc. 2.27 0.73 1.58 5.88 1.85 4.00
94 Community Services 3.74 -4.62 1.63 0.42 2.82 -2.42
95 Recreational & Cultural Services 7.72 -10.07 4.65 0.11 5.84 -3.60
96 Personal Services 3.75 -0.63 7.16 -3.73 5.31 -2.14
Non-Agriculture 3.23 2.31 3.54 2.95 3.40 2.65
All Sectors 1.75 0.66 3.27 2.27 2.06 1.02
Note: Since 1983, 1993-94 and 1999-2000 data are based on National Industrial Classification of 1970, 1987 and1998 respectively, we have used a concordance table published by CSO to reclassify the whole data set accordingto NIC 1987 codes.
Source: SARVEKSHANA, April 1988: S151-S167; NSS Report No. 409, March 1997: A 163-A176; NSS Report No.458, May 2001: A182-A194.
Rural Workers Urban Workers All Workers
NIC Code Production Sector 1983/ 1993-94/ 1983/ 1993-94/ 1983/ 1993-94/1993-94 1999-00 1993-94 1999-00 1993-94 1999-00
1 2 3 4 5 6 7 8
Table 3 Contd...

SA
RV
EK
SH
AN
A21
Table 4 Growth of Employment in Unorganised Manufacturing by Rural-Urban Location and Production Sectors: 1984-85/2000-01
RURAL URBAN
All All
OAMEs NDMEs DMEs Manufacturing OAMEs NDMEs DMEs Manufacturing
NIC 84-85/ 94-95 84-85/ 94-95 84-85/ 94-95 84-85/ 94-95 84-85/ 94-95 84-85/ 94-95 84-85/ 94-95 84-85/ 94-95
Code Description 94-95 00-01 94-95 00-01 94-95 00-01 94-95 00-01 94-95 00-01 94-95 00-01 94-95 00-01 94-95 00-01
1 2 3 4 5 6 7 8 9 10 11 12 13 14 15 16 17 18
20-21 Food Products -1.68 1.67 -3.90 0.87 2.06 -1.03 -1.56 1.23 -1.61 5.12 -1.06 3.28 -1.55 6.63 -1.43 4.82
22 Beverages, etc. 2.27 6.39 -4.81 -6.30 -3.79 12.39 1.38 6.39 -0.04 6.33 -3.70 -0.63 -7.15 2.76 -0.70 5.86
23+24+25 Cotton, Wool, Jute etc. -10.33 -0.67 0.73 -4.70 3.19 -9.79 -7.97 -2.65 -5.93 4.08 -0.16 0.38 -1.00 2.05 -3.22 2.59
26 Textile Products -5.77 12.96 -7.60 14.20 -1.00 -0.95 -5.54 11.87 -10.86 30.71 -12.54 32.07 5.04 7.29 -6.61 21.95
27 Wood Products 0.87 1.88 -1.33 2.46 1.39 -1.40 0.76 1.85 0.12 -0.32 5.46 2.12 -0.68 1.17 1.32 0.74
28 Paper Products 7.31 0.20 13.96 -10.95 -10.42 25.32 7.75 -1.98 4.72 4.27 4.46 8.26 -0.66 6.10 2.41 6.39
29 Leather Products -8.92 -6.07 -10.83 -1.95 -0.34 11.77 -8.93 -5.08 -2.08 -1.932.81 -1.66 5.28 -2.45 1.34 -2.04
30 Rubber Products 11.73 5.58 -2.11 3.96 15.35 19.88 10.99 11.58 15.94 7.08 -2.99 -1.51 -0.93 5.47 3.61 5.27
31 Chemical Products -8.3710.32 3.32 15.07 -3.71 11.71 -4.98 11.98 -13.43 7.14 14.76 1.20 2.41 -5.29 -0.04 -1.56
32 Non-metallic Mineral Products -0.80 -2.13 -4.032.96 3.38 11.34 -0.13 2.27 0.12 3.30 2.61 2.17 -0.50 10.39 0.39 5.41
33 Basic Metal Ind. -4.70 15.53 -6.25 13.93 -1.87 22.40 -4.25 17.48 6.50 -6.73 -1.37 9.43 -4.34 2.53 -0.76 2.08
34 Metal Products -4.08 5.28 -2.09 7.45 1.26 -3.17 -3.42 5.03 2.90 8.09 8.56 4.97 4.99 -3.39 5.77 2.52
35+36 Machine tool & Elect. Machinery1.88 10.14 4.16 8.78 -13.57 8.33 -2.95 9.67 -7.43 15.29 2.63 9.80 -2.25 10.82 -1.48 10.92
37 Transport Equipment -7.84 -4.72 -9.96 7.24 2.03 3.22 -6.62 1.08 10.85 -3.53 8.35 8.49 2.21 6.47 4.57 5.95
38 Other Manufacturing 9.35 -12.09 2.70 5.20 10.11 -3.20 9.13 -10.15 4.60 2.72 5.00 12.57 7.33 -2.90 5.48 3.21
39+97+99 Repair Services 1.71 -65.16 6.03 -62.28 -4.55 -27.03 2.09 -62.07 4.99 -58.59 5.65 -63.40 5.29 -58.10 5.27 -60.04
All -2.03 1.18 -2.53 0.92 2.09 2.86 -1.70 1.35 -0.98 3.47 1.40 2.89 1.70 1.73 0.37 2.82
Note: 1. Since 1984-85, 1994-95 and 2000-01 data are based on National Industrial Classification of 1970, 1987 and 1998 respectively,we have used a concordance table published by CSO to reclassify the whole data set according to NIC 1987 codes.
2. Repair Services (NIC 39, 97, 99) are not covered in 56th Round. However, for 2000-01, few industry groups which are not classifiedelsewhere are clubbed in industry group 39.
Source: The same as in Table 2.

SARVEKSHANA22
Table 4A Number of Units and Workers in Unorganised Manufacturing Sector:1984-85/2000-01
(Figures in lakhs)
Rural Urban All Unorganised
Period OAMEs NDMEs DMEs OAMEs NDMEs DMEs Rural Urban Total
1 2 3 4 5 6 7 8 9 10
Number of Units
1984-85 134.4 10.3 1.8 36.5 11.3 3.0 146.4 50.8 197.2
1994-95 95.3 6.7 2.9 27.1 9.3 3.6 105.0 40.1 145.0
2000-01 110.6 6.3 2.5 36.1 10.8 4.0 119.3 50.9 170.2
Increment/Decrement
94-95/84-85 -39.0 -3.6 1.2 -9.3 -2.0 0.6 -41.5 -10.7 -52.2
00-01/94-95 15.2 -0.4 -0.5 8.9 1.5 0.4 14.4 10.8 25.2
00-01/84-85 -23.8 -4.0 0.7 -0.4 -0.5 1.0 -27.1 0.1 -27.0
Composition of Workers
Full Time 186.6 21.9 19.2 47.7 25.2 26.1 227.8 98.9 326.7
1984-85 Part Time 32.5 1.7 0.7 5.5 1.4 1.0 34.9 7.9 42.8
Total 219.1 23.6 19.9 53.2 26.6 27.0 262.7 106.8 369.5
Full Time 149.6 17.1 23.7 45.2 29.3 31.1 190.3 105.6 295.9
1994-95 Part Time 28.9 1.2 0.9 3.0 1.2 0.9 31.0 5.1 36.1
Total 178.4 18.3 24.5 48.2 30.6 32.0 221.3 110.8 332.0
Full Time 148.7 17.8 27.7 49.3 34.7 34.5 194.1 118.4 312.5
2000-01 Part Time 42.8 1.6 1.4 9.9 1.6 1.1 45.8 12.5 58.3
Total 191.5 19.3 29.1 59.1 36.3 35.5 239.9 131.0 370.8
Increment/Decrement
Full Time -37.1 -4.9 4.4 -2.5 4.2 5.0 -37.5 6.7 -30.8
94-95/84-85 Part Time -3.6 -0.5 0.1 -2.5 -0.2 0.0 -3.9 -2.7 -6.7
Total -40.7 -5.3 4.6 -5.0 4.0 5.0 -41.4 4.0 -37.5
Full Time -0.9 0.7 4.0 4.1 5.4 3.4 3.8 12.8 16.6
00-01/94-95 Part Time 13.9 0.4 0.5 6.9 0.4 0.1 14.8 7.4 22.2
Total 13.0 1.0 4.5 11.0 5.7 3.5 18.6 20.2 38.8
Full Time -38.0 -4.2 8.5 1.6 9.5 8.4 -33.7 19.5 -14.2
00-01/84-85 Part Time 10.3 -0.1 0.7 4.4 0.2 0.1 10.9 4.7 15.5
Total -27.7 -4.3 9.1 6.0 9.7 8.5 -22.8 24.2 1.3
Source: The same as in Table 2.

SA
RV
EK
SH
AN
A23
Table 5 State-wise Growth Rate of Employment in Unorganised Manufacturing Sector (%): 1984-85/2000-01
RURAL URBAN
State 1984-85/1994-95 1994-95/2000-01 1984-85/1994-95 1994-95/2000-01
OAMEs NDMEs DMEs Total OAMEs NDMEs DMEs Total OAMEs NDMEs DMEs Total OAMEs NDMEs DMEs Total
1 2 3 4 5 6 7 8 9 10 11 12 13 14 15 16 17
Andhra Pradesh -0.50 -1.16 -0.39 -0.54 3.73 5.94 5.02 4.03 -4.56 -3.54 -2.73 -4.06 5.57 2.63 8.90 5.36
Assam 4.98 2.74 -10.95 4.14 -4.20 31.35 14.21 5.86 0.48 2.77 -2.37 1.07 4.00 0.91 0.49 2.04
Bihar -0.42 -7.42 8.27 -0.70 -0.09 -2.84 -5.81 -0.47 3.10 -0.64 0.25 1.59 -0.86 -4.79 -8.48 -2.59
Gujarat 11.39 -4.09 10.01 8.70 0.92 -2.51 -1.26 0.01 23.21 8.55 8.58 11.95 -7.51 1.97 -6.73 -4.91
Haryana -6.86 -1.50 8.96 -4.73 1.65 6.05 -4.89 1.09 -3.42 -0.86 1.40 -1.40 6.37 5.95 6.62 6.29
Himachal Pradesh 2.52 -5.51 2.66 1.42 -0.30 7.28 11.05 1.52 -4.45 -7.31 -10.94 -7.02 -8.53 -0.49 -1.50 -4.12
Jammu & Kashmir -7.86 -14.21 -25.27 -11.38 35.22 23.46 36.69 34.47 -17.84 -12.96 -21.00 -16.10 66.06 18.76 42.95 46.14
Karnataka 2.84 1.05 4.70 3.23 0.77 6.54 -5.18 -0.37 -1.43 -0.68 -5.65 -2.32 7.23 1.22 6.59 5.63
Kerala -5.79 -1.04 -5.61 -4.77 7.54 9.65 6.56 7.87 -13.33 -13.58 -9.20 -12.53 5.59 8.46 9.30 7.58
Madhya Pradesh 0.40 2.26 -8.41 -0.06 7.77 -1.08 19.54 7.94 -4.69 2.56 0.29 -2.34 6.00 -1.43 3.18 3.60
Maharashtra -4.64 -4.43 4.56 -3.45 5.45 2.94 2.19 4.65 1.78 8.41 5.74 5.09 6.28 1.45 0.74 2.61
Orissa 6.63 -5.50 3.37 6.03 -5.88 -6.01 -1.05 -5.80 1.15 0.46 -1.65 0.56 -0.97 -1.12 1.04 -0.72
Punjab -4.28 -1.99 6.84 -3.11 6.53 6.21 15.06 7.71 0.12 2.51 6.02 2.49 1.69 4.35 3.90 3.33
Rajasthan -4.57 -4.66 -4.37 -4.57 3.42 3.28 11.56 3.80 -1.68 -1.91 -2.95 -1.89 5.71 2.04 13.96 5.90
Tamilnadu -3.94 -5.51 1.41 -3.25 4.21 -0.23 -2.10 2.30 -6.01 -3.43 -1.11 -4.07 3.04 6.20 2.55 3.69
Uttar Pradesh -8.91 -1.13 4.84 -7.46 -2.55 -4.49 7.34 -1.25 0.96 2.08 1.42 1.32 -0.05 -0.42 0.36 -0.07
West Bengal 0.85 -3.62 0.89 0.43 4.50 2.22 -26.30 3.28 -3.07 -2.21 -3.73 -2.97 8.88 2.82 5.85 6.24
All India -2.03 -2.53 2.09 -1.70 1.18 0.93 2.87 1.35 -0.98 1.40 1.70 0.37 3.48 2.90 1.74 2.83
Source: The same as in Table 2.

SARVEKSHANA24
Summary
Small area statistics are useful for local level planning.GIS techniques are being increasingly used in small areaestimation. NSSO data on fsus (villages within a district,i.e., NSSO stratum) are ideal for this purpose. But, sofar, attempt has not been made to use GIS technique onNSSO data. One advantage of GIS method is that, unliketraditional regression method of estimation, no auxiliaryinformation is required.GIS method has been applied inthis paper to obtain block level estimates on the basis of1991 census data as an illustration. It was observed thatblock level estimates based on GIS turned out to haveless error than estimates based on regression method.
1. Introduction
Small areas for this study are small geographic areas. Ofseveral model-based techniques, GIS (GeographicalInformation System) is being increasingly used for smallarea estimation [Cai (2004)1, Heady (1998)2]. GIS modelsessentially assume that nearer areas are more likely to besimilar than areas that are further apart. GIS does notrequire information on any auxiliary variable.
With GIS, one may get estimates for all villages (NSSOfsu’s) within a district (NSSO stratum) using NSSO dataon selected villages within the district; one may alsocompute block level estimates for all blocks in the district.NSSO data are ideal for small area estimation using GIS.We first illustrate the use of GIS for small area estimation.Then we shall discuss GIS methodology.
A key component in using GIS is the availability of adigitized map of the boundaries of areas (e.g., NSSO fsu’s)of interest within a geographical zone (e.g., NSSOstratum) of interest.
To see if GIS based estimates are any good, we obtaineda separate set of estimates based on linear regressionequations, a standard method of estimation when anauxiliary variable is available.
Small Area Estimation Using GIS
Roma Choudhury Sahu, Kasturi Basu and Shibdas BandyopadhyayApplied Statistics Unit, Indian Statistical Institute, Kolkata - 700108
Algebraic comparisons of standard errors of small areaestimates based on GIS and regression equations will notbe attempted here. Instead, we shall use knownpopulations for comparisons and validation.
2. Illustration
For illustration, we shall obtain block-level estimateswithin a district; we have selected Nadia district in theState of West Bengal and digitized the 17 block boundaries( see Fig. 1).
FLR (Female Literacy Rate) i.e., [{No. of FemaleLiterates / (No. of Female - No. of Female in the agegroup 0-6)}* 100] at the block level is taken as studyvariable. FSCSTR (per cent SC/ST among femalepopulation in a block) is taken as an auxiliary variable.1991 census data from 1991 District Primary CensusAbstract3, are used to compute (see Table 1) FLR andFSCSTR and taken as true values.

SARVEKSHANA 25
Table 1: 1991 Census Data for 17 Blocks of Nadia District in West Bengal
B Block
I Id No Block Name
No of
Female
No of Female
in the age
group
(0-6) years
No of
Female
Scheduled
Cast
No of
Female
Scheduled
Tribes
No of Female
Literates
Female
Literacy
Rate
(%) *
Female
SCST
Rate
(%) **
(1) (2)
(3) (4) (5) (6) (7) (8) (9)
1
Karimpur-I
69181 12549 12531 1234 21148 37.34 19.90
2 Karimpur-II 78716 15776 13227 1009 17639 28.02 18.08
3 Tehatta-I 89711 16083 31255 1051 28077 38.13 36.01
4 Tehatta -II 55457 9864 9051 294 15669 34.37 16.85
5 kaliganj 114758 22584 20351 786 28410 30.82 18.42
6 Nakashipara 131512 25873 31201 3016 32850 31.10 26.02
7 Chapra 110052 21583 20148 441 27809 31.43 18.71
8 Krishnagar -II 51448 9184 9875 255 14638 34.63 19.69
9 Krishnaganj 54605 9209 24534 2808 18912 41.66 50.07
10 Krishnagar -I 107808 19506 38190 5177 32611 36.93 40.23
11 Nabadwip 50500 9923 7773 455 13944 34.36 16.29
12 Hanskhali 104074 16761 50867 2547 40709 46.62 51.32
13 Santipur 81184 14873 30971 3014 25469 38.41 41.86
14 Ranaghat-I 90532 14433 27952 805 37482 49.25 31.76
15 Ranaghat-II 136664 22824 62725 5389 55783 49.00 49.84
16 Chakdah 145580 23713 63218 7751 58612 48.09 48.75
17 Haringhata 85530 14733 26952 4429 32213 45.50 36.69
(Source : District Primary Census Abstract, Nadia, West Bengal, 1997)
* Female Literacy Rate = [No. of Female Literates / { No. of Female – No. of Female in the age group (0-6)}]*100
** Female SC & ST Rate = {( No. of Female SC + No. of Female ST )/ No. of Female }*100
2.1 No auxiliary information, GIS technique
We selected at random 10 of the 17 blocks (at least
10 data points are needed to apply GIS), copied the
FLR values for the 10 selected blocks from Table 1;
Table 2.1 gives the Id of selected blocks in col. (1)
and FLR values in col. (2). We now wish to
estimate FLR values for the remaining 7 block
using GIS. Table 2.2 gives the Id of the remaining 7
blocks in col. (1) and GIS predicted FLR in col. (2);
GIS model based standard errors of GIS estimates
are given in col. (3), true FLR are given in col. (4)
(copied from Table 1, col. (8)) and GIS residuals
(difference between true and GIS predicted) are
given in col. (5). Average squared error (sum of
squares of residuals in col. (5) divided by 7) is 24.
Square root of the average squared error, v24 =
4.90, compares well with the GIS model-based
standard errors in col. (3).
Table 2.1 : 10 Randomly Selected Blocks
Block
1991 Census
Id No FLR FSCSTR
(1) (2) (3)
3 38.13 36.01
4 34.37 16.85
5 30.82 18.42
8 34.63 19.69
9 41.66 50.07
10 36.93 40.23
11 34.36 16.29
12 46.62 51.32
13 38.41 41.86
16 48.09 48.75

SARVEKSHANA26
Table 2.2 : Prediction of Female Literacy Rate for 7 Blocks using GIS
Female Literacy Rate Observed
Block GIS Standard Observed * GIS Female SCST Regression RegressionId No Predicted Error Residuals Rate Predicted Residuals
(1) (2) (3) (4) (5) (6) (7) (8)
1 37.93 6.71 37.34 -0.59 19.90 33.75 3.59
2 37.43 5.68 28.02 -9.41 18.08 33.15 -5.13
6 33.44 3.59 31.10 -2.34 26.02 35.78 -4.68
7 37.12 3.76 31.43 -5.69 18.71 33.35 -1.92
14 43.82 3.48 49.25 5.43 31.76 37.68 11.57
15 46.61 4.05 49.00 2.39 49.84 43.66 5.34
17 47.96 4.03 45.50 -2.46 36.69 39.31 6.19
Average Squared Error 24.00 37.93
* treated as unknown but used for cross validation
Set No. 1: Id. no. of randomly selected blocks : 3,4,5,8,9,10,11,12,13,16
Regression Equation : FLR =27.16 + ( 0.33) * FSCSTR
2.2 With auxiliary information, Regression technique
For the 10 selected blocks as in section 2.1, FSCSTRvalues are copied in col. (3) in Table 2.1 from Table 1,col.(9).
The linear regression of FLR on FSCSTR, based on the10 pairs of observations for the 10 selected blocks is:FLR=27.16+0.33 * FSCSTR (1)
The correlation coefficient between FLR and FSCSTRis positive and 0.87.
Using the regression equation, FLR is predicted for theremaining 7 blocks.
Table 2.2 gives true FSCSTR values in col. (6) (copiedfrom Table 1), predicted FLR values, based on regressionequation (1), in col. (7) and regression residuals (differencebetween true and regression predicted) in col. (8). Theaverage squared error (sum of squares of residuals in col.(8) divided by 7) is 37.93.
2.3 Comparison
Based on the 10 randomly selected blocks, GIS technique
appears to be better than regression technique since theper cent relative efficiency of GIS compared to regressionis (37.93/24)*100% or 158%.
However, it is only for one of 17C10
possible sets of 10blocks. So, we repeat the same exercise for another 8randomly selected sets of 10 blocks. The results are givenin Table 3 : Col. (1) gives the set number, Id of randomlyselected blocks in col. (2), average squared errors in col.(3) and col. (4) respectively for GIS and regressiontechniques; in addition, regression intercepts and slopesare given in col. (5) and col. (6) along with correlationcoefficient in col. (7). With high correlation coefficientvalues (0.74 to 0.87) across the 9 random selections, itwas expected that regression technique would be good,but GIS did better in most cases, 8 out of 9 cases.
On an average, based on 9 replications, the relativeefficiency of GIS technique is (29.48/19.06)*100 = 155%as compared to regression technique. Moreover, one doesnot need any auxiliary variable to apply GIS technique.
3. Methodology
3.1 GIS technique
For using GIS technique, a digitized map is needed. Using

SARVEKSHANA 27
data on atleast 10 points a surface is fitted (see appendix)over the entire study area, including areas with data andwithout data. Predicted value at a location is the heightof the surface at the location (see appendix).
We are treating centroids of blocks as the representativeof blocks, both for fitting the surface and also forprediction.
After digitization of the district of Nadia, along with its17 block boundaries, we used GIS package forcomputation of the centroids (see Fig.1). Data for blocksare then attached to respective block centroids. Then asurface is fitted over the district. Basic GIS assumptionis that the neighbouring blocks influence the study variablemore than the far away blocks. Of several GIS techniques,we used ordinary kriging (see appendix) for fitting asurface (see Fig.2 for fitted surface using set 1). A
predicted value of a block is the height of the surface atits centroid. The fitted surface always passes through thetrue values used for fitting the surface.
3.2 With auxiliary information
A linear regression equation is fitted with the help ofordinary least squares method based on blocks for whichboth the study variable and the auxiliary variable areavailable. The predicted intercepts and predicted slopesfor the 9 sets are given in col. (5) and col. (6) of Table 3respectively. The predicted value of a block is thecorresponding intercept plus the slope multiplied by thecorresponding value of the auxiliary variable of that block.For this method no digitized map of the study area isnecessary; also, we do not need to attach data to thecentroids.

28 SARVEKSHANA
Table 3 : Comparison of Error Rates in 9 Randomly Selected Sets of 10 of 17 blocks
Average Squared Error * Regression
Correlation Set No
Randomly Selected Blocks
with Identification No
GIS Regression Intercept Slope Coefficient
(1) (2) (3) (4) (5) (6) (7)
1 3,4,5,8,9,10,11,12,13,16 24.00 37.93 27.16 0.33 0.87
2 1,2,3,4,7,8,9,11,13,15 12.64 33.62 26.93 0.34 0.84
3 1,4,7,8,9,11,12,13,14,15 15.45 26.08 29.21 0.33 0.77
4 1,3,5,6,7,8,9,10,15,16 19.19 31.39 24.42 0.41 0.86
5 2,3,6,7,8,9,11,14,15,16 13.88 14.79 24.14 0.46 0.80
6 1,4,5,7,8,10,12,13,15,17 16.78 28.79 26.31 0.39 0.85
7 1,2,3,4,6,7,10,12,13,15 7.42 33.44 23.88 0.42 0.85
8 2,6,7,8,10,12,13,14,16,17 23.28 11.97 23.10 0.48 0.75
9 2,4,6,7,8,9,10,11,13,17 38.91 47.28 26.96 0.30 0.74
Average of Average Squared Error 19.06 29.48
* See table 2.2 for computation of Average Squared Error for Set No 1.

SARVEKSHANA 29
3.3 Error in prediction
Error is the difference between the true value and thepredicted value (see Table 2.2). Average squared error isan average of the 7 squared errors.
4. Appendix
Let (x, y, z) be the three coordinates of a point in 3-dimension. Further let h be a function defined for everypoint (x, y) in the X-Y plane, and z = h(x, y). As (x, y)varies over X-Y plane, z = h(x, y) gives a surface overX-Y plane. z
0 = h(x
0 , y
0 ) is the height of the surface from
the point (x0 , y
0 ) on the X-Y plane.
For example, let x and y be the latitude and longitude ofa location on earth. Let z be the altitude (height from sealevel) at the location (x, y). For a given location(x
0 , y
0 ) on earth, z
0 = h(x
0 , y
0 ) is its height from sea
level. Similarly, z could be temperature or precipitationetc. The function h is usually unknown; it is not possibleto find the altitude/temperature/precipitation at a locationjust with the knowledge of its latitude and longitude.
The problem of fitting of a surface is essentially a problemof estimating the function h with n known (x, y, z) values,i.e., with known z values at a number of known locations(x
i , y
i ), i = 1, 2, … , n. The problem of fitting of a
surface is much more complex than standard regressionproblem since the z-values are correlated across locations.There are several methods for fitting of a surface, one ofwhich is ordinary kriging.
Ordinary kriging has two distinct tasks: quantification ofthe spatial structure (the correlation across locations) ofobserved z-values at known locations and computationof predicted values at locations where z-values have notbeen observed. Quantification of spatial structure is knownas variography that fits a spatial dependence model to theobserved z-values. Then the variography model is used,together with observed z-values, for prediction.
Data given are latitudes and longitudes of n locations(x
i , y
i ), i = 1, 2, …, n for which n z values are known. In
ordinary kriging, one z-value is estimated for a locationof interest; then another z-value is estimated for anotherlocation of interest; z-values are estimated one at a time.This way all z-values are estimated for all locations(x, y) over a geographic area of interest, yielding a surfaceover the geographic area of interest. Like every othermethod of fitting a surface, ordinary kriging is verycomputer intensive. Thompson (1992)4 illustrates a step-by-step estimation of one z-value.
References
1Qiang Cai, (2004): “ A Methodology For EstimatingSmall-Area Population By Age And Sex Based onMethods of Spatial Interpolation and StatisticalInference”, Department Of Geography, the University OfIowa, Iowa City, IA 52242, www. ucgis.org/ucgisfall2004/studentpapers/files/cai.pdf
2Patrick Heady, Phil Clarke, Bruce Mitchell, (1998):“GIS an Aid to Small Area Estimation: Sorting andLinking Survey Data for Statistical Modelling in thepresence of Alternative Boundaries”, StatisticalCommission and Economic Commission for EuropeConference of European Statisticians, Work Session onGeographical Information Systems (Ottawa, Canada, 5-7 October 1998), Working Paper No. 9, Submitted byOffice for National Statistics, United Kingdom,www.unece.org/stats/documents/1998/10/gis/9.e.pdf
3District Primary Census Abstract, Nadia District,(1997): Directorate of Census Operations, West Bengal,Census of India 1991, Series –26 , West Bengal , PartXII – B, District Census Handbook, West Bengal ,Nadia,Village & Townwise Primary Census Abstract
4S K Thompson, (1992): Sampling , Wiley

SARVEKSHANA30
Report on Informal non-Agricultural Enterprises : NSS 55th Round : Gujarat State(State Sample)
(Directorate of Economics and Statistics Gujarat)
Description Page No.
Highlights 31
I Introduction 32
II Concepts and Definitions 32
III Sample Design and Estimation Procedure 34
IV Survey Findings 35
Appendix 40
Tables (1-17) on 41-58“Informal non-agricultural enterprises”

SARVEKSHANA 31
HighlightsInformal Non-agricultural Enterprises in Gujarat
1. Total 8161 enterprises were surveyed in State, out of them 45.19% were in rural sector and54.81% were in urban sector.
2. Total number of Non-Agricultural enterprises has been estimated as 16.36 lakhs, out of these33.86% were located in rural sector and 66.14% were located in urban sector.
3. Total number of non-agricultural workers were estimated as 35.09 lakhs , out of them 24.37%and 75.66% were in rural and urban sector respectively.
4. Annual estimated gross value added per worker is worked out as Rs. 37607, while for ruraland urban sector it was worked out as Rs. 24234 and Rs. 41914 respectively.
5. Out of total number of enterprises, 89.7% were run under male proprietary.
6. On an average 98.3% enterprises were run under perennial operation.
7. On an average 91.5% enterprises operated for more than 9 months during the year.
8. Total loan outstanding per enterprise worked out as Rs. 11375.
9. About 67.3 % enterprises were located within household premises.
10. By status, about 15.9% enterprises were reported expanding.
11. About 29% enterprises reported as maintaining books of account.
12. About 4.2% enterprise is worked out as working on contract.
SARVEKSHANA32
I. Introduction
The fifty-fifth round of NSS was conducted during July1999 to June 2000 for collecting information on (1)household consumer expenditure, (2) employment -unemployment and (3) informal non-agriculturalenterprises (other than those engaged in industrialcategories of mining & quarrying, electricity, gas andwater supply) from nationwide samples of households orenterprises. The household consumer expenditure schedule(Schedule1.0) was canvassed for 1,20,309 householdslocated in 6,046 villages and 4,116 urban blocks, forCentral Sample (All-India) while for Gujarat State 5,234households located in 208 villages and 232 urban blockswere canvassed as a state sample. Through the consumerexpenditure schedule, data collected on quantity and valueof household consumption of different goods and services.Information on perception regarding sufficiency of foodintake from the sample households was also collected.The final outputs for consumer expenditure is MonthlyPer Capita Expenditure of household as a Socio-Economicmeasurement. Also, demographic features like age, sex,education, occupation etc. were collected for householdmembers.
One enquiry was on Non-Agricultural Enterprises in theInformal Sector. The non-agricultural enterprises engagedin the activities of manufacturing, construction, tradingand repair services, hotels and restaurants, transport,storage and communications, financial intermediation, realestate renting and business activities, education, healthand social work, other community, social and personalservice activities (excluding domestic services) werecovered in this survey. Information on characteristics ofthe enterprises like fixed assets, employment, expensesand receipts, values added, employment etc. was collectedfrom the enterprises under surveyed.
Period of Survey and Geographical Coverage: Theperiod of the fifty-fifth round survey was of one yearduration starting from July – 1999 to June – 2000. Thefield work was conducted into four sub-rounds, each ofthree–month duration with equal number of sample Firststage Units allotted to each sub-round all over five NSSregions of Gujarat State.
Units of Survey and Sample size: The stratified Samplingdesign was utilized for this survey. The first stage samplingunits (FSUs) were the Villages in rural sector and Urban
Frame Survey (UFS) blocks in urban sector according to1991 census. The Ultimate stage units were the householdsfor canvassing consumer expenditure (schedule 1.0),employment–unemployment (schedule 10), and informalnon-agricultural enterprises for (schedule 2.0). TheUltimate Stage units were selected by the method ofcircular systematic sampling from the selected frame.
II. Concepts and Definitions
Concept of informal sector: The term ‘informal sector’has no acceptable definition. However, the System ofNational Accounts (1993) recommended by UnitedNations also endorsed this resolution with regard to theconcept of informal sector. The concept and definition ofthe informal sector as per the resolution adopted at theFifteenth International Conference of Labour Statisticians(ICLS-I993) is briefly presented below:
Informal sector may be broadly characterized as consistingof units engaged in the production of goods or serviceswith the primary objective of generating employment andincomes to the persons concerned. These units typicallyoperate at low level of organisation, with little or nodivision between labour and capital as factors ofproduction and on a small scale. Labour relations, wherethey exist, are based mostly on casual employment,kinship, or personal or social relations rather thancontractual arrangements with formal guarantees. Alsohave similar characteristic features of householdenterprises. The owners of these units raise the necessaryfinance for production process, at their own risk and arepersonally liable, without limits. The capital goods suchas building or vehicles may be used indistinguishably forthe business and household purpose and such assets useddo not belong to the production units but to their owners.Activities performed by informal sectors should bedistinguished from the concept of the hidden orunderground economy.
Definition of informal sector: For statistical purpose,the informal sector is regarded as a group of productionunits, which form part of the household sector ashousehold enterprises and includes unincorporatedenterprises owned by households. The informal sectorcomprises of “informal own account enterprises” and“enterprises of informal employers”., irrespective of thekind of work place where the productive activities arecarried out and fixed capital assets used, the duration of

SARVEKSHANA 33
the operation of enterprise and its operations as a main orsecondary activity of the owner.
For this survey, information on workers including thoseworking in the proprietary and partnership non-agricultural enterprises was collected for each memberof the household during employment- unemploymentsurvey. All unincorporated proprietary and partnershipenterprises were defined as Informal Sector enterprises.This definition differs from the concept of unorganisedsector used in National Accounts Statistics. Anunorganised sector, in addition to unincorporatedproprietary or partnership enterprises, enterprises run bycooperative societies, trusts, private and public limitedcompanies ( Non- ASI) are also covered. In short, informalsector can therefore be considered as a subset of theunorganised sector.
Reference Period: The reference period means the periodof time for which data on consumption was collected.During 55th round of NSS, information on consumptionof food, pan, tobacco and intoxicants were collected forlast 30 days and the last 7 days from the same households.For items of clothing, footwear, durable goods, educationand medical (institutional) expenses, information werecollected for last 365 days preceding the date of survey.However, the monthly estimates presented in this reportwere based on data collected for “last 365 days” forclothing , footwear, durable goods, education andmedical(institutional) expenses and for “last 30 days “for the rest of the items.
Enterprise: An enterprise is an undertaking which isengaged in the production and / or distribution of somegoods and / or services meant mainly for the purpose ofsale, whether fully or partly. An enterprise may be ownedand operated by a single household or by severalhouseholds jointly, or by an institutional body.
Own Account Enterprise (OAE): An own accountenterprise is an undertaking run by household labour,usually without any hired worker employed on a ‘fairlyregular basis’. Fairly regular basis means the major partof the period of operations of the enterprise during last365 days.
Establishment: Those enterprises, which have got atleast one hired worker on ‘fairly regular basis’ are calledestablishments.
Proprietary Enterprises: Proprietary enterprises arethose where an individual is the sole owner of theenterprise.
Partnership Enterprises: Partnership is defined as therelation between persons who have agreed to share theprofits of a business carried on by all or any one of themacting for all. Partners may be from the same householdor they may be from different households.
Seasonal Enterprises: Seasonal enterprises are those,which are usually run in a particular season or fixedmonths of year.
Non-Agricultural enterprise: All enterprises coveredunder Tabulation Categories ‘A’ and ‘B’ of the NationalIndustrial Classification NIC-1998 are “agriculturalenterprises” while the others covered TabulationCategories ‘C’ to ‘Q’ are “non-agricultural enterprises”.In the 55th round, the enterprises falling under tabulationcategories ‘D’ to ‘O’ (except ‘E’ and ‘L’) have beencovered. Hence, the non-agricultural enterprises belongingto mining and quarrying, electricity, gas and water, publicadministration and defense, compulsory social security,private households with employed persons and extraterritorial organization and bodies have not been coveredin this survey.
Worker: A worker is defined as one who participateseither full time or part time in the activity of the enterprise.The worker may serve the enterprise in any capacity eitherprimary or supervisory and may or may not receive wages/salaries in return of work incidental to or connected withthe entrepreneurial activity.
Hired Worker: A hired worker is a person employeddirectly or through any agency on payment of regularwage/salary in cash or kind. Apprentices, paid or unpaidare treated as hired workers. Paid household workers,servants and resident workers of the enterprise are alsoconsidered as hired workers.
Mixed Activity: In an enterprise number of activities arecarried out simultaneously. If the information on eachactivity is separately available then each activity is treatedas a separate enterprise and if the accounts are notseparable for each such activity, the enterprise will beclassified as having mixed activities. For example, adoctor may have a medical shop attached to his dispensary,the appropriate NIC in such cases is determined on thebasis of major activity. The criteria for major activity

SARVEKSHANA34
refers to the activity which yields maximum income /turnover / employment.
III. Sample Design and Estimation Procedure
3.1 Sample Design:
A stratified multi-stage sampling design was adopted forselection of the sample First Stage Unit (FSU).The FSUsare villages for rural areas and Urban Frame Survey(UFS) blocks for urban areas. Finally, the selected unitsare enterprises for schedule 2.0 and households forschedule 1.0 and 10, by method of circular systematicsampling from the corresponding frame. Large FSUs aredivided into hamlet groups in rural areas and sub-blocksin urban areas, which are grouped into two segments andsample is selected independently from each segment.
3.2 Sampling Frame:
For rural areas, the list of villages according to PopulationCensus – 1991 and for urban areas, the latest availablelist of Urban Frame Survey blocks were used for selectionof sample FSUs. All households (including temporarilylocked) and non-agricultural enterprises were listed. Andonly the informal non-agricultural enterprises (excludingASI, Mining and Quarrying , electricity, gas and watersupply) which were operated at least for 30 days (15 daysfor seasonal enterprises) during last year qualify for surveyreferred to as ‘Eligible Enterprises’.
3.3 Stratification:
The Gujarat State was divided into five regions viz., (1)Eastern region, (2) Northern Plains, (3) Southern Plains,(4) Dry areas and (5)Saurashtra region. Each districtwithin the NSS region was divided into two areas namelyrural sector and urban sector. In each sector havingmaximum concentration of non-agricultural enterpriseswas selected for listing of households/enterprises, whichwas referred to segment 1. From the remaining (excludingsegment 1) hamlet group / sub-blocks of the FSU, two ormore hamlet groups / sub-blocks were selected circularsystematically and these 2 groups together known asSegment 2.
3.4 Stratification of Household:
All households listed were stratified into two second stage
strata namely affluent households forming SSS – 1 andthe rest SSS – 2. In rural sector, household having certainitems namely motor car / jeep , colour TV, telephone etc.or owns land / livestock beyond certain limit was classifiedas ‘Affluent’. In urban sector, household having MPCE(Monthly Per Capita Consumer Expenditure) greater thancertain limit of a town / city in which household locatedreferred to as SSS – 1 and rest as SSS-2.
3.5 Stratification of enterprise:
All the eligible enterprises in a segment for both sector(Rural and Urban) were stratified into 12 strata., whichconsists in combination of six broad industry group andtwo enterprise class. The enterprises were classified intotwo classes. In an enterprise if entrepreneurial activitycarried out with no hired worker during major part ofperiod of operation during the last year was referred to as‘Own Account Enterprise’, class-1 and rest as class- 2.An enterprise belongs any of six broad industry groupsviz., Manufacturing -1, construction -2, Trade and Repairservices -3, Hotels and Restaurants- 4, Transport, Storageand Communication -5 and other service sector -6.
3.6 Formation of stratum:
In Rural sector two special strata were formed at Statelevel namely, stratum 1 and stratum 2. All FSUs havingpopulation between 1 to 100 and FSUs having populationmore than 15000 were allocated Stratum 1 and stratum 2respectively. In urban sector the sample size were firstallocated among three classes of towns in proportion topopulation, viz. (1) population less than 50000 ,(2)population between 50000 and less than 10 lakhs and (3)population having more than 10 lakhs). Again within NSSregion sample allocated between two strata, namely (1)Hospital Area/Industrial Area/ and Bazar area blocks and(2) the rest in proportion to total number of FSUs in therespective frames with double weightage given to thefirst category of blocks.
3.7 General Procedure for selection of Households /Enterprises:
The sample households/enterprises were selected from therespective frames by circular systematic sampling withequal probability. For the purpose of systematic samplinghouseholds in the frame of Second Stage Stratum twowerearranged by means of livelihood and land possessedclasses for rural sector and by means of livelihood and

SARVEKSHANA 35
by MPCE classes for urban sector. Enterprises under eachstratum (i.e. segment, broad industry group and enterpriseclass) were arranged in the ascending order of NIC-2 digitcodes ( 3-digit codes for Hotel and Restaurants) beforesampling.
The total All India sample size for rural and urban sectorcombined was 10384 FSU for central sample. The totalsample size for Gujarat State Sample (Rural andUrban) were 440 FSU.
Estimation Procedure:
The following notations were used in this section
D = number of hamlet groups / sub-blocks formedin FSU
s = subscript for the s-th segment of sample village/block (s = 1 & 2)
g = subscript for the g-th broad group of industry(g = 1 to 6))
t = subscript for the t-th enterprise class (t = 1 &2)
Z = Total of sizes in the sampling frame for thestratum
z = Size used for selection of an FSU from samplingframe
H = Total number of households listed in a village /block
h = Number of household surveyed and used fortabulation
k = subscript for the kth sample enterprise
E = total number of enterprises listed in appropriateframe
e = number of enterprises surveyed and used fortabulation
n = number of sample village/blocks surveyedwithin a stratum and sub sample (includinguninhabited and zero cases and excludingcasualty and not reported cases and used fortabulation
Y = estimate of population total of character Y
y = value of any character under estimation in asample village / block /enterprise / household
For estimating characteristic of enterprises for a stratumof a sub-sample replicate from the selection frame basedon broad group of industry (g) × enterprise class (t).
Rural:
n 2
efsgt
= z ∑ 1 ∑ Bfsgt
∑ yfsgtk
n f=1 zf s=1 k=1
Urban : n
2
efsgt
= z ∑ ∑ Bfsgt
∑ yfsgtk
n f=1 s=1 k=1
IV. Survey Findings
The present survey is first ever nation wide integratedsurvey of households and non-agricultural enterprises inthe informal sector. The concept of informal sectorcharacterised as consisting of units engaged in theproduction of goods and/or services with primary objectiveof generating employment and income. These unitstypically operate at low level of organization, with littleor no division between labour and capital as factors ofproduction and on a small scale. The employer andemployee relations are based on casual employment orpersonal or social relations rather than contractualarrangements with formal guarantees. The owners of theseunits have to raise the necessary finance at their own riskand are personally liable, without limit for any debts orobligation incurred in the production process. The capitalgoods such as building or vehicles used for both thebusiness and household purpose without discriminationand belongs to the owners. The informal sector is regardedas a group of production units, which form part of thehousehold sector as household enterprises andunincorporated enterprises owned by households. Withinthe household sector, the informal own account enterprisesand informal employers, however, the enterprises coveredunder Annual survey of Industries were out of the coveragefor unorganised sector survey. The survey findings onthe basis of schedule of enquiry 2.0 and related informationon estimated number of enterprises, workers, value addedand other characteristics of the enterprises is presentedherewith.
The Gujarat state sample results are based on datacollected during the NSS 55th round survey from July-1999 to June-2000 covering sample of 208 villages and232 urban blocks, while 6046 sample villages and 4124urban blocks at All-India level .
Y
Y

SARVEKSHANA36
Enterprises Surveyed:
The information on the number of enterprises surveyedby type of enterprise (OAE and Establishment) for rural,urban and combined is given in table – 1. A total numberof 8161 enterprises surveyed in the State, out of them3688 (nearly 45%) Were from rural sector and 4473
(nearly 55%) were from urban sector. Also out of total8161 number of enterprises, 6852 (84%) were OAEs and1309 (16%) were Establishments in rural and urban areas.Out of 3688 rural sample 3420 (93%) were OAEs and268 (7%) were Establishments. In urban sector out of4473 sample 3432 (77%) were OAEs and 1041 (23%)were Establishments.
Table 1 : Number of Sample Enterprises :
Rural Urban Combined
OAE EST. ALL OAE EST. ALL OAE EST. ALL
Gujarat 3420 268 3688 3432 1041 4473 6852 1309 8161
All-India 102122 12384 114506 60851 22280 83131 162973 34664 197637
Table -2 : Estimated Number of Enterprises by type of enterprises and sectors
Broad Industry Group O.A.E. Establishments TOTAL
Sector : Rural1. Manufacturing 180084 16501 196585
2. Construction 9773 1013 10786
3. Trading and Repair 236250 9446 245696
4. Hotels and Restaurants 7081 1994 9074
5. Transport and Storage 45722 2572 48294
6. Others 41594 2209 43803
Total 520503 33734 554237
Sector : Urban1. Manufacturing 139987 85233 225220
2. Construction 3580 1331 4911
3. Trading and Repair 471235 164582 635817
4. Hotels and Restaurants 23715 18795 42510
5. Transport and Storage 71934 6570 78505
6. Others 68456 26816 95271
Total 778907 303327 1082234
Combined1. Manufacturing 320071 101735 421805
2. Construction 13352 2344 15696
3. Trading and Repair 707485 174028 881513
4. Hotels and Restaurants 30796 20788 515845. Transport and Storage 117656 9142 1267996. Others 110050 29024 139074Total 1299411 337061 1636471
Futher, the estimated number of enterprises by type ofenterprises viz. OAE and Establishment, separately forrural, urban and combined are depicted in Table-2. AtState level, total number of non-agricultural enterpriseshas been estimated as 16.36 lakhs. Out of these 5.54 lakhs
(34%) are located in rural sector and 10.82 lakhs (66%)are located in urban sector. Also majority of enterprisesbelong to tabulation category Manufacturing and Tradingand Repair contributing 26% and 54% respectively.

SARVEKSHANA 37
Table -3 : Estimated Number of Workers
Broad Industry Group O.A.E. ESTABLISHMENTS TOTAL
Rural
1. Manufacturing 263922 100078 363999
2. Construction 10258 3873 14132
3. Trading and Repair 313637 27438 341075
4. Hotels and Restaurants 10976 8059 19035
5. Transport and Storage 48579 7549 56129
6. Others 49876 10686 60562
Total 697248 157684 854932
Urban
1. Manufacturing 243197 487308 730505
2. Construction 4297 4206 8503
3. Trading and Repair 716742 753447 1470188
4. Hotels and Restaurants 39325 88930 128255
5. Transport and Storage 85388 30419 115807
6. Others 96436 104872 201309
Total 1185385 1469182 2654567
Combined
1. Manufacturing 507119 587385 1094504
2. Construction 14556 8079 22635
3. Trading and Repair 1030379 780885 1811263
4. Hotels and Restaurants 50300 96989 147290
5. Transport and Storage 133967 37969 171936
6. Others 146312 115558 261870
Total 1882633 1626866 3509499
Share of informal sector Employment to Totalemployment: At the State level, the estimated number ofpersons employed based on schedule 10 of NSS 55thround (Table-16 of the appendix) were 1.42 crores ofwhich 1.04 crores were from rural areas and 37.62 lakhsfrom urban areas. Comparing these figures with workersengaged in informal sector, the share of informal sectors
to total employment was 24.88 percent at state level whichwas 8.22 % for rural areas and 70.56 % for urban areas.Maximum share of workers engaged in informal sectorto total employment was in “Trading and repair” group(12.79%) at State level. This was in “Manufacturing”group (3.50%) for rural areas and “Trading and repair”group (39.08%) for urban areas.
Estimated workers : At State level the total number ofnon-agricultural workers has been estimated at 35.09lakhs, of them 8.55 lakhs (24%) workers were workingin enterprises located in rural sector and 26.54 lakhs(76%) workers were working in enterprises located in
urban sector. Out of total 35.09 lakhs workers 54% wereworking in OAEs enterprises and 46% in Establishmentsenterprises. Also majority of workers belong to tabula-tion category Manufacturing and Trading and Repairwhich contributing 31% and 52% respectively.

SARVEKSHANA38
Table – 3-A : Share of Informal Sector Employment to total Employment
Broad Industry Group O.A.E. ESTABLISHMENT TOTAL
% to total % to total % to totalemployment employment employment
Rural
1. Manufacturing 2.54 0.96 3.50
2. Construction 0.10 0.04 0.14
3. Trading and Repair 3.02 0.26 3.28
4. Hotels & Restaurants 0.11 0.08 0.18
5. Transport & Storage 0.47 0.07 0.54
6. Others 0.48 0.10 0.58
Total 6.70 1.52 8.22
Urban
1. Manufacturing 6.46 12.95 19.42
2. Construction 0.11 0.11 0.23
3. Trading and Repair 19.05 20.03 39.08
4. Hotels & Restaurants 1.05 2.36 3.41
5. Transport & Storage 2.27 0.81 3.08
6. Others 2.56 2.79 5.35
Total 31.51 39.05 70.56
Combined
1. Manufacturing 3.58 4.15 7.73
2. Construction 0.10 0.06 0.16
3. Trading and Repair 7.27 5.51 12.79
4. Hotels & Restaurants 0.36 0.68 1.04
5. Transport and Storage 0.95 0.27 1.21
6. Others 1.03 0.82 1.85
Total 13.29 11.49 24.78
Value Added Per Worker : The value added per workerper annum for rural, urban and combined for all categoryis depicted in Table – 4. As per schedule of enquiry,information was collected for all enterprises for referencemonth and annual value added derived by multiplyingthe related data by 12 in case of casual and perennialenterprises and by number of months operated for seasonalenterprises by product method. At State level, annualvalue added per worker is estimated at Rs. 37607, whilefor All-India level it stands at Rs. 24242. The value added
per worker for OAEs is Rs. 33616 and for establishmentsis Rs. 42225. For all broad industry group combined, thevalue added per worker for state in rural areas is 58% ofthe value added per worker in the urban areas, while forAll-India it is estimated at 45%. In urban and rural sectorthe highest value added per worker is for Constructionservices. The lowest value added per worker in urbansector is Hotel and Restaurant services while in ruralsector lowest value added per worker is Manufacturingservices.

SARVEKSHANA 39
Table- 4: Estimated Annual Gross Value added per Worker per annum by area.
(Figures in Rs.)
Broad Industry Group O.A.E. Establishments TOTAL
Combined
1. Manufacturing 21593 41664 32364
2. Construction 33855 65306 45081
3. Trading and Repair 40926 41093 40998
4. Hotels and Restaurants 23415 23472 23453
5. Transport and Storage 31867 71286 40572
6. Others 28900 57298 41431
Total 33616 42225 37607
Rural
1. Manufacturing 17643 27756 20424
2. Construction 32580 34665 33152
3. Trading and Repair 26600 25120 26481
4. Hotels and Restaurants 22126 20907 21610
5. Transport and Storage 31886 30414 31688
6. Others 22790 42759 26314
Total 23323 28261 24234
Urban
1. Manufacturing 25879 44520 38314
2. Construction 36898 93524 64907
3. Trading and Repair 47194 41675 44366
4. Hotels and Restaurants 23775 23705 23726
5. Transport and Storage 31856 81429 44877
6. Others 32059 58779 45979
Total 39671 43723 41914
The information regarding other important characteristicsviz. maintenance of accounts, status of registration,working on contract, type of ownership, location ofenterprise, nature of operation, problem faced in operation,
other economic activities undertaken, and growth statusof the enterprise over the last three years etc. were collectedfor each surveyed enterprise and the related tables areannexed herewith.

SARVEKSHANA40
AppendixNational Sample Survey Results - Gujarat State (State sample):55th Round
Informal Non-agricultural EnterprisesTable Index
No. TABLE Page No.
1 Table - 1 Statement showing estimated loans/interest outstanding per 41Enterprise, workers, broad industry group, sector and type
2 Table - 2 Proportion (per 1000) of enterprise by nature of operation 42
3 Table - 3 Proportion (per 1000) of enterprise separately by ownership 43
4 Table - 4 Proportion (per 1000) of enterprise by month of operation 44
5 Table - 5 Proportion (per 1000) of enterprise by type of location 45-46
6 Table - 6 Proportion (per 1000) of enterprises by Maintenance of accounts 47
7 Table - 7 Proportion (per 1000) of enterprises by agency of purchase of Basic inputs 48
8 Table - 8 Proportion (per 1000) of enterprises by destination agency for sale 49of final product / services
9 Table - 9 Statement showing proportion (per 1000) of enterprise by Status of enterprise 50
10 Table - 10 Statement showing annual GVA per worker and working force by 512-digited NIC-code
11 Table - 11 Proportion (per 1000) of enterprises by type of contract 52
12 Table - 12 Proportion (per 1000) of enterprises by equipment supplied 53
13 Table - 13 Statement showing proportion (per 1000) of enterprise by supply 54of raw material
14 Table - 14 Statement showing proportion (per 1000) of enterprises by 55Designed specified by contractor
15 Table - 15 Statement showing estimatred number of worker by gender, 56Broad industry group, sector and type
16 Table - 16 Distribution of estimated persons by type of activity and 57by age group(15+) (based on schedule - 10)
17 Table - 17 Distribution of estimated persons by type of activity and by 58age group (5+) (based on schedule - 10)

SARVEKSHANA 41
Table -1 : Statement showing estimated loans/interest outstanding per Enterprise, workers, broad industrygroup, sector and type
(In Rs.)
BROAD LOANS OUTSTANDING PER ENTERPRISE
INDUSTRY AMOUNT INTEREST ENTERPRISE WORKER
GROUP SAMPLE EST. SAMPLE EST.
Combined
1. Manufacturing 25629 369 2386 421805 4918 1094504
2. Construction 2148 45 95 15696 152 22635
3. Trade/Repair 4840 60 3346 881513 5496 1811263
4. Hotel/Restau. 6391 108 406 51584 1099 147290
5. Trans./Stor. 10426 155 888 126799 1199 171936
6. Other Services 13321 169 1040 139074 1695 261870
Total 11375 158 8161 1636471 14559 3509499
Rural
1. Manufacturing 8755 134 1223 196585 2070 363999
2. Construction 420 6 50 10786 71 14132
3. Trade/Repair 823 17 1536 245696 2097 341075
4. Hotel/Restau. 1421 21 131 9074 264 19035
5. Trans./Stor. 15389 265 337 48294 403 56129
6. Other Services 484 14 411 43803 519 60562
Total 4881 80 3688 554237 5424 854932
Urban
1. Manufacturing 40358 575 1163 225220 2848 730505
2. Construction 5942 130 45 4911 81 8503
3. Trade/Repair 6393 76 1810 635817 3399 1470188
4. Hotel/Restau. 7452 126 275 42510 835 128255
5. Trans./Stor. 7373 88 551 78505 796 115807
6. Other Services 19223 240 629 95271 1176 201309
Total 14702 197 4473 1082234 9135 2654567

SARVEKSHANA42
Table - 2 : Proportion (per 1000) of enterprise by nature of operation
(No.)
State Sample Central Sample All India
Nature of O. A. E. ESTABLISH- Total O. A. E. ESTABLISH- Total O. A. E. ESTABLISH- Totaloperation MENTS MENTS MENTS
Combined
1. Perennial 981 991 983 982 994 984 968 975 969
2. Seasonal 15 9 14 15 6 13 26 23 26
3. Casual 4 0 3 3 0 3 6 2 5
4. N.R. 0 0 0 0 0 0 0 0 0
5. Total 1000 1000 1000 1000 1000 1000 1000 1000 1000
Sample 6852 1309 8161 7091 1570 8661 162973 34664 197637
Estimated 1299411 337061 1636471 1707000 383000 2091000 38799000 5613000 44412000
Rural
1. Perennial 972 999 974 976 982 976 958 929 956
2. Seasonal 23 1 22 23 18 23 36 67 38
3. Casual 5 0 4 1 0 1 6 4 6
4. N.R. 0 0 0 0 0 0 0 0 0
5. Total 1000 1000 1000 1000 1000 1000 1000 1000 1000
Sample 3420 268 3688 3503 411 3914 102122 12384 114506
Estimated 520503 33734 554237 711000 59000 770000 23657000 1411000 25068000
Urban
1. Perennial 987 990 988 986 997 988 983 991 984
2. Seasonal 10 10 10 9 3 8 11 8 11
3. Casual 4 0 3 5 0 4 6 1 5
4. N.R. 0 0 0 0 0 0 0 0 0
5. Total 1000 1000 1000 1000 1000 1000 1000 1000 1000
Sample 3432 1041 4473 3588 1159 4747 60851 22280 83131
Estimated 778907 303327 1082234 996000 325000 1321000 15142000 4202000 19344000

SARVEKSHANA 43
Table - 3 : Proportion (per 1000) of enterprise separately by ownership
(No.)
State Sample Central Sample All India
Type of O. A. E. ESTABLISH- Total O. A. E. ESTABLISH- Total O. A. E. ESTABLISH- TotalOwnership MENTS MENTS MENTS
Sector : Combined
1. Proprietary 917 824 897 891 716 859 861 863 861(Male)
2. Proprietary 57 73 60 79 38 72 129 49 119(Female)
3. Partnership - 26 39 28 15 205 50 6 53 12Same HH
4. Partnership - 0 64 14 14 41 19 3 35 7Different HH
5. n.r. 0 0 0 0 0 0 0 0 0
6. Total 1000 1000 1000 1000 1000 1000 1000 1000 1000
Sample 6852 1309 8161 7091 1570 8661 162973 34664 197637
Estimated 1299411 337061 1636471 1707000 383000 2091000 38799000 5613000 44412000
Sector : Rural
1. Proprietary 946 826 938 939 925 938 858 904 860(Male)
2. Proprietary 53 75 55 51 13 48 135 41 130(Female)
3. Partnership - 1 4 1 5 21 6 5 20 6Same HH
4. Partnership - 0 95 6 5 41 8 2 35 4Different HH
5. n.r. 0 0 0 0 0 0
6. Total 1000 1000 1000 1000 1000 1000 1000 1000 1000
Sample 3420 268 3688 3503 411 3914 102122 12384 114506
Estimated 520503 33734 554237 711000 59000 770000 23657000 1411000 25068000
Sector : Urban
1. Proprietary 898 824 876 857 679 813 866 849 862(Male)
2. Proprietary 60 73 63 100 42 86 120 51 105(Female)
3. Partnership - 42 43 42 23 238 76 8 64 20Same HH
4. Partnership - 0 61 18 20 41 25 5 36 12Different HH
5. n.r. 0 0 0 0 0 0
6. Total 1000 1000 1000 1000 1000 1000 1000 1000 1000
Sample 3432 1041 4473 3588 1159 4747 60851 22280 83131
Estimated 778907 303327 1082234 996000 325000 1321000 15142000 4202000 19344000

SARVEKSHANA44
Table - 4 : Proportion (per 1000) of enterprise by month of operation
(No.)
State Sample Central Sample All India
Months of O. A. E. ESTABLISH- Total O. A. E. ESTABLISH- Total O. A. E. ESTABLISH- Totaloperation MENTS MENTS MENTS
Sector : Combined
1. Up to 3 Months 30 19 28 20 16 19 25 27 25
2. 4 to 6 Months 27 14 24 20 12 19 37 35 37
3. 7 to 9 Months 37 14 33 23 10 21 46 27 44
4. > 9 Months 906 952 915 885 933 894 867 884 869
5. n.r. 51 29 47 25 27 25
6. Total 1000 1000 1000 1000 1000 1000 1000 1000 1000
Sample 6852 1309 8161 7091 1570 8661 162973 34664 197637
Estimated 1299411 337061 1636471 1707000 383000 2091000 38799000 5613000 44412000
Sector : Rural
1. Up to 3 Months 28 17 28 14 27 15 25 36 25
2. 4 to 6 Months 45 45 45 14 16 14 41 72 43
3. 7 to 9 Months 54 17 52 26 6 25 58 36 57
4. > 9 Months 873 921 876 873 843 871 850 808 847
5. n.r. 72 108 75 27 47 28
6. Total 1000 1000 1000 1000 1000 1000 1000 1000 1000
Sample 3420 268 3688 3503 411 3914 102122 12384 114506
Estimated 520503 33734 554237 711000 59000 770000 23657000 1411000 25068000
Sector : Urban
1. Up to 3 Months 31 20 28 24 14 22 26 24 26
2. 4 to 6 Months 14 10 13 25 11 21 30 23 29
3. 7 to 9 Months 26 14 23 21 10 19 28 24 27
4. > 9 Months 928 956 936 893 950 907 894 909 898
5. n.r. 37 15 31 22 20 21
6. Total 1000 1000 1000 1000 1000 1000 1000 1000 1000
Sample 3432 1041 4473 3588 1159 4747 60851 22280 83131
Estimated 778907 303327 1082234 996000 325000 1321000 15142000 4202000 19344000

SARVEKSHANA 45
Table - 5 : Proportion (per 1000) of enterprise by type of location
(No.)
State Sample Central Sample All India
Type of O. A. E. ESTABLISH- Total O. A. E. ESTABLISH- Total O. A. E. ESTABLISH- TotalLocation Code MENTS MENTS MENTS
Sector : Combined
Within HH 223 41 186 261 38 220 392 132 359Premises
1. O/S HH with 547 928 626 440 893 523 302 777 362fixed/perm str.
2. O/S HH With 43 17 37 58 17 50 32 17 30TemporaryStructure
3. O/S HH 12 3 10 42 6 35 33 11 30Without anyStructure
4. Sub Total 602 948 673 540 916 608 367 805 422(1+2+3)
5. Mobile Market 46 6 37 43 13 37 70 15 63
6. Street Vendor 123 2 98 136 7 112 122 15 108
7. Constructionsite 6 4 6 21 27 22 50 33 48
8. Sub Total 175 12 141 200 47 171 242 63 219(4+5+6)
9. n.r. 0 0 0 1 0 1
10.Total 1000 1000 1000 1000 1000 1000 1000 1000 1000
Sample 6852 1309 8161 7091 1570 8661 162973 34664 197637
Estimated 1299411 337061 1636471 1707000 383000 2091000 38799000 5613000 44412000
Sector : Rural
Within HH 362 132 348 356 79 335 462 216 448Premises
1. O/S HH with 381 760 404 343 660 367 235 596 255fixed/perm str.
2. O/S HH With 41 20 40 75 37 72 28 24 28TemporaryStructure
3. O/S HH 17 21 17 35 7 32 31 27 31Without anyStructure
4. Sub Total 439 801 461 453 704 471 294 647 314(1+2+3)
5. Mobile Market 45 36 45 50 70 52 70 40 69
6. Street Vendor 142 16 134 118 24 111 118 36 113
7. Construction site 12 15 12 22 122 30 54 61 55
8. Sub Total 199 67 191 190 216 193 242 137 237(4+5+6)
9. n.r. 0 0 0 1 1 1
10. Total 1000 1000 1000 1000 1000 1000 1000 1000 1000
Sample 3420 268 3688 3503 411 3914 102122 12384 114506
Estimated 520503 33734 554237 711000 59000 770000 23657000 1411000 25068000
Contd...

SARVEKSHANA46
Sector : Urban
Within HH 130 31 103 193 30 153 281 104 243Premises
1. O/S HH with 659 947 739 510 936 614 406 837 499fixed/perm str.
2. O/S HH With 44 16 36 46 13 38 38 15 33TemporaryStructure
3. O/S HHWithout any 9 1 7 47 5 37 36 6 29Structure
4. Sub Total 712 964 782 603 954 689 480 858 561(1+2+3)
5. Mobile Market 46 3 34 37 3 29 69 6 55
6. Street Vendor 110 0 79 148 3 113 127 8 101
7. Construction site 2 2 2 20 9 17 42 23 38
8. Sub Total 158 5 115 205 15 159 238 37 194(4+5+6)
9. n.r. 0 0 0 0 0 0
10. Total 1000 1000 1000 1000 1000 1000 1000 1000 1000
Sample 3432 1041 4473 3588 1159 4747 60851 22280 83131
Estimated 778907 303327 1082234 996000 325000 1321000 15142000 4202000 19344000
(No.)
State Sample Central Sample All India
Type of O. A. E. ESTABLISH- Total O. A. E. ESTABLISH- Total O. A. E. ESTABLISH- TotalLocation Code MENTS MENTS MENTS
Table - 5 Contd...

SARVEKSHANA 47
Table - 6 : Proportion (per 1000) of enterprises by Maintenance of accounts
(No.)
State Sample Central Sample All India
Maintenance O. A. E. ESTABLISH- Total O. A. E. ESTABLISH- Total O. A. E. ESTABLISH- Totalof Accounts MENTS MENTS MENTS
Sector : Combined
1. Yes 207 611 290 75 469 147 28 214 52
2. No 793 389 710 925 531 853 972 786 948
3. N.R. 0 0 0 0 0 0
4. Total 1000 1000 1000 1000 1000 1000 1000 1000 1000
Sample 6852 1309 8161 7091 1570 8661 162973 34664 197637
Estimated 1299411 337061 1636471 1707000 383000 2091000 38799000 5613000 44412000
Sector : Rural
1. Yes 59 200 68 13 72 17 18 93 22
2. No 941 800 932 987 928 983 982 907 978
3. N.R. 0 0 0 0 0 0
4. Total 1000 1000 1000 1000 1000 1000 1000 1000 1000
Sample 3420 268 3688 3503 411 3914 102122 12384 114506
Estimated 520503 33734 554237 711000 59000 770000 23657000 1411000 25068000
Sector : Urban
1. Yes 305 656 403 120 541 223 44 255 90
2. No 695 344 597 880 459 777 956 745 910
3. N.R. 0 0 0 0 0 0
4. Total 1000 1000 1000 1000 1000 1000 1000 1000 1000
Sampple 3432 1041 4473 3588 1159 4747 60851 22280 83131
Estimated 778907 303327 1082234 996000 325000 1321000 15142000 4202000 19344000

SARVEKSHANA48
Table - 7 : Proportion (per 1000) of enterprises by agency of purchase of basic inputs
(No.)
State Sample Central Sample All India
Agency of O. A. E. ESTABLISH- Total O. A. E. ESTABLISH- Total O. A. E. ESTABLISH- TotalPurchase of basic MENTS MENTS MENTSInputs
Sector : Combined
1. Government 17 10 15 30 19 28 9 20 10Agency
2. Co-op. / Marketing 9 7 8 10 7 9 6 9 7Society
3. Private enterprise 786 714 768 667 785 689 602 702 615
4. Contractor / 46 221 90 22 42 26 72 44 68Middlemen
5. Private 122 40 101 119 82 112 187 154 183Individual / HH
6. Others 20 7 17 15 5 14 31 16 29
7. N.R. 22 0 16 0 0 0 0 0 0
8. Not Applicable 49 23 43 181 115 169 158 128 154
9. Total 1000 1000 1000 1000 1000 1000 1000 1000 1000
Sample 6852 1309 8161 7091 1570 8661 162973 34664 197637
Estimated 1299411 337061 1636471 1707000 383000 2091000 38799000 5613000 44412000
Sector : Rural
1. Government Agency 17 30 18 11 40 13 7 23 8
2. Co-op. / Marketing 16 26 17 10 0 9 6 11 7Society
3. Private enterprise 756 841 761 705 729 707 562 619 565
4. Contractor / 22 15 21 14 57 17 86 47 83Middlemen
5. Private Individual/ 153 80 149 116 126 117 207 196 207HH
6. Others 36 9 34 26 3 24 41 25 40
7. N.R. 1 0 1 0 0 0 0 0 0
8. Not Applicable 48 38 47 161 114 157 157 162 157
9. Total 1000 1000 1000 1000 1000 1000 1000 1000 1000
Sample 3420 268 3688 3503 411 3914 102122 12384 114506
Estimated 520503 33734 554237 711000 59000 770000 23657000 1411000 25068000
Sector : Urban
1. Government Agency 17 9 14 43 15 36 11 18 13
2. Co-op. / Marketing 4 5 5 10 8 9 6 9 7Society
3. Private enterprise 806 704 772 640 795 678 665 729 679
4. Contractor / 63 239 122 28 40 31 50 43 48Middlemen
5. Private Individual/ 101 36 79 121 74 110 156 140 153HH
6. Others 9 7 8 8 6 7 16 13 15
7. N.R. 35 0 24 0 0 0 0 0 0
8. Not Applicable 50 21 41 194 115 175 159 117 150
9. Total 1000 1000 1000 1000 1000 1000 1000 1000 1000
Sample 3432 1041 4473 3588 1159 4747 60851 22280 83131
Estimated 778907 303327 1082234 996000 325000 1321000 15142000 4202000 19344000

SARVEKSHANA 49
Table - 8 : Proportion (per 1000) of enterprises by destination agency for sale of final product / services
(No.)
State Sample Central Sample All India
Type of Location O. A. E. ESTABLISH- Total O. A. E. ESTABLISH- Total O. A. E. ESTABLISH- TotalConde MENTS MENTS MENTS
Sector : Combined
1. Government 2 1 2 1 3 2 2 10 3Agency
2. Co-op. / 4 4 4 5 2 5 5 5 5Marketing Society
3. Private enterprise 103 386 161 206 464 254 155 281 171
4. Contractor/ 12 14 12 16 39 20 70 35 66middlemen
5. Private Individual/ 864 579 805 859 647 820 815 772 809hh
6. Others 16 15 16 13 18 14 29 30 29
7. N.R. 0 0 0 0 0 0 0 0 0
8. Total 1000 1000 1000 1000 1000 1000 1000 1000 1000
Sample 6852 1309 8161 7091 1570 8661 162973 34664 197637
Estimated 1299411 337061 1636471 1707000 383000 2091000 38799000 5613000 44412000
Sector : Rural
1. Government 4 0 4 2 9 3 2 26 3Agency
2. Co-op. / Marketing 7 31 9 11 0 10 6 10 6Society
3. Private enterprise 28 140 34 135 238 143 145 229 150
4. Contractor/ 15 63 18 9 75 14 88 45 85middlemen
5. Private Individual/ 930 759 920 894 770 884 802 777 800hh
6. Others 16 6 16 12 24 13 29 33 29
7. N.R. 0 0 0 0 0 0 0 0 0
8. Total 1000 1000 1000 1000 1000 1000 1000 1000 1000
Sample 3420 268 3688 3503 411 3914 102122 12384 114506
Estimated 520503 33734 554237 711000 59000 770000 23657000 1411000 25068000
Sector : Urban
1. Government 0 1 1 0 2 1 2 5 2Agency
2. Co-op. / Marketing 2 2 2 1 3 2 4 3 4Society
3. Private enterprise 152 413 225 257 505 318 171 299 199
4. Contractor/ 10 9 10 20 33 23 43 32 40middlemen
5. Private Individual/ 820 559 747 834 624 783 836 770 821hh
6. Others 15 16 16 13 17 14 29 29 29
7. N.R. 0 0 0 0 0 0 0 0 0
8. Total 1000 1000 1000 1000 1000 1000 1000 1000 1000
Sample 3432 1041 4473 3588 1159 4747 60851 22280 83131
Estimated 778907 303327 1082234 996000 325000 1321000 15142000 4202000 19344000

SARVEKSHANA50
Table - 9 : Statement showing proportion (per 1000) of enterprise by Status of enterprise
(No.)
State Sample Central Sample All India
Status of O. A. E. ESTABLISH- Total O. A. E. ESTABLISH- Total O. A. E. ESTABLISH- TotalEnterprise MENTS MENTS MENTS
Sector : Combined
1. Expanding 142 227 159 261 331 274 189 294 202
2. Stagnent 733 653 717 591 420 560 645 504 627
3. Contracting 92 96 93 65 189 88 95 110 97
4. Not Applicable 33 24 31 82 61 78 71 91 73
5. N.R. 0 0 0 1 1 1
6. TotaL 1000 1000 1000 1000 1000 1000 1000 1000 1000
Sample 6852 1309 8161 7091 1570 8661 162973 34664 197637
Estimated 1299411 337061 1636471 1707000 383000 2091000 38799000 5613000 44412000
Sector : Rural
1. Expanding 109 103 109 252 365 261 180 287 186
2. Stagnent 767 753 766 602 438 590 667 509 658
3. Contracting 93 32 90 67 105 70 91 99 92
4. Not Applicable 30 111 35 79 92 80 61 105 63
5. N.R. 0 0 0 1 1 1
6. TotaL 1000 1000 1000 1000 1000 1000 1000 1000 1000
Sample 3420 268 3688 3503 411 3914 102122 12384 114506
Estimated 520503 33734 554237 711000 59000 770000 23657000 1411000 25068000
Sector : Urban
1. Expanding 163 241 185 267 324 281 203 296 223
2. Stagnent 711 642 691 584 416 543 610 503 587
3. Contracting 91 103 94 64 204 98 100 114 103
4. Not Applicable 35 14 29 85 56 78 87 86 87
5. N.R. 0 0 0 0 1 0
6. TotaL 1000 1000 1000 1000 1000 1000 1000 1000 1000
Sample 3432 1041 4473 3588 1159 4747 60851 22280 83131
Estimated 778907 303327 1082234 996000 325000 1321000 15142000 4202000 19344000

SARVEKSHANA 51
Table-10 : Statement showing Annual GVA per worker and working force by 2-digited NIC-code
NIC GVA per worker WORKING FORCEcode-1998
Rural Urban combine Rural Urban combine
1. NIC-15 23845 31261 27452 48383 45829 94212
2. NIC-16 12677 11889 12286 6060 5955 12014
3. NIC-17 28582 51893 45293 90529 229199 319728
4. NIC-18 17974 26567 23331 64555 106842 171397
5. NIC-19 21902 53264 52104 1305 33977 35281
6. NIC-20 14247 33010 20604 62014 31775 93789
7. NIC-21 0 69374 69374 0 2064 2064
8. NIC-22 32095 38294 38146 469 19073 19542
9. NIC-24 0 28484 28484 0 16920 16920
10.NIC-25 0 48112 48112 0 5792 5792
11.NIC-26 13299 36776 18941 25352 8020 33372
12.NIC-27 43199 34445 35005 1348 19737 21084
13.NIC-28 24072 39348 35789 15092 49695 64787
14.NIC-29 12954 44604 41739 3222 32366 35587
15.NIC-31 0 28159 28159 0 8084 8084
16.NIC-32 0 18400 18400 0 137 137
17.NIC-33 0 28917 28917 0 1477 1477
18.NIC-34 0 125270 125270 0 451 451
19.NIC-35 65160 0 65160 43 0 43
20.NIC-36 15916 22597 20678 45873 113825 159698
21.NIC-45 33152 64907 45081 14132 8503 22635
22.NIC-50 32055 43821 41192 21720 75491 97211
23.NIC-51 25046 49631 49237 11281 692323 703604
24.NIC-52 26146 39271 35273 307829 702664 1010494
25.NIC-55 21610 23742 23466 19035 127712 146747
26.NIC-60 32426 51888 44404 53132 85039 138170
27.NIC-61 0 58080 58080 0 185 185
28.NIC-63 45517 46612 46486 138 1064 1202
29.NIC-64 17312 24496 23866 2859 29734 32592
30.NIC-65 0 57223 57223 0 1777 1777
31.NIC-66 25400 56226 49705 416 1552 1968
32.NIC-67 55531 44993 46324 103 715 818
33.NIC-70 65880 64108 64128 21 1872 1894
34.NIC-71 40055 45637 44624 1095 4939 6034
35.NIC-72 0 17830 17830 0 14585 14585
36.NIC-74 45157 42453 42553 1154 29889 31042
37.NIC-80 28257 46493 45006 991 11170 12161
38.NIC-85 45560 77854 72478 11817 59165 70981
39.NIC-91 11663 33810 25439 3594 5914 9508
40.NIC-92 10032 30540 23064 3417 5956 9373
41.NIC-92 22063 25483 24198 37953 63103 101057
Average/Total 24234 41914 37607 854932 2654567 3509499

SARVEKSHANA52
Table - 11 : Proportion (per 1000) of enterprises by type of contract
(No.)
State Sample Central Sample All India
Type of O. A. E. ESTABLISH- Total O. A. E. ESTABLISH- Total O. A. E. ESTABLISH- Totalcontract MENTS MENTS MENTS
Sector : Combined
1. Working solely 695 11 42 54 62 56 82 58 79for ent/
2. Mainly on cont 199 5 13 11 35 16 11 26 13but also
3. Mainly for cust 106 1 5 4 7 4 7 14 8but also cn
4. Solely for 0 7 6 16 24 17 10 13 10customers
5. No contract 0 978 933 915 872 907 891 890 891
6. Total 1000 1000 1000 1000 1000 1000 1000 1000 1000
Sample 6852 1309 8161 7091 1570 8661 162973 34664 197637
Estimated 1299411 337061 1636471 1707000 383000 2091000 38799000 5613000 44412000
Sector : Rural
1. Working solely 663 69 168 37 74 40 95 63 93for ent/
2. Mainly on cont 151 12 35 8 50 11 10 25 11but also
3. Mainly for cust 186 4 34 4 11 5 6 17 7but also cn
4. Solely for 0 26 21 6 81 12 10 20 10customers
5. No contract 0 889 742 945 784 933 879 874 879
6. Total 1000 1000 1000 1000 1000 1000 1000 1000 1000
Sample 3420 268 3688 3503 411 3914 102122 12384 114506
Estimated 520503 33734 554237 711000 59000 770000 23657000 1411000 25068000
Sector : Urban
1. Working solely 715 5 27 67 60 65 63 56 61for ent/
2. Mainly on cont 230 4 11 14 32 18 12 26 15but also
3. Mainly for cust 55 0 2 4 6 4 7 13 9.but also cn
4. Solely for 0 5 4 23 14 21 10 11 10customers
5. No contract 0 987 956 893 888 892 909 895 906
6. Total 1000 1000 1000 1000 1000 1000 1000 1000 1000
Sample 3432 1041 4473 3588 1159 4747 60851 22280 83131
Estimated 778907 303327 1082234 996000 325000 1321000 15142000 4202000 19344000

SARVEKSHANA 53
Table - 12 : Proportion (per 1000) of enterprises by equipment supplied
(No.)
State Sample Central Sample All India
Equipment O. A. E. ESTABLISH- Total O. A. E. ESTABLISH- Total O. A. E. ESTABLISH- Totalsupplied MENTS MENTS MENTS
Sector : Combined
1. Self-Procured 483 256 428 550 791 610 722 761 727
2. Supplied by 425 649 480 301 106 215 217 168 210master unit/cn
3. Both 91 94 92 150 104 138 61 71 62
4. Total 1000 1000 1000 1000 1000 1000 1000 1000 1000
SAMPLE 6852 1309 8161 7091 1570 8661 162973 34664 197637
Estimated 1299411 337061 1636471 1707000 383000 2091000 38799000 5613000 44412000
Sector : Rural
1. Self-Procured 623 149 486 482 833 568 733 735 733
2. Supplied by 314 780 449 458 103 371 207 196 207master unit/cn
3. Both 63 71 65 60 64 61 60 65 61
4 Total 1000 1000 1000 1000 1000 1000 1000 1000 1000
SAMPLE 3420 268 3688 3503 411 3914 102122 12384 114506
Estimated 520503 33734 554237 711000 59000 770000 23657000 1411000 25068000
Sector : Urban
1. Self-Procured 395 358 387 574 776 626 702 771 719
2. Supplied by 496 526 502 243 106 208 236 156 216master unit/cn
3. Both 109 116 111 182 117 166 62 73 65
4. Total 1000 1000 1000 1000 1000 1000 1000 1000 1000
SAMPLE 3432 1041 4473 3588 1159 4747 60851 22280 83131
Estimated 778907 303327 1082234 996000 325000 1321000 15142000 4202000 19344000

SARVEKSHANA54
Table - 13 : Statement showing proportion (per 1000) of enterprise by supply of raw material
(No.)
State Sample Central Sample All India
Supply of raw O. A. E. ESTABLISH- Total O. A. E. ESTABLISH- Total O. A. E. ESTABLISH- Totalmaterials MENTS MENTS MENTS
Sector : Combined
1. Self-Procured 154 152 154 40 98 55 67 197 84
2. Supplied by 753 743 751 795 654 759 851 641 824master unit/cn
3. Both 93 105 96 165 248 186 82 162 93
4. Total 1000 1000 1000 1000 1000 1000 1000 1000 1000
SAMPLE 6852 1309 8161 7091 1570 8661 162973 34664 197637
Estimated 1299411 337061 1636471 1707000 383000 2091000 38799000 5613000 44412000
Sector : Rural
1. Self-Procured 101 160 118 23 149 54 55 149 60
2. Supplied by 834 769 815 906 601 831 872 695 861master unit/cn
3. Both 65 71 66 71 250 115 74 157 78
4. Total 1000 1000 1000 1000 1000 1000 1000 1000 1000
SAMPLE 3420 268 3688 3503 411 3914 102122 12384 114506
Estimated 520503 33734 554237 711000 59000 770000 23657000 1411000 25068000
Sector : Urban
1. Self-Procured 188 145 178 46 81 55 92 217 122
2. Supplied by 702 719 706 754 672 733 807 620 762master unit/cn
3. Both 110 136 116 200 247 212 101 164 116
4. Total 1000 1000 1000 1000 1000 1000 1000 1000 1000
SAMPLE 3432 1041 4473 3588 1159 4747 60851 22280 83131
Estimated 778907 303327 1082234 996000 325000 1321000 15142000 4202000 19344000

SARVEKSHANA 55
Table - 14 : Statement showing proportion (per 1000) of enterprises by Designed specified by contractor
(No.)
State Sample Central Sample All India
Specified by O. A. E. ESTABLISH- Total O. A. E. ESTABLISH- Total O. A. E. ESTABLISH- Totalcontactor MENTS MENTS MENTS
Sector : Combined
1. Yes 738 759 744 767 792 773 873 819 866
2. No 262 241 256 233 208 227 127 181 134
3. Total 1000 1000 1000 1000 1000 1000 1000 1000 1000
Sample 6852 1309 8161 7091 1570 8661 162973 34664 197637
Estimated 1299411 337061 1636471 1707000 383000 2091000 38799000 5613000 44412000
Sector : Rural
1. Yes 818 716 788 788 688 763 881 814 877
2. No 182 284 212 212 312 237 119 186 123
3. Total 1000 1000 1000 1000 1000 1000 1000 1000 1000
Sample 3420 268 3688 3503 411 3914 102122 12384 114506
Estimated 520503 33734 554237 711000 59000 770000 23657000 1411000 25068000
Sector : Urban
1. Yes 688 799 712 759 828 776 857 821 849
2. No 312 201 288 241 172 224 143 179 151
3. Total 1000 1000 1000 1000 1000 1000 1000 1000 1000
Sample 3432 1041 4473 3588 1159 4747 60851 22280 83131
Estimated 778907 303327 1082234 996000 325000 1321000 15142000 4202000 19344000

SARVEKSHANA56
Table - 15 : Statement showing estimated number of worker by gender, broad industry group, sector andtype
(in’000)
Broad Industiral OAE Establishment TotalActivity Male Female Total Male Female Total Male Female Total
Sector : Combined
1.Manufacturing 383 124 507 506 81 587 890 205 1095
2.Construction 14 0 15 7 1 8 22 1 23
3.Trade/Repair 943 88 1030 776 5 781 1719 93 1811
4.Hotel/Restau. 46 4 50 96 1 97 142 5 147
5.Trans./Stor. 130 4 134 35 3 38 165 7 172
6.Other Services 130 16 146 83 32 116 214 48 262
Total 1646 236 1883 1505 122 1627 3151 358 3509
Sector : Rural
1.Manufacturing 198 66 264 87 13 100 285 79 364
2. Construction 10 0 10 4 0 4 14 0 14
3. Trade/Repair 262 52 314 27 0 27 289 53 341
4. Hotel/Restau. 10 1 11 8 0 8 18 1 19
5. Trans./Stor. 48 0 49 7 0 8 56 0 56
6.Other Services 45 5 50 5 6 11 50 11 61
Total 573 125 697 138 20 158 711 144 855
Sector : Urban
1. Manufacturing 185 58 243 419 68 487 605 126 731
2. Construction 4 0 4 4 0 4 8 0 9
3. Trade/Repair 681 36 717 749 4 753 1430 40 1470
4.Hotel/Restau. 36 3 39 88 0 89 124 4 128
5.Trans./Stor. 82 4 85 28 3 30 110 6 116
6.Other Services 85 11 96 78 26 105 164 37 201
Total 1074 112 1185 1367 102 1469 2441 214 2655

SARVEKSHANA 57
Table-16 : Distribution of estimated persons by type of activity and by age group(15+) (based onschedule - 10)
Legend : Person Household Type : All Type : Principal
Usual Activity Status Age Group
15-24 25-34 35-44 45-54 55-59 60+ Total
Sector : Combine
1 Self-Emp. (11,12,21) 1447161 1627276 1443623 1092072 347687 567449 6525269
2 Reg.Sal/wages (31) 367935 493589 559803 338152 101995 23623 1885097
3 Casual Wage Lab.(41-51) 1632410 1529492 1403519 816536 212649 159536 5754142
4 Employed (11-51) 3447507 3650357 3406945 2246760 662332 750607 14164507
5 Un-Empl.seek. Work (81) 94904 25128 5288 979 1053 312 127664
6 Lab. Force (11-81) 3542411 3675484 3412233 2247739 663385 750919 14292172
7 Out of Lab.force(A)(91) 1847531 38844 4944 3361 905 12775 1908360
8 Out of Lab.f.(B)(92-99) 1846144 1736704 1438580 1061678 498436 1762119 8343661
9 Estim. Persosns 7236086 5451031 4855757 3312778 1162726 2525813 24544192
10 Sample Person 4516 3560 3166 2187 743 1684 15856
11 Un-Emp.Rate [5/6]*1000 26.79 6.84 1.55 0.44 1.59 0.42 8.93
12 LFPR Rate [6/9]*1000 489.55 674.27 702.72 678.51 570.54 297.3 582.3
Sector : Rural
1 Self-Emp. (11,12,21) 1153506 1155293 1058518 839294 274142 473776 4954529
2 Reg.Sal/wages (31) 146514 164210 171560 67895 22186 7023 579387
3 Casual Wage Lab.(41-51) 1381808 1288690 1184830 700426 183229 129261 4868243
4 Employed (11-51) 2681828 2608193 2414908 1607615 479556 610060 10402159
5 Un-Empl.seek. Work (81) 20900 4576 2977 0 1053 0 29506
6 Lab. Force (11-81) 2702728 2612769 2417884 1607615 480609 610060 10431665
7 Out of Lab.force(A)(91) 987762 22503 0 3361 0 7458 1021084
8 Out of Lab.f.(B)(92-99) 1088625 891085 696773 574124 324931 1146718 4722256
9 Estim. Persosns 4779115 3526357 3114657 2185099 805540 1764236 16175005
10 Sample Person 2039 1479 1286 934 346 775 6859
11 Un-Emp.Rate [5/6]*1000 7.73 1.75 1.23 0 2.19 0 2.83
12 LFPR Rate [6/9]*1000 565.53 740.93 776.29 735.72 596.63 345.79 644.92
Sector : Urban
1 Self-Emp. (11,12,21) 293655 471983 385105 252778 73546 93673 1570740
2 Reg.Sal/wages (31) 221421 329379 388243 270257 79810 16600 1305710
3 Casual Wage Lab.(41-51) 250602 240802 218689 116110 29421 30275 885899
4 Employed (11-51) 765679 1042164 992038 639145 182776 140547 3762348
5 Un-Empl.seek. Work (81) 74004 20552 2312 979 0 312 98159
6 Lab. Force (11-81) 839683 1062716 994349 640125 182776 140859 3860507
7 Out of Lab.force(A)(91) 859770 16340 4944 0 905 5317 887276
8 Out of Lab.f.(B)(92-99) 757519 845619 741807 487554 173505 615401 3621405
9 Estim. Persosns 2456971 1924674 1741100 1127679 357186 761577 8369187
10 Sample Person 2477 2081 1880 1253 397 909 8997
11 Un-Emp.Rate [5/6]*1000 88.13 19.34 2.32 1.53 0 2.21 25.43
12 LFPR Rate [6/9]*1000 341.76 552.15 571.1 567.65 511.71 184.96 461.28
(A) -Attended Educational Institution (B) - Others

SARVEKSHANA58
Table-17 : Distribution of estimated persons by type of activity and by age group (5+) (based onschedule - 10)
Household Type : AllLegend : Person Type : Principal
Usual Activity Status Age Group
5-14 15-24 25-34 35-44 45-54 55-59 60+ Total
Sector : Combine
1 Self-Emp. (11,12,21) 191747 1447161 1627276 1443623 1092072 347687 567449 6717015
2 Reg.Sal/wages (31) 3045 367935 493589 559803 338152 101995 23623 1888142
3 Casual Wage Lab.(41-51) 124566 1632410 1529492 1403519 816536 212649 159536 5878708
4 Employed (11-51) 319358 3447507 3650357 3406945 2246760 662332 750607 14483866
5 Un-Empl.seek. Work (81) 2018 94904 25128 5288 979 1053 312 129682
6 Lab. Force (11-81) 321377 3542411 3675484 3412233 2247739 663385 750919 14613548
7 Out of Lab.force(A)(91) 7090436 1847531 38844 4944 3361 905 12775 8998796
8 Out of Lab.f.(B)(92-99) 1837837 1846144 1736704 1438580 1061678 498436 1762119 10181498
9 Estim. Persosns 9249650 7236086 5451031 4855757 3312778 1162726 2525813 33793842
10 Sample Person 5284 4516 3560 3166 2187 743 1684 21140
11 Un-Emp.Rate [5/6]*1000 6.28 26.79 6.84 1.55 0.44 1.59 0.42 8.87
12 LFPR Rate [6/9]*1000 34.74 489.55 674.27 702.72 678.51 570.54 297.3 432.43
Sector : Rural
1 Self-Emp. (11,12,21) 178238 1153506 1155293 1058518 839294 274142 473776 5132767
2 Reg.Sal/wages (31) 0 146514 164210 171560 67895 22186 7023 579387
3 Casual Wage Lab.(41-51) 110380 1381808 1288690 1184830 700426 183229 129261 4978623
4 Employed (11-51) 288618 2681828 2608193 2414908 1607615 479556 610060 10690777
5 Un-Empl.seek. Work (81) 0 20900 4576 2977 0 1053 0 29506
6 Lab. Force (11-81) 288618 2702728 2612769 2417884 1607615 480609 610060 10720283
7 Out of Lab.force(A)(91) 4926209 987762 22503 0 3361 0 7458 5947293
8 Out of Lab.f.(B)(92-99) 1579718 1088625 891085 696773 574124 324931 1146718 6301974
9 Estim. Persosns 6794545 4779115 3526357 3114657 2185099 805540 1764236 22969549
10 Sample Person 2817 2039 1479 1286 934 346 775 9676
11 Un-Emp.Rate [5/6]*1000 0 7.73 1.75 1.23 0 2.19 0 2.75
12 LFPR Rate [6/9]*1000 42.48 565.53 740.93 776.29 735.72 596.63 345.79 466.72
Sector : Urban
1 Self-Emp. (11,12,21) 13509 293655 471983 385105 252778 73546 93673 1584248
2 Reg.Sal/wages (31) 3045 221421 329379 388243 270257 79810 16600 1308755
3 Casual Wage Lab.(41-51) 14186 250602 240802 218689 116110 29421 30275 900085
4 Employed (11-51) 30740 765679 1042164 992038 639145 182776 140547 3793089
5 Un-Empl.seek. Work (81) 2018 74004 20552 2312 979 0 312 100177
6 Lab. Force (11-81) 32759 839683 1062716 994349 640125 182776 140859 3893266
7 Out of Lab.force(A)(91) 2164227 859770 16340 4944 0 905 5317 3051503
8 Out of Lab.f.(B)(92-99) 258119 757519 845619 741807 487554 173505 615401 3879524
9 Estim. Persosns 2455105 2456971 1924674 1741100 1127679 357186 761577 10824292
10 Sample Person 2467 2477 2081 1880 1253 397 909 11464
11 Un-Emp.Rate [5/6]*1000 61.61 88.13 19.34 2.32 1.53 0 2.21 25.73
12 LFPR Rate [6/9]*1000 13.34 341.76 552.15 571.1 567.65 511.71 184.96 359.68
(A) -Attended Educational Institution (B) - Others

SARVEKSHANA 59
Unorganised Sector and its contribution in India
Pankaj K P Shreyaskar*
This study is an attempt to provide an overview of thecontribution made to income and employment genera-tion by the unorganised non-farm sector as a whole,based on the experiences not only of 57th round of NSSsurvey but also of the previous rounds. The surveys of55th, 56th,and 57th rounds provide compelling state levelevidence of the strong links between agricultural per-formance, on the one hand, and the economic conditionof workers in the unorganised non-farm sector on theother. Here the contributions of the organised andunorganised segments of the Indian economy to employ-ment and income generation are compared, and certainpivotal relationships and concerns are highlighted. Themost important link is between farm labour productivityand labour productivity in the unorganised non-farmsector in urban, as well as in rural enterprises.
1. Introduction
1.1 In the National Accounts Statistics of India the“unorganised sector” includes units whose activity is notregulated by statute or legal provision, and/or those, whichdo not maintain regular accounts. In the case of manu-facturing, this covers all manufacturing units (I) usingpower and employing less than 10 workers or not usingpower and employing less than 20 workers. There is thusan unambiguous ceiling on size. Bigger manufacturingunits belong to the organised sector, which include thoseregistered under the Factories Act of 1948, for which dataare regularly collected under the Annual Survey of In-dustries.
In the field of education, only unrecognized institutionsare covered. The primary purpose in defining the scopeof the unorganised service sector survey coverage accord-ing to the 1991-92 reports was “to catch all institutionsfor which no regular accounts were available”. The same
exclusion principles apply to the transport sector. Railand air transport and other enterprises owned or run bygovernment or quasi-government institutions are treatedas public sector enterprises, which belong to the organisedsegment. Co-operatives, however, come within the pur-view of the unorganised segment. Aside from bothmechanised and non-mechanised goods and passengertransport by land, inland waterway or sea, the surveycovered a wide range of activities under the head “ser-vices incidental to transport”.
1.2 There is however, a change in the coverage ofunorganised transport after the first, i.e., 1978-79 sur-vey. This first survey included porters and coolies undernon-mechanised transport. Later transport surveys ex-cluded them, causing a tremendous drop in the numbersof workers recorded as employed in this sector of the in-dustry, especially in rural areas. The unorganised stor-age and warehousing survey departs somewhat from theusual coverage formula. In addition to storage and ware-housing activities under private and co-operative owner-ship, without any restriction on the size of employment,they have also covered, as a special case, the communitygrain golas/dharma golas maintained by villagePanchayats.
Also included are storage and warehousing facilitiesavailable on hire to farmers, dealers, trader’s processorsand manufacturing enterprises. Within each unorganisedsector, three categories of enterprises are distinguished.Own account enterprises (OAE) are those owned andoperated without the help of any regularly employed, hiredworkers. These enterprises, run by family workers,constitute the vast majority of all unorganised sector units.(In 1994-95 for example, about 85 per-cent of unorganisedsector manufacturing enterprises were own account units).The Non-Directory Establishments (NDEs), which
* Under Secretary and Assistant Registrar, Central Information Commission, New Delhi. The views expressed here areof the author’s own and not of the Organisation to which he belongs.

SARVEKSHANA60
constitute the second category of activity, have beencovered by the NSS-CSO unorganised segment surveyswith sufficient regularity to make analysis worthwhile.Communications services were covered only in 1991-92.Largest group, defined as enterprises, employ 5 workers,or fewer (including family workers), of which at leastone is a regularly employed hired worker. DirectoryEstablishments (DEs) are those employing 6 or moreworkers, of which at least one is hired.
2. Organised and the Unorganised Segments:
Employment and income contribution
The vast majority of Indians earn their living throughwork in the unorganised segment of the economy.However, they produce, on the average, only one eighthof the income generated per worker in the organisedsegment. By the late 1990s, more than 90 per cent ofIndian workers employed in the unorganised segmentproduced roughly 60 per cent of national income (NDP),while the remaining 8 to 10 per cent generated nearly 40per cent of NDP. [2].
The employment figures for the ’90s show the followingas well. While the shares of the organised and unorganisedsectors in employment have remained remarkably stableover time, there have been changes in the relativeimportance of agriculture and non-agriculture componentswithin the unorganised segment. In brief, the structuraladjustments which have taken place generally, haveinvolved compensating movements in the share ofunorganised agriculture on the one hand, and unorganisedmanufacturing and trade, on the other. Thus in the yearsfrom the mid-seventies to the late eighties, when the shareof agriculture went down, the workforce in eitherunorganised manufacturing or unorganised trade, or both,expanded. Later, when the unorganised segment’s shareof employment in manufacturing, (and possibly some othersub sectors as well) contracted, agriculture’s share in thetotal workforce went up. The stability of the unorganisedsector’s share in employment stands in clear contrast tothe behaviour of the unorganised segment’s share in NDP,which has declined more or less continuously, largelybecause the farm sector’s relative contribution to NDPhas fallen throughout. In recent years also, it appears thatthe unorganised segment share in non-farm NDP hasstarted to fall. (See the table at the end).
3. Growth of employment in Organised andUnorganised Segments
3.1 The Report of the Task Force on EmploymentOpportunities (2001) and the Report of the Special Groupon Targeting Ten Million Employment Opportunities(2002), have both concluded that the bulk of future growthin employment would have to come from the unorganisedsector. The rationale for this position arises from the recentrecord of employment generation in the Indian economy.The unorganised non-farm sector has, in fact, been theonly segment to record respectable rates of employmentgrowth. Indian agriculture, on the other hand, has virtuallyceased to employ more labour and the average annualemployment contribution of the organised non-farm sectorhas dwindled to similar low levels. These two segmentstogether accounted for close to 70 per cent of all personsemployed in India in 1999-2000, but for only 7 ½ percentof all new jobs. It will be noticed that there is no rural-urban breakdown of organised and unorganised segmentemployment. This is because organised segment data arepublished only for rural and urban areas combined, andthe underlying broad unorganised segment employmentestimates are derived as a residual by subtraction fromNational Sample Survey estimates, which coveremployment in both organised and unorganised segmentswithout distinction. Despite this drawback, an intuitiveappreciation of developments in both rural and urban Indiamay be derived from the growth rate. It is clear that almostall the employment growth during the most recent yearstook place in the unorganised segment, and further, thisis true for not just the rural areas but for the whole country.
3.2 Interpretations made here are based on the datagenerated by the periodic NSSO-CSO unorganised sectorenterprise surveys. While interpreting these estimates,certain limitations of the unorganised enterprise surveysneed to be kept in mind. The most important one is thatthese are enterprise surveys. It is well known that theenterprise survey method does not capture either all theenterprises, or all the workers engaged in the unorganisedsegment of the non-agricultural economy. What gets leftout are mainly the smallest, and possibly, the poorest,family operated ‘own account’ enterprises and workers,particularly those that are operated from within residentialpremises and those operating without any fixed premises.There seems to be considerable agreement about how thismay be remedied. A linked household-cum-enterprisesurvey which first identifies the workers (including

SARVEKSHANA 61
independent workers) through a household survey andthen through these workers, the enterprises operated,should provide a more complete count. This still leavesout the workers who are not attached to any enterprise,such as domestic servants who work for households andalso all the enterprises and workers engaged in activitiesthat have never been covered by the enterprise surveys.Some of them are important, especially in rural areas,such as construction, mining and quarrying. The onlysignificant employment gains were made in unorganisedservices enterprises and in transport, and to a lesser extent,in restaurants and hotels.
4. The Restructuring of the UnorganisedSegment in India
4.1 In India, the recent restructuring of the unorganisednon-farm sector has been characterised by four historicallysignificant kinds of changes. The important changes are:(i) a proportionate shift of enterprises and employmentfrom rural to urban areas in a number of key sectors; (ii)a decline in the relative importance of family operatedown account enterprises and workers and a correspondingrise in the share of larger units employing one or moreregularly hired workers; (iii) an expansion in the share ofunits using chemicals and metals based inputs andmotorised equipment as compared to those usingtraditional, organic raw materials and non-motorisedequipment; and (iv) the widening of inter state labourproductivity disparities in most unorganised segmentactivities.
4.2 The rural to urban shift of most, but not all,unorganised sector activities has a strong regionaldimension, with some activities tending to shift morerapidly to urban areas than others, and one or two only,moving in the reverse direction. The sub sectors in whichemployment is concentrated in rural areas in many statesare: transport as a whole (because of the great weight ofnon-mechanised transport), communications, services, andmanufacturing based mainly on organic raw materials.Recent year rural-urban breakdowns are not availablefor some important sub sectors. But in services, forexample, it is clear that from the beginning, legal, businessand financial activities were predominantly urban located,while in the largest category of all, “other services”(covering personal services (96), repair services (97), andcommunity, recreational and cultural services (94, 95)).employment has been heavily concentrated in rural areas
in all states except Delhi. Education and health serviceswere predominantly rural based in twelve out of fifteenstates in 1978-79 - the only year for which suchbreakdowns were made available at the state level. (Theexceptional states were Delhi, Gujarat and Haryana).Similarly in the restaurants and hotels sub sector, the latestyear for which separate estimates are available is 1983-84. These data indicate that in that year althoughemployment in restaurants was predominantly oroverwhelmingly rural in several states, employment inhotels was overwhelmingly or predominantly urban in allstates.
4.3 The character of the unorganised segment is graduallychanging. In all sub sectors except trade and possiblyrural restaurants, the small family operated businesseshave been losing ground to the larger establishments,which employ one or more regularly hired workers. Thedecline in the share of own account enterprises in allenterprises, in workers and in gross value added in bothrural and urban services and transport is substantial. Thesame holds for urban own account manufacturing unitsand employment in them and for urban restaurants andhotels. But rural own account restaurants and hotels areat least holding on their own and although the share ofrural own account units in manufacturing workers andgross value added is going down, their share in the numberof enterprises has been very nearly stable. It is alsosignificant that in all sub sectors, including trade andrestaurants and hotels, own account units are lessimportant in urban areas than in rural locations. In urbanareas, in all sub sectors except trade, the largerestablishments account for the majority of workers andcontribute the most to GVA. In rural areas, however, theown account enterprises still constitute theoverwhelmingly dominant section in terms of enterprisesand workers, and generate the most GVA, except in thetransport sector.
4.4 Finally, it appears that productivity levels will, in time,be the deciding factor. In the case of rural own accountmanufacturing units, average labour productivity is solow that earnings from this source cannot constitute thesole income source of the households engaged in them. Itshould be anticipated that many more of the very lowproductivity units would close down. By way of contrast,rural own account units in trade typically earn more thanthree times as much per worker as their counterpartsengaged in manufacturing. Within unorganised services

SARVEKSHANA62
also, there are only two major groups for which averagelabour productivity levels are more or less adequate. Theseare banking, financial and legal services and educationand health services. Labour productivity in the averagerural own account unit engaged in “other services” is verylow, even lower than in rural own account manufacturing.
5. The Widening of Interstate LabourProductivity Disparities
In India’s unorganised sector, interstate inequalities inlabour productivity are gigantic and in all sectors excepttrade, these disparities have tended to increase in the longrun. In manufacturing, which employs the largest numberof people, labour productivity in Haryana is now roughlyten times of that in Orissa. In trade, which is the activitywith the smallest regional labour productivity differences,gross value added per worker in Delhi is three timescompared to in Bihar. The gaps between the top and thebottom states in the case of transport, restaurants andhotels, and services stand between these two extremes –with the top state achieving productivity levels from 4.6to 6.6 times the levels recorded in the state where labourproductivity is lowest. In three sectors – Viz., restaurantsand hotels, transport and services – the widening ofinterstate disparities has been a continuous process. Inmanufacturing, however, inequalities peaked in the mid-1980 and then fell, but to levels which still remained abovethe initial position of 1978-79. This sequence – a periodcharacterised by widening disparities, followed by someyears of convergence – occurred in unorganised trade aswell, but in this case interstate inequalities declinedsufficiently after the mid-1980, to produce a narrowingof productivity disparities over the long run. Among allunorganised sectors covered in this report, the mostshocking increases in interstate labour productivitydisparities have taken place in services sector– the thirdlargest employer in the unorganised sector. In this, as inmost other unorganised sectors, interstate variations inper capita income is the factor which best explainsinterstate differences in labour productivity, suggestingthat productivity levels in most unorganised, non-farm,activities are regionally, and possibly locally, demanddetermined.
6. Conclusion
6.1 In India, the question of how to accelerate employmentgrowth in rural non-farm sector has often been identified
as the single most important issue. But the evidencepresented here suggests that the quality of ruralemployment growth may be at least as important as itsquantity. The average labour productivity levels in India’srural non-farm sectors may be directly related to thecountry’s poverty reduction and are low compared, forexample, to China’s. Besides productivity levels, thereare other indicators of the poor quality of ruralunorganized non farm sector employment growth,including the rise in the number of part time workers andthe fall in number of full time workers specially inunorganized agro- based industries during the later 1990s.
6.2 The question thus is whether there should be a ruralto urban shift? Should we take steps to facilitate it, or isrural non-farm development to be viewed, among otherthings, as a means to prevent or contain such shifts?Finally, on the productivity issue: it was shown that thereexists a highly significant link between levels ofagricultural productivity and productivity in non-agricultural activities, which has persisted over the last20 years. The relationship holds for productivity levelsin urban unorganised sector enterprises as well as in ruralones. The best way to improve labour productivity levelsin the unorganised sector is to make rural infrastructureinvestments that are known to raise productivity levels inagriculture. Finally, given the very low productivity andpart-time character of many unorganised sector activities,especially in less well endowed regions, it may be notedthat, for many households, such activities provide astepping stone to the world outside agriculture. They arenot merely part of a survival strategy. These non-farmactivities are seen as a constructive move into otheractivities promising a more productive and more securefuture. This route away from agriculture may continue tobe chosen by many, regardless of whether or not furtherliberalisation measures are put in place, and despite thegradual shift of some important activities to urbanlocations, where they can take better advantage ofeconomies of scale and of agglomeration. Thisobservation, along with other evidences presented here,leads to another serious question: can the rural non-farmsector in India carry the burden of providing employmentto an expanding rural population? The organised non-farm sector, which is mainly located in urban areas hasto provide jobs, and so does the massive agricultural sectorwhere employment growth rates have dropped poorly.Perhaps, the unorganised non-farm sector is not in aposition to provide jobs which the rural labour force needs.

SARVEKSHANA 63
References:
[1] National Statistical Commission (2001), Reportof the National Statistical Commission Vol. I& II, New Delhi.
[2] National Sample Survey Organisation (2001),Employment & Unemployment situation inIndia: 1999-2000, NSS 55th Round (July 1999-June 2000), Report No. 458 (55/10/2).
[3] National Sample Survey Organisation (2002),Unorganised Manufactured Sector in India: 2000-
2001, NSS 56th Round, Report No. 478 (56/2.2/1,2,3,4).
[4] Planning Commission (2001A), Report of Taskforce on Employment Opportunities, Governmentof India, Planning Commission, June 2001.
[5] Planning Commission (2002), Special Group onTargeting Ten Million Employment Opportunityper Year, Government of India, PlanningCommission, May 2002.
Table 1: Share of Unorganised and Organised segments in Employment and Net domestic Product in recentyears. All India.
Segment and Sector Shares in Employment Shares in NDP1993-94 1999-2000 1997-98
Unorganised Agriculture 63.56 59.95 28.84
Unorganised Non-Agriculture 29.17 33.00 31.62
All Unorganised 92.73 92.95 60.45
Organised Agriculture 0.39 0.35 1.08
Organised Non-Agriculture 6.88 6.70 38.47
All Organised 7.27 7.05 39.55
Organised and Unorganised 100.00 100.00 100.00
Segments combined (All sectors) 374,271,353 persons 398,441,131persons Rs.1, 233,920 crores
Notes: 1. The organized Sector employment estimates are derived from the quarterly Employment Review, published by theDirectorate general of Employment and Training (DGE&T). The figures given all as at the mid points of NSSRounds.
2. Net domestic product figures are derived from the report published in “The Indian Express country paper India”,fourth meeting of the Group on Informal Sector statistics, Doc.14ILO, Geneva 28-30 Aug.2000.

SARVEKSHANA64
Table-2: Share of Own account Enterprises in all Unorganised Segment Enterprises, Workers and Grossvalue Added in Five major Sub sectors by Rural Or Urban Location: Specified reference years
Years and Enterprises Workers Gross value added Sub-sectors
Rural Urban Rural Urban Rural Urban
1. Manufacturing
1978-79 (97.6) (89.2) (84.0) (63.2) (76.5) (44.5)
1984-85 91.5 71.8 83.1 50.2 72.5 24.6
1989-90 92.2 68.7 79.7 44.1 66.8 24.0
1994-95 90.6 66.0 80.1 41.4 61.8 29.1
2. Trade
1979-80 93.3 81.6 85.7 62.0 67.9 40.3
1983-84 94.8 79.3 90.2 58.7 81.4 53.3
1988-89 95.1 81.3 91.0 63.6 80.4 34.4
1993-94 94.8 83.9 88.0 69.0 77.2 46.5
3. Restaurant and Hotels
1979-80 83.8 61.4 73.7 36.1 56.0 21.1
1983-84 79.8 55.3 67.0 30.7 49.5 19.7
1988-89 78.25 55.1 66.1 30.7 49.2 19.7
1993-94 83.6 53.7 72.8 28.1 57.1 16.2
4. Transport
1979-80 92.7 95.3 85.0 88.8 83.3 84.9
1983-84 87.8 83.7 69.1 55.3 47.0 33.5
1988-89 90.6 83.7 N.A. N.A. N.A. N.A.
Contd...

SARVEKSHANA 65
1993-94 84.7 81.7 63.2 48.7 49.5 24.6
5.Services
1979-80 96.7 81.9 94.2 67.4 89.8 56.3
1983-84 80.2 69.2 61.0 43.0 58.1 32.1
1991-92 90.0 72.2 77.3 47.4 68.3 32.5
Note: Figures in Brackets for the manufacturing sub sector in 1978-79 relate to own account and non directory- establishmentscombination.
Table-3: Interstate Coefficients of variation for Labour Productivity in Specified unorganized segmentactivities, by Rural or Urban Location: specified years
Segment / YearCoefficients of variation for GVA per worker
Rural Urban All LocationsManufacturing1978-79 41.11 29.78 46.12
1984-85 50.72 73.43 94.16
1989-90 45.34 41.03 58.35
1994-95 44.98 37.66 53.36
Trade1979-80 50.86 38.77 47.23
(1985-86) (96.44) (119.15) (144.92)
1990-91 53.22 36.57 52.84
1996-97 43.15 30.90 33.00
Restaurant and Hotels1979-80 24.63 33.14 38.65
1983-84 46.14 61.74 43.20
1988-89 62.32 49.58 45.53
1993-94 53.21 65.01 64.86
Transport1988-89 47.68 46.33 45.94
1993-97 43.41 152.39 186.32
Services1979-80 47.44 26.53 42.16
1983-84 42.6 35.85 46.56
1991-92 67.22 42.79 60.79
Notes:1. Trade figures for 1985-86 have been bracketed because of unmanageable problems with the underlying GVA data atthe state level.
2. In Transport, although all-India data is available for four points in time, state level estimates for the main magnitudes are available only for two of them: 1988-89 and 1993-94.
Contd...Table-2
Years and Enterprises Workers Gross value added Sub-sectors
Rural Urban Rural Urban Rural Urban

SARVEKSHANA66

SARVEKSHANA 67

SA
RV
EK
SH
AN
A68Table: 4. Growth rates of employment in the Organised and Unorganised Segments, by Main Economic Sub sectors All India 1983 to 1987-
88 and 1993-94 to 1999-2000
National Sample Survey (UPSS) Organised Segment Unorganised Segment
SegmentLocation Rural Only Rural + Urban Rural + Urban Rural + Urban
Years Agri- Non- All Total Agri- Non- All Total Agri- Non- Total Agri- Non- All Totalculture Agri- sectors Workers culture Agri- sectors Workers culture Agri- Workers culture Agri- Schemes workers
culture culture culture culture
1993-94 0.20 2.34 0.68 0.66 0.06 2.96 1.05 1.02 -0.82 0.59 0.50 0.07 3.15 1.09 1.06to1999-00
1987-88 2.32 1.41 2.12 2.10 2.39 2.40 2.39 2.37 0.77 1.14 1.12 2.40 2.71 2.50 2.47to1993-94
1983 0.12 5.79 1.26 1.14 0.05 4.71 1.60 1.47 0.72 1.36 1.33 0.04 5.63 1.62 1.49to1987-88
Notes:1. Usual Principal and Subsidiary Status (UPSS) Employment estimates are based on NSS ratios and population census figures interpolated for themidpoints of the NSS Rounds.
2. The Organised Sector estimates are derived from the Quarterly Employment review Published by Directorate General of Employment and Training(DGE&T). The figures given above are as at the midpoints of the NSS Rounds.

SARVEKSHANA 69
PART - II
SUMMARY AND MAJORFINDINGS OF SURVEYS

SARVEKSHANA70
An Integrated Summary of the results of the survey onUnorganised Manufacturing Sector, NSS Fifty-Sixth Round
(July 2000 – June 2001)
A. J. Roy and M. Mallick1
Introduction
1.1 Background: The importance of the unorganizedsector and the need for statistical information about ithad been realised by the Indian planners and policy makersin the 1950s. The National Sample Survey Organisation(NSSO) has been conducting periodic surveys onhousehold-based non-agricultural activities since itsinception in 1950. But, later on, the non-household unitssuch as, co-operative societies, trusts, incorporated unitsetc were included.
1.1.1 The fourth Economic Census was conducted byCentral Statistical Organisation (CSO) during 1998. Asa follow-up of this Economic Census, survey onunorganised manufacturing was conducted during 56th
round (July 2000-June 2001). In this survey, informationfrom 1998 Economic Census was used for stratificationand the list of villages and urban frame survey (UFS)blocks were used as frames for selection of first stageunits in the rural and urban sectors.
1.1.2 The scope and coverage of the Economic Censuswere to include both the Own Account Enterprise (OAE)i.e. enterprise not employing any hired worker on a fairlyregular basis and Establishment i.e. enterprise employingat least one hired worker on a fairly regular basis. Theestablishments were further divided into two categoriesas (i) Directory Establishment (DE) and (ii) Non-DirectoryEstablishment (NDE), the difference being that the formeremployed a total of six or more workers, while the latteremployed a total of five or less workers. Thus, in thefourth Economic Census, three types of enterprises wereformed, viz., (i) OAEs, (ii) NDEs and (iii) DEs. In the56th round, enterprises engaged in manufacturing andrepairing activities only were covered. Such enterpriseswere termed as Own Account Manufacturing Enterprise(OAME), Directory Manufacturing Establishment (DME)
and Non-Directory Manufacturing Establishment(NDME) respectively.
1.2 The Survey in brief: The NSSO conducted an inte-grated survey of enterprises and households in its 56th
round during July 2000 to June 2001. The main focus ofthe survey was manufacturing enterprises in theunorganised sector. Information on different characteris-tics of the enterprises, fixed assets, employment, operat-ing expenses and receipts, value added, etc. was collectedfrom the enterprises surveyed.
1.2.1 Unorganised Manufacturing Sector: The 56thround covered broadly all unorganised manufacturingenterprises under the two-digit codes 15 to 37 (TabulationCategory 'D' of NIC 1998) and enterprises under cottonginning, cleaning and baling (code 01405 of NIC 98).Details of NIC 1998 have been shown in the Table - Abelow.
More specifically, the survey covered :
(a) All manufacturing enterprises excluding thoseregistered under sections 2m(i) and 2m(ii) of theFactories Act, 1948.
(b) Enterprises engaged in cotton ginning, cleaningand baling, that are not covered under ASI.
(c) Enterprises manufacturing bidi and cigar, that arenot covered under ASI, irrespective of whetherthey are registered under the Bidi and CigarWorkers (Condition of Employment) Act, 1966or not.
The manufacturing enterprises, registered under sections2m(i) and 2m(ii) of the Factories Act, 1948, are coveredin the Annual Survey of Industries(ASI) undertaken byCSO.
1Both are Directors in SDRD, NSSO, Kolkata.

SARVEKSHANA 71
1.2.2 Coverage and sample size: The survey coveredthe whole of the Indian Union except (i) Leh and Kargildistricts of Jammu & Kashmir, (ii) villages situatedbeyond 5 kms. of bus route in the state of Nagaland and(iii) inaccessible villages of Andaman and Nicobar Islandsand (iv) some first stage units (numbering less than 0.1%of the total) where Economic Census 1998 (EC 98) couldnot be conducted. Thus, the corresponding State/UT levelestimates and the All-India results presented in this reportare based on the areas under survey coverage. A total of14788 first stage units (5696 villages and 9092 urbanblocks) were selected for this survey. The number ofsample villages and blocks allotted for survey and actuallysurveyed in different States/Uts as well as number ofenterprises surveyed by different industries and by States/UTs are given in Statements (A) to (C) in ANNEX -Iunder Section Three.
1.2.3 Sample Design: A stratified sampling design wasadopted for selection of the sample first-stage units(FSUs). The FSUs were villages (Panchayat wards inKerala) in rural areas and UFS blocks in urban areas.List of villages / urban blocks alongwith enterprise levelinformation of EC '98 was used as the sampling frameexcept in the states of Bihar and Orissa and 66 towns ofKarnataka. The Ultimate Stage Units (USUs) wereenterprises for the survey on unorganised manufacturingsector. USUs were selected by the method of circularsystematic sampling from the corresponding frame in theFSU. Large FSUs were subdivided into smaller areascalled hamlet groups (rural) / sub-blocks (urban). Threeof these hamlet groups/sub-blocks were selected. Onehaving maximum number of enterprises was selected withcertainty and two others were selected by circularsystematic sampling. The first part was called segment 1and the other two as segment 2. The USUs were selectedindependently from each of these segments. A detailednote on sample design and estimation procedure followedin the 56th round survey is given in ANNEX - I underSection Three.
1.2.4 Method of data collection: A team of two or threeinvestigators along with one supervisor was deployed forfieldwork in each FSU. The Investigators visited everyhouse / structure in the sample FSU (or selected parts incase of bigger FSUs) and listed all the households and /or enterprises in each house / structure. The list ofhouseholds and enterprises provided separate frame forselection of households and enterprises. In every FSU, a
maximum of 16 enterprises were selected for the enterprisesurvey. Interview method was used for data collectionfrom the sampled households and enterprises.
1.2.5 Sub-round: The entire survey period (1st July 2000to 30th June 2001) was divided into four sub-rounds ofthree months' duration each (Sub-round 1: July-September2000, Sub-round 2: October-December 2000, Sub-round3: January-March 2001, Sub-round 4: April-June 2001)and equal number of sample villages and blocks wereallocated to each sub-round. Each FSU was surveyedduring the sub-round period to which it was allocated.Within a particular sub-round, the fieldwork was spreadout uniformly over different months to the extent possible.
1.2.6 Schedules canvassed: A listing schedule (Schedule0.0) was used for listing households and the manufacturingand repairing enterprises mainly for preparing the framefor drawing the required number of sample householdsand enterprises for collection of detailed information ineach selected village/block. Information collected throughlisting schedule was used for calculating multipliers forestimation purpose. The enterprise schedule (Schedule2.2) was canvassed in each of the selected sampleenterprises for collecting the basic information, such asemployment, fixed assets, working capital, borrowings,input, output and value added of the sampled enterprise.
1.2.7 Reference Period: Last month has been used asthe reference period to collect most of the data. Variousreceipts and expenses as well as employment, emoluments,rent, interest and value added for the enterprises werecollected for the last month only. Last month refers to thelast 30 days (preceding the date of interview) for perennialand casual enterprises irrespective of the number of daysof operation. For seasonal enterprises also, last monthreferred to the last 30 days (preceding the date ofinterview), if they had worked continuously for the last30 days or more (including scheduled holidays) in thecurrent season. Only for seasonal enterprises, which hadworked for less than 30 days in the current season, lastmonth referred to an average month in the last workingseason. If some enterprise was unable to give informationfor the last 30 days and was able to give information forthe latest calendar month from their books, figures forthe latest calendar month were taken. For some of theitems like value of fixed assets, amount of loanoutstanding, etc., the reference period was 'as on the dateof survey'. For other items like net additions to fixed assets,

SARVEKSHANA72
number of months operated, number of other economicactivities taken up etc., the reference period was the 'last365 days preceding the date of interview'.
1.2.8 Details of results: The present report is dividedinto four sections. Section One contains introduction tothe present survey -including its background, survey inbrief such as coverage, sample design in short, method ofdata collection, reference period etc, whereas Section Twocontains highlights and brief summary of the results intabular and graphic forms. Section Three contains thesample design, estimation procedure and size of the
samples in ANNEX - I, concepts and definitions ofimportant terminologies as well as list of abbreviationsused in ANNEX - II and facsimile of the schedule 2.2 inANNEX - III whereas Section Four is provided withrelated statistical tables from the reports (Report numbers477 to 480) already published for the unorganisedmanufacturing sector, 56th round.
1.3 Activities covered:Table - A below shows the different manufacturingactivities covered in the 56th round and theirclassifications under the NIC 1998.
Table – A: Activities covered in the survey and their NIC 1998 classifications
NIC 1998 Activitycodes
01405 Cotton ginning, cleaning and baling15 Manufacture of food products and beverages16 Manufacture of tobacco products17 Manufacture of textiles
18 Manufacture of wearing apparel; dressing and dyeing of fur19 Tanning and dressing of leather; manufacture of luggage, handbags, saddler, harness and footwear20 Manufacture of wood and of products of wood and cork, except furniture; manufacture of articles of
straw and plaiting materials21 Manufacture of paper and paper products22 Publishing, printing and reproduction of recorded media23 Manufacture of coke, refined petroleum products and nuclear fuel
24 Manufacture of chemicals and chemical products25 Manufacture of rubber and plastics products26 Manufacture of other non-metallic mineral products27 Manufacture of basic metals28 Manufacture of fabricated metal products, except machinery and equipment
29 Manufacture of machinery and equipment n.e.c.30 Manufacture of office, accounting and computing machinery31 Manufacture of electrical machinery and apparatus n.e.c.32 Manufacture of radio, television and communication equipment and apparatus33 Manufacture of medical, precision and optical instruments, watches and clocks
34 Manufacture of motor vehicles, trailers and semi-trailers35 Manufacture of other transport equipment36 Manufacture of furniture; manufacturing n.e.c.37 Recycling

SARVEKSHANA 73
Summary of Findings
2.0 In this report the focus is on non-agriculturalmanufacturing enterprises in the unorganized sector -theircontribution to Indian economy, their strength andweakness. The present report is an integrated summarybased on the series of reports released on unorganisedsector manufacturing enterprises on the basis of the datacollected through Schedule 2.2 from the NSS 56th round(July, 2000- June, 2001). It contains estimates of somecharacteristics of the enterprises, such as type ofownership of enterprise, its location, maintenance ofwritten accounts, registration status, number of monthsof operation, employment, salaries and wages, fixedcapitals, loans outstanding, basic inputs, outputs and grossvalue added (GVA).
The summary of findings have been distributed in fivedifferent sub-sections as a) General characteristics ofenterprises, b) Employment, c) Assets and borrowings,d) Input, output and value added and e) Conclusion.
A. GENERAL CHARACTERISTICS OFENTERPRISES
In the following statements 1 to 7 some of the general
characteristics of the enterprises have been described.Characteristics such as number of enterprises in differentindustries as well as number of enterprises belonging todifferent States/UT’s, type of ownership of enterprises,status of registration of enterprises under any Act orauthority, number of months under operation, status ofenterprises working on contract or not etc. have beenincluded in this sub-section.
2.1 Estimated number of enterprises in differentindustries: Industry-wise the number of manufacturingenterprises in the country as estimated from this surveyby sector and enterprise type is given in the followingStatement 1. It is observed that about 86% of enterprisesbelonged to OAME followed by NDME (10%) and DME(4%). Five industries namely, manufacture of foodproducts and beverages (NIC code 15), manufacture ofwood and of products of wood and cork, except furniture;manufacture of articles of straw and plaiting materials(NIC code 20), manufacture of wearing apparel; dressingand dyeing of fur (NIC code 18), manufacture of textiles(NIC code 17) and manufacture of tobacco products (NICcode 16) contributed more than 77% in the number ofenterprises. Sector-wise 70% of enterprises were situatedin the rural area.
Statement 1: Estimated number of enterprises in different industries, by sector and type of enterprise
estimated number of enterprises (in hundred numbers)
NIC sector type of enterprise
1998 rural urban combined OAME NDME DME all
(1) (2) (3) (4) (5) (6) (7) (8)
01405 21 43 64 54 9 1 64
15 23607 6506 30113 25567 3484 1062 30113
16 16482 4557 21039 20674 155 210 21039
17 16894 7237 24131 20741 2049 1341 24131
18 16712 11384 28096 24166 3397 534 28096
19 915 845 1759 1403 244 113 1759
20 24664 3454 28118 26683 1190 245 28118
21 262 628 890 688 118 83 890
Contd...

SARVEKSHANA74
22 224 1216 1440 575 681 184 1440
23 51 18 69 28 34 7 69
24 1073 1129 2202 1863 121 219 2202
25 344 610 953 496 277 181 953
26 6868 1333 8201 6865 586 749 8201
27 143 246 389 199 137 54 389
28 3707 2718 6425 4406 1619 399 6425
29 813 851 1664 991 467 205 1664
30 - 2 2 - 1 1 2
31 223 432 655 312 173 169 655
32 10 58 68 16 22 30 68
33 15 71 87 41 31 15 87
34 36 187 223 50 94 78 223
35 50 112 162 63 60 39 162
36 6166 7171 13337 10652 2150 536 13337
37 66 89 154 122 18 14 154
all 119346 50895 170241 146654 17117 6470 170241
2.1.1 The following Chart 1 shows the distribution of different types of enterprises (i.e. OAME, NDME andDME) in rural urban and combined sectors.
estimated number of enterprises (in hundred numbers)
NIC sector type of enterprise
1998 rural urban combined OAME NDME DME all
(1) (2) (3) (4) (5) (6) (7) (8)
Chart 1: Proportion of enterprises by enterprise type

SARVEKSHANA 75
2.1.2 Whereas the following Chart 2 shows the estimated number of enterprises (OAME, NDME and DME) indifferent activities (NIC '98).
2.2 Estimated number of enterprises in differentStates/UT’s :
The number of enterprises in each state/UT as estimatedfrom this survey by sector and enterprise type has beenshown in the following statement 2. West Bengal tops
the list having more than 27 lakhs estimated number ofenterprises followed by Uttar Pradesh, Andhra Pradesh,Tamil Nadu, Maharashtra and Karnataka having 23, 16,15, 12 and 10 lakhs of enterprises respectively.
Chart 2: Estimated number of enterprises by NIC ’98 code (top 15)

SARVEKSHANA76
Statement 2: Estimated number of enterprises in different States/UTs by sector and type ofenterprise
number of enterprises (in hundred)
State/UT sector type of enterprise
rural urban combined OAME NDME DME all
(1) (2) (3) (4) (5) (6) (7) (8)
Andhra Pr. 12029 4035 16064 14367 1264 434 16064Arunachal Pr. 2 2 4 2 2 0 4Assam 2404 380 2784 2474 282 28 2784Bihar 6835 1251 8086 7630 396 60 8086Goa 184 65 249 190 48 11 249
Gujarat 2461 2962 5423 4027 890 506 5423Haryana 1007 926 1933 1475 369 89 1933Himachal Pr. 907 75 981 875 85 22 981Jammu & Kashmir 1395 686 2081 1906 145 31 2081Karnataka 6864 3479 10343 8951 890 502 10343
Kerala 4208 883 5091 3858 987 246 5091Madhya Pr. 5289 2124 7413 6852 416 145 7413Maharashtra 6681 5708 12389 9728 1705 955 12389Manipur 348 191 539 513 20 6 539Meghalaya 262 19 280 243 32 6 280
Mizoram 35 28 63 52 10 1 63Nagaland 33 24 57 48 9 1 57Orissa 9196 639 9834 9493 273 69 9834Punjab 1866 1540 3406 2567 641 198 3406Rajasthan 3912 2323 6236 5635 463 138 6236
Sikkim 12 4 16 12 4 0 16Tamil Nadu 8459 6822 15281 12394 2063 824 15281Tripura 310 45 355 313 39 3 355Uttar Pradesh 16313 6588 22901 19747 2301 853 22901West Bengal 21237 6474 27710 24851 2136 723 27710
A & N Islands 20 8 28 19 7 2 28Chandigarh 7 53 60 29 18 13 60D & N Haveli 11 2 13 9 3 1 13Daman & Diu 7 3 10 6 2 2 10Delhi 104 2200 2304 681 1116 507 2304
Lakshadweep 0 1 2 1 0 0 2Pondicherry 28 100 128 77 41 10 128Jharkhand 4047 449 4496 4274 195 28 4496Chhattisgarh 1877 579 2456 2280 138 38 2456Uttaranchal 995 229 1224 1077 128 19 1224all-India 119346 50895 170241 146654 17117 6470 170241

SARVEKSHANA 77
2.2.1 The following Chart 3 shows the figurescorresponding to estimated number of enterprises for toptwenty states.2.3 Shares of estimated number of enterprises indifferent states/UT’s : Statement 3 gives the share ofenterprises in States/UTs in estimated total number ofenterprises for each sector and enterprise type. Majorstates with higher shares (8% or more) of OAME unitsare West Bengal followed by Uttar Pradesh, AndhraPradesh and Tamil Nadu. Shares of these four statesaccount for almost half of the total OAMEs at all-India
level. In the case of NDME, similar share is observed inUttar Pradesh, West Bengal, Tamil Nadu andMaharashtra. These states also have relatively highershare (11 % or more) of DME units as compared to totalof all states/UT’s The number of enterprises is more inrural areas in Andhra Pradesh, Uttar Pradesh and WestBengal as compared to their urban areas. The reverseholds good for Maharashtra and Tamil Nadu. Out of the35 States/UTs, the bottom 16 States/UTs togethercontribute less than 6% of the total number of unorganisedmanufacturing enterprises.
Chart 3: Estimated number of enterprises by state (top twenty)

SARVEKSHANA78
Statement 3: Percentage shares of enterprises in different States/UTs by sector and type ofenterprise
number of enterprises
State/UT sector type of enterprise
rural urban combined OAME NDME DME all
(1) (2) (3) (4) (5) (6) (7) (8)
Andhra Pr. 10.1 7.9 9.4 9.8 7.4 6.7 9.4Arunachal Pr. 0.0 0.0 0.0 0.0 0.0 0.0 0.0Assam 2.0 0.7 1.6 1.7 1.6 0.4 1.6Bihar 5.7 2.5 4.7 5.2 2.3 0.9 4.7Goa 0.2 0.1 0.1 0.1 0.3 0.2 0.1
Gujarat 2.1 5.8 3.2 2.7 5.2 7.8 3.2Haryana 0.8 1.8 1.1 1.0 2.2 1.4 1.1Himachal Pr. 0.8 0.1 0.6 0.6 0.5 0.3 0.6Jammu & Kashmir 1.2 1.3 1.2 1.3 0.8 0.5 1.2Karnataka 5.8 6.8 6.1 6.1 5.2 7.8 6.1
Kerala 3.5 1.7 3.0 2.6 5.8 3.8 3.0Madhya Pr. 4.4 4.2 4.4 4.7 2.4 2.2 4.4Maharashtra 5.6 11.2 7.3 6.6 10.0 14.8 7.3Manipur 0.3 0.4 0.3 0.3 0.1 0.1 0.3Meghalaya 0.2 0.0 0.2 0.2 0.2 0.1 0.2
Mizoram 0.0 0.1 0.0 0.0 0.1 0.0 0.0Nagaland 0.0 0.0 0.0 0.0 0.0 0.0 0.0Orissa 7.7 1.3 5.8 6.5 1.6 1.1 5.8Punjab 1.6 3.0 2.0 1.8 3.7 3.1 2.0Rajasthan 3.3 4.6 3.7 3.8 2.7 2.1 3.7
Sikkim 0.0 0.0 0.0 0.0 0.0 0.0 0.0Tamil Nadu 7.1 13.4 9.0 8.5 12.1 12.7 9.0Tripura 0.3 0.1 0.2 0.2 0.2 0.0 0.2Uttar Pr. 13.7 12.9 13.5 13.5 13.4 13.2 13.5West Bengal 17.8 12.7 16.3 16.9 12.5 11.2 16.3
A & N Islands 0.0 0.0 0.0 0.0 0.0 0.0 0.0Chandigarh 0.0 0.1 0.0 0.0 0.1 0.2 0.0D & N Haveli 0.0 0.0 0.0 0.0 0.0 0.0 0.0Daman & Diu 0.0 0.0 0.0 0.0 0.0 0.0 0.0Delhi 0.1 4.3 1.4 0.5 6.5 7.8 1.4
Lakshadweep 0.0 0.0 0.0 0.0 0.0 0.0 0.0Pondicherry 0.0 0.2 0.1 0.1 0.2 0.2 0.1Jharkhand 3.4 0.9 2.6 2.9 1.1 0.4 2.6Chhattisgarh 1.6 1.1 1.4 1.6 0.8 0.6 1.4Uttaranchal 0.8 0.4 0.7 0.7 0.7 0.3 0.7
all-India 100.0 100.0 100.0 100.0 100.0 100.0 100.0
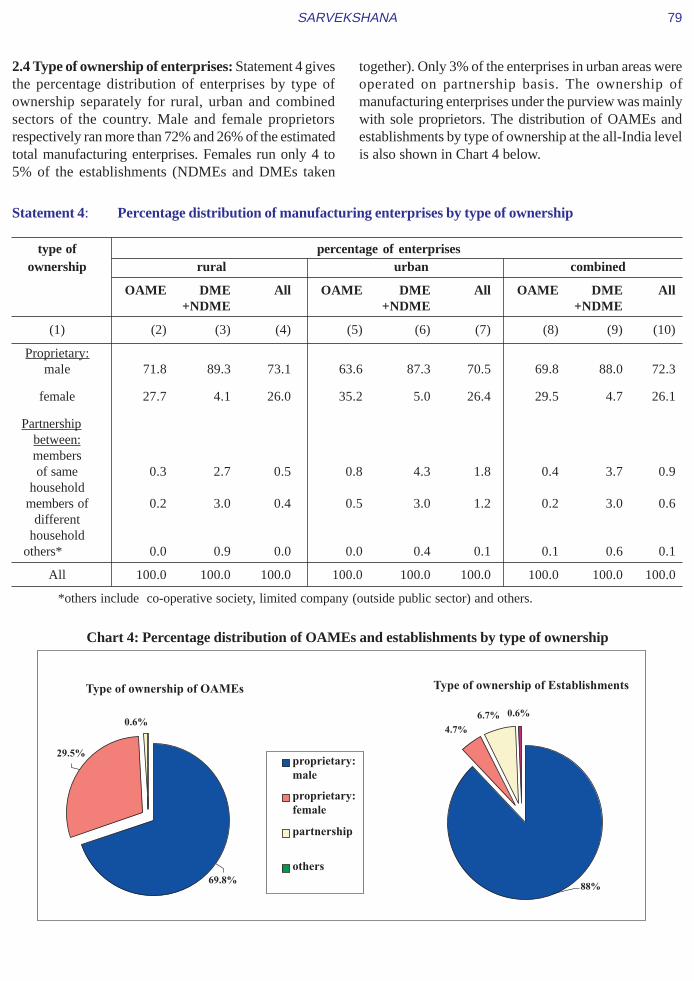
SARVEKSHANA 79
2.4 Type of ownership of enterprises: Statement 4 givesthe percentage distribution of enterprises by type ofownership separately for rural, urban and combinedsectors of the country. Male and female proprietorsrespectively ran more than 72% and 26% of the estimatedtotal manufacturing enterprises. Females run only 4 to5% of the establishments (NDMEs and DMEs taken
together). Only 3% of the enterprises in urban areas wereoperated on partnership basis. The ownership ofmanufacturing enterprises under the purview was mainlywith sole proprietors. The distribution of OAMEs andestablishments by type of ownership at the all-India levelis also shown in Chart 4 below.
Statement 4: Percentage distribution of manufacturing enterprises by type of ownership
type of percentage of enterprisesownership rural urban combined
OAME DME All OAME DME All OAME DME All+NDME +NDME +NDME
(1) (2) (3) (4) (5) (6) (7) (8) (9) (10)
Proprietary:male 71.8 89.3 73.1 63.6 87.3 70.5 69.8 88.0 72.3
female 27.7 4.1 26.0 35.2 5.0 26.4 29.5 4.7 26.1
Partnershipbetween:membersof same 0.3 2.7 0.5 0.8 4.3 1.8 0.4 3.7 0.9
householdmembers of 0.2 3.0 0.4 0.5 3.0 1.2 0.2 3.0 0.6
differenthousehold
others* 0.0 0.9 0.0 0.0 0.4 0.1 0.1 0.6 0.1
All 100.0 100.0 100.0 100.0 100.0 100.0 100.0 100.0 100.0
*others include co-operative society, limited company (outside public sector) and others.
Chart 4: Percentage distribution of OAMEs and establishments by type of ownership

SARVEKSHANA80
2.5 Status of registration: Statement 5 gives the distri-bution of enterprises by status of registration. About 10%of the total enterprises were reported to be registered withsome agency. The percentage of OAME registered was5% whereas the same figure was 45% in the case of es-tablishments (NDME + DME). The overall proportion
of registered enterprises was much higher in urban areasas compared to the rural areas. Among the registered en-terprises, it can be seen from the Statement 5 that a ma-jority had registered with local bodies (75%) followed byState Directorates of industries/District industry centre(19%).
Statement 5: Distribution of manufacturing enterprises by status of registration under/with any Act/Authority
status of percentage of enterprisesregistra-tion rural urban combined
OAME NDME DME All OAME NDME DME All OAME NDME DME All
(1) (2) (3) (4) (5) (6) (7) (8) (9) (10) (11) (12) (13)
registered 3.3 27.0 46.1 5.5 10.0 39.8 58.4 20.1 5.0 35.1 54.0 9.936.9* 49.1* 44.5*
not 96.7 73.0 53.1 94.5 90.0 60.2 41.6 79.9 95.0 64.9 46.0 90.1
registered
All 100 100 100 100 100 100 100 100 100 100 100 100
* percentage of establishments (i.e. NDME + DME)
2.5.1 The following Chart 5 shows the percentage of enterprises registered under any Act or with any authority for thetop twenty states.
Chart 5: Percentage of manufacturing enterprises registered under/ with anyAct/Authority for the major States

SARVEKSHANA 81
2.6 Number of months operated: Statement 6 gives thedistribution of enterprises by number of months ofoperation during the last 365 days. About 82% of theenterprises had worked for 9 months or more during thelast 365 days, while about 5% of the enterprises hadoperated for less than or equal to a quarter of the last
reported year. Enterprises in the urban areas had operatedfor a relatively longer duration than those in the ruralareas. In urban areas, the duration of operation was almostthe same for all the three types of enterprises. In ruralareas, however, DME units had operated for shorter periodas compared to the other types of enterprises.
Statement 6: Percentage distribution of manufacturing enterprises by number of months of operation duringthe last 365 days, separately by sector and type of enterprise
no. of percentage of enterprisesmonths ofoperation rural urban combined
OAME NDME DME All OAME NDME DME All OAME NDME DME All
(1) (2) (3) (4) (5) (6) (7) (8) (9) (10) (11) (12) (13)
0 - 3 4.7 7.4 22.9 5.3 2.8 3.9 2.8 3.0 4.3 5.2 10.5 4.64 - 6 6.3 7.9 19.1 6.6 4.2 4.8 5.7 4.5 5.8 6.0 10.8 6.07 - 9 9.3 5.3 6.6 9.1 4.7 3.5 4.4 4.4 8.2 4.2 5.3 7.79 - 12 79.6 79.3 51.5 79.0 88.3 87.8 87.0 88.1 81.8 84.7 73.4 81.8
All 100 100 100 100 100 100 100 100 100 100 100 100
2.7 Working on contract : Statement 7 gives thedistribution of enterprises by status of working on contractand type of contract undertaken by them. About 31% ofthe total manufacturing enterprises have been estimatedto be undertaking at least some work on contract basis.The proportion of enterprises working on contract was
appreciably higher in urban areas as compared to the ruralareas, but the difference between the OAMEs andestablishments was rather small. The following Chart 6depicts the proportion of enterprises working on contractin different major States.
Statement 7: Percentage distribution of manufacturing enterprises by status of working on contract,separately by sector and type of enterprise
Status percentage of enterprises
rural urban combined
OAME establish- All OAME establish- All OAME establish- Allment ment ment
(1) (2) (3) (4) (5) (6) (7) (8) (9) (10)
working oncontract 28.0 21.7 17.6 38.8 35.9 37.9 30.7 30.5 30.7
not workingon contract 72.0 78.3 72.4 61.2 64.1 62.1 69.3 69.5 69.3
All 100 100 100 100 100 100 100 100 100

SARVEKSHANA82
B. EMPLOYMENT AND EMOLUMENTS
The following statements 8 to 14 describe about theemployment situations of the enterprises.
2.8 Estimated number of workers in differentindustries: Statement 8 reports the estimated number ofworkers industry-wise by sector and type of enterprises.
At the all India level, the number of workers was estimatedas 370.81 lakhs. Of these, 239.86 lakhs (i.e., 64.68 %) ofworkers were in enterprises located in rural areas and130.95 lakhs in the urban areas. The share of workersengaged in different enterprises are 67.59% in OAME,15.00% in NDME and 17.41% in DME respectively.
Chart 6: Percentage of manufacturing enterprises working on contract for major States

SARVEKSHANA 83
Statement 8: Estimated number of workers in different industries by sector and Type of enterprises
estimated number of workers (in hundred)
NIC sector type of enterprise
1998 rural urban combined OAME NDME DME all
(1) (2) (3) (4) (5) (6) (7) (8)
01405 48 84 132 77 25 30 132
15 51711 16709 68420 48680 10567 9173 68420
16 27417 6671 34088 31100 574 2414 34088
17 38729 23084 61813 41270 7520 13023 61813
18 23053 22677 45730 30876 10023 4831 45730
19 1338 2653 3991 2162 831 998 3991
20 44788 7429 52217 46607 3780 1830 52217
21 610 1908 2519 1359 430 730 2519
22 573 4228 4801 1030 2274 1497 4801
23 154 66 220 50 120 50 220
24 3040 2639 5679 2775 432 2471 5679
25 917 2417 3334 784 1016 1534 3334
26 25639 4864 30503 16129 2041 12332 30503
27 404 918 1322 307 476 539 1322
28 6757 9101 15858 7429 5353 3076 15858
29 1546 3374 4920 1673 1642 1606 4920
30 - 10 10 - 6 4 10
31 508 2032 2540 480 620 1441 2540
32 32 380 412 30 85 298 412
33 56 261 317 87 107 124 317
34 109 963 1072 90 349 633 1072
35 134 505 639 108 215 317 639
36 12180 17723 29903 17304 7064 5535 29903
37 114 254 369 207 67 95 369
all 239857 130951 370808 250612 55616 64579 370808
Combining both rural and urban sectors, the estimatednumber of workers was found to be highest in the categoryof ‘manufacture of food products and beverages (NICcode 15)’. This was followed by ‘manufacture of textiles(NIC code 17)’, ‘manufacture of wood and manufactureof products of wood and cork, except furniture andmanufacture of articles of straw and plaitingmaterials(NIC code 20)’, ‘manufacture of wearing appareland dressing and dyeing of fur(NIC code 18)’ and
‘manufacture of tobacco products(NIC code 16)’ havingshares as 18.45, 16.67, 14.08, 12.33 and 9.19 percentagerespectively. These five industries together accounted for70.73% of the total number of workers.
2.9 Estimated number of workers in different states/UT’s : The following Statement 9 shows estimatednumber of workers in different states/UT’s by sector andtype of enterprises.

SARVEKSHANA84
Statement 9: Estimated number of workers in different States/UTs by sector and type of enterprise
number of workers
State/UT sector type of enterprise
rural urban combined OAME NDME DME all
(1) (2) (3) (4) (5) (6) (7) (8)
Andhra Pr. 23846 9146 32992 24975 4024 3994 32992Arunachal Pr. 5 6 12 3 6 2 12Assam 4104 884 4988 3925 811 252 4988Bihar 12356 2637 14993 13073 1264 656 14993Goa 433 170 603 356 156 91 603
Gujarat 5627 9254 14881 6464 3133 5283 14881Haryana 1782 2422 4204 2184 1095 924 4204Himachal Pr. 1374 175 1548 1096 247 206 1548Jammu & Kashmir 3050 1676 4726 3967 423 336 4726Karnataka 12743 7576 20318 12858 2898 4562 20318
Kerala 8483 2226 10709 5125 3138 2447 10709Madhya Pr 9739 4707 14446 11660 1369 1418 14446Maharashtra 12411 17312 29723 15228 5728 8768 29723Manipur 476 313 789 669 70 49 789Meghalaya 498 54 552 395 103 54 552
Mizoram 54 64 118 74 32 12 118Nagaland 52 48 101 68 25 7 101Orissa 20618 1374 21993 20600 779 614 21993Punjab 3327 4120 7447 3534 1984 1929 7447Rajasthan 6539 4925 11464 8745 1498 1220 11464
Sikkim 18 12 30 14 12 4 30Tamil Nadu 16715 17719 34435 19174 7013 8248 34435Tripura 621 105 726 584 113 29 726Uttar Pradesh 36826 17210 54036 35957 7280 10799 54036West Bengal 44161 14521 58681 44628 6856 7198 58681
A & N Islands 44 27 71 31 23 17 71Chandigarh 15 214 229 40 55 134 229D & N Haveli 23 4 28 13 8 7 28Daman & Diu 29 7 36 8 9 20 36Delhi 241 8977 9218 1019 3948 4251 9218
Lakshadweep 0 3 3 1 1 1 3Pondicherry 102 304 407 121 175 110 407Jharkhand 8307 877 9185 8332 527 326 9185Chhattisgarh 3568 1353 4921 4081 442 399 4921Uttaranchal 1667 529 2196 1611 373 212 2196all-India 239857 130951 370808 250612 55616 64579 370808

SARVEKSHANA 85
2.9.1 The following Chart 7 shows the estimated numberof workers in major eighteen states for the three types ofenterprises (viz OAME, NDME and DME):
2.10 Percentage distribution of the estimated numberof workers in different industries : The percentagedistribution of workers by type of enterprise and sectorin each of the industries is given in Statement 10. It isseen that the proportion of workers in the OAMEs is thehighest in manufacture of tobacco products(NIC code 16)(91%) followed by manufacture of wood and of productsof wood and cork, except furniture; manufacture of articlesof straw and plaiting materials(NIC code 20) (89%) andmanufacture of food products and beverages(NIC code15) (71%). There were higher proportions of workersamong the establishments engaged in manufacture ofoffice, accounting and computing machineries(NIC code30), manufacture of radio, television and communicationequipment and apparatus (NIC code 32), manufactureof motor vehicles, trailers and semi-trailers (NIC code34), manufacture of other transport equipment (NIC code35) and manufacture of electrical machinery andapparatus not elsewhere classified (NIC code 31).
Statement 10: Estimated number of workers in different States/UTs by sector and type of enterprise
percentage of workers
NIC sector type of enterprise
1998 rural urban combined OAME NDME DME all
(1) (2) (3) (4) (5) (6) (7) (8)
01405 36.4 63.6 100.0 58.3 18.9 22.8 100.0
15 75.6 24.4 100.0 71.1 15.4 13.4 100.0
16 80.4 19.6 100.0 91.2 1.7 7.1 100.0
17 62.9 37.1 100.0 66.8 12.2 21.1 100.0
18 50.4 49.6 100.0 67.5 21.9 10.6 100.0
19 33.5 66.5 100.0 54.2 20.8 25.0 100.0
20 85.8 14.2 100.0 89.3 7.2 3.5 100.0
21 24.2 75.8 100.0 53.9 17.1 29.0 100.0
22 11.9 88.1 100.0 21.5 47.4 31.2 100.0
23 70.0 30.0 100.0 22.8 54.6 22.6 100.0
24 53.5 46.5 100.0 48.9 7.6 43.5 100.0
25 27.5 72.5 100.0 23.5 30.5 46.0 100.0
Contd...
Chart 7: Estimated number of workers for major States(All sectors combined)

SARVEKSHANA86
percentage of workers
NIC sector type of enterprise
1998 rural urban combined OAME NDME DME all
(1) (2) (3) (4) (5) (6) (7) (8)
26 84.1 15.9 100.0 52.9 6.7 40.4 100.0
27 30.5 69.5 100.0 23.2 36.0 40.8 100.0
28 42.6 57.4 100.0 46.8 33.8 19.4 100.0
29 31.4 68.6 100.0 34.0 33.4 32.6 100.0
30 0.0 100.0 100.0 0.0 60.8 39.2 100.0
31 20.0 80.0 100.0 18.9 24.4 56.7 100.0
32 7.8 92.2 100.0 7.3 20.5 72.2 100.0
33 17.7 82.3 100.0 27.3 33.7 39.0 100.0
34 10.2 89.8 100.0 8.4 32.5 59.0 100.0
35 21.0 79.0 100.0 16.9 33.6 49.5 100.0
36 40.7 59.3 100.0 57.9 23.6 18.5 100.0
37 30.9 69.1 100.0 56.1 18.3 25.7 100.0
all 64.7 35.3 100.0 67.6 15.0 17.4 100.0
2.11 Distribution of workers by gender in differentindustries : Statement 11 gives the distribution of workersby gender in different industries separately for the rural,urban and combined sectors. At all India level, nearly34% of workers were female with corresponding figuresof 39% in rural areas and 25% in urban areas. Thecategory of manufacture of tobacco products(NIC code
16) had the highest proportion of female workers followedby manufacture of chemicals and chemical products(NICcode 24). More than 50% of workers engaged in boththese activities were female. In rural areas, more than50% of workers engaged in manufacture of paper andpaper products (NIC code 21) were also female.
Statement 10 Contd...

SARVEKSHANA 87
Statement 11: Distribution of workers by gender in different industries
NIC percentage distribution of workers by gender
code rural urban combined
male female all male female all male female all
(1) (2) (3) (4) (5) (6) (7) (8) (9) (10)
01405 55.44 44.56 100 70.97 29.03 100 65.35 34.65 100
15 71.00 29.00 100 77.94 22.06 100 72.69 27.31 100
16 32.70 67.30 100 22.52 77.48 100 30.71 69.29 100
17 50.52 49.48 100 67.27 32.73 100 56.77 43.23 10018 64.76 35.24 100 73.14 26.86 100 68.92 31.08 100
19 91.16 8.84 100 88.82 11.18 100 89.61 10.39 100
20 62.82 37.18 100 85.15 14.85 100 66.00 34.00 100
21 46.88 53.12 100 65.75 34.25 100 61.18 38.82 100
22 85.23 14.77 100 91.73 8.27 100 90.95 9.05 100
23 88.06 11.94 100 92.49 7.51 100 89.38 10.62 100
24 54.36 45.64 100 39.36 60.64 100 47.39 52.61 100
25 68.28 31.72 100 82.63 17.37 100 78.69 21.31 100
26 65.29 34.71 100 68.32 31.68 100 65.78 34.22 100
27 94.66 5.34 100 97.05 2.95 100 96.32 3.68 100
28 87.11 12.89 100 95.92 4.08 100 92.17 7.83 100
29 93.20 6.80 100 96.14 3.86 100 95.21 4.79 100
30 - - - 86.21 13.79 100 86.21 13.79 100
31 79.66 20.34 100 84.25 15.75 100 83.33 16.67 100
32 61.55 38.45 100 85.96 14.04 100 84.05 15.95 100
33 99.65 0.35 100 91.48 8.52 100 92.91 7.09 100
34 98.12 1.88 100 97.31 2.69 100 97.39 2.61 100
35 91.65 8.35 100 98.57 1.43 100 97.11 2.89 100
36 74.44 25.56 100 84.71 15.29 100 80.53 19.47 100
37 81.16 18.84 100 87.98 12.02 100 85.86 14.14 100
All 61.31 38.69 100 75.42 24.58 100 66.29 33.71 100
2.12 Distribution of workers by gender in differentstates/UT’s : Statement 12 gives distribution of workersby gender in different State / UT separately for rural,
urban and combined sectors. Manipur had the highestproportion of female workers (74%) followed by Kerala,Tamil Nadu, Orissa, Karnataka and Andhra Pradesh.

SARVEKSHANA88
Statement 12: Distribution of workers by gender in different States/ UTs
State/ percentage distribution of workers by gender
UT rural urban combined
male female all male female all male female all
(1) (2) (3) (4) (5) (6) (7) (8) (9) (10)
Andhra Pr. 55.41 44.59 100 66.49 33.51 100 58.48 41.52 100
Arunachal Pr. 72.19 27.81 100 90.03 9.97 100 82.00 18.00 100
Assam 69.75 30.25 100 81.66 18.34 100 71.86 28.14 100
Bihar 76.13 23.87 100 80.57 19.43 100 76.91 23.09 100
Goa 61.37 38.63 100 74.00 26.00 100 64.93 35.07 100
Gujarat 77.97 22.03 100 88.54 11.46 100 84.54 15.46 100
Haryana 85.43 14.57 100 89.18 10.82 100 87.59 12.41 100
Himachal Pr. 76.54 23.46 100 90.31 9.69 100 78.09 21.91 100
J. & Kashmir 70.61 29.39 100 71.25 28.75 100 70.83 29.17 100
Karnataka 50.26 49.74 100 66.25 33.75 100 56.23 43.77 100
Kerala 48.25 51.75 100 62.45 37.55 100 51.20 48.80 100
Madhya Pr. 66.57 33.43 100 69.92 30.08 100 67.66 32.34 100
Maharashtra 71.96 28.04 100 80.54 19.46 100 76.96 23.04 100
Manipur 20.70 79.30 100 33.49 66.51 100 25.77 74.23 100
Meghalaya 66.11 33.89 100 83.95 16.05 100 67.87 32.13 100
Mizoram 82.43 17.57 100 69.12 30.88 100 75.17 24.83 100
Nagaland 65.28 34.72 100 64.42 35.58 100 64.87 35.13 100
Orissa 55.06 44.94 100 71.79 28.21 100 56.10 43.90 100
Punjab 60.42 39.58 100 89.30 10.70 100 76.40 23.60 100
Rajasthan 69.13 30.87 100 72.69 27.31 100 70.66 29.34 100
Sikkim 94.06 5.94 100 96.74 3.26 100 95.12 4.88 100
Tamil Nadu 46.64 53.36 100 64.73 35.27 100 55.95 44.05 100
Tripura 57.76 42.24 100 85.33 14.67 100 61.74 38.26 100
Uttar Pr. 71.24 28.76 100 76.69 23.31 100 72.97 27.03 100
West Bengal 55.06 44.94 100 69.53 30.47 100 58.65 41.35 100
A & N Islands 94.64 5.36 100 82.42 17.58 100 89.96 10.04 100
Chandigarh 87.59 12.41 100 89.41 10.59 100 89.29 10.71 100
D & N Haveli 89.80 10.20 100 90.45 9.55 100 89.88 10.12 100
Daman & Diu 95.07 4.93 100 69.57 30.43 100 90.24 9.76 100
Delhi 94.29 5.71 100 95.88 4.12 100 95.83 4.17 100
Lakshadweep 60.00 40.00 100 76.37 23.63 100 75.63 24.38 100
Pondicherry 66.81 33.19 100 66.34 33.66 100 66.46 33.54 100
Jharkhand 61.67 38.33 100 82.54 17.46 100 63.66 36.34 100
Chhatisgarh 66.50 33.50 100 61.09 38.91 100 65.01 34.99 100
Uttaranchal 76.42 23.58 100 81.07 18.93 100 77.54 22.46 100
all India 61.31 38.69 100 75.42 24.58 100 66.29 33.71 100

SARVEKSHANA 89
2.13 Estimated annual emoluments per hired worker(in rupees): Statement 13 gives the estimated annualemoluments per hired worker in the NDME and DMEs,separately for rural and urban areas by type of activity.The estimated average emolument for rural enterpriseswas about 59% of that for enterprises in the urban area.Considering both the rural and urban areas, theemoluments per worker was the lowest in the category ofmanufacture of tobacco products (NIC code 16). Cottonginning, cleaning and bailing (NIC code 01405) andmanufacture of food products and beverages (NIC code15) were in next higher order. Considering all the
enterprises, the highest emolument was drawn in theactivity of manufacture of medical, precision and opticalinstruments, watches and clocks (NIC code 33) followedby manufacture of office, accounting and computingmachinery (NIC code 30) and manufacture of machineryand equipment n.e.c. (NIC code 29). However, in ruralareas, manufacture of other transport equipment (NICcode 35), manufacture of basic metals (NIC code 27)and manufacture of medical, precision and opticalinstruments, watches and clocks (NIC code 33) came outas the best three activities in the order, with regard toannual emoluments per hired worker.
Statement 13: Estimated annual emoluments per hired worker in different industries
NIC’98 estimated annual emoluments per hired worker (in Rs.'00)
code rural urban combined
NDME DME NDME NDME DME NDME NDME DME NDME+DME +DME +DME
(1) (2) (3) (4) (5) (6) (7) (8) (9) (10)
01405 107 47 55 114 121 117 112 80 9015 110 78 91 172 201 185 140 123 13116 117 51 60 124 137 133 118 56 6617 120 161 148 211 234 228 177 210 20018 97 108 99 176 236 204 152 226 182
19 162 179 170 188 213 204 185 211 20120 156 178 163 211 228 219 187 212 19621 124 229 213 222 218 219 218 219 21922 154 149 153 200 261 229 195 257 22323 142 132 139 149 180 157 144 146 145
24 140 91 93 171 260 241 162 147 14825 232 194 205 231 260 249 231 244 24026 199 145 149 161 179 174 183 150 15327 107 286 253 209 281 248 195 283 24928 169 210 180 202 250 224 195 246 216
29 154 327 242 247 322 288 238 323 28430 - - - 220 382 298 220 382 29831 118 183 161 180 318 286 171 304 27232 153 136 140 228 258 253 224 252 247
33 165 369 249 246 357 313 231 358 30534 196 248 238 250 293 279 247 289 27635 145 434 259 217 272 257 200 284 25736 150 172 164 184 258 220 178 232 20637 151 262 248 178 193 187 177 198 190
all 130 131 131 194 243 221 173 192 185

SARVEKSHANA90
2.14 Estimated annual emoluments per hired workerin different State / UT s: Statement 14 gives the estimatedannual emoluments per hired worker in the NDME andDMEs, separately for rural and urban areas by State /UTs. Considering both rural and urban areas, theemoluments per worker was found to be the lowest (Rs.
11391) in Orissa. Chhatisgarh (Rs. 12572) and AndhraPradesh (Rs. 12592) were next in the series. Among themajor States, Gujarat showed the highest emolument (Rs.23875) followed by Maharashtra (Rs. 23438) and Punjab(Rs. 21965), though, many minor states/UT’s showedhigher emoluments.
2.13.1 Chart 8 shows the annual emoluments per hiredworker in NDME and DMEs separately for rural andurban areas for the different activities covered. Theactivities shown in the graph have been arranged suchthat the activity with lowest annual emoluments per hiredworker (considering all the NDME and DMEs of the area)
has been placed at the top. It may be noted that for thecategory of manufacture of office, accounting andcomputing machinery (NIC code 30) no enterprise wassurveyed in the rural areas. Hence, this activity is presentin the chart for urban areas only.
Chart 8: Estimated annual emoluments per hired worker (in Rs. ’000) in different activities

SARVEKSHANA 91
Statement 14: Estimated annual emoluments per hired worker in different State / UTs
State estimated annual emoluments per hired worker (in Rs.’00)
UT rural urban combined
NDME DME NDME NDME DME NDME NDME DME NDME+DME +DME +DME
(1) (2) (3) (4) (5) (6) (7) (8) (9) (10)
Andhra Pr. 92 86 89 147 191 170 121 130 126
Arunachal Pr. 282 96 205 437 304 402 377 189 315
Assam 107 135 116 138 174 147 124 152 132
Bihar 125 254 190 150 198 161 137 240 178
Goa 237 242 239 210 321 269 227 287 252
Gujarat 169 170 169 223 287 263 218 248 239
Haryana 136 151 146 205 271 241 190 237 216
Himachal Pr. 206 337 282 208 257 229 207 322 269
Jammu & Kashmir 168 207 194 225 232 228 205 217 211
Karnataka 108 53 67 174 224 204 144 119 128
Kerala 152 168 160 210 210 210 167 179 174
Madhya Pr. 87 30 44 158 224 189 142 125 132
Maharashtra 134 121 124 234 277 262 218 242 234
Manipur 242 265 257 202 179 193 209 213 211
Meghalaya 204 241 218 223 248 234 209 243 223
Mizoram 167 171 167 234 377 291 220 375 275
Nagaland 151 205 165 202 204 202 191 204 194
Orissa 87 97 93 146 150 147 113 114 114
Punjab 149 206 187 208 255 233 194 238 220
Rajasthan 205 194 199 212 237 225 210 223 217
Sikkim 166 252 196 208 259 222 191 256 211
Tamilnadu 132 162 152 186 217 204 171 198 187
Tripura 106 136 116 140 149 142 124 142 129
Uttar Pradesh 117 120 119 161 200 181 144 142 143
West Bengal 138 146 143 147 179 165 144 163 155
A & N. Island 299 281 290 210 263 233 243 272 256
Chandigarh 231 285 255 217 335 310 218 334 308
D & N Haveli 161 239 211 206 234 216 172 239 212
Daman & Diu 226 291 279 136 234 163 205 289 270
Delhi 266 280 272 254 297 279 254 297 279
Lakshadweep 266 280 272 254 297 279 254 297 279
Pondicherry 124 170 160 113 170 130 114 170 139
Jharkhand 116 164 144 164 171 166 137 165 151
Chhatisgarh 84 64 69 161 184 171 141 113 126
Uttaranchal 141 181 160 167 188 175 157 184 168
all India 130 131 131 194 243 221 173 192 185

SARVEKSHANA92
2.14.1 Chart 9 below shows the annual emoluments perhired worker in NDME and DMEs separately for the ruraland the urban areas for the major States. The differentStates shown in the graph have been arranged such that
the state with lowest annual emoluments per hired workerconsidering all the NDME and DMEs of the area, hasbeen placed at the top.
C. ASSETS AND BORROWINGS
The following statements 15 to 19 present the details ofassets and borrowings of the enterprises.
2.15 Estimated market value of assets per enterprise(in Rs. ’00s): Statement 15 shows the estimated marketvalue of assets per enterprise in Rs. ’00s, by activity andtype of enterprises (OAMEs, NDMEs, DMEs) separately
for rural, urban and combined. At all India level, theestimated market value of assets per enterprise wasestimated as rupees 60500. The market value of assetsper enterprise in rural areas was about 20% of that in theurban areas. In rural areas the estimated market value ofassets per enterprise was rupees 17600, 88100 and 320700for OAMEs, NDMEs and DMEs respectively. The samein the urban areas was rupees 49200, 237300 and 663600for OAMEs, NDMEs and DMEs respectively.
Chart 9: Estimated annual emoluments per hired worker (in Rs. ’000) in major States

SARVEKSHANA 93
Statement 15: Estimated market value of assets per enterprise in different industries
NIC estimated market value of assets per enterprise (in hundred rupees)code
rural urban combined
OAME NDME DME All OAME NDME DME All OAME NDME DME All
(1) (2) (3) (4) (5) (6) (7) (8) (9) (10) (11) (12) (13)
01405 393 750 17158 962 457 1375 9040 702 436 1221 13601 787
15 322 1096 2129 435 681 2149 6012 1368 386 1573 3606 637
16 66 440 820 78 119 593 2413 129 77 468 927 89
17 173 550 2304 250 428 1972 5309 1268 237 1332 4295 556
18 212 587 1314 242 442 1665 5126 875 294 1283 4736 498
19 181 831 1589 214 706 1663 3839 1339 378 1555 3703 754
20 84 839 4092 114 303 2174 7244 979 106 1543 6239 220
21 66 4041 16345 500 340 3808 7877 1901 240 3816 8486 1488
22 1901 2078 2845 2005 1316 3599 9678 3647 1457 3432 9280 3392
23 21 2123 2231 1217 836 2927 5185 2526 187 2366 3095 1559
24 120 1541 3212 566 191 2650 11224 1152 157 2374 6075 867
25 172 3092 5717 1334 636 3879 9485 3813 406 3724 8581 2919
26 157 768 5658 651 336 2227 7304 1566 181 1365 6031 800
27 313 775 6486 984 704 2632 15869 4076 484 2397 13381 2938
28 175 1107 5040 340 905 2805 6545 2482 366 2378 6365 1246
29 239 2098 6462 524 1654 4247 10570 4847 612 3948 10214 2734
30 - - - - - 2685 10604 4684 - 2685 10604 4684
31 461 1539 4181 815 1263 2574 6587 3628 802 2391 6413 2671
32 302 390 5021 1251 908 4829 11399 7361 674 4443 10979 6458
33 1123 761 4234 1280 847 2808 9742 3226 910 2501 9246 2883
34 382 2273 9934 2204 2087 8249 9574 7909 1255 7881 9600 6983
35 353 388 1513 427 1447 3449 11083 5377 911 2603 10434 3852
36 222 692 1542 286 706 2064 4966 1265 453 1771 4118 812
37 314 545 3896 347 868 2715 5198 1904 574 2669 5145 1242
All 176 881 3207 276 492 2373 6636 1375 254 1824 5328 605
2.16 Statement 16 brings out the estimated market valueof assets per enterprise (in Rs. ’00s), by State / UT andtype of enterprises (OAMEs, NDMEs, DMEs) for rural,urban and combined. Among the major States, the esti-mated market value of assets per enterprise was highest
in Haryana followed by Punjab, Gujarat, Maharashtra,Tamil Nadu in descending order. The estimated marketvalue of assets per enterprise was lowest in Orissa (about20% of all India average) among the major States.

SARVEKSHANA94
Statement 16: Estimated market value of assets per enterprise in different States/ UTs
State / estimated market value of assets per enterprise (in Rs. ’00)
UT rural urban combined
OAME NDME DME all OAME NDME DME all OAME NDME DME all
(1) (2) (3) (4) (5) (6) (7) (8) (9) (10) (11) (12) (13)
Andhra Pr. 163 761 1827 228 363 1426 3984 695 207 1095 2744 346Arunachal Pr. 237 466 3722 383 593 2250 1316 1609 332 1603 2109 911Assam 104 442 2588 139 247 772 2324 507 118 598 2456 190Bihar 166 555 2291 187 345 1196 3114 539 190 872 2673 242Goa 375 1896 9326 833 515 3141 6108 1840 405 2361 7333 1096
Gujarat 267 1386 2644 445 807 2805 6052 1993 509 2636 5145 1291Haryana 522 1850 9912 772 1248 3410 11321 2708 807 3001 11113 1700Himachal Pr. 275 2130 11212 608 1119 3152 10346 2314 321 2408 11028 738J. & Kashmir 320 1403 7066 421 519 2876 7431 1004 381 2264 7297 613Karnataka 164 583 1053 231 353 1910 7414 934 224 1301 3331 467
Kerala 232 1150 4849 591 375 2083 5966 1262 253 1374 5157 708Madhya Pr. 154 895 1308 181 433 1880 5607 858 224 1632 3889 375Maharashtra 258 1175 4965 430 707 3204 7342 2211 422 2813 6895 1250Manipur 244 548 868 252 379 1036 1928 464 289 928 1551 327Meghalaya 117 919 2712 228 312 1182 3760 1027 124 985 3055 281
Mizoram 294 384 2350 302 640 2603 13274 1648 423 2017 13174 897Nagaland 359 1253 14777 488 342 1067 1897 576 353 1110 4881 525Orissa 74 774 1338 93 205 1529 3510 541 81 1052 2119 122Punjab 291 1478 20811 698 997 3730 10119 2832 540 3102 11563 1663Rajasthan 358 1341 2719 417 643 2278 6449 1115 454 1995 5374 677
Sikkim 269 1376 17261 945 423 1900 8436 1706 289 1686 30853 1137Tamil Nadu 189 1005 3734 368 402 2193 6843 1288 272 1824 5784 779Tripura 116 750 1033 165 286 890 6579 751 130 814 3827 239Uttar Pr. 192 788 3731 330 438 1509 4337 879 253 1200 4004 488West Bengal 106 453 1908 148 213 996 3448 560 127 765 2755 245
A & N Islands 405 1459 5362 810 750 2444 4547 2215 451 2022 4923 1194Chandigarh 954 3882 4581 2191 515 12146 48804 15281 576 11019 47351 13765D & N Haveli 183 883 8572 840 618 2036 3235 1205 236 1126 7970 891Daman & Diu 299 1480 8306 2785 538 1607 1383 734 406 1509 7897 2125Delhi 941 1668 5407 1550 2122 4557 8658 4794 2026 4449 8611 4648
Lakshadweep 298 - - 298 267 1529 11958 1003 271 1529 11958 933Pondicherry 243 2224 8394 1893 666 1879 12673 1786 563 1923 10782 1809Jharkhand 215 482 2711 235 281 7801685 388 221 594 2413 251Chhatisgarh 138 611 644 155 249 1877 4472 657 161 1394 2979 274Uttaranchal 256 1073 4297 349 575 1864 7587 1215 300 1507 5653 511
all India 176 881 3207 276 492 2373 6636 1375 254 1824 5328 605

SARVEKSHANA 95
2.17 Estimated amount of loan outstanding perenterprise (in Rs. ’00s): Statement 17 gives the estimatedamount of loan outstanding as on date of survey (referredas “estimated outstanding loan per enterprise” hereafter)in Rs. ’00s, by activity and type of enterprises (OAMEs,NDMEs, DMEs) separately for the rural, urban andcombined sectors. At the all India level, the estimated
outstanding loan per enterprise was estimated as rupees5100. In rural areas the estimated outstanding loan perenterprise was rupees 400, 7300 and 105200 for OAMEs,NDMEs and DMEs respectively. The same in the urbanareas was rupees 1000, 10900 and 90600 for OAMEs,NDMEs and DMEs respectively.
Statement 17: Estimated outstanding loan per enterprise in different industries
NIC estimated outstanding loan per enterprise (in Rs. '00)code
rural urban combined
OAME NDME DME All OAME NDME DME All OAME NDME DME All
(1) (2) (3) (4) (5) (6) (7) (8) (9) (10) (11) (12) (13)
01405 15 0 10447 344 0 3 2440 29 5 2 6939 132
15 10 95 698 36 16 82 734 76 11 89 712 45
16 0 10 166 2 0 39 248 1 0 15 171 2
17 3 54 1318 41 6 133 559 94 4 97 815 57
18 3 12 281 4 3 23 376 23 3 19 367 12
19 4 53 157 7 26 55 315 70 12 55 306 37
20 2 84 819 6 19 121 590 65 3 104 663 13
21 0 2945 5217 165 2 66 1406 187 1 165 1679 180
22 37 170 418 100 54 208 1501 337 50 204 1438 300
23 0 0 349 34 58 161 1203 248 12 49 599 90
24 13 193 4451 600 2 199 2414 185 7 198 3723 387
25 10 373 2375 366 10 485 2374 716 10 463 2374 590
26 1 48 541 49 4 161 1132 176 1 94 675 70
27 2 56 12521 1256 4 140 4739 830 3 129 6803 987
28 6 137 1264 37 18 106 514 121 9 114 603 73
29 9 114 1610 52 55 428 1645 582 21 384 1642 323
30 - - - - - 6 815 211 - 6 815 211
31 3 70 1719 107 181 86 2423 963 79 83 2372 672
32 39 150 1177 285 24 137 758 420 30 138 786 400
33 0 0 742 64 139 81 1954 455 108 69 1845 386
34 10 210 1250 239 43 93 699 320 27 100 739 307
35 34 7 146 31 2 358 1162 520 18 261 1093 369
36 7 56 315 17 12 59 590 55 9 58 522 38
37 0 43 840 8 2 102 6 23 1 101 40 16
All 4 73 1052 29 10 109 906 101 5 95 962 51

SARVEKSHANA96
2.17.1 The following Chart 10 shows the estimatedoutstanding loan per enterprise by sector and differentindustries. It is observed that in the rural sector the mostindebted industry is manufacture of basic metals (NIC
code 27) whereas in the urban sector it is manufacture ofelectrical machinery and apparatus n.e.c (NIC code 31).Both of their indebtedness are due to heavily indebtednessstatus of the enterprises under DME.
Chart 10: Estimated outstanding loan per enterprise (Rs. ’00) by NIC ’98 code and sector
2.18 Estimated outstanding loan per enterprise bystate/UT : Statement 18 gives break-up of the estimatedoutstanding loan per enterprise (in Rs. ’00s), State / UT-wise and by type of enterprises (OAMEs, NDMEs,DMEs) for the rural, urban and combined sectors. Among
the major states, the estimated outstanding loan perenterprise was lowest in Bihar followed by Jharkhand,Orissa, Assam and West Bengal respectively. Theestimated outstanding loan per enterprise was highest inMaharashtra among the major states

SARVEKSHANA 97
Statement 18: Estimated outstanding loan per enterprise in different States/ UTs
State / estimated outstanding loan per enterprise (in Rs. '00)
UT rural urban combined
OAME NDME DME all OAME NDME DME all OAME NDME DME all
(1) (2) (3) (4) (5) (6) (7) (8) (9) (10) (11) (12) (13)
Andhra Pr. 3 37 554 17 9 65 387 35 5 51 483 21Arunachal Pr. 5 5 0 5 0 192 96 118 4 124 64 54Assam 1 24 530 6 2 27 106 15 1 25 318 7Bihar 2 29 48 3 2 17 268 10 2 23 150 4Goa 7 369 1171 93 4 202 786 142 6 306 932 106
Gujarat 3 95 461 32 9 192 992 181 5 180 851 113Haryana 9 85 1320 33 15 114 1316 151 11 107 1316 90Himachal Pr. 4 442 33435 666 23 142 1072 124 5 360 26569 625J. & Kashmir 3 221 243 15 2 67 1463 51 3 131 1015 27Karnataka 6 85 167 18 14 163 1195 95 8 127 535 44
Kerala 15 145 2048 124 16 261 1455 192 15 173 1884 136Madhya Pr. 3 96 220 7 7 110 1006 63 4 106 692 23Maharashtra 11 187 2031 74 35 204 1215 236 20 201 1368 149Manipur 0 2 78 1 1 53 84 7 0 42 82 3Meghalaya 0 3 28 1 0 11 41 9 0 5 32 1
Mizoram 11 45 0 13 1 38 0 10 7 40 0 12Nagaland 2 3 10 2 1 17 19 6 2 14 17 4Orissa 2 47 183 3 4 143 650 51 2 83 351 6Punjab 7 120 1707 42 15 201 1309 215 10 179 1363 120Rajasthan 13 74 432 20 7 66 713 45 11 68 632 29
Sikkim 0 16 41436 130 2 7 605 40 0 11 6178 108
Tamil Nadu 3 79 682 32 10 180 894 116 6 149 822 69
Tripura 0 1 0 0 2 24 177 17 0 11 89 2
Uttar Pr. 3 30 994 33 4 30 475 36 3 30 760 34
West Bengal 2 11 687 12 2 26 436 33 2 20 549 17
A & N Islands 8 252 886 88 5 124 945 214 7 179 918 122Chandigarh 3 0 0 2 0 47 8523 2030 1 40 8243 1795D & N Haveli 1 70 109 21 25 10 0 19 4 57 96 21Daman & Diu 0 2 4874 1330 6 21 55 10 3 6 4588 906Delhi 7 7 243 24 0 7 780 181 1 7 772 174
Lakshadwep 0 - - 0 3 93 0 26 3 93 0 23Pondicherry 6 150 3188 537 20 95 1156 112 17 102 2054 206Jharkhand 1 29 427 4 1 26 34 5 1 28 313 4Chhatisgarh 8 54 40 9 4 44 1518 70 7 48 942 24Uttaranchal 9 37 381 15 8 51 305 32 9 45 350 18
all India 4 73 1052 29 10 109 906 101 5 95 962 51

SARVEKSHANA98
2.18.1 The following Chart 11 shows the estimatedoutstanding loan per enterprise by sector and differentstates. It may be observed that in the rural sector the
enterprises in the state of Kerala are most indebted whereasin the urban sector it is in the state of Maharashtra.
Chart 11: Estimated outstanding loan per enterprise (Rs '000) in major States by sector
2.19 Distribution of outstanding loans by source ofloan : Statement 19 presents distribution of outstandingloans per enterprise by source. About 69.0% of this loanwas obtained from central and state level term lending
institutions, banks and other societies and followed bymoneylenders (12%). The percentage of this loan to theassets owned was 11.96% for all sectors combined andthis value does not differ much in rural and urban areas.
Statement 19: Percentage Distribution of outstanding loans per enterprise by source of loans and sectors
total loan from different agencies as percentage to total outstanding loan
sector amount percentage central other money business supplier/ friends otherof loan of loan to and state institution- lenders partner contractor and(in Rs. owned level term al agencies relatives
’00) assets lendinginstitutions,banks etc.
(1) (2) (3) (4) (5) (6) (7) (8) (9) (10)
rural 29 12.60 76.32 2.49 10.02 1.12 1.74 4.57 3.78
urban 101 11.56 64.07 3.75 13.37 4.41 1.48 10.57 2.35
combined 51 11.96 69.02 3.22 12.01 3.09 1.59 8.16 2.93

SARVEKSHANA 99
D. INPUT, OUTPUT AND VALUE ADDED
The following statements 20 to 30 show the particularsof the enterprises about their input, output and valueadded.
2.20 Source agency for purchase of basic inputs :Statement 20 presents information on the primary source
agency from which the enterprises purchased their basicinputs. About 32.5% enterprises reported to not havingany particular agency as a source for purchasing of thebasic inputs. 43.4% enterprises reported to purchase theirinputs from private agencies followed by 18.8% fromprivate individual households. Note that an enterprise canhave more than one source and, hence, the columns figuresin the statement need not add up to 100.
Statement 20: Percentage of manufacturing enterprises by source agency for purchase of basic inputs,separately by sector and type of enterprise
source percentage of enterprises reportingagency forpurchase of rural urban combinedbasic inputs
OAME NDME DME all OAME NDME DME all OAME NDME DME all
(1) (2) (3) (4) (5) (6) (7) (8) (9) (10) (11) (12) (13)
no source 33.3 27.4 19.4 32.7 35.3 25.7 20.0 32.1 33.8 26.3 19.8 32.5agency
sourceagency:
1. government 0.9 0.3 1.5 0.9 0.2 0.4 1.9 0.4 0.7 0.4 1.7 0.7
2.cooperative / 0.4 1.2 0.4 0.4 0.5 0.3 0.6 0.5 0.4 0.6 0.5 0.4marketing
society
3. private 37.0 55.1 46.5 38.1 51.3 65.3 71.5 55.9 40.5 61.5 62.0 43.4enterprise
4. contractor/ 8.5 3.7 6.4 8.2 7.8 4.3 7.2 7.0 8.4 4.1 6.8 7.9middleman
5. private 22.9 18.9 28.0 22.8 9.8 9.9 6.2 9.5 19.7 13.2 14.5 18.8individualhousehold
6. others 6.2 3.5 13.6 6.2 1.4 0.6 0.8 1.2 5.0 1.7 5.7 4.7
2.21 Destination agency for supply of outputs:Statement 21 shows the purchaser agencies to which theenterprises sold their outputs. It is observed that privateindividuals/households (63%) were the primary
purchasers of final products / services of the enterprises.This was followed by private enterprises (31%) andcontractors / middlemen (17%).

SARVEKSHANA100
Statement 21: Percentage of manufacturing enterprises by destination agency for sale of final output, separatelyby sector and type of enterprise
destination percentage of enterprises reportingagency forsale of final rural urban combinedproducts/services OAME NDME DME all OAME NDME DME all OAME NDME DME all
(1) (2) (3) (4) (5) (6) (7) (8) (9) (10) (11) (12) (13)
1. government 0.2 0.6 5.9 0.3 0.3 0.3 1.1 0.3 0.2 0.4 2.9 0.3
2. cooperative / 1.0 2.0 2.3 1.1 0.8 0.5 0.6 0.7 1.0 1.0 1.3 0.0marketingsociety
3. private 26.6 37.0 55.2 27.8 33.6 45.0 71.1 38.9 28.4 42.0 65.0 31.1enterprise
4. contractor/ 18.7 6.8 11.6 18.0 16.0 9.6 12.1 14.3 18.1 8.6 11.9 16.9middleman
5. pvt. 64.8 70.7 48.6 64.8 59.1 61.7 30.7 57.4 63.4 65.0 37.5 62.6individualhouse-hold
6. others 2.2 1.8 1.7 2.1 2.0 1.6 1.3 1.9 2.1 1.6 1.5 2.1
2.22 Growth status of the enterprise over a period oflast three years: Statement 22 summarises the informationon the status of the enterprise over last three years. Theinformation was collected to get the owner’s impressionabout the growth of the enterprise over the last three years.Over 15% of the entrepreneurs had felt that their businessactivities have expanded over the last three years. On the
other hand, about 12% of the entrepreneurs felt that theirbusiness has contracted over the last three years. About63% of the entrepreneurs had felt that their enterpriseshad been stagnant during the last three years. Theimpression of ‘stagnation’ appears to be more commonin case of OAMEs.
growth percentage of enterprisesstatus of
the rural urban combinedenterprise
OAME NDME DME all OAME NDME DME all OAME NDME DME all
(1) (2) (3) (4) (5) (6) (7) (8) (9) (10) (11) (12) (13)
expanding 14.0 23.6 23.8 14.7 16.6 18.3 24.4 17.6 14.6 20.2 24.2 15.6
stagnant 67.8 51.6 46.1 66.5 59.7 49.2 43.3 56.1 65.8 50.2 44.4 63.4
Contracting 11.6 12.0 16.4 11.7 13.1 15.3 15.9 13.8 12.0 14.1 16.0 12.3
*not applicable 6.6 12.8 13.7 7.1 10.6 17.2 16.4 12.5 7.6 15.5 15.4 8.7
all 100 100 100 100 100 100 100 100 100 100 100 100
* not applicable means enterprises had operated for less than three years.
Statement 22: Percentage distribution of manufacturing enterprises by growth status over the last threeyears, separately by sector and type of enterprise

SARVEKSHANA 101
2.23 Estimated annual gross value added per worker(in rupees): Statement 23 gives the estimated annual grossvalue added per worker by product approach (in rupees),activity-wise and by type of enterprises (OAMEs,NDMEs, DMEs), separately for the rural, urban andcombined sectors. The data from the enterprises werecollected for the reference month. The annual value addedwas computed by multiplying the relevant data by 12 incase of perennial and casual enterprises and by ‘thenumber of months operated’ for seasonal enterprises. Atthe all India level, the estimated annual gross value addedper worker was estimated to be rupees 16233. For ruralareas the estimated annual gross value added per workerwas rupees 8783, 19103 and 21210 for OAMEs, NDMEsand DMEs respectively. The corresponding estimates forurban areas were rupees 14595, 31328 and 38064 forOAMEs, NDMEs and DMEs, respectively.
2.23.1 The highest gross value added per worker (rupees48760) was estimated for the activity of manufacture ofoffice, accounting and computing machinery (NIC code30). This was followed by manufacture of other transportequipment (NIC code 35), manufacture of medical,precision and optical instruments, watches and clocks(NIC code 33), manufacture of basic metals (NIC code27) and manufacture of motor vehicles, trailers and semi-trailers (NIC code 34). The lowest gross value added perworker was estimated for the category of manufacture oftobacco products (NIC code 16) (rupees 6915 in ruralareas and rupees 7318 in urban areas). Gross value addedper worker is higher in rural DME as compared to urbanDME in manufacture of other transport equipment (NICcode 35) and manufacture of basic metals (NIC code 27).This may be due to the presence of big manufacturingenterprises in the set of sample enterprises for these twoindustries.
Statement 23: Estimated annual gross value added per worker (in Rs. ’000) in different industries
NIC code estimated annual gross value added per worker (in Rs. ’000)
rural urban combined
OAME NDME DME All OAME NDME DME All OAME NDME DME All
(1) (2) (3) (4) (5) (6) (7) (8) (9) (10) (11) (12) (13)
01405 7.5 14.3 18.3 12.2 11.1 21.2 18.5 14.5 9.9 19.6 18.4 13.7
15 10.9 18.0 16.1 12.3 18.8 29.1 37.9 25.6 12.3 23.2 23.9 15.5
16 6.6 14.7 8.7 6.9 6.6 23.3 26.6 7.3 6.6 16.0 9.8 7.0
17 7.2 13.8 19.2 9.2 10.6 30.1 31.9 22.0 8.1 23.1 27.3 14.0
18 10.4 16.6 15.1 11.4 14.3 26.4 35.3 22.1 11.9 23.3 33.6 16.7
19 14.5 26.3 24.6 15.8 19.5 29.8 34.5 27.7 16.8 29.4 33.9 23.7
20 7.4 23.5 39.1 8.5 15.7 30.6 36.5 23.3 8.2 27.4 37.3 10.6
21 3.0 25.7 48.4 8.9 7.3 36.3 39.2 24.6 5.6 35.9 40.1 20.8
22 35.8 22.7 19.4 28.2 19.5 33.2 45.0 34.7 23.6 32.0 43.8 33.9
23 3.7 30.0 20.0 20.8 24.7 30.5 41.7 32.2 7.5 30.2 26.4 24.2
24 5.9 22.5 13.9 10.8 5.7 32.4 48.7 22.6 5.8 29.7 25.7 16.3
25 9.6 36.7 39.0 27.4 17.2 39.7 55.8 43.4 13.8 39.1 51.7 39.0
26 7.3 24.5 24.3 15.1 10.3 36.8 27.2 21.4 7.7 29.6 24.8 16.1
27 15.7 14.7 109.5 57.8 28.1 34.4 54.2 41.1 21.6 31.9 72.9 46.2
28 10.7 26.5 30.5 14.7 20.4 32.4 38.1 31.1 13.7 31.0 37.2 24.1
29 10.3 22.7 56.0 16.1 26.0 44.5 55.7 46.8 14.6 42.0 55.7 37.2
Contd...

SARVEKSHANA102
30 - - - - - 38.6 64.6 48.8 - 38.6 64.6 48.8
31 20.0 19.2 23.4 20.8 29.9 32.6 53.8 45.8 24.5 30.3 50.8 40.8
32 21.7 28.9 26.7 25.5 22.1 38.0 43.9 41.6 21.9 37.3 43.1 40.3
33 26.7 15.4 60.3 30.2 29.3 50.6 60.3 49.7 28.6 44.4 60.3 46.3
34 10.6 31.1 40.2 30.4 26.3 43.7 47.5 44.9 21.2 42.9 46.9 43.4
35 19.1 17.9 165.4 43.0 23.4 45.1 54.7 48.2 21.4 37.3 62.6 47.1
36 12.8 21.4 21.7 14.9 20.5 31.6 34.5 27.2 16.4 29.6 30.8 22.2
37 10.5 22.9 45.8 12.4 19.2 30.9 32.3 26.8 14.7 30.8 33.1 22.3
all 8.8 19.1 21.2 11.1 14.6 31.3 38.1 25.6 10.2 27.1 30.5 16.2
NIC code estimated annual gross value added per worker (in Rs. ’000)
rural urban combined
OAME NDME DME All OAME NDME DME All OAME NDME DME All
(1) (2) (3) (4) (5) (6) (7) (8) (9) (10) (11) (12) (13)
2.23.2 The following Chart 12 shows sector-wise annualgross value added per worker by activities as per NIC1998. Considering all the industries together, the estimatedvalue adder per worker for rural areas was observed tobe 43% of the corresponding estimate for urban areas.
Only for the category of manufacture of basic metals (NICcode 27), the estimated value added per worker for ruralareas was more than that for urban areas. There was widevariation in the value added per worker between the ruraland urban areas across the different industry groups.
Chart 12: Estimated annual gross value added per worker (in Rs. ’000) by NIC ’98 code and sector
2.24 Statement 24 gives State/UT-wise estimate ofannual gross value added per worker (in rupees), by typeof enterprises (OAMEs, NDMEs, DMEs) for the rural,urban and combined sectors. Among the major States,the estimated annual gross value added per worker washighest in Punjab followed by Gujarat, Haryana,Maharashtra and Rajasthan. It may be noted that the
estimated gross value added per worker for the DMEs inSikkim is much larger than the same in other State /UTs.This may be due to the presence of big manufacturingenterprises in the set of sample Enterprises for this State.It may be noted that Sikkim is one of the few States whereAnnual Survey of Industries is not done.
Statement 23 Contd...

SARVEKSHANA 103
Statement 24: Estimated annual gross value added per worker (in Rs. '000) in different State / UTs
State / estimated annual gross value added per worker (in Rs. ’000)
UT rural urban combined
OAME NDME DME all OAME NDME DME all OAME NDME DME all
(1) (2) (3) (4) (5) (6) (7) (8) (9) (10) (11) (12) (13)
Andhra Pr. 7.9 14.3 16.4 9.3 13.5 24.7 28.7 18.6 9.2 19.6 21.3 11.9
Arunachal Pr. 27.7 33.0 7.2 25.8 50.3 62.7 56.0 59.1 37.3 51.6 31.3 44.1
Assam 11.7 21.9 65.6 14.6 19.8 28.1 29.8 25.0 12.4 25.1 50.3 16.4
Bihar 11.6 20.6 32.5 12.9 15.8 26.8 28.5 19.4 12.2 23.7 31.3 14.0
Goa 7.4 32.1 49.1 16.6 13.4 34.1 51.7 32.4 8.4 32.8 50.6 21.1
Gujarat 13.1 27.7 23.0 17.0 22.0 40.6 40.1 34.6 17.1 39.3 34.6 28.0
Haryana 16.2 26.3 24.5 18.8 22.6 33.8 45.0 32.7 18.8 32.0 39.6 26.8
Himachal Pr. 10.5 38.3 49.8 18.8 28.4 42.1 56.5 40.4 11.5 39.4 51.1 21.2
J & K 18.4 31.3 31.5 19.8 17.5 34.7 40.3 22.3 18.1 33.4 35.5 20.7
Karnataka 8.7 19.4 11.2 10.4 13.6 27.8 34.0 21.1 10.4 24.0 19.6 14.4
Kerala 10.5 20.2 26.1 16.5 14.1 39.1 33.5 28.4 11.0 24.9 28.0 19.0
Madhya Pr. 7.1 18.9 9.5 7.7 11.3 24.6 38.7 18.4 8.2 23.2 24.2 11.2
Maharashtra 12.5 24.5 22.6 15.1 16.6 37.4 44.3 33.0 14.1 35.1 39.2 25.6
Manipur 9.3 30.6 37.8 11.0 12.1 29.5 26.5 16.6 10.2 29.7 30.6 13.2
Meghalaya 13.1 32.4 38.5 18.1 22.2 37.0 55.3 37.9 13.5 33.5 43.1 20.1
Mizoram 17.5 28.8 50.6 19.1 26.7 52.0 88.8 47.6 21.0 46.5 88.5 34.6
Nagaland 12.9 28.2 59.3 16.0 18.5 32.1 34.3 25.7 14.9 31.2 40.0 20.7
Orissa 4.3 14.2 17.0 4.8 9.8 24.1 23.5 15.1 4.6 18.2 19.2 5.5
Punjab 14.8 25.9 37.5 20.5 23.7 40.7 47.4 37.5 18.0 37.1 44.3 29.9
Rajasthan 15.2 29.6 31.7 17.2 16.9 34.8 40.1 24.5 15.8 33.2 37.3 20.4
Sikkim 16.4 23.1 588.3 72.3 18.7 31.5 34.5 29.7 16.8 28.2 280.7 55.5
Tamilnadu 8.5 17.5 21.9 12.0 11.5 27.0 34.8 22.8 9.7 24.1 30.2 17.5
Tripura 8.3 19.9 18.3 9.6 16.2 39.0 44.8 31.4 8.8 28.9 30.5 12.8
Uttar Pradesh 7.3 15.7 17.8 10.1 13.0 24.7 28.5 18.9 8.8 21.0 21.1 12.9
West Bengal 8.2 16.2 26.3 10.2 11.8 23.5 30.1 19.5 8.8 20.5 28.2 12.5
A & N. Island 7.4 50.0 43.5 22.9 19.3 35.7 41.9 35.0 9.1 41.4 42.6 27.6
Chandigarh 36.2 40.9 41.0 39.3 15.7 44.7 78.6 60.6 18.4 44.3 77.6 59.2
D & N Haveli 17.9 27.6 54.0 30.5 28.0 44.0 35.6 36.3 19.1 31.4 52.1 31.4
Daman & Diu 16.4 36.1 90.6 68.0 22.2 25.4 38.9 25.5 19.2 33.6 88.0 60.0
Delhi 32.0 34.4 47.7 36.9 35.7 40.7 46.7 43.0 35.4 40.5 46.7 42.8
Lakshadweep 13.4 - - 13.4 21.2 98.5 32.7 44.5 19.9 98.5 32.7 42.5
Pondicherry 9.6 13.6 56.9 36.2 14.1 19.5 25.7 18.9 13.1 18.8 41.5 23.3
Jharkhand 8.5 18.0 27.5 9.4 15.7 28.2 25.9 19.5 9.0 22.3 27.2 10.4
Chhatisgarh 6.9 16.6 8.4 7.3 7.4 22.0 30.0 13.6 7.0 20.3 17.7 9.0
Uttaranchal 10.2 22.6 24.0 12.5 14.7 26.9 25.0 21.1 10.9 25.0 24.3 14.6
all India 8.8 19.1 21.2 11.1 14.6 31.3 38.1 25.6 10.2 27.1 30.5 16.2

SARVEKSHANA104
2.24.1 Chart 13 gives a comparative picture of the ruraland urban sectors in those States. In all the major States,
annual gross value added per worker in urban areas wasmore than that in the rural areas.
Chart 13: Estimated annual gross value added per worker (Rs ’000) in major States by sector
2.25 Estimated annual value of operating expensesand receipts per enterprise (in rupees): Statement 25gives the industry-wise estimated annual value of inputand output per enterprise in rupees, separately for rural,urban and combined. The data from the enterprises werecollected for the reference month. The annual value wascomputed by multiplying the relevant data by 12 in caseof perennial and casual enterprises and by ‘the number of
months operated’ for seasonal enterprises. For thecombined sector of enterprises, the estimated annual valueof operating expenses and receipts per enterprise wasestimated as rupees 74,591 and 1,09,948, respectively.For rural areas the estimated annual value of operatingexpenses and receipts per enterprise was rupees 31,405and 53,753 respectively. The same for the urban areaswas rupees 1,75,860 and 2,41, 723 respectively.

SARVEKSHANA 105
Statement 25: Estimated annual value of operating expenses and receipts per enterprise by differentindustry groups
estimated annual value per enterprise (in Rs. ‘00)
rural urban combined
NIC ’98 operating receipts operating receipts operating receiptscode expenses expenses expenses
(1) (2) (3) (4) (5) (6) (7)
01405 586 864 524 806 544 825
15 749 1019 2479 3136 1123 1476
16 67 182 54 161 65 178
17 147 359 1393 2093 521 879
18 62 218 308 747 161 433
19 289 520 1478 2346 860 1397
20 102 256 806 1307 188 385
21 553 760 1976 2723 1556 2144
22 641 1363 1824 3030 1641 2771
23 2628 3261 5405 6585 3353 4129
24 944 1252 2361 2889 1671 2091
25 2351 3080 4208 5927 3538 4901
26 781 1343 1514 2295 900 1498
27 4896 6529 7051 8584 6258 7828
28 359 626 1850 2892 989 1584
29 571 877 3509 5367 2073 3172
30 - - 16182 19057 16182 19057
31 908 1382 63353 65509 42118 43702
32 2563 3376 3592 6305 3440 5872
33 2327 3424 2957 4776 2846 4538
34 1204 2116 4154 6470 3675 5763
35 2266 3422 3800 5970 3327 5185
36 299 594 804 1476 571 1068
37 166 382 1721 2490 1060 1594
all 314 538 1759 2417 746 1099
2.26 Statement 26 gives the share of operating expenseson raw materials consumed by the different industriestogether with the share of receipts from the products andby-products manufactured (including change in stock ofsemi finished goods). For rural enterprises, in manufactureof other transport equipment (NIC code 35) the share ofexpenses on raw materials was highest (93.2%). For urbanenterprises the same was highest in the category of
manufacture of office, accounting and computingmachinery (NIC code 30) (93.8%). For rural enterprisesthe share of products and by-products manufactured intotal receipt was highest in the category of manufactureof other non-metallic mineral products (NIC code 26)(96.7%). The same for urban enterprises was highest inmanufacture of basic metals (NIC code 31) (98.7%).

SARVEKSHANA106
Statement 26: Percentage share of raw materials consumed in operating expenses (including distributiveexpenses) and percentage share of products and by-products(*) manufactured in total receiptsfor different industry groups
percentage sharae of
rural urban combined
NIC 1998 raw materials products and raw materials products and raw materials products andcode to operating by products to operating by products to operating by products
expenses to receipts expenses to receipts expenses to receipts
(1) (2) (3) (4) (5) (6) (7)
01405 65.66 43.23 84.49 63.32 77.90 56.48
15 78.25 80.59 81.42 86.60 79.76 83.35
16 66.19 43.11 66.30 34.61 66.22 41.45
17 68.70 49.83 77.84 66.91 76.03 62.03
18 48.09 5.65 66.83 29.12 62.58 22.07
19 86.21 87.48 79.00 78.49 80.26 80.23
20 78.57 65.02 81.48 71.41 80.10 67.69
21 83.52 96.35 85.82 87.71 85.58 88.61
22 72.10 27.80 63.52 55.32 64.04 53.22
23 75.91 91.17 66.99 96.90 72.16 93.55
24 55.71 88.77 84.45 96.40 76.54 94.18
25 81.40 86.15 77.03 84.80 78.08 85.11
26 39.93 96.70 51.72 89.01 43.15 94.78
27 89.96 94.48 83.88 86.56 85.63 88.99
28 74.39 67.90 77.62 69.17 76.95 68.88
29 65.39 66.69 75.81 76.02 74.41 74.76
30 - - 93.75 97.71 93.75 97.71
31 65.85 50.75 80.88 98.70 80.77 98.18
32 83.41 83.26 62.96 53.15 65.21 55.71
33 81.83 80.97 77.01 72.49 77.70 73.61
34 70.45 73.32 73.01 66.60 72.87 67.00
35 93.21 84.60 79.48 78.81 82.36 79.99
36 74.72 57.78 72.29 53.72 72.88 54.76
37 73.32 51.87 80.12 80.02 79.67 77.15
all 70.19 70.72 78.03 76.61 75.72 74.59 * the products and by products manufactured includes value of the change in stock of semi finished goods
2.27 Statement 27 gives the percentage distribution ofoperating expenses by items of expenditure separately forthe rural, urban and combined sectors. It was observedthat the share of raw materials accounted a majorpart(more than 70%) in all the sectors. Excluding rawmaterials having overall share of 75.72%, other sharesof expenditure items were fuel and lubricant (4.4%),service charges for work done by others (4.1%), electricity(3.6%), trading and other activities (2.6%) and travelling,freight and transport charges (2.2%) respectively. In the
rural enterprises, expenses on fuel and lubricant (10.7%)was followed by expenses on electricity (3.9%), travelling,freight and transport charges (3.1%), service charges forwork done by others (2.3%) and consumable stores,packing materials (2.2%). Among urban enterprises,expenses on service charges for work done by others(4.8%) was followed by electricity (3.5%), trading andother activities (2.8%), consumable stores, packingmaterials (1.9%) and fuel and lubricant (1.8%).

SARVEKSHANA 107
Statement 27: Percent share of different items of expenditure in operating expenses (including distributiveexpenses) for all industries combined
item of expenditure share in operating expenses (%)
rural urban combined
(1) (2) (3) (4)
raw materials consumed 70.19 78.03 75.72
trading and other activities 2.04 2.76 2.55
electricity 3.85 3.52 3.62
fuel and lubricant 10.65 1.81 4.42
cost of own construction 0.41 0.20 0.27
minor repair and maintenance 2.09 1.15 1.43
service charge for work done by others 2.26 4.82 4.06
travelling, freight and transport charges 3.14 1.75 2.16
communication 0.19 0.65 0.52
consumable stores, packing materials, etc. 2.24 1.85 1.97
paper, printing and stationery 0.17 0.15 0.16
distributive expenses 0.83 0.33 0.48
others 1.93 2.96 2.65
total 100.00 100.00 100.00
2.28 Statement 28 gives the percentage distribution ofgross receipts by items of receipt separately for the rural,urban and combined sectors. The major share of grossreceipts was 73.38 % for the combined sector and 69.38%in rural and 75.46% in urban areas respectively.
Statement 28: Percent share of different items of receipt in gross receipt in all industries combined
item of receipt share in gross receipt (%)
rural urban combined
(1) (2) (3) (4)
products and by-products manufactured 69.38 75.46 73.38
change in stock of semi finished goods 1.34 1.15 1.21
receipts from trading and other activities 1.51 2.52 2.17
receipts from services provided to others 26.33 20.17 22.28
market value of own construction 0.25 0.16 0.19
consumption of goods for own use 0.47 0.13 0.25
rent receivable from fixed assets 0.01 0.01 0.01
donation received 0.07 0.02 0.04
other receipts 0.63 0.37 0.46
total 100.00 100.00 100.00
Considering all the enterprises together, other contributoryreceipts from services provided to others (22.28%),receipts from trading and other services (2.17%) andchange in semi-finished stocks (1.21%) respectively.
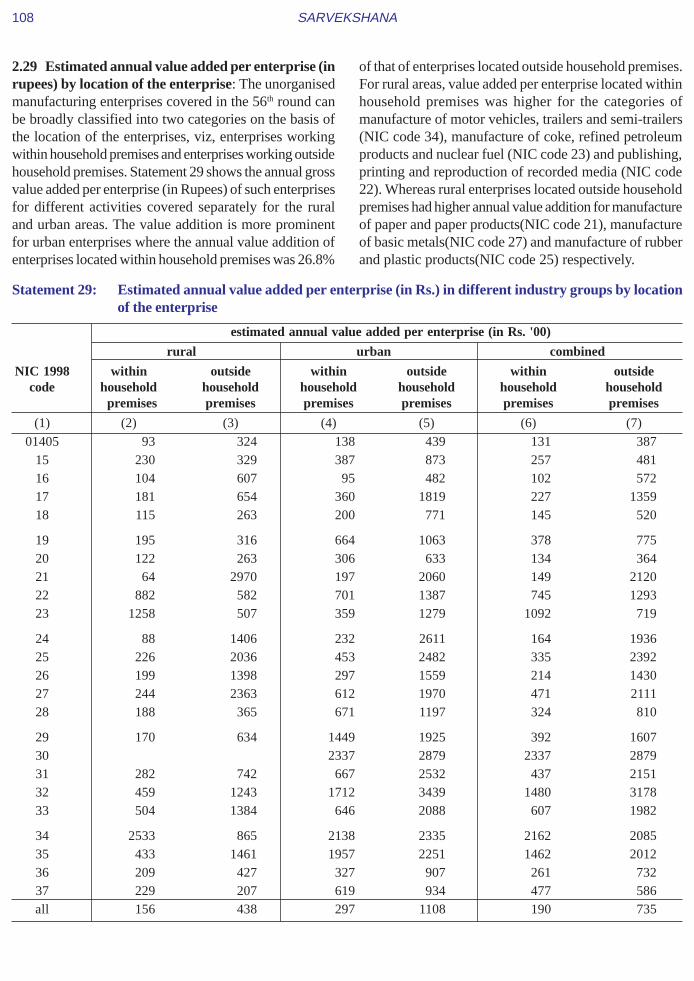
SARVEKSHANA108
2.29 Estimated annual value added per enterprise (inrupees) by location of the enterprise: The unorganisedmanufacturing enterprises covered in the 56th round canbe broadly classified into two categories on the basis ofthe location of the enterprises, viz, enterprises workingwithin household premises and enterprises working outsidehousehold premises. Statement 29 shows the annual grossvalue added per enterprise (in Rupees) of such enterprisesfor different activities covered separately for the ruraland urban areas. The value addition is more prominentfor urban enterprises where the annual value addition ofenterprises located within household premises was 26.8%
of that of enterprises located outside household premises.For rural areas, value added per enterprise located withinhousehold premises was higher for the categories ofmanufacture of motor vehicles, trailers and semi-trailers(NIC code 34), manufacture of coke, refined petroleumproducts and nuclear fuel (NIC code 23) and publishing,printing and reproduction of recorded media (NIC code22). Whereas rural enterprises located outside householdpremises had higher annual value addition for manufactureof paper and paper products(NIC code 21), manufactureof basic metals(NIC code 27) and manufacture of rubberand plastic products(NIC code 25) respectively.
Statement 29: Estimated annual value added per enterprise (in Rs.) in different industry groups by locationof the enterprise
estimated annual value added per enterprise (in Rs. '00)
rural urban combined
NIC 1998 within outside within outside within outsidecode household household household household household household
premises premises premises premises premises premises
(1) (2) (3) (4) (5) (6) (7)
01405 93 324 138 439 131 38715 230 329 387 873 257 48116 104 607 95 482 102 57217 181 654 360 1819 227 135918 115 263 200 771 145 520
19 195 316 664 1063 378 77520 122 263 306 633 134 36421 64 2970 197 2060 149 212022 882 582 701 1387 745 129323 1258 507 359 1279 1092 719
24 88 1406 232 2611 164 193625 226 2036 453 2482 335 239226 199 1398 297 1559 214 143027 244 2363 612 1970 471 211128 188 365 671 1197 324 810
29 170 634 1449 1925 392 160730 2337 2879 2337 287931 282 742 667 2532 437 215132 459 1243 1712 3439 1480 317833 504 1384 646 2088 607 1982
34 2533 865 2138 2335 2162 208535 433 1461 1957 2251 1462 201236 209 427 327 907 261 73237 229 207 619 934 477 586all 156 438 297 1108 190 735

SARVEKSHANA 109
2.29.1 The following Chart 14 shows the annual valueadded per enterprise in different tabulation categories
operating in the two different types of locations separatelyfor rural and urban areas.
Chart 14: Estimated annual value added per enterprise (in Rs. ‘000.) by industry and location of the enterprise
2.30 Statement 30 provides the annual value added perenterprise (in rupees) by location of the enterprise for thedifferent State / UT’s separately for the rural and urbanareas. In all the State / UT’s, the annual value addition ofenterprises located within household premises was lessthan that of the enterprises located outside household
premises. Considering all the rural and urban enterprises,among the major States, the difference in value additionbetween these two types of enterprises was highest inMaharashtra followed by Tamilnadu, Kerala, Gujarat andWest Bengal.

SARVEKSHANA110
Statement 30: Estimated annual value added per enterprise (in Rs. ’00) in different State / UTs bylocation of the enterprise
State / estimated annual value added per enterprise (in Rs. ’00)UT rural urban combined
within outside within outside within outsidehousehold household household household household householdpremises premises premises premises premises premises
(1) (2) (3) (4) (5) (6) (7)
Andhra Pradesh 134 402 224 721 152 534Arunachal Pr. 224 959 1520 2256 487 1695Assam 190 389 433 669 209 459Bihar 198 293 278 545 208 343Goa 283 477 587 1294 385 632Gujarat 215 682 356 1454 271 1208Haryana 220 446 358 1050 267 790Himachal Pr. 116 420 395 1078 126 490Jammu & Kashmir 386 688 326 982 369 838Karnataka 148 413 213 824 166 638Kerala 157 647 255 1292 172 780Madhya Pradesh 104 236 206 754 131 413Maharashtra 190 526 339 1618 244 1204Manipur 148 215 204 679 166 500Meghalaya 217 771 307 1447 219 890Mizoram 208 396 485 1539 311 974
Nagaland 175 371 282 814 217 572Orissa 95 151 205 463 100 189Punjab 156 744 580 1332 308 1077Rajasthan 240 420 266 937 249 655Sikkim 179 1612 887 910 312 1417Tamilnadu 147 616 258 1076 188 907Tripura 168 230 635 781 202 338Uttar Pradesh 131 425 315 747 179 533West Bengal 166 653 247 909 181 775
A & N. Island 123 990 370 1588 159 1222Chandigarh 249 1379 314 4037 306 3745D & N Haveli 184 812 455 977 224 834Daman & Diu 153 4083 486 586 316 3374Delhi 369 945 1109 2041 1092 1981Lakshadweep 178 - 155 1691 159 1691Pondicherry 184 2901 367 714 313 1069
Jharkhand 175 287 257 508 180 342Chhatisgarh 121 210 157 592 128 346Uttaranchal 127 291 273 621 149 364
all India 156 438 297 1108 190 735

SARVEKSHANA 111
2.30.1 The following Chart 15 shows the annual valueadded per enterprise in OAME, NDME and DMEs
operating in the two different types of location separatelyfor rural and urban areas for all the States put together.
Chart 15: Estimated annual value added per enterprise (in Rs.) by location of the enterprise
E. CONCLUSION
2.31 Estimated contribution of emoluments, rent &interest and net surplus to annual value addition(income approach): Information on emoluments, rent &interest and net surplus of the enterprises were collectedin the 56th round. Statement 31 gives the share of theseseparately for OAME, NDME and DME. The annualvalue added per enterprise (Rs. ’000) by factor incomeapproach is also given for each of these three types ofenterprises. The annual value added per enterpriseobtained through this approach was slightly lower thanthe annual value added per enterprise by productapproach. The share of emoluments in the OAME wasvery low since generally the OAME runs without anyhired worker. The share of rent and interest in valueaddition is also quite low. Among the OAMEs, theactivities such as manufacture of tobacco products (NICcode 16), manufacture of other non-metallic mineral
products (NIC code 26) and manufacture of wood andmanufacture of products of wood and cork, exceptfurniture; manufacture of articles of straw and plaitingmaterials (NIC code 20) had the higher share of netsurplus. Among the NDMEs, the share of net surplus ishighest in cotton ginning, cleaning and bailing (NIC code01405) followed by manufacture of coke, refinedpetroleum products and nuclear fuel (NIC code 23) andmanufacture of food products and beverages (NIC code15). Manufacture of food products and beverages (NICcode 15), manufacture of tobacco products (NIC code16) and manufacture of basic metals (NIC code 27)registered the higher share of net surplus among theDMEs. The share of emoluments in value addition of theDMEs was maximum in manufacture of furniture,manufacturing n.e.c. (NIC code 36) whereas, it wasmaximum in manufacture of tobacco products (NIC code16) among the NDMEs.

SARVEKSHANA112
Statement 31: Estimated share of emoluments, rent & interest and net surplus in annual valueadded(income approach) per enterprise in different industries
NIC OAME NDME DME’98
code share in factor income share in factor income share in factor incomeemolu- rent+ net value emolu- rent+ net value emolu- rent+ net valuements interest surplus added ments interest surplus added ments interest surplus added
(in Rs. (in Rs. (in Rs.’000) ’000) ’000)
(1) (2) (4) (5) (6) (7) (9) (10) (11) (12) (14) (15) (16)
01405 0.0 11.2 88.8 13.9 29.2 3.5 67.2 55.1 41.5 9.4 49.1 454.7
15 0.8 2.5 96.7 22.3 31.0 4.8 64.2 68.8 37.6 8.4 53.9 195.1
16 0.1 0.2 99.6 9.8 44.2 1.1 54.8 61.6 44.4 2.2 53.4 113.8
17 0.8 1.4 97.9 15.6 42.5 4.0 53.5 83.5 59.3 5.6 35.1 261.0
18 0.9 4.1 95.0 14.8 38.6 7.3 54.1 67.1 53.9 6.1 40.0 298.7
19 0.1 3.3 96.6 24.8 37.3 5.1 57.5 94.7 52.1 5.7 42.2 277.9
20 0.5 0.9 98.6 13.9 40.0 4.9 55.1 83.7 47.6 5.7 46.7 238.9
21 1.1 2.6 96.3 10.7 37.6 12.7 49.8 126.1 45.9 12.1 41.9 334.0
22 0.7 8.4 90.8 40.9 37.5 10.4 52.1 104.4 42.2 10.8 47.0 375.0
23 0.0 2.9 97.1 13.5 33.4 2.1 64.5 105.1 41.8 8.5 49.6 179.1
24 2.8 2.3 94.9 8.6 32.8 6.9 60.3 103.0 38.8 22.6 38.5 343.6
25 4.1 5.6 90.3 21.2 37.9 12.0 50.0 139.3 37.4 13.1 49.5 430.6
26 0.2 0.5 99.3 17.4 35.7 4.9 59.3 99.1 54.5 4.9 40.6 386.6
27 0.7 3.6 95.7 32.3 37.3 5.9 56.8 104.6 32.9 14.4 52.8 715.6
28 1.1 3.6 95.4 22.2 38.2 7.8 54.1 100.6 51.1 7.7 41.1 279.7
29 1.0 5.8 93.2 24.2 38.4 12.8 48.8 137.5 46.7 11.4 41.9 416.8
30 - - - - 33.8 12.1 54.1 183.7 52.0 7.3 40.7 568.7
31 0.8 9.3 90.0 35.7 34.2 6.3 59.5 106.8 51.9 11.2 36.9 405.4
32 0.6 3.0 96.4 38.5 39.9 6.0 54.1 142.3 48.5 9.2 42.3 416.1
33 3.0 6.9 90.1 55.9 33.9 4.6 61.5 148.1 44.6 9.4 45.9 510.8
34 5.2 12.2 82.6 36.9 42.4 5.2 52.5 138.4 50.3 7.8 41.8 368.7
35 0.0 3.2 96.8 34.4 36.9 9.1 53.9 111.8 45.6 5.7 48.7 408.7
36 0.6 4.1 95.4 25.8 35.4 4.7 59.8 95.5 62.1 5.1 32.8 315.2
37 0.2 4.3 95.5 24.6 35.8 4.7 59.6 110.5 42.6 5.8 51.6 217.8
all 0.7 2.5 96.9 16.8 37.1 6.3 56.5 85.6 50.6 7.9 41.5 295.7
2.31.1 The following Chart 16 presents the share ofemoluments, rent, interest and net surplus in different types
of enterprises separately for rural and urban sectors.

SARVEKSHANA 113
2.32 Some important figures and rates and ratiosrelated to the unorganized manufacturing sector: Thefollowing statement 32 shows some important parametersand rates and ratios separately for OAME, NDME andDME at the rural, urban and combined sectors. Since by
definition, DME stands for bigger enterprises, economicparameters in terms of values are much more significantin case of DMEs in every sector whereas in terms ofnumber of enterprises or number of workers etc, OAMEcontributes more both in rural and urban areas.
Chart 16: Estimated share of emoluments, rent, interest and net surplus in annual value addition in differenttypes of enterprises

SARVEKSHANA114
Statement 32: Some important figures and ratios relating to the unorganised manufacturing sector (OAME,NDME, DME) at all India level
srl important items of rural urban combinedno. information OAME NDME DME OAME NDME DME OAME NDME DME
(1) (2) (3) (4) (5) (6) (7) (8) (9) (10) (11)
1 fixed assets per 176.3 881.5 3206.8 492.0 2372.5 6636.2 254.0 1824.2 5327.8enterprise(Rs’00s.)
2 annual input per 107.1 621.2 4274.0 180.8 1254.9 12430.2 125.2 1021.8 9318.4enterprise(Rs ‘00s.)
3 fixed assets owned 156.3 657.7 2577.2 307.1 1427.6 4522.2 193.4 1144.5 3780.1per enterprise(Rs ‘00s.)
4 outstanding annual 4.1 72.6 1052.0 9.8 108.8 906.0 5.5 95.5 961.7loan per enterprise(Rs ‘00s.)
5 annual interest per 0.9 13.9 159.5 1.9 19.4 144.5 1.1 17.4 150.2enterprise (Rs ‘00s.)
6 annual gross value 87.8 191.0 212.1 146.0 313.3 380.6 101.5 270.8 304.8added per worker(Rs. ‘00s)
7 ratio of annual gross 0.86 0.67 0.78 0.49 0.44 0.51 0.68 0.48 0.57value added to fixedassets
8 ratio of annual gross 0.97 0.89 0.97 0.78 0.74 0.75 0.9 0.77 0.8value added to fixedassets owned
9 owned fixed assets per 9.0 21.4 21.9 18.7 42.6 50.9 11.3 35.2 37.91000 workers
10 estimated no. of 11058 629 247 3607 1082 400 14665 1712 647enterprises (in ‘000)
11 sample no. of 475.7 81.0 51.0 542.6 248.9 125.7 1018.3 329.9 176.7enterprises (in ’00)
12 estimated no. of 19147 1933 2906 5914 3629 3552 25061 5562 6458workers (in ‘000)
13 sample no. of 793.5 254.0 640.4 919.5 830.1 1147.2 1713.0 1084.1 1787.6workers (in ’00)
2.33 Other Important Findings and Changes overTime: Previous to the 56th round, survey on manufacturingenterprises were conducted in the 51st round (July 1994 –June 1995) and in the 55th round (July 1999 – June 2000).The coverage of those earlier surveys do not match exactlywith the 56th round. Both the NSS 55th round and the 56th
round used the NIC 1998 classification while the 51st
round used NIC 1987. In the 55th round two types ofenterprises were surveyed viz., OAE and Establishmentsunder the tabulation categories D,F,G,H,J,I,K,M,N,O ofNIC 1998 but the 56th round focused on the tabulationcategory D only with further break up of theEstablishments into NDMEs and DMEs.

SARVEKSHANA 115
The coverage of 56th round survey, however, falls shortof NSS 51st round coverage to some extent. The followingactivities were covered in the 51st round but not in the56th round:
i) Repair and maintenance of computers and computerbased systems (code 3941 of NIC 1987), ii) Repair ofoffice, computing and accounting machinery other thancomputers and computer based systems (code 3942 ofNIC 1987), iii) Repair of heavy motor vehicles (code 398of NIC 1987), iv) Repair of household electricalappliances (code 971 of NIC 1987), v) Repair of TV,VCR, radio, transistor, tape-recorder and other electronicappliances (code 972 of NIC 1987), vi) Repair of watches,clocks and jewellery (code 973 of NIC 1987), vii) Repairof motor vehicles and motor cycles except trucks, lorryand other heavy vehicles (code 974 of NIC 1987), viii)Repair of bicycles and cycle rickshaws (code 975 of NIC1987) and ix) Repair enterprises not elsewhere classified(code 979 of NIC 1987).
The repair related services of NIC 1987 mentioned abovehave been classified in NIC 1998 under various non-manufacturing industry groups, viz, 72501, 72502,50200, 52602, 52603, 52604, 50404, 52605 and 52609.However, cotton ginning, cleaning and baling activity(code 01405 of NIC 1998) was covered in the 56th roundto keep parity with the coverage of the ASI.
Further, the estimates for manufacturing units derivedfrom 55th round used a smaller sample of enterprises
compared to that of the 56th round and, hence, may besubjected to more sampling variations than that from the56th round. This may be kept in view while makingcomparisons of the estimates between these two rounds(55th and 56th).
The statements 33, 34 and 35 show the comparativestudies over the three rounds viz. NSS 51st, 55th and 56th.The common activities covered in both 51st round and56th round have been considered in reporting to thesestatements. That is activities covered in the 51st roundbut excluded in the 56th round have not been consideredfor comparison. Also, the figures reported in rupee valuefor NSS 51st and 55th rounds had been adjusted by theconsumer price indices for Agricultural Labourers in therural areas and Urban Non-manual Employees in theurban areas separately, so that they become comparableto the current prices corresponding to the NSS 56th round.
2.33.1 Statement 33 shows comparable figures for theestimated number of enterprises by the type of enterprisesfor different rounds. The figure for the 56th round was135.53% of that of the 51st round at all India level for allenterprises taken together. In the 55th round, the estimatednumber of informal manufacturing enterprises stood at142.69 lakhs whereas the estimated number ofunorganised manufacturing enterprises in the 56th roundwas 170.24 lakhs. Also, the proportion of DMEs(12%)estimated in the 56th round was higher than that of the51st round (8%).
Statement 33: Changes in number of enterprises in different enterprise types over 51st, 55th and 56th rounds
estimated number of enterprises (in hundred)
NSS rural urban combinedround OAME NDME All OAME NDME All OAME NDME All
+DME +DME +DME
(1) (2) (3) (4) (5) (6) (7) (8) (9) (10)
56th 110582 8764 119346 36072 14824 50895 146654 23587 170241
55th 90050 6090 96140 33460 13100 46560 123510 19180 142700
51st 86410 8910 95320 20110 10180 30290 106520 19090 125610

2.34 Statement 34 shows that the number of workersestimated in the 56th round had been higher than theestimated number of workers in the 55th round. In the
56th round the figure for the workers for all enterprisestaken together was 123.62% of that of the 51st round.
Statement 34: Changes in estimated number of workers in different enterprise type over 51st, 55th and56th round
estimated number of workers (in hundred)
NSS rural urban combined
round OAME NDME all OAME NDME all OAME NDME all+DME +DME +DME
(1) (2) (4) (5) (6) (8) (9) (10) (12) (13)
56th 191472 48386 239857 59141 71809 130951 250612 120195 370808
55th 148667 28253 176920 55684 64006 119690 204351 92259 296610
51st 167160 40910 208070 38440 53450 91890 205610 94360 299970
2.35 Statement 35 shows the gross value-added for thethree rounds at current prices corresponding to the 56th
round. Combining both urban and rural sectors, the figurefor the GVA for all enterprises taken together are 88%
and 68% respectively in the 55th and the 51st roundscompared to that of the 56th round. This implies that thissection of the economy has grown considerably over theseperiods and may play an important role in future.
Statement 35: Changes in estimated annual gross value added (in lakh rupees) for different enterprise typesover 51st, 55th and 56th round
estimated annual gross value added (in lakhs of rupees)
NSS rural urban combined
round OAME NDME all OAME NDME all OAME NDME all+DME +DME +DME
(1) (2) (4) (5) (6) (8) (9) (10) (12) (13)
56th 16817 9855 26672 8632 24889 33521 25449 34744 60193
55th 13816 6649 20466 9054 23523 32578 22870 30172 53044
51st 10543 6541 17084 5749 18113 23862 16292 24654 40946

ANNEX - I
SAMPLE DESIGN ANDESTIMATION PROCEDURE

SARVEKSHANA118
Sample Design and Estimation Procedure
1.0 General: The focus of the NSS fifty-sixth round,conducted during 1st July 2000 to 30th June 2001, was onmanufacturing enterprises in the unorganized sector. Thiswas an integrated survey covering unorganizedmanufacturing enterprises and the household consumerexpenditure.
1.1 Subject Coverage: The survey coveredmanufacturing enterprises (Tabulation category ‘D’ ofNIC ‘98) in the unorganized sector, not covered underAnnual Survey of Industries. It also included cottonginning, cleaning and baling enterprises (code 01405 ofNIC ‘98). All Public Sector or Departmental enterpriseswere outside the coverage.
1.2 Geographical coverage: The survey covered thewhole of the Indian Union except (i) Leh and Kargildistricts of Jammu & Kashmir, (ii) interior villages ofNagaland situated beyond five kilometers of the bus routeand (iii) villages in Andaman and Nicobar Islands whichremain inaccessible throughout the year and (iv) somefirst stage units (FSU’s) (numbering less than 0.1% oftotal) where EC ‘98 work could not be conducted.
1.3 Period of survey and work programme: Thefieldwork of fifty-sixth round commenced on 1st July 2000and ended on 30th June 2001. The survey period wasdivided into four sub-rounds of three months durationeach as follows:
Sub-Round 1 July-September 2000
Sub-Round 2 October-December 2000
Sub-Round 3 January-March 2001
Sub-Round 4 April-June 2001
Equal number of sample FSU’s were allotted for surveyin each of these four sub-rounds. Each FSU is surveyedduring the sub-round to which it is allotted. Because ofarduous field condition prevailing in Andaman andNicobar Islands, Lakshadweep, rural areas of Arunachal
Pradesh and Nagaland, this restriction was relaxed in thesestates.
1.4 Schedules of enquiry: The following schedules ofenquiry were used in the survey.
srl. no. schedule title of the scheduleno.
(1) (2) (3)
1. 0.0 list of households and non-agricultural enterprises
2. 2.2 unorganized manufacturing3. 1.0 household consumer expenditure
2.0 Sample Design: A stratified two / three-stage sampledesign was adopted with villages (Panchayat wards incase of Kerala) / UFS blocks as the FSU’s andmanufacturing enterprises in the unorganized sector asthe ultimate stage units (USU’s). For household consumerexpenditure cum employment-unemployment enquiry,households were the USU’s.
2.1 Sampling Frame: Economic Census conducted during1998 (EC ’98) with enterprise / establishment level datawas used as the frame for the survey for the whole ofIndia except Orissa, Bihar & 66 towns of Karnataka.The EC ’98 could not be used as frame for Orissa andBihar because the EC ’98 data was not available in thesestates at the time of sample selection. In case of 66 townsof Karnataka, the EC’98 work was not done using UFSblocks. Therefore, for rural sector of both Orissa andBihar, population census 1991 was used as samplingframe. In case of urban areas, the latest available list ofUFS blocks was used as sampling frame for all towns ofOrissa and Bihar as well as for 66 towns of Karnataka.
3.0 Stratification
3.1 Rural : Each district was treated as a stratum for all
Annex-I

SARVEKSHANA 119
States / UT s, except Orissa and Bihar, and divided intothree sub-strata as under.
sub-stratum 1:FSU’s with no unorganisedmanufacturing enterprises
sub-stratum 2:FSU’s with at least one DirectoryManufacturing Enterprise (DME) in theunorganised sector
sub-stratum 3: The remaining FSU’s.
Formation of a sub-stratum was considered only whenthere were at least 20 FSU’s in that sub-stratum; otherwisethat particular sub-stratum was not formed and mergedwith other sub-stratum as per the following working rule:
Sub-stratum 1 (sub-stratum 3) with less than 20 FSU’swas merged with sub-stratum 3 (sub-stratum 1). Sub-stratum 2 with less than 8 FSU’s was merged with sub-stratum 3. In case of merger of two or more sub-strata,the FSU’s were identified with the sub-stratum havinglarger number of FSU’s As EC ’98 data were not availablefor Orissa and Bihar at the time of sample selection,stratification in these two states were done on the basis ofPopulation Census 1991. In this case, each district wastaken as a stratum and each stratum was divided into twosub-strata only.
sub-stratum 1: All FSU’s with population from 0 to 50as per population Census 1991.
sub-stratum 2: The remaining FSU’s.
Formation of a sub-stratum was considered only whenthere were at least 20 FSU’s in that sub-stratum; otherwiseno sub-stratification was effected and all FSU’s in thiscase were taken to belong to sub-stratum 2.
3.2 Urban: Strata were formed within each NSS regionof a State / UT (except Karnataka). The towns within anNSS region were grouped to form strata according to thepopulation of the towns as per 1991 population Censusas given below (P stands for population of ’91 census):
i) Stratum 1: all towns with P ≤ 50000
ii) Stratum 2: all towns with 50000 < P ≤ 100000
iii) Stratum 3: all towns with 100000 < P ≤ 500000
iv) Stratum 4: all towns with 500000 < P ≤ 1000000
v) Stratum 5 / 6 / 7: Each town with P > 1000000.
Within each stratum (except for Orissa and Bihar andspecified 66 towns of Karnataka), three sub-strata wereformed, as under:
sub-stratum 1:FSU’s with no unorganizedmanufacturing enterprises
sub-stratum 2:FSU’s with at least one DME in theunorganized sector
sub-stratum 3: remaining FSU’s.
Sub-stratum 1 (sub-stratum 3) with less than 20 FSU’swas merged with sub-stratum 3 (sub-stratum 1) and wasidentified with the sub-stratum 3 (sub-stratum 1). Sub-stratum 2 with less than 8 FSU’s was merged with sub-stratum 3. In case of merger of two or more sub-strata,the FSU’s were identified with the sub-stratum havinglarger number of FSU’s.
For Karnataka, there were 66 towns where UFS blockswere not used for EC ’98 work. The stratificationprocedure was therefore modified for the urban sector ofKarnataka in the following manner:
All the towns of Karnataka were first grouped within NSSregion by town classes as per the criteria given above forother States / UTs. Then for each town class within aregion, two strata were formed. The towns included inthe list of 66 special category towns formed a specialstratum within a region × town class. The rest of the townswithin the region × town class formed a general stratum.
Sub-stratification for general strata of Karnataka was thesame as in the case of other State / UT s. For specialstrata of Karnataka and all the strata of Orissa and Bihar,three sub-strata were formed, as follows:
Sub-stratum 1: all FSU’s (ie UFS blocks as per the latestUFS) identified as Industrial Area (IA),
Sub-stratum 2: all FSU’s identified as Bazar Area (BA),
Sub-stratum 3: the remaining FSU’s.
Priority order that was followed in including a ‘mixedarea’ type FSU e.g. IA and BA, BA and RA, etc in sub-strata is IA and then BA, e.g. an FSU identified as bothIA and BA was included in sub-stratum 1.
Sub-stratum with less than 20 FSU’s was merged withother sub-stratum under a working rule as given below:
Annex-I

SARVEKSHANA120
Sub-stratum 1 was merged with sub-stratum 2 if the latterwas already been formed; otherwise sub-stratum 1 wasmerged with sub-stratum 3.
4.0 Sample Size: All-India sample size for Central samplewas fixed at 14788 FSU’s for Central sample and 16220FSU’s for the State sample taking care of prevalentmatching pattern for the States as far as possible. Due tonon-availability of adequate number of FSU’s the Statesamples of Goa and Nagaland (Urban) were adjusted.The numbers of sample FSU’s allotted and surveyed bystate × sector for the central sample have been shown inSection two.
4.1 Allocation of Sample size (FSU’s) between ruraland urban sectors: The allocation of FSU’s between ruraland urban sectors was made in proportion to the numberof workers engaged in unorganized non-agriculturalenterprises as per EC ’98 (Census ’91 for Orissa andBihar) with 1.5 weightage to urban sector.
4.2 Allocation of FSU’s among strata / sub-strata:Allocations of FSU’s to strata / sub-strata in both ruraland urban sectors (except for Orissa, Bihar and specialurban strata in Karnataka) were made in proportion tothe number of non-agricultural workers in the unorganizedsector as per EC ’98.
For Orissa and Bihar rural, allocation was made to strata/sub-strata in proportion to non-agricultural workers asper population Census ’91. For urban strata of Orissaand Bihar, allocation was made in proportion to thenumber of FSU’s in the strata. Allocations to sub-stratawithin the urban stratum were done in proportion tonumber of FSU’s in the sub-strata with weights 2, 2 and1 for sub-stratum 1, 2 and 3 respectively.
For the special urban strata of Karnataka, stratumallocations were made in proportion to number of non-agricultural workers in the unorganised sector as perEC’98. But sub-stratum allocations were made in the samemanner as for urban sub-strata of Orissa and Bihar.
Allocation to any stratum / sub-stratum was adjusted toa multiple of 2 FSU’s. (When the proportional allocationturned out to be less than three, it was adjusted to 2. Whenthe allocation was greater than or equal to 3 but less than5, it was adjusted to 4 and so on.)
While allocating FSU’s to stratum / sub-stratum it was,however, ensured that each combination of stratum, sub-stratum and sub-sample was represented.
5.0 Selection of FSU’s: For sub-stratum 1of each stratumin rural / urban sector of each State / UT except urbansub-strata of Orissa and Bihar and all special strata /sub-strata relating to 66 towns of Karnataka, FSU’s wereselected by simple random sampling without replacement(SRSWOR). For all urban sub-strata of Orissa and Biharand all special strata / sub-strata relating to 66 towns ofKarnataka, FSU’s were selected circular systematically(CSS) with equal probability. For all other sub-strata inboth rural and urban sectors, FSU’s were selected by usingCircular Systematic Sampling (CSS) with Probabilityproportional to size (PPS), size being the number ofmanufacturing workers in the unorganized sector as perEC ’98. (For Orissa and Bihar rural, size was number ofmanufacturing workers as per census ’91). For an FSUwith no manufacturing worker, size 1 was assigned tothat FSU before drawing samples). However, somemanufacturing enterprises were found to have largenumber of workers as per EC ’98 frame even though theywere in the unorganised sector. Some adjustment to thesize of workers for such enterprises was, therefore, madebefore calculating the size of FSU’s. For this purpose,any unorganised manufacturing enterprise with more than200 workers was deemed to have a size equal to 200.Enterprise sizes were thereafter added up to get theFSU’size and sub-stratum / stratum size.
5.1 Sample FSU’s were drawn in the form of twoindependent sub-samples in both the sectors. However,for sub-strata 2 and 3 of both the sectors, except thosebelonging to urban sectors of Bihar & Orissa and 66 townsof Karnataka, a little modification in the usual procedurefor PPS scheme was made at the selection stage so thatrepetition of FSU within a sub-sample or between sub-samples could be avoided. The modification was asfollows:
In any cycle of CSS, if the selected FSU was found to bealready present in the sample (either in the first or in thesecond sub-sample), it was skipped and next cycle wasexecuted by adding the sampling interval in order to selecta fresh FSU. As a result, all the selected FSU’s in the twosub-samples taken together was distinct for the sub-stratum. In some sub-strata where there were some big-sized FSU’s, the procedure did not result in selection of
Annex-I

SARVEKSHANA 121
required number of distinct FSU’s because a situationwas encountered where the sample FSU’s were repeatedagain and again even after adding the sampling interval.In a few such cases, where fresh FSU was not found evenafter 20 cycles, the first unselected FSU obtained byscanning the sub-stratum from the top of the frame wasselected. In central sample, the selection of samples for1st sub-sample was completed first and then the FSU’s of2nd sub-sample were drawn. It may be noted that in viewof the above modification, the two sub-samples were nomore independent.
5.2 For uniform spread of field work over the surveyperiod all the sample FSU’s pertaining to a State / UTwere arranged, separately for central sample and statesample, first by stratum and then each stratum by sub-stratum and each sub-stratum by sub-sample and thensub-round numbers were assigned against sample FSU’sin the sequence 1, 2, 3, 4.
6.0 Formation of hamlet-groups / sub-blocks: Hamlet-groups / sub-blocks (h. g. / s. b. s) were formed in largeFSU’s by considering the population and enterprise criteriaas indicated below:
population no. of h. g. / s. b. s no. of non-agricultural no. of h. g. / s. b. s(P) to be formed enterprises (E) to be formed
(1) (2) (3) (4)
0 - 1200 1 0 - 120 1
1201 - 1600 4 121 - 160 4
1601 - 2000 5 161 - 200 5
2001 - 2400 6 201 - 240 6
and so on and so on
For rural areas of Himachal Pradesh, Sikkim and Poonch,Rajouri, Udhampur and Doda districts of J & K, numberof h. g. s to be formed in the village as per populationcriterion were 1 for P < 600, 4 for 601 ≤ P ≤ 800, 5 for801 ≤ P ≤ 1000 and so on. For enterprise criterion,procedure was not changed for the above areas.
The higher of the two values as per population andenterprise criteria (col. 2 and col. 4 above) were taken asthe number (D) of h. g. / s. b. s to be actually formed.Hamlet-group / sub-blocks were formed by more or lessequalizing population. Three h. g. / s. b. s were selected -one with the maximum number of DMEs (or withmaximum number of NDMEs if there was no DME orwith maximum number of OAMEs if there was no DME/NDME in the FSU) or with maximum percentage share
of population if there was no manufacturing enterprise inthe entire FSU, was always selected and termed asSegment 1; other two were selected circular systematicallywith equal probability and combined to form Segment 2.
7.0 Number of enterprises to be surveyed andprocedure of selection: Three second-stage strata wereformed for DME, NDME and OAME for each sampleFSU / segment. In an FSU at most 16 enterprises weresurveyed. When the frame was found to contain 16 orless of such enterprises all the available ones weresurveyed. However, when the frame was found to containmore than 16 such enterprises, a total of 16 enterprisesas given below were selected circular systematically withequal probability after arranging the frame enterprisesaccording to Broad Manufacturing Group (BMG) codes.
Number of sample enterprises to be selected in an FSU
Second-stage without hamlet-group / with hamlet-group / sub-block formationstratum sub-block formation Segment 1 Segment 2
(1) (2) (3) (4)
DME 8 6 2NDME 4 2 2OAME 4 2 2Total 16 10 6
Annex-I

SARVEKSHANA122
Broad manufacturing group (BMG) code: One of thecodes 1 to 6 as appropriate to the enterprise depending
upon its activity was assigned for each enterprise.
Broad manufacturing group (BMG) code
NIC ’98 codes BMG code NIC ’98 codes BMG code
15-16 1 23-28 417-18, 01405 2 29-36 5
19-22 3 37 6
8.0 Estimation Procedure
8.1 Notations:
s = subscript for sth stratumt = subscript for tth sub-stratum (t = 1, 2 or 3)m = subscript for sub-sample (m = 1, 2)i = subscript for ith village/block (FSU’s)1 = subscript for segment 12 = subscript for segment 2j = subscript for jth enterprise type (j =1 for
OAME; j =2 for NDME; j =3 for DME)k = subscript for kth sample enterprise under a
particular enterprise type for Sch.2.2 and kth
sample household for Sch.1.0D = total no. of h. g. / s. b. s formed in the sample
village/blockZ = total size of a stratum / sub-stratumz = size of village / block used for selectionn' = number of sample villages / blocks allotted for a
particular sub-sample.n = number of sample villages / blocks surveyed
including zero cases for a particular sub-sampleπ = inclusion probability for the sample FSU's of sub-
sample 1π' = inclusion probability for the sample FSU's of sub-
sample 2 given sub-sample 1E = total no. of enterprises listed for a particular
enterprise type in a segment of sample FSUe = total no. of enterprises surveyed for a particular
enterprise type in a segment of sample FSUx y = observed value of characters X, Y under
estimation
= estimate of population total of the characters X,Y
ystmijk
= observed value of the character Y for the kth
sample enterprise of the jth enterprise type be
X Y
longing to segment 1 of ith village / block (FSU’s)of mth sub-sample of the tth sub-stratum of sth
stratum.
8.2 Formulae for estimation for a particular stratum,sub-stratum and sub-sample:
i) Estimation formula for sub-stratum 1:
(t = 1; j = 1, 2 or 3), (m =1, 2) …… … (1)
ii) Estimation formula for sub-strata 2 & 3:
1) for all States except Orissa (urban) and Bihar (urban)and 66 towns of Karnataka:
a) for sub-sample 1:
(t = 2 or 3; j = 1, 2 or 3), (m =1) …… … (2)
b) for sub-sample 2:
where
(t = 2 or 3; j = 1, 2 or 3), (m =2)
])2
1([ˆ
1
1
2
1
22
21
1 1
1 ∑ ∑∑= ==
−+=jstm i
k
jstm i
k
jkstm ijstm i
jstm istm ijkstm i
stm j
i jstm i
jstm i
stm j
ststm j y
e
EDy
e
E
n
ZY
])2
1([
1ˆ1
1
2
1
22
21
1 1
1 ∑ ∑∑= ==
−+=jstmi
k
jstmi
k
jkstmijstmi
jstmistmijkstmi
stmj
i jstmi
jstmi
stmistmj
e ey
e
EDy
n
e
E
ð
Y
stm jstm jstm BAY +=ˆ , m= 2
])2
1([
1
1
2
1
22
21
1 1
1 ∑ ∑∑= ==
−+=jstmi
k
jstmi
k
jkstmijstmi
jstmistmijkstmi
stmj
i jstmi
jstmi
stmj
e ey
e
EDy
n
e
EA
Annex-I

SARVEKSHANA 123
])2
1([
1 1
1
2
1
22
21
1 1
1 ∑ ∑∑= ==
−+′
=jstmi
k
jstmi
k
jkstmijstmi
jstmistmijkstmi
stmj
i jstmi
jstmi
stmistmj
e ey
e
EDy
n
e
E
ð
B
(t = 2 or 3; j = 1, 2 or 3), (m =1)
…… … ……. (3)
2) for Orissa (urban) and Bihar (urban) and 66 towns ofKarnataka:
(t = 2 or 3; j = 1, 2 or 3), (m =1,2) …… … (4)
iii) Estimate for stratum:
for jth enterprise type,(j = 1, 2 or 3), (m =1,2) … (5)
for all enterprises, (m =1, 2)…….. . (6)
Note:i) For rural sector of Orissa and Bihar, there were
only two sub-strata i.e. t = 1 or 2,ii) For all sub-strata in the urban sector of Bihar,
Orissa and special strata of Karnataka and forsub-stratum 1 in both rural and urban sector ofall other States / UTs, stratum / sub-stratum size(Z
st) was the number of FSU’s in the stratum /
sub-stratum.
8.3 Combined Estimates for aggregate:
Combined estimate for stratum s (denoted by scY ) of twosub-samples was obtained as:
….. …… (7)
])2
1([ˆ
1
1
2
1
22
21
1 1
1 ∑ ∑∑= ==
−+=jstmi
k
jstmi
k
jkstmijstmi
jstmistmijkstmi
stmj
i jstmi
jstmi
stmj
ststmj
e ey
e
EDy
n
e
E
n
ZY
∑==
3
1
ˆˆt
stmjsmj YY
∑==
3
1
ˆˆj
smjsm YY
∑=
=2
1
ˆ21ˆ
m
smcs YY
8.4 Combined Estimate of aggregates for Region /State/ UT / all-India:
The combined estimate cY at the Region / State / UT /all-India level was obtained by summing the stratumestimates scY over all the strata belonging to the region/State / UT / all-India ie
…… …… (8)
8.5 Estimates of ratios:
Let cY and cX be the Region / State / UT / all-India
level combined estimates for two aggregate characters X& Y respectively.
Then combined ratio estimate cR of the ratio X
YR=
was given by
…… …… (9)
∑=s
csc YY ˆˆ
cX
cYcR
ˆ
ˆˆ =
Annex-I

SARVEKSHANA124
9.0 Number of first stage units surveyed: The numberof villages and Urban Frame Survey blocks (i.e. the first
Statement (A): Number of first stage units (villages/UFS blocks) allotted and surveyed by State / UT
State / number of first stage units
UT rural urban combined
allotted surveyed allotted surveyed allotted surveyed
(1) (2) (3) (4) (5) (6) (7)
Andhra Pradesh(AP) 456 456 536 536 992 992Arunachal Pradesh(ARP) 96 96 40 40 136 136Assam(ASM) 292 283 196 194 488 477Bihar(BHR) 370 370 362 362 732 732Goa(GOA) 20 20 36 36 56 56
Gujarat(GUJ) 184 184 480 480 664 664Haryana(HAR) 116 115 172 172 288 287Himachal Pradesh(HP) 172 167 140 140 312 307Jammu & Kashmir(J&K) 180 128 364 216 544 344Karnataka(KTK) 220 220 356 356 576 576
Kerala(KER) 292 292 252 252 544 544Madhya Pradesh(MP) 260 260 536 536 796 796Maharashtra(MAH) 288 288 1024 1024 1312 1312Manipur(MNP) 72 72 120 120 192 192Meghalaya(MEG) 64 64 80 80 144 144
Mizoram(MIZ) 44 44 120 120 164 164Nagaland(NGL) 56 56 56 56 112 112Orissa(ORS) 264 264 248 248 512 512Punjab(PUN) 160 160 400 400 560 560Rajasthan(RAJ) 244 243 452 452 696 695
Sikkim(SKM) 44 43 20 20 64 63Tamil Nadu(TN) 392 392 664 664 1056 1056Tripura(TRP) 152 117 136 136 288 253Uttar Pradesh(UP) 462 462 1045 1045 1507 1507West Bengal(WB) 372 372 580 580 952 952A & N. Islands(A&N) 40 39 24 24 64 63Chandigarh(CND) 4 4 20 20 24 24D & N Haveli(DNH) 8 8 8 8 16 16Daman & Diu(D&D) 8 8 8 8 16 16Delhi(DEL) 8 8 136 136 144 144
Lakshadweep(LKD) 4 4 12 12 16 16Pondicherry(PND) 12 12 20 20 32 32Jharkhand(JRK) 198 193 262 262 460 455Chhattisgarh(CTG) 80 80 116 116 196 196Uttaranchal(UTC) 62 62 71 71 133 133
all-India(ALL) 5696 5586 9092 8942 14788 14528
stage units) allotted and actually surveyed in differentState / UTs is given in the following Statement (A).
Annex-I

SARVEKSHANA 125
It may be observed that about 40 % of the total FSUswere surveyed from the five states namely, Uttar Pradesh,Maharashtra, Tamil Nadu, Andhra Pradesh and WestBengal.
9.1 Number of enterprises surveyed by industries : Thefollowing Statement (B) gives information on the num-ber of enterprises surveyed industry-wise by sector(rural,urban and combined) and by type of enterprise (OAME,NDME and DME).
Statement (B): Number of enterprises surveyed in different industries, by sector and type of enterprise
number of enterprises surveyed at all-India level
NIC sector type of enterprise
1998 rural urban combined OAME NDME DME all
(1) (2) (3) (4) (5) (6) (7) (8)
01405 29 82 111 75 23 13 11115 11989 12425 24414 16818 5418 2178 2441416 4039 4340 8379 7738 226 415 837917 8440 14250 22690 14186 4285 4219 2269018 10055 19297 29352 22027 6217 1108 29352
19 639 1945 2584 1640 625 319 258420 11843 6700 18543 15273 2440 830 1854321 131 1025 1156 675 229 252 115622 222 2716 2938 902 1486 550 293823 37 42 79 31 24 24 79
24 585 1553 2138 1341 301 496 213825 396 1355 1751 628 561 562 175126 5003 3075 8078 5129 1125 1824 807827 172 733 905 331 359 215 90528 2666 6284 8950 3900 3623 1427 895029 533 2195 2728 898 1004 826 2728
30 0 16 16 0 6 10 1631 157 870 1027 375 372 280 102732 14 89 103 20 35 48 10333 20 185 205 65 76 64 20534 70 403 473 66 179 228 47335 50 335 385 91 113 181 385
36 3626 11600 15226 9471 4199 1556 1522637 54 209 263 150 68 45 263
all 60770 91724 152494 101830 32994 17670 152494
It may be observed that a total of 152494 enterprises weresurveyed all over India. Out of them about 40% of theseenterprises were in the rural sector and the remaining 60%in the urban sector. Also out of all the enterprises surveyed,66.78% enterprises were OAMEs, 21.64% were NDMEsand remaining 11.58% were DMEs.
9.2 Number of enterprises surveyed in different States/UTs :Similarly, Statement ( C) gives information on the numberof enterprises surveyed in each State / UT by sector andby type of enterprise (OAME, NDME and DME).
Annex-I

SARVEKSHANA126
Statement ( C): Number of enterprises surveyed in different State / UTs by sector and type of enterprise
number of enterprisesState / UT sector type of enterprise
rural urban combined OAME NDME DME all
(1) (2) (3) (4) (5) (6) (7) (8)
Andhra Pr. 6236 5985 12221 8758 2113 1350 12221Arunachal Pr. 62 36 98 47 43 8 98Assam 2668 1642 4310 3214 915 181 4310Bihar 4700 3486 8186 6954 1012 220 8186Goa 241 293 534 278 157 99 534
Gujarat 1609 5077 6686 3889 1410 1387 6686Haryana 863 1936 2799 1577 852 370 2799Himachal Pr. 1372 1222 2594 1719 682 193 2594Jammu & Kashmir 1798 2257 4055 2990 823 242 4055Karnataka 2430 3744 6174 4236 1170 768 6174
Kerala 4157 2862 7019 4036 2050 933 7019Madhya Pr 2051 5150 7201 5653 1057 491 7201Maharashtra 3100 9693 12793 7206 3121 2466 12793Manipur 749 1618 2367 2015 265 87 2367
Meghalaya 497 240 737 409 267 61 737Mizoram 305 586 891 646 218 27 891Nagaland 555 598 1153 912 209 32 1153Orissa 2925 1841 4766 4026 572 168 4766Punjab 1656 4850 6506 3485 1986 1035 6506Rajasthan 2181 4854 7035 5104 1357 574 7035
Sikkim 111 105 216 135 72 9 216Tamil Nadu 5043 8213 13256 8077 3056 2123 13256Tripura 1613 779 2392 1769 584 39 2392Uttar Pradesh 4451 12751 17202 10811 4260 2131 17202West Bengal 5284 6544 11828 7402 2842 1584 11828
A & N Islands 201 171 372 175 140 57 372Chandigarh 46 195 241 81 78 82 241D & N Haveli 102 73 175 104 54 17 175Daman & Diu 98 49 147 89 27 31 147Delhi 83 1327 1410 351 533 526 1410
Lakshadweep 12 43 55 40 12 3 55Pondicherry 132 236 368 206 102 60 368Jharkhand 2142 1495 3637 3121 421 95 3637Chhattisgarh 824 1156 1980 1566 269 145 1980Uttaranchal 473 617 1090 749 265 76 1090
all-India 60770 91724 152494 101830 32994 17670 152494
It may be observed that the largest number of sampleenterprises were surveyed from Uttar Pradesh followed
by Tamil Nadu, Maharashtra, Andhra Pradesh and WestBengal respectively.
Annex-I

SARVEKSHANA 127
ANNEX -II
CONCEPTS AND DEFINITIONS

SARVEKSHANA128
Concepts and Definitions
1.1 Enterprise: An enterprise is an undertaking engagedin the production and / or distribution of some goods and/ or services meant mainly for the purpose of sale, whetherfully or partly. An enterprise may be owned and operatedby a single household or by several households jointly ona partnership basis, or by an institutional body.
1.2 Own-account enterprise: An enterprise, which isrun without any hired worker employed on a fairly regularbasis, is termed an own account enterprise. If such anenterprise is engaged in manufacturing and/or repairingactivities, it is termed as an Own Account ManufacturingEnterprise (OAME).
1.3 Establishment : An enterprise which is employingat least one hired worker on a fairly regular basis istermed as an establishment. Paid or unpaid apprentices,paid household member/servant/resident worker in anenterprise are considered hired workers. Establishmentshave further been categorised into two parts: non-directoryand directory.
1.4 Non-directory establishment: An establishmentemploying less than six workers (household and hiredworkers taken together) is termed non-directoryestablishment. If such an establishment is engaged inmanufacturing activities, it is termed Non-DirectoryManufacturing Establishment (NDME).
1.5 Directory establishment: A directory establishmentis an establishment which has employed six or moreworkers (household and hired workers taken together).If such an establishment is engaged in manufacturingactivities, it is termed Directory ManufacturingEstablishment (DME).
1.6 Worker : A worker is defined as one who participateseither full time or part time in the activity of the enterprise.The worker may serve the enterprise in any capacity -primary or supervisory. He/she may or may not receivewages / salaries in return to his / her work incidental to or
connected with the entrepreneurial activity. A worker neednot mean that the same person is working continuously;it only refers to a position. Persons working for less thanor equal to half of the normal working hours of theenterprise on a fairly regular basis are considered as parttime workers. Full time workers are those who work formore than half of the period of normal working hours ofthe enterprise on a fairly regular basis. Two part-timeworkers in an enterprise are counted as 2 and not 1.
1.7 Working owner : The owner who personally worksin the proprietary or partnership enterprises on a fairlyregular basis is called working owner. In fact, in most ofthe own-account enterprises the owner himself/ herselfmanages all activities of the enterprise without the helpof anyone (on a fairly regular basis). In the case ofpartnership enterprises, if only one partner or some ofthe partners or all the partners work in the enterprise on afairly regular basis then they are considered as ‘workingowners’.
1.8 Hired worker : A hired worker is a person employeddirectly or through any agency on payment of regularwage / salary in cash or kind. Apprentices, paid or unpaid,are to be treated as hired workers. Paid household workers,servants and resident workers of the enterprise are alsoto be considered as hired workers.
1.9 Other worker / helper: This includes all personsbelonging to the household of the proprietor or householdsof the partners who are working in or for the enterprisewithout regular salary or wages. Persons working asexchange labourer in the enterprise without salary orwages will also be covered in this category. All unpaidhousehold workers / helpers who are associated with theactivities of the enterprise during the reference month areconsidered in this category.
1.10 Fairly regular basis: The term “fairly regular basis”means the major part of the time when operation(s) of anenterprise are carried out during a reference period.
Annex-II

SARVEKSHANA 129
1.11 Mixed activity : There are enterprises which carryout a number of activities simultaneously. For example,a grocery shop owner may also sell oil from his own oil-mill, a doctor may have a medical shop attached to hisdispensary, a restaurant may run an STD booth in itspremises, etc. Each such activity was treated as a separateenterprise if information for them was separatelyavailable. If the accounts were not separable then the datapertained to the enterprise as a whole and the enterprisewas classified as having mixed activities and the activitiesof such enterprises a mixture of NIC’s. The appropriateNIC in such cases was determined on the basis of majoractivity. Major activity refers to the activity which yieldedmaximum income/turnover/employment. The abovecriteria was applied in the given order, i.e., income first,then turnover and then employment, to determine the majoractivity. The activities may be mixed at any level of NIC,but for the present survey an enterprise was consideredto have mixed activities if its activities were different at2-digit level of NIC-1998.
1.12 Multiple activity : Since many of the entrepreneursbelonging to the unorganised sector operate at small ormarginal levels, the phenomenon of carrying out morethan one activity simultaneously or at different points oftime is quite prevalent. If the activities were carried outat one point of time at the same location and theinformation was not separately available, then it was takenas “mixed activity”. Total number of economic activitiescarried out by the entrepreneur during the last 365 daysis the total number of multiple activities. Some examplesof multiple activities are: i) a person carrying outagricultural activity at sowing / harvesting season andrunning a shop at the same time or at other times, ii) alady working as regular wage / salary earner and alsorunning a shop in the evenings, etc. However, amanufacturing enterprise manufacturing woollengarments before winter and cotton clothes before summerwas not considered as carrying out multiple activities. Itmay be noted that multiple activity relates to the variouseconomic activities carried out by the entrepreneurwhereas mixed activity is carried out by an enterprise.
1.13 Fixed assets: Fixed assets are assets held for thepurpose of producing or providing goods or services andthey are not held for resale in the normal course ofentrepreneurial activities. These cover all goods, new orused, that have a normal economic life of more than oneyear from the date of purchase.
1.14 Land and Building: Land means the land on whichthe enterprise is accommodated together with thesurrounding area, which is used for the enterprise. Thisalso includes improvement to land. However, if only aportion of the land belonging to the residence of ahousehold is utilised for the enterprise, only that portionof the land is considered as capital assets for the enterprise.Land owned with permanent heritable possession with orwithout right to transfer the title comes under this category.Land held on long-term lease, say, 30 years or more, isalso treated as land owned. Building is the structure,where activities of the enterprise are undertaken. Thisalso includes all other structures like shed, house, portionsof a house or other structure, building under constructionand other conveniences in which the activities of theenterprise are carried out. This also includes otherconstructions such as passage, wall, water tank, sewerage,tube-well, etc.
1.15 Plant and machinery: Plant is generally the namegiven to an assembly of machinery or equipment or devicesinstalled for the operation of entrepreneurial activities.Machinery means an implement or mechanical device usedin the entrepreneurial activities. These are assets of durablenature and can be easily identified.
1.16 Transport equipment: All vehicles, power-drivenor man / animal-driven, used for transporting persons,goods and materials by the enterprise in connection withits activity are covered in this category. Animals, if usedfor drawing vehicles or carrying loads, will be treated aspart of transport equipment.
1.17 Tools and other fixed assets: Tools refer to smallloose implements, generally held in hand for operationand having normal life of more than one year. Otherfixed assets refer to other durable equipment which areused for the entrepreneurial activity either directly orindirectly. These include furniture, fixtures, laboratoryequipment, office equipment etc. Livestock used in oil-mill is also covered under this category.
1.18 Net additions to the fixed assets during the last365 days: Net addition to fixed assets was obtained bysubtracting depletion of assets from the additions madeduring the last 365 days. Addition to the fixed assets couldbe made through purchase (new or used) or through ownconstruction. Improvements on land, new constructionof building, shed, structure, as well as assets produced
Annex-II

SARVEKSHANA130
on own accountduring the last 365 days were consideredas additions to the fixed assets. Depletion of assets wasobtained by considering the assets sold and discardedduring the last 365 days. The value of assets disposed ofin any manner other than sale, were treated as value ofassets discarded. Besides obsolescence (gone out of use)of an asset, this included loss due to theft, damage,accident etc.
1.19 Loan: Any borrowing in cash or kind to be repaid incash or kind is termed as loan. Loans taken for the purposeof utilising the same in the entrepreneurial activities of anenterprise were considered even if such loans were usedfor other purposes. On the other hand, loans taken forother purposes but ultimately used in the enterprise wereexcluded.
1.20 Operating expenses: The total of values of rawmaterials, electricity, fuel, lubricants and auxiliarymaterials consumed; cost of maintenance, servicespurchased and other expenses incurred during thereference period by an enterprise was considered as‘operating expenses’.
1.21 Receipts: The sale value of products and by-productsmanufactured by an enterprise together with the value ofservices rendered to other concerns and other receiptsincidental to entrepreneurial activities are considered as‘total receipts’.
1.22 Gross value added: Gross value added representsthat part of production, which is the actual contributionof an enterprise to the economy. Gross value added iscalculated by deducting ‘total operating expenses’ fromthe value of ‘total receipts’ during the reference period.
1.23 Perennial enterprises: Enterprises, which usuallyoperate more or less regularly throughout the year, arecalled perennial enterprises.
1.24 Seasonal enterprises: Seasonal enterprises are thosethat are usually run in a particular season or in fixedmonths of a year.
1.25 Casual enterprises: Casual enterprises are thosewhich operate occasionally (may be disjoint periods oftime throughout the year) but total number of daysoperated in the last 365 days is 30 days or more.
2.1 List of abbreviations used
NSSO -National Sample Survey Organisation
CSO -Central Statistical Organisation
FOD- Field Operations Division
UT -Union Territories
EC –Economic Census
OAE –Own Account Enterprise
DE –Directory Establishment
NDE – Non-Directory Establishment
OAME -Own Account Manufacturing and repairingEnterprise
DME – Directory Manufacturing and repairingEstablishment
NDME –Non-Directory Manufacturing and repairingEstablishment
BMG –Broad Manufacturing Group
FSU –First stage unit
USU – Ultimate stage unit
UFS- Urban Frame Survey
NIC –National Industrial Classification
GVA –Gross value added
2.2 Considering the estimated number of enterprises, theterm ‘major States’, is used to refers to the followingStates: Andhra Pradesh, Assam, Bihar, Gujarat, Haryana,Jammu and Kashmir, Karnataka, Kerala, MadhyaPradesh , Maharashtra , Orissa , Punjab, Rajasthan, TamilNadu, Uttar Pradesh, West Bengal, Jharkhand,Chhatisgarh and Uttaranchal. While discussing the resultsand the graphs the names of these States are mentioned,at times, using their abbreviated forms.
Annex-II

SARVEKSHANA 131
2.3 List of States/UTs and their abbreviations:
Andhra Pradesh (AP)Arunachal Pradesh (ARP)Assam (ASM)Bihar (BHR)Goa (GOA)Gujarat (GUJ)Haryana (HAR)Himachal Pradesh (HP)Jammu & Kashmir (J&K)Karnataka (KTK)Kerala (KER)Madhya Pradesh (MP)Maharashtra (MAH)Manipur (MNP)Meghalaya (MEG)Mizoram (MIZ)Nagaland (NGL)
Orissa (ORS)Punjab (PUN)Rajasthan (RAJ)Sikkim (SKM)Tamil Nadu (TN)Tripura (TRP)Uttar Pradesh (UP)West Bengal (WB)A & N. Islands (A&N)Chandigarh (CND)D & N Haveli (DNH)Daman & Diu (D&D)Delhi (DEL)Lakshadweep (LKD)Pondicherry (PND)Jharkhand (JRK)Chhattisgarh (CTG)Uttaranchal (UTC)All-India (ALL or all)
Annex-II

ANNEX -III
FACSIMILE OF UNORGANISEDMANUFACTURING SCHEDULE (Sch. 2.2)

SARVEKSHANA134
GOVERNMENT OF INDIARURAL NATIONAL SAMPLE SURVEY ORGANISATION CENTRALURBAN SOCIO-ECONOMIC SURVEY STATE
FIFTY SIXTH ROUND (JULY 2000 - JUNE 2001)SCHEDULE 2.2: UNORGANISED MANUFACTURING
[0] descriptive identification of sample enterprise
1. state / u.t.: 6. ward /inv. unit / UFS block:
2. district: 7. name of owner:
3. tehsil / town* 8. name of informant:
4. village name: 9. name and address of the enterprise:
5. serial no. of hamlet:
[1] identification of sample enterprise / establishment
item Item code item item codeno. no.
1. round number 5 6 12. serial no. of sample village / block
2. schedule number 2 2 13. segment number (1 / 2)
3. sample (central-1, state-2) 14. enterprise type
4. sector (rural - 1, urban - 2) (OAME-1, NDME –2, DME – 3)
5. state – region 15. sample enterprise no.
6. district code 16. informant code
7. stratum no. 17. response code
8. sub-stratum 18. survey code
9. sub – round 19. reason for substitution of original
10. sub – sample enterprise (code)
11. FOD sub-region
CODES FOR BLOCK 1
item 16 : informant code : owner/partner – 1, manager – 2, others – 9
item 17 : response code (to be filled up after filling up the entire schedule):informant : co-operative and capable - 1, co-operative but not capable - 2, busy - 3, reluctant - 4,others – 9
item 18 : survey code: original enterprise surveyed - 1, substitute surveyed - 2, casualty – 3
item 19 : reason for substitution of original enterprise: informant : busy – 1, not available – 2, non - cooperative – 3, others –9
* Tick mark (√√√√√) may be put in appropriate place.
**
Annex-III
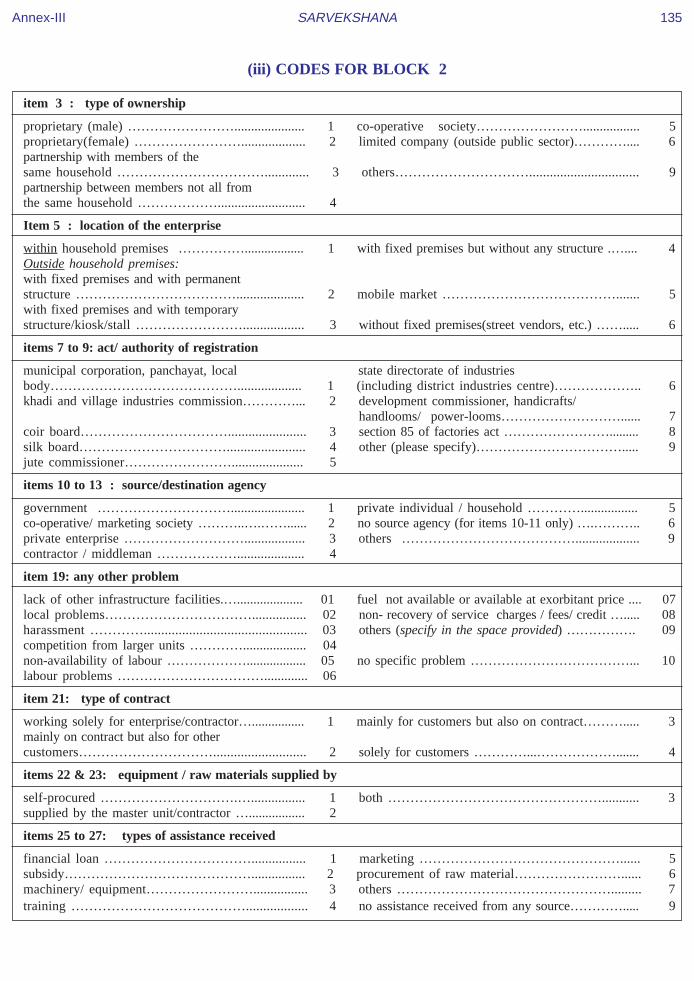
SARVEKSHANA 135
(iii) CODES FOR BLOCK 2
item 3 : type of ownership
proprietary (male) ……………………..................... 1 co-operative society……………………................. 5proprietary(female) ……………………................... 2 limited company (outside public sector)………….... 6partnership with members of thesame household ……………………………............. 3 others…………………………................................ 9partnership between members not all fromthe same household ……………….......................... 4
Item 5 : location of the enterprise
within household premises …………….................. 1 with fixed premises but without any structure .….... 4Outside household premises:with fixed premises and with permanentstructure ……………………………….................... 2 mobile market …………………………………....... 5with fixed premises and with temporarystructure/kiosk/stall …………………….................. 3 without fixed premises(street vendors, etc.) ……..... 6
items 7 to 9: act/ authority of registration
municipal corporation, panchayat, local state directorate of industriesbody……………………………………................... 1 (including district industries centre)……………….. 6khadi and village industries commission…………... 2 development commissioner, handicrafts/
handlooms/ power-looms………………………...... 7coir board……………………………....................... 3 section 85 of factories act ……………………......... 8silk board……………………………....................... 4 other (please specify)……………………………..... 9jute commissioner……………………..................... 5
items 10 to 13 : source/destination agency
government …………………………...................... 1 private individual / household …………................. 5co-operative/ marketing society ………..….……...... 2 no source agency (for items 10-11 only) ….……….. 6private enterprise ……………………….................. 3 others …………………………………................... 9contractor / middleman ……………….................... 4
item 19: any other problem
lack of other infrastructure facilities.….................... 01 fuel not available or available at exorbitant price .... 07local problems……………………………................ 02 non- recovery of service charges / fees/ credit …..... 08harassment …………............................................... 03others (specify in the space provided) ……………. 09competition from larger units …………................... 04non-availability of labour ……………….................. 05 no specific problem ………………………………... 10labour problems ……………………………............. 06
item 21: type of contract
working solely for enterprise/contractor…................ 1 mainly for customers but also on contract………..... 3mainly on contract but also for othercustomers…………………………........................... 2 solely for customers …………...………………....... 4
items 22 & 23: equipment / raw materials supplied by
self-procured ………………………….…................ 1 both …………………………………………........... 3supplied by the master unit/contractor …................. 2
items 25 to 27: types of assistance received
financial loan ……………………………................ 1 marketing ………………………………………...... 5subsidy……………………………………................ 2 procurement of raw material……………………...... 6machinery/ equipment……………………................ 3 others …………………………………………......... 7training ………………………………….................. 4 no assistance received from any source…………..... 9
Annex-III

SARVEKSHANA136
[2] particulars of operation and background information
1. description of activity:
5-digit code as per NIC 1998
2. nature of operation (perennial – 1, seasonal – 2, casual – 3)
3. type of ownership (code)
4. whether accounts maintained? (yes - 1, no - 2)
5. location of the enterprise (code)
6. registered under any act/ authority? (yes - 1, no - 2)
7.
8.
9.
10.
11.
12.
13.
14. non-availability of electricity connection(yes – 1, no – 2)
15. power-cut (yes – 1, no – 2)
16. shortage of capital (yes – 1, no – 2)
17. non-availability of raw materials(yes–1, no – 2)
18. marketing of product (yes – 1, no – 2)
19. any other problem (code)
20. does the enterprise undertake any work on contract basis? (yes – 1, no – 2)
21. type of contract (code)
22. equipment supplied by (code)
23. if ‘yes’ in item 20 raw materials supplied by (code)
24. design specified by contractor?(yes –1, no – 2 )
25.
26. types of assistance received during the last five years (code)
27. (maximum of three codes may be given in descendingorder of the importance of assistance)
28. whether mixed activity? (yes – 1, no – 2)
29. number of other economic activities undertaken during last 365 days
30. status of the enterprise over the last 3 years (expanding – 1, stagnant – 2,contracting – 3, operated for less than 3 years - 9 )
31. number of months (in whole number) operated during the last 365 days
if ‘yes’ in item 6 registered under (code)(codes for a maximum of three registration agencies may be given)if code is 9, please specify the registration agency:
source agency for purchase of basic inputs (code)(codes for maximum of two agencies in descending orderof purchase value may be given)
destination agency for sale of final product/service (code)(codes for maximum of two agencies in descendingorder of sale value may be given)
nature of problems faced,if any, during the last 365 days
Annex-III

SARVEKSHANA 137
[3] principal operating expenses during the reference month (Rs. in whole number)
manufacturing activity (NIC-98 codes 01405, 15111 to 37200 and code 18105)
Item Raw materials consumed ASICC code unit of quantity valueno. quantity (in (Rs)
(code) wholeno.)
(1) (2) (3) (4) (5) (6)
301.
302.
303.
304.
305.
306. other raw materials
309. total (items 301 to 306)
Trading and other activities *
commodities purchased oritems consumed
311.
312. other items
319. total (items 311 + 312)
* NIC-98 divisions 45 to 74, 80 to 93
Annex-III

SARVEKSHANA138
(iv) CODES FOR BLOCKS 3 AND 4
col. (4): unit of quantity codeno. ………… 01 pair………… 08kg………….. 02 gram……… 09tonne………. 03 carat……… 10metre………. 04 Kwh………. 11sq. metre…… 05 no. in ‘00’…. 12cu. metre…… 06 no. in ‘000’… 13litre………… 07 others 19
[3.1] other operating expenses during the reference month : all activities (Rs. in whole number) [ The overallexpenses of the enterprise will be recorded here. If some of the items have already been covered under specific activitiesin block 3, they should not be reported here again.]
Item item valueno. (Rs)
(1) (2) (3)
321. electricity charges
322. fuel and lubricant
323. raw materials consumed for own construction of building,furniture and fixtures (including labour charges)
324. building
325. furniture and fixtures
326. minor repair and maintenance of machinery
327. transport equipment
328. other fixed assets
331. rent payable on machinery and equipment (other than land andbuilding)
332. service charges for work done by other concerns (contract, sub-contract,legal, audit, advertising and other accounting services, warehousingexpenses, commission expenses, etc.)
333. travelling, freight and cartage (transport) expenses
334. communication expenses (telephone, telegram, fax , postal, courier,e-mail, etc.)
335. consumable stores, packing materials, etc.
336. paper, printing and stationery expenses
337. license fees, cess charged by local bodies, other local rates (exciseduties and other indirect taxes are not to be included)
338. other expenses
339. total (items 321 to 338)
Annex-III

SARVEKSHANA 139
[4] principal receipts during the reference month (Rs. in whole number)
manufacturing activity (NIC-98 codes 01405, 15111 to 37200 and code 18105)
Item products and by-products ASICC unit of quantity value*no. manufactured code quantity (in whole (Rs)
(code) no.)
(1) (2) (3) (4) (5) (6)
401.
402.
403.
404.
405.
406. other products and by-products
409. total (items 401 to 406)
411. opening stock of semi-finished goods
412. closing stock of semi-finished goods
413. changes in stock of semi-finished goods (item 412 - item 411)[put (-) sign in case of negative value]
419. total (item 409+item 413)
*gross sale value / gross market value
[4] Principal receipts during the reference month (Rs. in whole number) (continued)
Trading and other activities*
item item valueno. (Rs)
(1) (2) (6)
trading
421. commodities sold
422. opening stock of trading goods
423. closing stock of trading goods
424. change in stock of trading goods (item 423-item 422)put (-) sign in case of negative value
429. total (item 421+ item 424)
other activities
431. receipts from other activities
439. total (item 429 + item 431)
* NIC-98 divisions 45 to 74, 80 to 93) NB: Cols. (3) to (5) are not applicable for this sub-block
Annex-III

SARVEKSHANA140
[4.1] other receipts during the reference month : all activities (Rs. in whole number)(The overall receipts of the enterprise will be recorded here. If some of the items have already been coveredunder specific activities in block 4, they should not be reported here again.)
item main items valueno. (Rs)
(1) (2) (3)
441. receipts from services provided to others including commission charges
442. market value of own construction of building, furniture and fixtures
443. value of consumption of goods /services produced or traded for own use of the owneror employees (at owner’s cost)
444. rent receivable on plant & machinery and other fixed assets
445. funding / donations received (including recurring govt. grants)
446. other receipts
449. total (items 441 to 446)
[5] calculation of gross value added for the reference month (Rs. in whole number)
Item items Valueno. (Rs)
(1) (2) (3)
501. total operating expenses: [items (309+319+339)]
502. distributive expenses, if any
503. total receipts: [items( 419+439+449) ]
509. gross value added (item 503 - item 502 - item 501)[put (-) sign in case of negative value]*
*in case of negative value added give reasons in blocks 13 / 14 after deep probing.
[6] employment particulars of the enterprise during the reference month
Serial average number of workers
no. type of worker full time part time total
female male female male (cols. 3 to 6)
(1) (2) (3) (4) (5) (6) (7)
1. working owner
2. hired worker
3. other worker / helper
4. total (1 to 3)
Annex-III

SARVEKSHANA 141
[7] compensation to workers during the reference month
serial type of emoluments valueno. (Rs)
(1) (2) (3)
1. salary / wages, allowances and other individual benefits (cash & kind including bonus,retirement benefits etc. apportioned for the month)
2. imputed value of group benefits for the month (including employer’s contribution towardscanteen, sports, insurance, etc.)
3. total emoluments (items 1 and 2)
[8] fixed assets owned and hired
serial type of assets market value of assets *net additions monthly rentno. (Rs) as on the date of during last 365 payable on
survey days hired assets
owned hired (Rs) (Rs)
(1) (2) (3) (4) (5) (6)
1. land and building
2. plant and machinery
3. transport equipment
4. tools and other fixed assets
5. total (1 to 4)
*net additions to owned assets to be reported
Annex-III

SARVEKSHANA142
[9] loan outstanding as on the date of survey (only loans taken for enterprise to be considered)
Serial source of loan amount interest payableno. (Rs) during the
reference month(Rs)
(1) (2) (3) (4)
1. central and state level term lending institutions,government (central, state, local bodies), banks & societies(public sector, commercial, co-operative)
2. other institutional agencies
3. money lenders
4. business partner (s)
5. suppliers / contractors
6. friends and relatives
7. others
8. total (1 to 7)
[10] factor incomes of the enterprise
serial item monthly valueno. (Rs)
(1) (2) (3)
1. emoluments (item 3, col.3 of block 7)
2. rent payable (item 1, col.6 of block 8)
3. interest payable (item 8, col. 4 of block 9)
4. net surplus (including home consumption of raw materials / goods /services produced or traded by the enterprise)
5. total (1 to 4)
[11] investigator’s perception
1. does the investigator feel that there is any underreporting of netsurplus (block 10, item 4)? (yes-1, no-2)
if yes in item 1 above,net surplus of the enterprise during the reference month lies between
2.1 lower value (Rs)
2.2 higher value (Rs)
Annex-III

SARVEKSHANA 143
○
○
○
○
○
○
○
○
○
○
○
○
○
○
○
○
○
○
○
○
○
○
○
○
○
○
○
○
○
○
○
○
○
[12] particulars of field operation
sl. particulars investigator assistant superintendentno. superintendent
(1) (2) (3) (4) (5)
1 (i) employee’s name(block letters)
(ii) employee’s code
2 total time taken to canvassSch. 2.2 (minutes)
3 date (s) of D D M M Y Y D D M M Y Y D D M M Y Y
(i) survey / inspection
(ii) receipt
(iii) scrutiny
(iv) despatch
4 signature
[13] remarks by investigator [14] comments by supervisory officer(s)
○
○
○
○
○
○
○
○
○
○
○
○
○
○
○
○
○
○
○
○
○
○
○
○
○
○
○
○
○
○
○
○
○
○
○
○
○
○
○
○
○
○
○
○
○
○
○
○
○
○
○
○
○
○
○
○
○
○
○
○
○
○
○
○
○
○
Annex-III

ANNEX-IV
APPENDIX TABLES (1 – 16)

146 SARVEKSHANA
Table 1: Sample and estimated number of unorganised manufacturing enterprises by enterprise type andindustry (NIC Code)
rural
industry OAME NDME DME all(NIC sample estimated sample estimated sample estimated sample estimatedCode) (in ‘00s) (in ‘00s) (in ‘00s) (in ‘00s)
(1) (2) (3) (4) (5) (6) (7) (8) (9)
01405 16 18 5 2 8 1 29 21
15 8952 21043 1998 1906 1039 658 11989 23607
16 3526 16159 154 127 359 196 4039 16482
17 6249 15520 1113 922 1078 453 8440 16894
18 8464 15457 1491 1201 100 55 10055 16712
19 565 876 61 32 13 7 639 915
20 10783 24024 799 562 261 78 11843 24664
21 84 252 14 4 33 6 131 263
22 77 138 117 75 28 11 222 224
23 19 22 9 24 9 5 37 51
24 349 902 58 30 178 141 585 1073
25 187 246 85 54 124 43 396 344
26 3310 5942 443 346 1250 579 5003 6868
27 98 112 47 17 27 14 172 143
28 1779 3253 724 407 163 48 2666 3707
29 329 730 127 65 77 18 533 813
30 - - - - - - - -
31 82 180 37 31 38 12 157 223
32 4 6 5 2 5 2 14 10
33 7 9 4 5 9 1 20 15
34 9 25 23 6 38 6 70 36
35 27 31 15 17 8 3 50 50
36 2617 5573 765 460 244 133 3626 6166
37 35 65 9 0 10 1 54 66
all 47568 110582 8103 6295 5099 2469 60770 119346
Annex-IV

SARVEKSHANA 147
Table 1: Sample and estimated number of unorganised manufacturing enterprises by enterprise type andindustry (NIC Code)
urban
industry OAME NDME DME all(NIC sample estimated sample estimated sample estimated sample estimatedCode) (in ‘00s) (in ‘00s) (in ‘00s) (in ‘00s)
(1) (2) (3) (4) (5) (6) (7) (8) (9)
01405 59 36 18 7 5 1 82 43
15 7866 4524 3420 1578 1139 404 12425 6506
16 4212 4515 72 28 56 14 4340 4557
17 7937 5221 3172 1128 3141 889 14250 7237
18 13563 8709 4726 2196 1008 479 19297 11384
19 1075 527 564 212 306 106 1945 845
20 4490 2659 1641 627 569 167 6700 3454
21 591 436 215 114 219 77 1025 628
22 825 436 1369 606 522 174 2716 1216
23 12 6 15 10 15 2 42 18
24 992 961 243 91 318 78 1553 1129
25 441 250 476 222 438 137 1355 610
26 1819 923 682 240 574 170 3075 1333
27 233 87 312 119 188 39 733 246
28 2121 1154 2899 1212 1264 352 6284 2718
29 569 261 877 402 749 188 2195 851
30 - - 6 1 10 0 16 2
31 293 133 335 143 242 157 870 432
32 16 10 30 20 43 28 89 58
33 58 32 72 26 55 13 185 71
34 57 26 156 89 190 72 403 187
35 64 32 98 43 173 37 335 112
36 6854 5079 3434 1689 1312 403 11600 7171
37 115 57 59 18 35 14 209 89
all 54262 36072 24891 10822 12571 4002 91724 50895
Annex-IV

148 SARVEKSHANA
Table 1: Sample and estimated number of unorganised manufacturing enterprises by enterprise type andindustry (NIC Code)
combined
industry OAME NDME DME all(NIC sample estimated sample estimated sample estimated sample estimatedCode) (in ‘00s) (in ‘00s) (in ‘00s) (in ‘00s)
(1) (2) (3) (4) (5) (6) (7) (8) (9)
01405 75 54 23 9 13 1 111 64
15 16818 25567 5418 3484 2178 1062 24414 30113
16 7738 20674 226 155 415 210 8379 21039
17 14186 20741 4285 2049 4219 1341 22690 24131
18 22027 24166 6217 3397 1108 534 29352 28096
19 1640 1403 625 244 319 113 2584 1759
20 15273 26683 2440 1190 830 245 18543 28118
21 675 688 229 118 252 83 1156 890
22 902 575 1486 681 550 184 2938 1440
23 31 28 24 34 24 7 79 69
24 1341 1863 301 121 496 219 2138 2202
25 628 496 561 277 562 181 1751 953
26 5129 6865 1125 586 1824 749 8078 8201
27 331 199 359 137 215 54 905 389
28 3900 4406 3623 1619 1427 399 8950 6425
29 898 991 1004 467 826 205 2728 1664
30 - - 6 1 10 0 16 2
31 375 312 372 173 280 169 1027 655
32 20 16 35 22 48 30 103 68
33 65 41 76 31 64 15 205 87
34 66 50 179 94 228 78 473 223
35 91 63 113 60 181 39 385 162
36 9471 10652 4199 2150 1556 536 15226 13337
37 150 122 68 18 45 14 263 154
all 101830 146654 32994 17117 17670 6470 152494 170241
Annex-IV

SARVEKSHANA 149
Table 2: Sample and estimated number of unorganised manufacturing enterprises by enterprise typeseparately for States/ UTs (estimated number in ’00)
rural
State / UT OAME NDME DME all
sample estimated sample estimated sample estimated sample estimated
(1) (2) (3) (4) (5) (6) (7) (8) (9)
Andhra Pradesh 4719 11150 726 630 791 249 6236 12029Arunachal Pradesh 30 2 28 1 4 0 62 2Assam 2327 2241 288 149 53 14 2668 2404Bihar 4240 6603 337 200 123 32 4700 6835Goa 133 150 55 30 53 4 241 184
Gujarat 1255 2220 165 106 189 135 1609 2461Haryana 650 897 140 97 73 13 863 1007Himachal Pradesh 1085 828 210 62 77 17 1372 907Jammu & Kashmir 1464 1324 249 60 85 11 1798 1395Karnataka 1726 6133 325 409 379 322 2430 6864
Kerala 2571 3279 1050 750 536 178 4157 4208Madhya Pradesh 1819 5126 143 105 89 58 2051 5289Maharashtra 2288 6173 385 328 427 180 3100 6681Manipur 677 341 53 4 19 2 749 348Meghalaya 331 234 138 24 28 4 497 262
Mizoram 270 32 34 3 1 0 305 35Nagaland 502 31 43 2 10 0 555 33Orissa 2632 8979 214 172 79 44 2925 9196Punjab 1258 1661 326 178 72 27 1656 1866Rajasthan 1837 3733 234 140 110 40 2181 3913
Sikkim 92 10 15 2 4 0 111 12Tamil Nadu 3226 7538 1018 640 799 281 5043 8459Tripura 1336 287 272 21 5 2 1613 310Uttar Pradesh 3560 14860 505 985 386 469 4451 16313West Bengal 4076 20003 723 909 485 325 5284 21237
A & N Islandss 118 16 62 3 21 1 201 20Chandigarh 20 4 22 2 4 0 46 7D & N Haveli 60 8 28 2 14 1 102 11Daman & Diu 50 3 19 2 29 2 98 7Delhi 30 55 31 42 22 7 83 104
Lakshadweep 12 0 - - - - 12 0Pondicherry 78 19 25 5 29 5 132 28Jharkhand 1956 3906 125 121 61 20 2142 4047Chhatisgarh 766 1809 45 53 13 15 824 1877Uttaranchal 374 926 70 58 29 11 473 995
all India 47568 110582 8103 6295 5099 2469 60770 119346
Annex-IV

150 SARVEKSHANA
Table 2: Sample and estimated number of unorganised manufacturing enterprises by enterprise typeseparately for States/ UTs (estimated number in ’00)
urban
State / UT OAME NDME DME all
sample estimated sample estimated sample estimated sample estimated
(1) (2) (3) (4) (5) (6) (7) (8) (9)
Andhra Pradesh 4039 3217 1387 634 559 184 5985 4035Arunachal Pradesh 17 1 15 1 4 0 36 2Assam 887 233 627 133 128 14 1642 380Bihar 2714 1027 675 196 97 28 3486 1251Goa 145 40 102 18 46 7 293 65
Gujarat 2634 1807 1245 784 1198 371 5077 2962Haryana 927 578 712 272 297 76 1936 926Himachal Pradesh 634 47 472 23 116 5 1222 75Jammu & Kashmir 1526 582 574 85 157 19 2257 686Karnataka 2510 2818 845 481 389 180 3744 3479
Kerala 1465 579 1000 237 397 68 2862 883Madhya Pradesh 3834 1726 914 311 402 87 5150 2124Maharashtra 4918 3555 2736 1377 2039 776 9693 5708Manipur 1338 172 212 16 68 4 1618 191Meghalaya 78 9 129 8 33 2 240 19
Mizoram 376 19 184 7 26 1 586 28Nagaland 410 17 166 7 22 1 598 24Orissa 1394 513 358 101 89 25 1841 639Punjab 2227 906 1660 462 963 171 4850 1540Rajasthan 3267 1901 1123 324 464 98 4854 2323
Sikkim 43 2 57 2 5 0 105 4Tamil Nadu 4851 4856 2038 1423 1324 543 8213 6822Tripura 433 25 312 18 34 2 779 45Uttar Pradesh 7251 4887 3755 1317 1745 384 12751 6588West Bengal 3326 4848 2119 1227 1099 398 6544 6474
A & N Islandss 57 2 78 4 36 1 171 8Chandigarh 61 25 56 15 78 13 195 53D & N Haveli 44 1 26 1 3 0 73 2Daman & Diu 39 3 8 1 2 0 49 3Delhi 321 626 502 1075 504 499 1327 2200
Lakshadweep 28 1 12 0 3 0 43 1Pondicherry 128 59 77 35 31 6 236 100Jharkhand 1165 368 296 73 34 8 1495 449Chhatisgarh 800 471 224 86 132 23 1156 579Uttaranchal 375 151 195 70 47 8 617 229
all India 54262 36072 24891 10822 12571 4002 91724 50895
Annex-IV

SARVEKSHANA 151
Table 2: Sample and estimated number of unorganised manufacturing enterprises by enterprise typeseparately for States/ UTs (estimated number in '00)
combined
State / UT OAME NDME DME all
sample estimated sample estimated sample estimated sample estimated
(1) (2) (3) (4) (5) (6) (7) (8) (9)
Andhra Pradesh 8758 14367 2113 1264 1350 434 12221 16064Arunachal Pradesh 47 2 43 2 8 0 98 4Assam 3214 2474 915 282 181 28 4310 2784Bihar 6954 7630 1012 396 220 60 8186 8086Goa 278 190 157 48 99 11 534 249
Gujarat 3889 4027 1410 890 1387 506 6686 5423Haryana 1577 1475 852 369 370 89 2799 1933Himachal Pradesh 1719 875 682 85 193 22 2594 981Jammu & Kashmir 2990 1906 823 145 242 31 4055 2081Karnataka 4236 8951 1170 890 768 502 6174 10343
Kerala 4036 3858 2050 987 933 246 7019 5091Madhya Pradesh 5653 6852 1057 416 491 145 7201 7413Maharashtra 7206 9728 3121 1705 2466 95512793 12389Manipur 2015 513 265 20 87 6 2367 539Meghalaya 409 243 267 32 61 6 737 280
Mizoram 646 52 218 10 27 1 891 63Nagaland 912 48 209 9 32 1 1153 57Orissa 4026 9493 572 273 168 69 4766 9834Punjab 3485 2567 1986 641 1035 198 6506 3406Rajasthan 5104 5635 1357 463 574 138 7035 6236
Sikkim 135 12 72 4 9 0 216 16Tamil Nadu 8077 12394 3056 2063 2123 824 13256 15281Tripura 1769 313 584 39 39 3 2392 355Uttar Pradesh 10811 19747 4260 2301 2131 853 17202 22901West Bengal 7402 24851 2842 2136 1584 723 11828 27710
A & N Islandss 175 19 140 7 57 2 372 28Chandigarh 81 29 78 18 82 13 241 60D & N Haveli 104 9 54 3 17 1 175 13Daman & Diu 89 6 27 2 31 2 147 10Delhi 351 681 533 1116 526 507 1410 2304
Lakshadweep 40 1 12 0 3 0 55 2Pondicherry 206 77 102 41 60 10 368 128Jharkhand 3121 4274 421 195 95 28 3637 4496Chhatisgarh 1566 2280 269 138 145 38 1980 2456Uttaranchal 749 1077 265 128 76 19 1090 1224
all India 101830 146654 32994 17117 17670 6470 152494 170241
Annex-IV

152 SARVEKSHANA
Table 3: Percentage distribution and share of estimated number of manufacturing enterprises byenterprise type and by industry
rural
industry percent distribution of manufacturing percent share of enterprises over number ofenterprises by enterprise type different industries enterprises
OAME NDME DME all OAME NDME DME all sample estimated
(1) (2) (3) (4) (5) (6) (7) (8) (9) (10) (11)
01405 86.2 10.6 3.2 100.0 0.0 0.0 0.0 0.0 29 2093
15 89.1 8.1 2.8 100.0 19.0 30.3 26.7 19.8 11989 2360693
16 98.0 0.8 1.2 100.0 14.6 2.0 7.9 13.8 4039 1648169
17 91.9 5.5 2.7 100.0 14.0 14.6 18.3 14.2 8440 1689444
18 92.5 7.2 0.3 100.0 14.0 19.1 2.2 14.0 10055 1671218
19 95.8 3.5 0.7 100.0 0.8 0.5 0.3 0.8 639 91484
20 97.4 2.3 0.3 100.0 21.7 8.9 3.2 20.7 11843 2466430
21 96.2 1.6 2.3 100.0 0.2 0.1 0.2 0.2 131 26250
22 61.8 33.4 4.8 100.0 0.1 1.2 0.4 0.2 222 22352
23 43.6 46.6 9.8 100.0 0.0 0.4 0.2 0.0 37 5064
24 84.1 2.8 13.1 100.0 0.8 0.5 5.7 0.9 585 107299
25 71.5 15.8 12.6 100.0 0.2 0.9 1.8 0.3 396 34370
26 86.5 5.0 8.4 100.0 5.4 5.5 23.5 5.8 5003 686792
27 77.9 12.1 10.0 100.0 0.1 0.3 0.6 0.1 172 14312
28 87.7 11.0 1.3 100.0 2.9 6.5 1.9 3.1 2666 370710
29 89.8 8.0 2.2 100.0 0.7 1.0 0.7 0.7 533 81324
30 - - - - - - - - - -
31 80.7 13.8 5.5 100.0 0.2 0.5 0.5 0.2 157 22266
32 61.2 19.0 19.7 100.0 0.0 0.0 0.1 0.0 14 1010
33 60.9 30.4 8.6 100.0 0.0 0.1 0.1 0.0 20 1528
34 68.0 16.1 15.9 100.0 0.0 0.1 0.2 0.0 70 3617
35 61.5 33.1 5.3 100.0 0.0 0.3 0.1 0.0 50 5000
36 90.4 7.5 2.2 100.0 5.0 7.3 5.4 5.2 3626 616596
37 98.5 0.6 0.9 100.0 0.1 0.0 0.0 0.1 54 6564
all 92.7 5.3 2.1 100.0 100.0 100.0 100.0 100.0 60770 11934583
Annex-IV

SARVEKSHANA 153
Table 3: Percentage distribution and share of estimated number of manufacturing enterprises byenterprise type and by industry
urban
industry percent distribution of manufacturing percent share of enterprises over number ofenterprises by enterprise type different industries enterprises
OAME NDME DME all OAME NDME DME all sample estimated
(1) (2) (3) (4) (5) (6) (7) (8) (9) (10) (11)
01405 83.2 15.6 1.2 100.0 0.1 0.1 0.0 0.1 82 4346
15 69.5 24.3 6.2 100.0 12.5 14.6 10.1 12.8 12425 650597
16 99.1 0.6 0.3 100.0 12.5 0.3 0.4 9.0 4340 455733
17 72.1 15.6 12.3 100.0 14.5 10.4 22.2 14.2 14250 723702
18 76.5 19.3 4.2 100.0 24.1 20.3 12.0 22.4 19297 1138371
19 62.4 25.1 12.5 100.0 1.5 2.0 2.6 1.7 1945 84465
20 77.0 18.2 4.8 100.0 7.4 5.8 4.2 6.8 6700 345364
21 69.5 18.2 12.3 100.0 1.2 1.1 1.9 1.2 1025 62750
22 35.9 49.8 14.3 100.0 1.2 5.6 4.3 2.4 2716 121618
23 31.6 56.9 11.5 100.0 0.0 0.1 0.1 0.0 42 1789
24 85.1 8.0 6.9 100.0 2.7 0.8 2.0 2.2 1553 112926
25 41.0 36.5 22.5 100.0 0.7 2.1 3.4 1.2 1355 60975
26 69.2 18.0 12.8 100.0 2.6 2.2 4.3 2.6 3075 133258
27 35.4 48.6 16.1 100.0 0.2 1.1 1.0 0.5 733 24593
28 42.5 44.6 12.9 100.0 3.2 11.2 8.8 5.3 6284 271753
29 30.7 47.3 22.1 100.0 0.7 3.7 4.7 1.7 2195 85051
30 - 74.8 25.2 100.0 - 0.0 0.0 0.0 16 165
31 30.7 33.0 36.3 100.0 0.4 1.3 3.9 0.8 870 43210
32 16.8 34.6 48.6 100.0 0.0 0.2 0.7 0.1 89 5825
33 44.5 36.9 18.6 100.0 0.1 0.2 0.3 0.1 185 7146
34 13.8 47.5 38.7 100.0 0.1 0.8 1.8 0.4 403 18670
35 28.6 38.7 32.8 100.0 0.1 0.4 0.9 0.2 335 11223
36 70.8 23.6 5.6 100.0 14.1 15.6 10.1 14.1 11600 717120
37 64.5 20.2 15.3 100.0 0.2 0.2 0.3 0.2 209 8869
all 70.9 21.3 7.9 100.0 100.0 100.0 100.0 100.0 91724 5089520
Annex-IV

154 SARVEKSHANA
Table 3: Percentage distribution and share of estimated number of manufacturing enterprises byenterprise type and by industry
combined
industry percent distribution of manufacturing percent share of enterprises over number ofenterprises by enterprise type different industries enterprises
OAME NDME DME all OAME NDME DME all sample estimated
(1) (2) (3) (4) (5) (6) (7) (8) (9) (10) (11)
01405 84.2 14.0 1.8 100.0 0.0 0.1 0.0 0.0 111 6439
15 84.9 11.6 3.5 100.0 17.4 20.4 16.4 17.7 24414 3011289
16 98.3 0.7 1.0 100.0 14.1 0.9 3.2 12.4 8379 2103902
17 85.9 8.5 5.6 100.0 14.1 12.0 20.7 14.2 22690 2413147
18 86.0 12.1 1.9 100.0 16.5 19.8 8.2 16.5 29352 2809589
19 79.7 13.9 6.4 100.0 1.0 1.4 1.7 1.0 2584 175949
20 94.9 4.2 0.9 100.0 18.2 7.0 3.8 16.5 18543 2811794
21 77.3 13.3 9.4 100.0 0.5 0.7 1.3 0.5 1156 89000
22 39.9 47.3 12.8 100.0 0.4 4.0 2.8 0.8 2938 143970
23 40.5 49.3 10.3 100.0 0.0 0.2 0.1 0.0 79 6852
24 84.6 5.5 9.9 100.0 1.3 0.7 3.4 1.3 2138 220225
25 52.0 29.0 19.0 100.0 0.3 1.6 2.8 0.6 1751 95345
26 83.7 7.1 9.1 100.0 4.7 3.4 11.6 4.8 8078 820050
27 51.0 35.2 13.8 100.0 0.1 0.8 0.8 0.2 905 38904
28 68.6 25.2 6.2 100.0 3.0 9.5 6.2 3.8 8950 642462
29 59.6 28.1 12.3 100.0 0.7 2.7 3.2 1.0 2728 166375
30 - 74.8 25.2 100.0 - 0.0 0.0 0.0 16 165
31 47.7 26.5 25.8 100.0 0.2 1.0 2.6 0.4 1027 65475
32 23.4 32.3 44.3 100.0 0.0 0.1 0.5 0.0 103 6836
33 47.4 35.8 16.8 100.0 0.0 0.2 0.2 0.1 205 8674
34 22.6 42.4 35.0 100.0 0.0 0.6 1.2 0.1 473 22287
35 38.7 37.0 24.3 100.0 0.0 0.4 0.6 0.1 385 16223
36 79.9 16.1 4.0 100.0 7.3 12.6 8.3 7.8 15226 1333716
37 79.0 11.9 9.2 100.0 0.1 0.1 0.2 0.1 263 15433
all 86.1 10.1 3.8 100.0 100.0 100.0 100.0 100.0 152494 17024104
Annex-IVAnnex-IV

SARVEKSHANA 155
Table 4: Percentage distribution and share of estimated number of manufacturing enterprises by enterprisetype and by State / UT
rural
State / UT percent distribution of percent share of enterprises over number ofmanufacturing enterprises by different State / UT enterprises
enterprise type
OAME NDME DME all OAME NDME DME all sample estimated
(1) (2) (3) (4) (5) (6) (7) (8) (9) (10) (11)
Andhra Pradesh 93 5 2 100 10 10 10 10 6236 1202900
Arunachal Pradesh 72 25 3 100 0 0 0 0 62 236
Assam 93 6 1 100 2 2 1 2 2668 240405
Bihar 97 3 0 100 6 3 1 6 4700 683545
Goa 81 16 2 100 0 0 0 0 241 18418
Gujarat 90 4 5 100 2 2 5 2 1609 246108
Haryana 89 10 1 100 1 2 1 1 863 100690
Himachal Pradesh 91 7 2 100 1 1 1 1 1372 90666
Jammu & Kashmir 95 4 1 100 1 1 0 1 1798 139523
Karnataka 89 6 5 100 6 6 13 6 2430 686442
Kerala 78 18 4 100 3 12 7 4 4157 420760
Madhya Pradesh 97 2 1 100 5 2 2 4 2051 528887
Maharashtra 92 5 3 100 6 5 7 6 3100 668085
Manipur 98 1 1 100 0 0 0 0 749 34799
Meghalaya 89 9 1 100 0 0 0 0 497 26156
Mizoram 92 7 0 100 0 0 0 0 305 3492
Nagaland 94 6 1 100 0 0 0 0 555 3325
Orissa 98 2 0 100 8 3 2 8 2925 919566
Punjab 89 10 1 100 2 3 1 2 1656 186625
Rajasthan 95 4 1 100 3 2 2 3 2181 391250
Sikkim 87 13 0 100 0 0 0 0 111 1171
Tamilnadu 89 8 3 100 7 10 11 7 5043 845927
Tripura 93 7 1 100 0 0 0 0 1613 31024
Uttar Pradesh 91 6 3 100 13 16 19 14 4451 1631315
West Bengal 94 4 2 100 18 14 13 18 5284 2123665
A & N. Island 80 14 5 100 0 0 0 0 201 1999
Chandigarh 59 35 6 100 0 0 0 0 46 693
D & N Haveli 74 20 6 100 0 0 0 0 102 1083
Daman & Diu 47 26 27 100 0 0 0 0 98 704
Delhi 53 40 7 100 0 1 0 0 83 10383
Lakshadweep 100 - - 100 0 - - 0 12 15
Pondicherry 66 18 16 100 0 0 0 0 132 2847
Jharkhand 97 3 0 100 4 2 1 3 2142 404708
Chhatisgarh 96 3 1 100 2 1 1 2 824 187660
Uttaranchal 93 6 1 100 1 1 0 1 473 99513
all India 93 5 2 100 100 100 100 100 60770 11934583
Annex-IVAnnex-IV

156 SARVEKSHANA
Table 4: Percentage distribution and share of estimated number of manufacturing enterprises by enterprisetype and by State / UT
urban
State / UT percent distribution of percent share of enterprises over number ofmanufacturing enterprises by different State / UT enterprises
enterprise type
OAME NDME DME all OAME NDME DME all sample estimated
(1) (2) (3) (4) (5) (6) (7) (8) (9) (10) (11)
Andhra Pradesh 80 16 5 100 9 6 5 8 5985 403541
Arunachal Pradesh 35 58 7 100 0 0 0 0 36 178
Assam 61 35 4 100 1 1 0 1 1642 38043
Bihar 82 16 2 100 3 2 1 2 3486 125059
Goa 62 28 11 100 0 0 0 0 293 6499
Gujarat 61 26 13 100 5 7 9 6 5077 296199
Haryana 62 29 8 100 2 3 2 2 1936 92611
Himachal Pradesh 63 31 6 100 0 0 0 0 1222 7482
Jammu & Kashmir 85 12 3 100 2 1 0 1 2257 68583
Karnataka 81 14 5 100 8 4 4 7 3744 347886
Kerala 66 27 8 100 2 2 2 2 2862 88341
Madhya Pradesh 81 15 4 100 5 3 2 4 5150 212420
Maharashtra 62 24 14 100 10 13 19 11 9693 570797
Manipur 90 8 2 100 0 0 0 0 1618 19111
Meghalaya 47 43 10 100 0 0 0 0 240 1862
Mizoram 70 26 4 100 0 0 0 0 586 2765
Nagaland 70 27 2 100 0 0 0 0 598 2407
Orissa 80 16 4 100 1 1 1 1 1841 63860
Punjab 59 30 11 100 3 4 4 3 4850 153962
Rajasthan 82 14 4 100 5 3 2 5 4854 232303
Sikkim 39 55 6 100 0 0 0 0 105 395
Tamilnadu 71 21 8 100 13 13 14 13 8213 682202
Tripura 56 40 4 100 0 0 0 0 779 4483
Uttar Pradesh 74 20 6 100 14 12 10 13 12751 658768
West Bengal 75 19 6 100 13 11 10 13 6544 647358
A & N. Island 33 51 16 100 0 0 0 0 171 751
Chandigarh 48 29 24 100 0 0 0 0 195 5289
D & N Haveli 63 33 5 100 0 0 0 0 73 176
Daman & Diu 81 15 4 100 0 0 0 0 49 334
Delhi 28 49 23 100 2 10 12 4 1327 220014
Lakshadweep 71 25 4 100 0 0 0 0 43 135
Pondicherry 59 36 6 100 0 0 0 0 236 9971
Jharkhand 82 16 2 100 1 1 0 1 1495 44921
Chhatisgarh 81 15 4 100 1 1 1 1 1156 57919
Uttaranchal 66 31 3 100 0 1 0 0 617 22896
all India 71 21 8 100 100 100 100 100 91724 5089520
Annex-IV

SARVEKSHANA 157
Table 4: Percentage distribution and share of estimated number of manufacturing enterprises by enterprisetype and by State / UT
combined
State / UT percent distribution of percent share of enterprises over number ofmanufacturing enterprises by different State / UT enterprises
enterprise type
OAME NDME DME all OAME NDME DME all sample estimated
(1) (2) (3) (4) (5) (6) (7) (8) (9) (10) (11)
Andhra Pradesh 89 8 3 100 10 7 7 9 12221 1606441
Arunachal Pradesh 56 39 4 100 0 0 0 0 98 414
Assam 89 10 1 100 2 2 0 2 4310 278449
Bihar 94 5 1 100 5 2 1 5 8186 808604
Goa 76 19 4 100 0 0 0 0 534 24917
Gujarat 74 16 9 100 3 5 8 3 6686 542307
Haryana 76 19 5 100 1 2 1 1 2799 193301
Himachal Pradesh 89 9 2 100 1 0 0 1 2594 98148
Jammu & Kashmir 92 7 1 100 1 1 0 1 4055 208105
Karnataka 87 9 5 100 6 5 8 6 6174 1034328
Kerala 76 19 5 100 3 6 4 3 7019 509101
Madhya Pradesh 92 6 2 100 5 2 2 4 7201 741307
Maharashtra 79 14 8 100 7 10 15 7 12793 1238882
Manipur 95 4 1 100 0 0 0 0 2367 53911
Meghalaya 87 11 2 100 0 0 0 0 737 28018
Mizoram 82 16 2 100 0 0 0 0 891 6256
Nagaland 84 15 1 100 0 0 0 0 1153 5732
Orissa 97 3 1 100 6 2 1 6 4766 983425
Punjab 75 19 6 100 2 4 3 2 6506 340587
Rajasthan 90 7 2 100 4 3 2 4 7035 623553
Sikkim 75 24 2 100 0 0 0 0 216 1565
Tamilnadu 81 14 5 100 8 12 13 9 13256 1528129
Tripura 88 11 1 100 0 0 0 0 2392 35507
Uttar Pradesh 86 10 4 100 13 13 13 13 17202 2290083
West Bengal 90 8 3 100 17 12 11 16 11828 2771023
A & N. Island 68 24 8 100 0 0 0 0 372 2750
Chandigarh 49 29 22 100 0 0 0 0 241 5982
D & N Haveli 72 22 6 100 0 0 0 0 175 1259
Daman & Diu 58 22 20 100 0 0 0 0 147 1038
Delhi 30 48 22 100 0 7 8 1 1410 230397
Lakshadweep 74 23 3 100 0 0 0 0 55 150
Pondicherry 60 32 8 100 0 0 0 0 368 12818
Jharkhand 95 4 1 100 3 1 0 3 3637 449629
Chhatisgarh 93 6 2 100 2 1 1 1 1980 245579
Uttaranchal 88 10 2 100 1 1 0 1 1090 122409
all India 86 10 4 100 100 100 100 100 152494 17024104
Annex-IV

158 SARVEKSHANA
Table 5: Estimated number of workers engaged in unorganised manufacturing enterprises by enterprisetype separately for industry-division (NIC Code)
rural
industry estimated number (in ‘00s) of workers percent number of number of(NIC Code) in share of workers enterprises
workers
OAME NDME DME all sample estimated sample estimated(in ‘00s) (in ‘00s)
(1) (2) (3) (4) (5) (6) (7) (8) (9) (10)
01405 25 6 17 48 0.0 173 48 29 21
15 40162 5645 5903 51711 21.6 31767 51711 11989 23607
16 24670 484 2263 27417 11.4 10754 27417 4039 16482
17 30867 3215 4647 38729 16.1 27510 38729 8440 16894
18 19464 3191 398 23053 9.6 15326 23053 10055 16712
19 1177 100 61 1338 0.6 1084 1338 639 915
20 42473 1729 587 44788 18.7 22359 44788 11843 24664
21 522 18 71 610 0.3 573 610 131 263
22 258 245 70 573 0.2 700 573 222 224
23 41 78 35 154 0.1 146 154 37 51
24 1290 118 1631 3040 1.3 2917 3040 585 1073
25 347 201 369 917 0.4 1900 917 396 344
26 13972 1197 10469 25639 10.7 34499 25639 5003 6868
27 162 60 182 404 0.2 525 404 172 143
28 5168 1226 363 6757 2.8 6450 6757 2666 3707
29 1211 190 145 1546 0.6 1577 1546 533 813
30 - - - - - - - - -
31 259 104 144 508 0.2 622 508 157 223
32 11 6 15 32 0.0 100 32 14 10
33 25 19 12 56 0.0 108 56 20 15
34 29 22 57 109 0.0 440 109 70 36
35 51 61 22 134 0.1 159 134 50 50
36 9180 1411 1588 12180 5.1 8915 12180 3626 6166
37 107 1 6 114 0.0 189 114 54 66
all 191472 19329 29057 239857 100.0 168793 239857 60770 119346
Annex-IV

SARVEKSHANA 159
Table 5: Estimated number of workers engaged in unorganised manufacturing enterprises by enterprisetype separately for industry-division (NIC Code)
urban
industry estimated number (in ‘00s) of workers percent number of number of(NIC Code) in share of workers enterprises
workers
OAME NDME DME all sample estimated sample estimated(in ‘00s) (in ‘00s)
(1) (2) (3) (4) (5) (6) (7) (8) (9) (10)
01405 52 19 13 84 0.1 239 84 82 43
15 8518 4922 3270 16709 12.8 34894 16709 12425 6506
16 6430 90 151 6671 5.1 7703 6671 4340 4557
17 10402 4305 8377 23084 17.6 57753 23084 14250 7237
18 11412 6833 4433 22677 17.3 42038 22677 19297 11384
19 984 731 937 2653 2.0 6464 2653 1945 845
20 4135 2051 1243 7429 5.7 16926 7429 6700 3454
21 837 413 659 1908 1.5 3936 1908 1025 628
22 772 2029 1427 4228 3.2 10579 4228 2716 1216
23 9 42 15 66 0.1 193 66 42 18
24 1485 314 840 2639 2.0 5803 2639 1553 1129
25 437 815 1166 2417 1.8 6230 2417 1355 610
26 2157 843 1863 4864 3.7 12843 4864 3075 1333
27 145 416 357 918 0.7 3018 918 733 246
28 2261 4127 2713 9101 6.9 24001 9101 6284 2718
29 461 1452 1461 3374 2.6 10108 3374 2195 851
30 - 6 4 10 0.0 107 10 16 2
31 221 515 1296 2032 1.6 3781 2032 870 432
32 19 78 282 380 0.3 577 380 89 58
33 62 88 112 261 0.2 836 261 185 71
34 61 327 575 963 0.7 2389 963 403 187
35 57 154 294 505 0.4 1978 505 335 112
36 8124 5653 3947 17723 13.5 36580 17723 11600 7171
37 100 66 89 254 0.1 694 254 209 89
all 59141 36287 35522 130951 12.8 289670 130951 91724 50895
Annex-IV

160 SARVEKSHANA
Table 5: Estimated number of workers engaged in unorganised manufacturing enterprises by enterprisetype separately for industry-division (NIC Code)
combined
industry estimated number (in ‘00s) of workers percent number of number of(NIC Code) in share of workers enterprises
workers
OAME NDME DME all sample estimated sample estimated(in ‘00s) (in ‘00s)
(1) (2) (3) (4) (5) (6) (7) (8) (9) (10)
01405 77 25 30 132 0.0 412 132 111 64
15 48680 10567 9173 68420 18.5 66661 68420 24414 30113
16 31100 574 2414 34088 9.2 18457 34088 8379 21039
17 41270 7520 13023 61813 16.7 85263 61813 22690 24131
18 30876 10023 4831 45730 12.3 57364 45730 29352 28096
19 2162 831 998 3991 1.1 7548 3991 2584 1759
20 46607 3780 1830 52217 14.1 39285 52217 18543 28118
21 1359 430 730 2519 0.7 4509 2519 1156 890
22 1030 2274 1497 4801 1.3 11279 4801 2938 1440
23 50 120 50 220 0.1 339 220 79 69
24 2775 432 2471 5679 1.5 8720 5679 2138 2202
25 784 1016 1534 3334 0.9 8130 3334 1751 953
26 16129 2041 12332 30503 8.2 47342 30503 8078 8201
27 307 476 539 1322 0.4 3543 1322 905 389
28 7429 5353 3076 15858 4.3 30451 15858 8950 6425
29 1673 1642 1606 4920 1.3 11685 4920 2728 1664
30 - 6 4 10 0.0 107 10 16 2
31 480 620 1441 2540 0.7 4403 2540 1027 655
32 30 85 298 412 0.1 677 412 103 68
33 87 107 124 317 0.1 944 317 205 87
34 90 349 633 1072 0.3 2829 1072 473 223
35 108 215 317 639 0.2 2137 639 385 162
36 17304 7064 5535 29903 8.1 45495 29903 15226 13337
37 207 67 95 369 0.1 883 369 263 154
all 250612 55616 64579 370808 100.0 458463 370808 152494 170241
Annex-IV

SARVEKSHANA 161
Table 6: Estimated number of workers (in '00) engaged in unorganised manufacturing enterprises by enterprises type and by States/ UTs
rural
State/ estimated number of workers in percent number of number ofUT share of workers enterprises
workers
OAME NDME DME all sample estimated sample estimated
(1) (2) (3) (4) (5) (6) (7) (8) (9) (10)
Andhra Pradesh 19479 1970 2397 23846 9.9 18261 23846 6236 12029Arunachal Pradesh 2 2 1 5 0.0 235 5 62 2Assam 3564 396 144 4104 1.7 5593 4104 2668 2404Bihar 11266 633 457 12356 5.2 9952 12356 4700 6835Goa 296 99 37 433 0.2 917 433 241 184Gujarat 3582 324 1720 5627 2.3 5020 5627 1609 2461
Haryana 1277 262 243 1782 0.7 2515 1782 863 1007Himachal Pradesh 1033 174 167 1374 0.6 2832 1374 1372 907Jammu & Kashmir 2708 159 183 3050 1.3 5414 3050 1798 1395Karnataka 8535 1317 2891 12743 5.3 7552 12743 2430 6864
Kerala 4319 2361 1802 8483 3.5 12426 8483 4157 4208Madhya Pradesh 8714 322 703 9739 4.1 4565 9739 2051 5289Maharashtra 9344 1016 2051 12411 5.2 9475 12411 3100 6681Manipur 443 14 18 476 0.2 1259 476 749 348Meghalaya 380 79 39 498 0.2 1378 498 497 262
Mizoram 46 8 0 54 0.0 502 54 305 35Nagaland 45 6 2 52 0.0 941 52 555 33Orissa 19748 464 406 20618 8.6 6952 20618 2925 9196Punjab 2245 485 596 3327 1.4 4789 3327 1656 1866Rajasthan 5678 460 401 6539 2.7 4679 6539 2181 3913
Sikkim 12 5 2 18 0.0 335 18 111 12Tamil Nadu 11678 2115 2922 16715 7.0 16903 16715 5043 8459Tripura 546 60 16 621 0.3 3202 621 1613 310Uttar Pradesh 26401 2968 7458 36826 15.4 16562 36826 4451 16313West Bengal 37677 2858 3626 44161 18.4 15851 44161 5284 21237
A & N Islands 27 9 8 44 0.0 623 44 201 20Chandigarh 5 6 4 15 0.0 128 15 46 7D & N Haveli 11 6 7 23 0.0 313 23 102 11Daman & Diu 4 7 19 29 0.0 389 29 98 7Delhi 65 118 58 241 0.1 308 241 83 104
Lakshadweep 0 - - 0 0.0 16 0 12 0Pondicherry 27 20 56 102 0.0 639 102 132 28Jharkhand 7736 306 266 8307 3.5 5117 8307 2142 4047Chhatisgarh 3205 136 228 3568 1.5 2112 3568 824 1877Uttaranchal 1373 164 130 1667 0.7 1038 1667 473 995
all India 191472 19329 29057 239857 100.0 168793 239857 60770 119346
Annex-IV

162 SARVEKSHANA
Table 6: Estimated number of workers (in '00) engaged in unorganised manufacturing enterprises by enterprises type and by States/ UTs
urban
State/ estimated number of workers in percent number of number ofUT share of workers enterprises
workers
OAME NDME DME all sample estimated sample estimated
(1) (2) (3) (4) (5) (6) (7) (8) (9) (10)
Andhra Pradesh 5495 2054 1597 9146 7.0 16154 9146 5985 4035Arunachal Pradesh 1 4 1 6 0.0 121 6 36 2Assam 361 415 108 884 0.7 4445 884 1642 380Bihar 1807 630 199 2637 2.0 7441 2637 3486 1251Goa 59 57 54 170 0.1 989 170 293 65
Gujarat 2882 2809 3563 9254 7.1 21711 9254 5077 2962Haryana 907 833 682 2422 1.8 6371 2422 1936 926Himachal Pradesh 63 73 39 175 0.1 3375 175 1222 75Jammu & Kashmir 1258 264 154 1676 1.3 5872 1676 2257 686Karnataka 4324 1580 1672 7576 5.8 10035 7576 3744 3479
Kerala 805 776 645 2226 1.7 8903 2226 2862 883Madhya Pradesh 2945 1047 715 4707 3.6 13543 4707 5150 2124Maharashtra 5884 4711 6717 17312 13.2 35566 17312 9693 5708Manipur 226 55 31 313 0.2 3043 313 1618 191Meghalaya 15 25 15 54 0.0 799 54 240 19
Mizoram 28 25 12 64 0.0 1453 64 586 28Nagaland 24 20 5 48 0.0 1296 48 598 24Orissa 852 315 208 1374 1.0 4202 1374 1841 639Punjab 1289 1499 1333 4120 3.1 16612 4120 4850 1540Rajasthan 3067 1039 819 4925 3.8 13394 4925 4854 2323
Sikkim 2 8 2 12 0.0 296 12 105 4Tamil Nadu 7496 4897 5326 17719 13.5 28663 17719 8213 6822Tripura 39 53 13 105 0.1 1925 105 779 45Uttar Pradesh 9556 4312 3341 17210 13.1 43039 17210 12751 6588West Bengal 6951 3998 3572 14521 11.1 22253 14521 6544 6474
A & N Islands 4 14 9 27 0.0 677 27 171 8Chandigarh 35 49 130 214 0.2 997 214 195 53D & N Haveli 2 2 1 4 0.0 169 4 73 2Daman & Diu 4 2 1 7 0.0 102 7 49 3Delhi 954 3829 4194 8977 6.9 7039 8977 1327 2200
Lakshadweep 1 1 1 3 0.0 126 3 43 1Pondicherry 95 155 55 304 0.2 846 304 236 100Jharkhand 596 221 59 877 0.7 3069 877 1495 449Chhatisgarh 876 306 171 1353 1.0 3428 1353 1156 579Uttaranchal 238 210 82 529 0.4 1716 529 617 229
all India 59141 36287 35522 130951 100.0 289670 130951 91724 50895
Annex-IV

SARVEKSHANA 163
Table 6: Estimated number of workers (in '00) engaged in unorganised manufacturing enterprises by enterprises type and by States/ UTs
combined
State/ estimated number of workers in percent number of number ofUT share of workers enterprises
workers
OAME NDME DME all sample estimated sample estimated
(1) (2) (3) (4) (5) (6) (7) (8) (9) (10)
Andhra Pradesh 24975 4024 3994 32992 8.9 34415 32992 12221 16064Arunachal Pradesh 3 6 2 12 0.0 356 12 98 4Assam 3925 811 252 4988 1.3 10038 4988 4310 2784Bihar 13073 1264 656 14993 4.0 17393 14993 8186 8086Goa 356 156 91 603 0.2 1906 603 534 249
Gujarat 6464 3133 5283 14881 4.0 26731 14881 6686 5423Haryana 2184 1095 924 4204 1.1 8886 4204 2799 1933Himachal Pradesh 1096 247 206 1548 0.4 6207 1548 2594 981Jammu & Kashmir 3967 423 336 4726 1.3 11286 4726 4055 2081Karnataka 12858 2898 4562 20319 5.5 17587 20319 6174 10343
Kerala 5125 3138 2447 10709 2.9 21329 10709 7019 5091Madhya Pradesh 11660 1369 1418 14446 3.9 18108 14446 7201 7413Maharashtra 15228 5728 8768 29724 8.0 45041 29724 12793 12389Manipur 669 70 49 789 0.2 4302 789 2367 539Meghalaya 395 103 54 552 0.1 2177 552 737 280
Mizoram 74 32 12 118 0.0 1955 118 891 63Nagaland 68 25 7 101 0.0 2237 101 1153 57Orissa 20600 779 614 21993 5.9 11154 21993 4766 9834Punjab 3534 1984 1929 7447 2.0 21401 7447 6506 3406Rajasthan 8745 1498 1220 11464 3.1 18073 11464 7035 6236
Sikkim 14 12 4 30 0.0 631 30 216 16
Tamil Nadu 19174 7013 8248 34435 9.3 45566 34435 13256 15281Tripura 584 113 29 726 0.2 5127 726 2392 355Uttar Pradesh 35957 7280 10799 54036 14.6 59601 54036 17202 22901West Bengal 44628 6856 7198 58681 15.8 38104 58681 11828 27710
A & N Islands 31 23 17 71 0.0 1300 71 372 28Chandigarh 40 55 134 229 0.1 1125 229 241 60D & N Haveli 13 8 7 28 0.0 482 28 175 13Daman & Diu 8 9 20 36 0.0 491 36 147 10Delhi 1019 3948 4251 9218 2.5 7347 9218 1410 2304
Lakshadweep 1 1 1 3 0.0 142 3 55 2Pondicherry 121 175 110 407 0.1 1485 407 368 128Jharkhand 8332 527 326 9185 2.5 8186 9185 3637 4496Chhatisgarh 4081 442 399 4921 1.3 5540 4921 1980 2456Uttaranchal 1611 373 212 2196 0.6 2754 2196 1090 1224
all India 250612 55616 64579 370808 100.0 458463 370808 152494 170241
Annex-IV
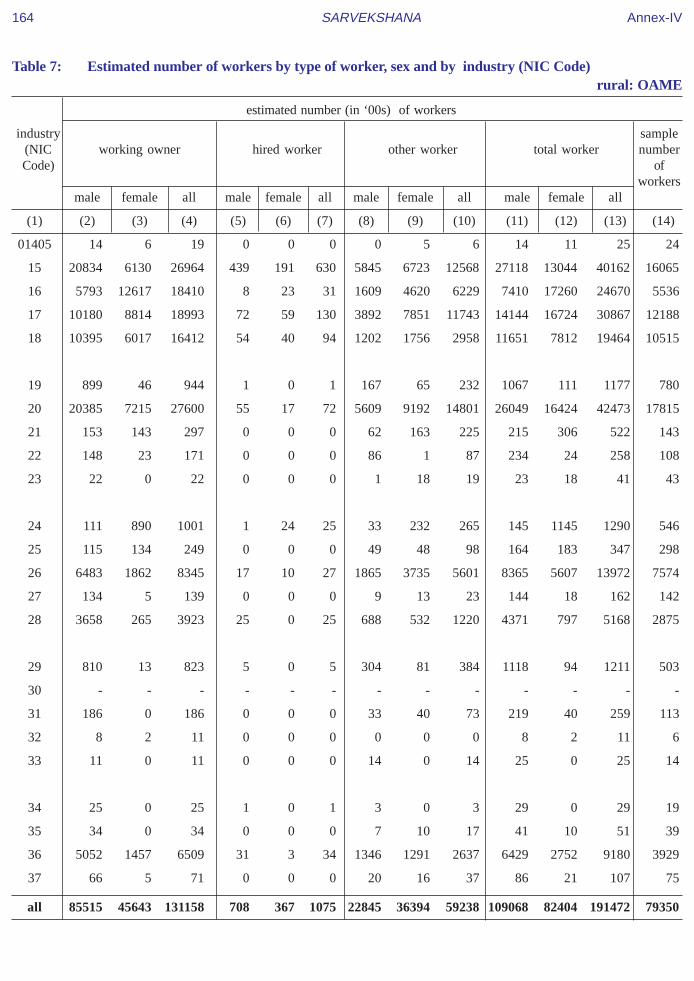
164 SARVEKSHANA
Table 7: Estimated number of workers by type of worker, sex and by industry (NIC Code)rural: OAME
estimated number (in ‘00s) of workers
industry sample(NIC working owner hired worker other worker total worker numberCode) of
workersmale female all male female all male female all male female all
(1) (2) (3) (4) (5) (6) (7) (8) (9) (10) (11) (12) (13) (14)
01405 14 6 19 0 0 0 0 5 6 14 11 25 24
15 20834 6130 26964 439 191 630 5845 6723 12568 27118 13044 40162 16065
16 5793 12617 18410 8 23 31 1609 4620 6229 7410 17260 24670 5536
17 10180 8814 18993 72 59 130 3892 7851 11743 14144 16724 30867 12188
18 10395 6017 16412 54 40 94 1202 1756 2958 11651 7812 19464 10515
19 899 46 944 1 0 1 167 65 232 1067 111 1177 780
20 20385 7215 27600 55 17 72 5609 9192 14801 26049 16424 42473 17815
21 153 143 297 0 0 0 62 163 225 215 306 522 143
22 148 23 171 0 0 0 86 1 87 234 24 258 108
23 22 0 22 0 0 0 1 18 19 23 18 41 43
24 111 890 1001 1 24 25 33 232 265 145 1145 1290 546
25 115 134 249 0 0 0 49 48 98 164 183 347 298
26 6483 1862 8345 17 10 27 1865 3735 5601 8365 5607 13972 7574
27 134 5 139 0 0 0 9 13 23 144 18 162 142
28 3658 265 3923 25 0 25 688 532 1220 4371 797 5168 2875
29 810 13 823 5 0 5 304 81 384 1118 94 1211 503
30 - - - - - - - - - - - - -
31 186 0 186 0 0 0 33 40 73 219 40 259 113
32 8 2 11 0 0 0 0 0 0 8 2 11 6
33 11 0 11 0 0 0 14 0 14 25 0 25 14
34 25 0 25 1 0 1 3 0 3 29 0 29 19
35 34 0 34 0 0 0 7 10 17 41 10 51 39
36 5052 1457 6509 31 3 34 1346 1291 2637 6429 2752 9180 3929
37 66 5 71 0 0 0 20 16 37 86 21 107 75
all 85515 45643 131158 708 367 1075 22845 36394 59238 109068 82404 191472 79350
Annex-IV

SARVEKSHANA 165
Table 7: Estimated number of workers by type of worker, sex and by industry (NIC Code)rural: NDME
estimated number (in ‘00s) of workers
industry sample(NIC working owner hired worker other worker total worker numberCode) of
workersmale female all male female all male female all male female all
(1) (2) (3) (4) (5) (6) (7) (8) (9) (10) (11) (12) (13) (14)
01405 3 0 3 3 0 3 1 0 1 6 0 6 15
15 1969 189 2158 2497 245 2742 445 301 746 4911 735 5645 5960
16 127 7 134 285 20 305 18 26 45 431 53 484 544
17 849 230 1079 1201 358 1559 238 339 577 2287 927 3215 4062
18 1207 49 1255 1606 130 1735 163 37 200 2975 215 3191 4008
19 34 1 36 52 0 52 8 4 12 94 6 100 197
20 610 30 640 874 74 948 110 31 141 1594 135 1729 2544
21 4 0 4 8 3 10 2 1 3 14 4 18 55
22 76 7 83 122 33 155 7 1 8 205 40 245 365
23 24 0 24 53 0 53 1 0 1 78 0 78 32
24 30 5 36 58 16 74 1 8 9 89 29 118 247
25 61 4 65 109 10 120 16 0 16 186 15 201 334
26 363 33 396 535 116 651 75 75 151 973 225 1197 1629
27 19 0 19 34 3 37 4 0 4 57 3 60 150
28 441 15 456 667 15 682 82 6 88 1190 36 1226 2251
29 72 1 72 96 7 103 14 1 15 182 9 190 398
30 - - - - - - - - - - - - -
31 33 2 35 56 1 58 12 0 12 102 3 104 115
32 3 0 3 1 2 3 0 0 0 4 3 6 17
33 5 0 5 12 0 12 2 0 2 19 0 19 17
34 6 0 6 11 0 11 5 0 5 22 0 22 87
35 17 1 18 30 0 30 14 0 14 60 1 61 47
36 487 20 507 696 102 798 88 19 107 1271 140 1411 2294
37 0 0 0 1 0 1 0 0 0 1 0 1 33
all 6439 595 7033 9005 1133 10138 1307 851 2158 16750 2578 19329 25401
Annex-IV

166 SARVEKSHANA
Table 7: Estimated number of workers by type of worker, sex and by industry (NIC Code)rural: DME
estimated number (in ‘00s) of workers
industry sample(NIC working owner hired worker other worker total worker numberCode) of
workersmale female all male female all male female all male female all
(1) (2) (3) (4) (5) (6) (7) (8) (9) (10) (11) (12) (13) (14)
01405 1 0 1 5 10 16 0 0 0 7 10 17 134
15 886 132 1017 3229 822 4050 569 266 835 4684 1219 5903 9742
16 216 35 252 782 981 1762 127 122 249 1125 1138 2263 4674
17 484 56 540 2221 1140 3360 428 318 746 3133 1514 4647 11260
18 68 5 73 209 78 287 24 14 39 302 97 398 803
19 8 0 8 45 1 46 7 1 8 59 2 61 107
20 111 2 113 336 86 422 46 7 52 492 94 587 2000
21 8 0 9 47 13 60 1 1 2 57 14 71 375
22 12 1 13 21 19 40 17 0 17 50 20 70 227
23 10 0 10 25 0 25 0 0 0 35 0 35 71
24 186 6 191 1163 172 1334 70 36 106 1418 213 1631 2124
25 62 15 77 206 77 283 8 1 9 276 93 369 1268
26 786 29 814 6170 2859 9029 447 179 626 7403 3067 10469 25296
27 20 0 20 162 0 163 0 0 0 182 0 182 233
28 74 7 82 221 30 251 30 1 30 325 38 363 1324
29 25 1 25 104 2 106 14 0 14 142 3 145 676
30 - - -- - - - - - - - - - -
31 17 9 26 64 51 115 3 0 3 84 60 144 394
32 2 0 2 6 5 11 0 2 2 8 7 15 77
33 3 0 3 8 0 8 1 0 1 12 0 12 77
34 10 0 10 45 2 47 1 0 1 55 2 57 334
35 3 0 3 19 0 19 1 0 1 22 0 22 73
36 167 4 171 1136 206 1342 64 11 75 1367 221 1588 2692
37 1 0 1 4 1 5 0 0 0 5 1 6 81
all 3158 301 3460 16227 6554 22781 1857 959 2816 21242 7814 29057 64042
Annex-IV

SARVEKSHANA 167
Table 7: Estimated number of workers by type of worker, sex and by industry (NIC Code)rural: all
estimated number (in ‘00s) of workers
industry sample(NIC working owner hired worker other worker total worker numberCode) of
workersmale female all male female all male female all male female all
(1) (2) (3) (4) (5) (6) (7) (8) (9) (10) (11) (12) (13) (14)
01405 17 6 23 8 10 18 1 5 7 27 21 48 173
15 23689 6450 30139 6165 1257 7422 6860 7290 14149 36713 14998 51711 31767
16 6137 12659 18796 1074 1024 2098 1754 4769 6523 8966 18452 27417 10754
17 11513 9100 20612 3493 1556 5049 4558 8508 13067 19564 19165 38729 27510
18 11670 6070 17741 1868 247 2115 1389 1807 3197 14928 8125 23053 15326
19 941 47 988 98 1 99 181 70 251 1220 118 1338 1084
20 21107 7247 28353 1265 177 1442 5764 9229 14993 28135 16653 44788 22359
21 166 144 309 54 16 70 66 165 231 286 324 610 573
22 236 31 267 143 52 195 110 2 111 488 85 573 700
23 56 0 56 78 0 78 3 18 21 136 18 154 146
24 327 901 1228 1222 211 1433 104 275 379 1653 1387 3040 2917
25 237 154 392 316 87 403 73 50 123 626 291 917 1900
26 7631 1924 9555 6722 2985 9707 2387 3990 6377 16740 8899 25639 34499
27 173 5 178 196 3 199 13 14 27 383 22 404 525
28 4173 287 4461 913 44 957 799 540 1339 5886 871 6757 6450
29 906 14 920 204 9 214 331 82 413 1441 105 1546 1577
30 - - - - - - - - - - - - -
31 236 11 247 121 52 173 48 40 88 405 103 508 622
32 13 3 16 7 8 15 0 2 2 20 12 32 100
33 18 0 18 20 0 20 17 0 17 55 0 56 108
34 40 0 40 57 2 59 10 0 10 107 2 109 440
35 53 1 54 49 0 49 21 10 31 123 11 134 159
36 5705 1481 7186 1864 311 2175 1498 1321 2819 9067 3113 12180 8915
37 67 5 72 5 1 5 21 16 37 93 22 114 189
all 95112 46539 141651 25940 8055 33995 26008 38203 64212 147060 92797 239857 168793
Annex-IV

168 SARVEKSHANA
Table 7: Estimated number of workers by type of worker, sex and by industry (NIC Code)urban: OAME
estimated number (in ‘00s) of workers
industry sample(NIC working owner hired worker other worker total worker numberCode) of
workersmale female all male female all male female all male female all
(1) (2) (3) (4) (5) (6) (7) (8) (9) (10) (11) (12) (13) (14)
01405 34 7 42 0 0 0 5 5 10 40 12 52 99
15 4188 1116 5304 84 28 111 1590 1513 3102 5861 2656 8518 14428
16 1101 3946 5047 1 2 2 225 1155 1380 1326 5104 6430 6854
17 3284 2739 6023 85 43 128 1483 2769 4252 4852 5551 10402 16038
18 5185 4061 9245 100 8 108 970 1089 2059 6254 5158 11412 18017
19 566 67 633 2 1 3 241 108 348 810 175 984 1950
20 2496 425 2921 48 3 52 583 579 1162 3127 1007 4135 7226
21 183 331 514 7 4 11 121 190 312 312 525 837 1209
22 458 45 503 14 0 14 194 62 255 665 107 772 1473
23 4 2 6 0 0 0 3 0 3 8 2 9 18
24 152 890 1043 0 0 0 54 388 442 206 1278 1485 1576
25 186 107 293 30 0 31 68 46 113 284 153 437 786
26 878 337 1215 13 3 17 336 589 926 1228 930 2157 4470
27 105 5 109 3 0 3 28 6 33 135 10 145 392
28 1361 91 1452 33 0 33 670 105 775 2064 196 2261 3953
29 303 9 312 7 0 8 122 20 142 432 29 461 981
30 - - - - - - - - - - - - -
31 124 24 148 7 0 7 47 19 65 178 43 221 492
32 9 1 10 1 0 1 6 2 9 17 3 19 31
33 38 5 43 5 0 5 12 1 14 56 6 62 109
34 33 0 33 4 0 4 24 0 24 61 0 61 128
35 35 2 37 0 0 0 18 2 20 53 4 57 107
36 4373 1360 5732 87 9 96 1482 813 2295 5941 2182 8124 11377
37 66 3 69 1 0 1 20 10 29 87 13 100 231
all 25162 15571 40733 534 102 636 8301 9472 17772 33996 25145 59141 91945
Annex-IV

SARVEKSHANA 169
Table 7: Estimated number of workers by type of worker, sex and by industry (NIC Code)urban: NDME
estimated number (in ‘00s) of workers
industry sample(NIC working owner hired worker other worker total worker numberCode) of
workersmale female all male female all male female all male female all
(1) (2) (3) (4) (5) (6) (7) (8) (9) (10) (11) (12) (13) (14)
01405 7 1 7 9 1 10 1 0 1 18 2 19 54
15 1618 157 1775 2324 240 2565 425 157 582 4367 554 4922 10799
16 28 1 29 45 8 53 5 2 8 78 12 90 238
17 1104 155 1259 2270 287 2557 265 224 489 3639 666 4305 11936
18 2167 178 2345 3807 238 4045 396 47 443 6370 463 6833 14298
19 238 6 245 399 14 413 61 13 74 698 33 731 1932
20 685 15 700 1163 21 1184 154 14 168 2002 49 2051 5427
21 123 3 126 237 9 247 35 5 40 395 17 413 813
22 639 29 668 1151 64 1215 120 26 145 1910 119 2029 4606
23 10 0 10 29 1 29 2 0 2 41 1 42 63
24 98 5 102 145 33 178 29 5 34 272 43 314 938
25 224 15 238 472 40 512 55 9 64 751 64 815 1755
26 250 20 270 420 66 486 50 37 87 720 123 843 2445
27 125 3 128 233 5 237 50 1 51 407 9 416 1075
28 1309 19 1328 2456 54 2510 280 9 289 4045 83 4127 9803
29 435 11 445 917 16 933 71 3 73 1423 29 1452 3139
30 1 0 1 3 0 3 0 1 1 5 1 6 24
31 156 6 162 303 10 314 39 1 40 498 18 515 1133
32 24 1 25 41 12 53 0 0 1 65 13 78 119
33 28 1 29 46 10 55 4 0 4 78 10 88 243
34 97 2 99 207 6 213 15 0 15 319 8 327 562
35 50 0 50 93 1 94 10 0 10 152 2 154 381
36 1822 53 1875 3209 87 3295 434 48 483 5465 188 5653 11022
37 20 0 20 35 5 40 3 2 6 58 7 66 204
all 11256 682 11938 20014 1228 21242 2504 603 3107 33774 2513 36287 83009
Annex-IV

170 SARVEKSHANA
Table 7: Estimated number of workers by type of worker, sex and by industry (NIC Code)urban: DME
estimated number (in ‘00s) of workers
industry sample(NIC working owner hired worker other worker total worker numberCode) of
workersmale female all male female all male female all male female all
(1) (2) (3) (4) (5) (6) (7) (8) (9) (10) (11) (12) (13) (14)
01405 1 0 1 2 10 12 0 0 0 3 10 13 86
15 534 34 568 1946 361 2307 314 81 395 2794 476 3270 9667
16 17 3 20 78 47 125 2 3 5 98 53 151 611
17 992 84 1076 5569 972 6542 477 282 759 7039 1338 8377 29779
18 596 52 649 3148 365 3513 219 52 271 3964 469 4433 9723
19 128 4 132 644 82 725 77 3 80 849 88 937 2582
20 228 2 230 858 36 894 111 9 120 1197 46 1243 4273
21 84 11 96 427 96 523 36 4 40 547 111 659 1914
22 223 15 238 1005 90 1096 75 18 93 1304 124 1427 4500
23 2 0 2 8 3 11 2 0 2 12 3 15 112
24 130 6 136 394 263 657 36 10 47 561 279 840 3289
25 190 8 198 721 190 911 52 6 57 963 203 1166 3689
26 246 12 259 1048 433 1481 80 43 123 1375 488 1863 5928
27 49 3 52 281 4 285 19 1 20 348 8 357 1551
28 446 21 467 2006 68 2074 168 4 172 2621 92 2713 10245
29 265 9 274 1072 63 1135 52 0 52 1388 73 1461 5988
30 0 0 0 3 0 3 0 0 0 4 0 4 83
31 198 8 206 805 250 1055 34 1 35 1037 260 1296 2156
32 41 1 41 195 36 231 10 0 10 245 37 282 427
33 23 0 24 79 5 85 3 0 3 106 6 112 484
34 92 4 95 442 13 455 24 1 25 557 18 575 1699
35 47 0 47 238 1 239 8 0 8 292 2 294 1490
36 495 19 513 2866 301 3167 246 20 266 3607 339 3947 14181
37 20 0 21 52 9 62 6 1 7 79 10 89 259
all 5047 298 5345 23889 3698 27587 2052 539 2591 30988 4534 35522 114716
Annex-IV

SARVEKSHANA 171
Table 7: Estimated number of workers by type of worker, sex and by industry (NIC Code)urban: all
estimated number (in ‘00s) of workers
industry sample(NIC working owner hired worker other worker total worker numberCode) of
workersmale female all male female all male female all male female all
(1) (2) (3) (4) (5) (6) (7) (8) (9) (10) (11) (12) (13) (14)
01405 42 8 50 11 12 23 7 5 12 60 24 84 239
15 6340 1307 7647 4354 629 4983 2329 1750 4079 13023 3687 16709 34894
16 1146 3951 5097 123 57 181 232 1161 1393 1502 5169 6671 7703
17 5380 2978 8358 7924 1302 9226 2225 3274 5500 15529 7555 23084 57753
18 7948 4291 12239 7054 612 7666 1585 1188 2773 16587 6090 22677 42038
19 933 76 1009 1045 97 1141 379 123 502 2356 296 2653 6464
20 3408 441 3850 2069 60 2129 848 602 1450 6326 1103 7429 16926
21 390 346 736 672 109 781 193 199 392 1255 654 1908 3936
22 1320 89 1409 2170 155 2325 388 106 494 3878 350 4228 10579
23 17 2 18 37 3 40 7 0 7 61 5 66 193
24 380 901 1281 540 296 835 119 403 522 1039 1600 2639 5803
25 599 129 729 1224 230 1454 174 60 234 1997 420 2417 6230
26 1374 370 1744 1482 502 1984 467 669 1136 3323 1541 4864 12843
27 278 10 289 516 9 525 96 8 104 891 27 918 3018
28 3116 131 3248 4496 122 4617 1118 118 1236 8730 371 9101 24001
29 1003 29 1031 1997 79 2076 244 23 267 3243 130 3374 10108
30 2 0 2 6 0 7 0 1 1 8 1 10 107
31 478 39 517 1116 260 1376 119 21 140 1712 320 2032 3781
32 73 3 76 237 48 285 16 3 19 327 53 380 577
33 89 6 95 130 15 145 20 1 21 239 22 261 836
34 221 6 227 653 19 672 64 1 64 937 26 963 2389
35 131 3 134 330 3 333 36 2 38 498 7 505 1978
36 6689 1431 8121 6162 397 6558 2163 882 3044 15014 2709 17723 36580
37 107 4 110 88 14 103 29 13 42 224 31 254 694
all 41465 16551 58016 44436 5028 49465 12857 10613 23470 98758 32193 130951 289670
Annex-IV

172 SARVEKSHANA
Table 7: Estimated number of workers by type of worker, sex and by industry (NIC Code)combined: OAME
estimated number (in ‘00s) of workers
industry sample(NIC working owner hired worker other worker total worker numberCode) of
workersmale female all male female all male female all male female all
(1) (2) (3) (4) (5) (6) (7) (8) (9) (10) (11) (12) (13) (14)
01405 48 13 61 0 0 0 5 11 16 54 23 77 123
15 25023 7246 32268 523 219 742 7435 8236 15670 32980 15700 48680 30493
16 6894 16563 23458 9 25 34 1834 5775 7609 8736 22364 31100 12390
17 13464 11553 25016 157 101 258 5375 10620 15995 18995 22274 41270 28226
18 15580 10077 25657 154 48 201 2172 2845 5017 17905 12970 30876 28532
19 1465 112 1577 3 1 4 408 173 580 1876 286 2162 2730
20 22881 7640 30520 103 21 124 6192 9771 15963 29176 17431 46607 25041
21 336 474 811 7 4 11 183 354 537 527 832 1359 1352
22 606 68 673 14 0 14 279 63 342 899 131 1030 1581
23 26 2 28 0 0 0 4 18 22 31 20 50 61
24 263 1780 2043 1 24 25 87 620 706 351 2424 2775 2122
25 300 241 542 30 0 31 117 94 211 448 336 784 1084
26 7361 2199 9560 30 13 44 2202 4325 6526 9592 6537 16129 12044
27 239 9 248 3 0 3 37 19 56 279 28 307 534
28 5019 356 5375 58 0 58 1358 638 1995 6435 994 7429 6828
29 1113 22 1135 12 0 12 425 101 526 1550 122 1673 1484
30 - - - - - - - - - - - - -
31 310 24 335 7 0 7 79 59 138 397 83 480 605
32 17 3 20 1 0 1 6 2 9 25 5 30 37
33 49 5 54 5 0 5 26 1 27 80 6 87 123
34 58 0 58 5 0 5 27 0 27 90 0 90 147
35 68 2 71 0 0 0 26 12 37 94 14 108 146
36 9424 2817 12241 118 13 130 2828 2104 4933 12370 4934 17304 15306
37 132 8 140 1 0 1 40 26 66 173 34 207 306
all 110677 61214 171891 1242 469 1711 31145 45865 77011 143064 107549 250612 171295
Annex-IV

SARVEKSHANA 173
Table 7: Estimated number of workers by type of worker, sex and by industry (NIC Code)combined: NDME
estimated number (in ‘00s) of workers
industry sample(NIC working owner hired worker other worker total worker numberCode) of
workersmale female all male female all male female all male female all
(1) (2) (3) (4) (5) (6) (7) (8) (9) (10) (11) (12) (13) (14)
01405 10 1 10 12 1 13 2 0 2 23 2 25 69
15 3587 346 3933 4821 485 5306 870 458 1328 9278 1289 10567 16759
16 156 8 164 330 28 358 24 29 52 509 65 574 782
17 1953 385 2338 3470 646 4116 503 563 1066 5926 1594 7520 15998
18 3373 227 3600 5412 368 5780 559 84 643 9345 678 10023 18306
19 273 7 280 450 15 465 69 17 86 792 39 831 2129
20 1295 45 1340 2037 94 2132 263 45 308 3595 184 3780 7971
21 127 3 130 245 12 257 37 6 43 409 21 430 868
22 715 36 752 1273 97 1370 127 26 153 2115 159 2274 4971
23 34 0 35 81 1 82 4 0 4 119 1 120 95
24 128 10 138 203 49 252 30 13 43 361 71 432 1185
25 285 19 304 582 51 632 71 9 80 937 79 1016 2089
26 613 53 666 955 182 1137 125 113 238 1693 348 2041 4074
27 145 3 147 266 8 274 53 2 55 464 12 476 1225
28 1750 34 1784 3123 69 3191 362 16 378 5235 118 5353 12054
29 506 11 518 1014 23 1036 85 4 88 1604 38 1642 3537
30 1 0 1 3 0 3 0 1 1 5 1 6 24
31 189 8 197 360 11 371 51 1 52 599 20 620 1248
32 26 2 28 42 14 56 0 0 1 69 16 85 136
33 33 1 33 58 10 67 6 0 6 96 10 107 260
34 103 2 104 218 6 224 20 0 20 341 8 349 649
35 66 2 68 122 1 124 23 0 23 212 3 215 428
36 2309 73 2381 3905 188 4093 522 67 590 6736 328 7064 13316
37 20 0 21 36 5 41 4 2 6 60 7 67 237
all 17695 1277 18972 29019 2361 31380 3811 1454 5264 50525 5092 55616 108410
Annex-IV

174 SARVEKSHANA
Table 7: Estimated number of workers by type of worker, sex and by industry (NIC Code)combined: DME
estimated number (in ‘00s) of workers
industry sample(NIC working owner hired worker other worker total worker numberCode) of
workersmale female all male female all male female all male female all
(1) (2) (3) (4) (5) (6) (7) (8) (9) (10) (11) (12) (13) (14)
01405 2 0 2 7 21 28 0 0 0 9 21 30 220
15 1419 166 1585 5175 1183 6357 883 347 1230 7478 1695 9173 19409
16 234 38 272 860 1028 1888 129 125 254 1222 1192 2414 5285
17 1476 140 1616 7790 2112 9902 905 600 1505 10172 2852 13023 41039
18 665 57 722 3357 443 3800 244 66 310 4265 566 4831 10526
19 136 4 140 689 82 771 83 4 88 908 90 998 2689
20 339 3 342 1194 122 1315 157 15 172 1689 141 1830 6273
21 93 12 104 474 109 583 38 5 42 604 125 730 2289
22 236 16 251 1026 110 1136 92 18 110 1353 144 1497 4727
23 12 0 12 33 3 36 2 0 2 47 3 50 183
24 316 12 328 1557 434 1991 106 46 152 1979 492 2471 5413
25 252 23 275 927 266 1193 59 7 66 1239 296 1534 4957
26 1032 41 1073 7219 3292 10510 527 222 749 8778 3555 12332 31224
27 68 3 71 444 4 448 19 1 20 530 8 539 1784
28 520 28 549 2227 97 2325 198 4 202 2946 130 3076 11569
29 289 10 299 1176 65 1241 65 1 66 1530 76 1606 6664
30 0 0 0 3 0 3 0 0 0 4 0 4 83
31 214 18 232 869 301 1170 37 1 39 1121 320 1441 2550
32 43 1 44 201 42 242 10 2 12 253 45 298 504
33 26 0 26 87 6 93 4 0 4 118 6 124 561
34 101 4 105 486 15 501 25 1 26 613 20 633 2033
35 49 0 50 257 1 258 9 0 9 315 2 317 1563
36 662 23 684 4003 507 4509 310 31 341 4974 560 5535 16873
37 21 0 21 56 10 66 6 1 7 84 11 95 340
all 8205 599 8805 40116 10252 50368 3909 1498 5407 52230 12349 64579 178758
Annex-IV

SARVEKSHANA 175
Table 7: Estimated number of workers by type of worker, sex and by industry (NIC Code)combined: all
estimated number (in ‘00s) of workers
industry sample(NIC working owner hired worker other worker total worker numberCode) of
workersmale female all male female all male female all male female all
(1) (2) (3) (4) (5) (6) (7) (8) (9) (10) (11) (12) (13) (14)
01405 59 13 73 19 22 41 8 11 19 86 46 132 412
15 30029 7758 37786 10519 1887 12405 9188 9040 18228 49736 18684 68420 66661
16 7283 16610 23894 1198 1081 2279 1986 5929 7916 10468 23620 34088 18457
17 16892 12078 28970 11417 2859 14276 6784 11783 18566 35093 26720 61813 85263
18 19618 10361 29979 8923 859 9781 2974 2995 5969 31515 14215 45730 57364
19 1874 123 1997 1142 98 1240 560 194 753 3576 415 3991 7548
20 24515 7688 32203 3334 237 3571 6612 9831 16443 34461 17756 52217 39285
21 556 489 1045 726 125 851 259 364 623 1541 978 2519 4509
22 1556 120 1676 2313 207 2519 498 108 605 4367 434 4801 11279
23 72 2 74 115 3 118 10 18 28 197 23 220 339
24 707 1802 2509 1761 507 2268 223 679 901 2691 2988 5679 8720
25 837 284 1120 1539 317 1856 247 110 357 2623 711 3334 8130
26 9006 2293 11299 8203 3487 11690 2854 4659 7513 20063 10439 30503 47342
27 452 15 467 713 12 724 109 22 131 1273 49 1322 3543
28 7290 418 7708 5408 166 5575 1917 658 2575 14616 1242 15858 30451
29 1908 43 1951 2201 88 2289 575 105 680 4685 235 4920 11685
30 2 0 2 6 0 7 0 1 1 8 1 10 107
31 713 50 763 1236 312 1549 167 61 228 2117 423 2540 4403
32 86 6 92 244 55 299 16 5 21 346 66 412 677
33 107 6 114 151 15 166 36 1 38 294 22 317 944
34 261 6 267 710 21 731 73 1 74 1044 28 1072 2829
35 184 4 188 379 3 382 57 12 69 621 18 639 2137
36 12395 2912 15307 8025 708 8733 3661 2202 5863 24080 5822 29903 45495
37 174 8 182 93 15 108 50 29 79 317 52 369 883
all 136577 63090 199667 70376 13083 83459 38865 48817 87682 245819 124989 370808 458463
Annex-IV

176 SARVEKSHANA
Table 8: Estimated number of workers by type of worker, sex and by States/ UTs separately by sectorand type of enterprise
rural: OAMEestimated number (in ‘00s) of workers
State/UT sampleworking owner hired worker other worker total worker number
ofworkers
male female all male female all male female all male female all
(1) (2) (3) (4) (5) (6) (7) (8) (9) (10) (11) (12) (13) (14)
Andhra Pr. 8024 4894 12918 375 157 533 1665 4363 6029 10065 9415 19479 7854Arunachal Pr. 1 0 2 0 0 0 0 0 0 1 0 2 32Assam 1906 682 2588 1 1 2 467 508 975 2374 1190 3564 3708Bihar 6761 1389 8151 7 0 8 1696 1412 3108 8465 2801 11266 7153Goa 121 52 174 5 0 5 24 93 118 150 146 296 242
Gujarat 2086 374 2460 2 0 2 535 586 1120 2622 960 3582 2012Haryana 992 196 1188 1 0 1 60 29 89 1052 225 1277 968Himachal Pr. 723 265 988 0 0 0 19 26 44 742 291 1033 1447Jammu & 1205 198 1403 0 16 16 656 633 1289 1861 848 2708 2564KashmirKarnataka 2407 4045 6451 7 5 12 875 1196 2071 3289 5246 8535 2779
Kerala 1468 2258 3726 46 53 99 108 386 494 1623 2697 4319 3462Madhya Pr. 4655 1521 6176 13 0 13 942 1583 2525 5611 3104 8714 3095Maharashtra 5124 1295 6419 13 0 13 1510 1402 2912 6647 2697 9344 3513Manipur 50 324 373 0 0 0 17 53 70 67 376 443 891Meghalaya 217 152 369 0 0 0 7 5 11 223 157 380 581
Mizoram 37 8 45 0 0 0 1 0 2 38 8 46 395Nagaland 22 13 36 0 0 0 6 4 9 28 17 45 731Orissa 7046 3452 10497 45 52 97 3499 5654 9153 10589 9159 19748 5494Punjab 1008 1069 2077 3 0 3 61 104 165 1072 1173 2245 1661Rajasthan 3199 943 4142 16 0 16 604 916 1520 3819 1859 5678 2870
Sikkim 11 0 11 0 0 0 1 0 1 12 0 12 113Tamil Nadu 3753 4797 8550 34 11 45 648 2434 3082 4435 7243 11678 4918Tripura 273 205 478 0 0 0 20 48 68 293 253 5462468Uttar Pr. 13091 5321 18412 88 33 121 3789 4078 7868 16969 9432 26401 6275West Bengal 14868 10813 25681 43 12 55 4259 7682 11941 19170 18507 37677 7633
A & N Islands 16 0 17 0 0 0 9 1 10 25 1 27 216Chandigarh 3 2 5 0 0 0 0 0 0 3 2 5 25D & N Haveli 9 1 10 0 0 0 0 1 1 9 2 11 78Daman & Diu 3 1 4 0 0 0 0 0 0 3 1 4 61Delhi 51 7 58 4 0 4 4 0 4 58 7 65 35
Lakshadweep 0 0 0 0 0 0 0 0 0 0 0 0 16Pondicherry 9 10 19 0 0 0 3 5 8 12 15 27 118Jharkhand 3881 933 4814 0 22 22 735 2165 2900 4616 3119 7736 3808Chhatisgarh 1708 259 1967 1 4 5 430 803 1233 2139 1066 3205 1593Uttaranchal 787 162 949 3 0 3 195 225 420 985 387 1373 541
all India 85515 45643 131158 708 367 1075 22845 36394 59238 109068 82404 191472 79350
Annex-IV
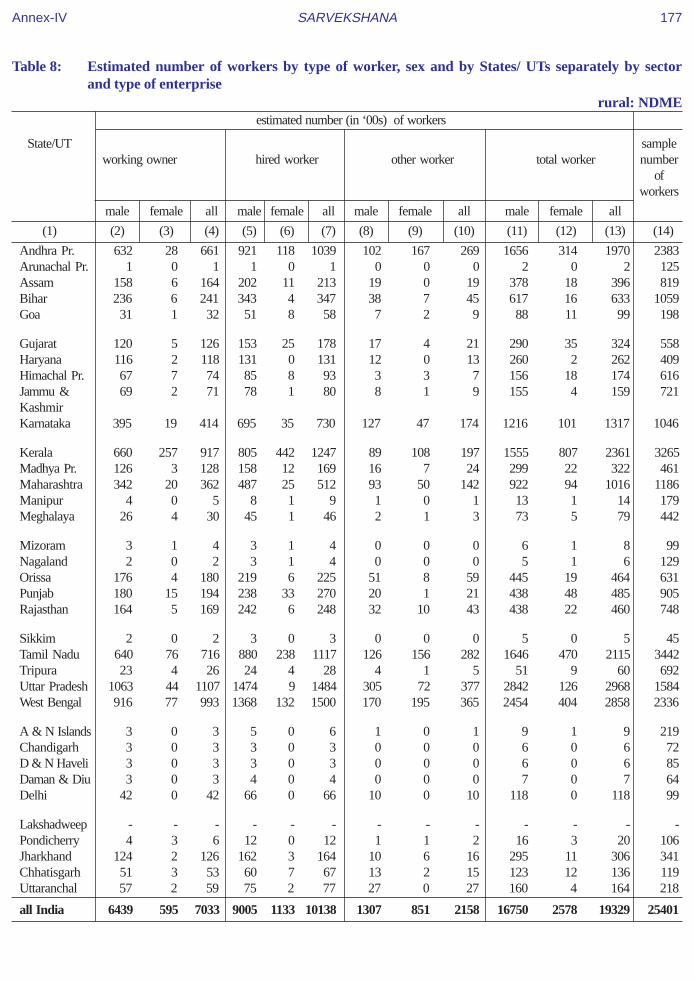
SARVEKSHANA 177
Table 8: Estimated number of workers by type of worker, sex and by States/ UTs separately by sectorand type of enterprise
rural: NDMEestimated number (in ‘00s) of workers
State/UT sampleworking owner hired worker other worker total worker number
ofworkers
male female all male female all male female all male female all
(1) (2) (3) (4) (5) (6) (7) (8) (9) (10) (11) (12) (13) (14)
Andhra Pr. 632 28 661 921 118 1039 102 167 269 1656 314 1970 2383Arunachal Pr. 1 0 1 1 0 1 0 0 0 2 0 2 125Assam 158 6 164 202 11 213 19 0 19 378 18 396 819Bihar 236 6 241 343 4 347 38 7 45 617 16 633 1059Goa 31 1 32 51 8 58 7 2 9 88 11 99 198
Gujarat 120 5 126 153 25 178 17 4 21 290 35 324 558Haryana 116 2 118 131 0 131 12 0 13 260 2 262 409Himachal Pr. 67 7 74 85 8 93 3 3 7 156 18 174 616Jammu & 69 2 71 78 1 80 8 1 9 155 4 159 721KashmirKarnataka 395 19 414 695 35 730 127 47 174 1216 101 1317 1046
Kerala 660 257 917 805 442 1247 89 108 197 1555 807 2361 3265Madhya Pr. 126 3 128 158 12 169 16 7 24 299 22 322 461Maharashtra 342 20 362 487 25 512 93 50 142 922 941016 1186Manipur 4 0 5 8 1 9 1 0 1 13 1 14 179Meghalaya 26 4 30 45 1 46 2 1 3 73 5 79 442
Mizoram 3 1 4 3 1 4 0 0 0 6 1 8 99Nagaland 2 0 2 3 1 4 0 0 0 5 1 6 129Orissa 176 4 180 219 6 225 51 8 59 445 19 464 631Punjab 180 15 194 238 33 270 20 1 21 438 48 485 905Rajasthan 164 5 169 242 6 248 32 10 43 438 22 460 748
Sikkim 2 0 2 3 0 3 0 0 0 5 0 5 45Tamil Nadu 640 76 716 880 238 1117 126 156 282 1646 470 2115 3442Tripura 23 4 26 24 4 28 4 1 5 51 9 60 692Uttar Pradesh 1063 44 1107 1474 9 1484 305 72 377 2842 126 2968 1584West Bengal 916 77 9931368 132 1500 170 195 365 2454 404 2858 2336
A & N Islands 3 0 3 5 0 6 1 0 1 9 1 9 219Chandigarh 3 0 3 3 0 3 0 0 0 6 0 6 72D & N Haveli 3 0 3 3 0 3 0 0 0 6 0 6 85Daman & Diu 3 0 3 4 0 4 0 0 0 7 0 7 64Delhi 42 0 42 66 0 66 10 0 10 118 0 118 99
Lakshadweep - - - - - - - - - - - - -Pondicherry 4 3 6 12 0 12 1 1 2 16 3 20 106Jharkhand 124 2 126 162 3 164 10 6 16 295 11 306 341Chhatisgarh 51 3 53 60 7 67 13 2 15 123 12 136 119Uttaranchal 57 2 59 75 2 77 27 0 27 160 4 164 218
all India 6439 595 7033 9005 1133 10138 1307 851 2158 16750 2578 19329 25401
Annex-IV

178 SARVEKSHANA
Table 8: Estimated number of workers by type of worker, sex and by States/ UTs separately by sectorand type of enterprise
rural: DMEestimated number (in ‘00s) of workers
State/UT sampleworking owner hired worker other worker total worker number
ofworkers
male female all male female all male female all male female all
(1) (2) (3) (4) (5) (6) (7) (8) (9) (10) (11) (12) (13) (14)
Andhra Pr. 324 36 360 1013 661 1673 156 208 364 1493 904 2397 8024Arunachal Pr. 0 0 0 0 1 1 0 0 0 0 1 1 78Assam 20 4 24 88 17 105 2 13 16 110 34 144 1066Bihar 50 2 52 258 94 352 17 36 54 325 132 457 1740Goa 5 1 5 20 9 29 2 1 3 27 10 37 477
Gujarat 177 3 179 1221 223 1444 78 19 97 1475 245 1720 2450Haryana 27 0 27 182 32 214 2 0 2 210 33 243 1138Himachal Pr. 33 4 37 118 9 127 3 0 3 153 14 167 769Jammu & 15 0 15 112 40 152 10 5 15 138 45 1832129KashmirKarnataka 327 10 337 1254 812 2066 319 169 488 1899 991 2891 3727
Kerala 217 63 281 659 778 1437 40 45 84 916 886 1802 5699Madhya Pr. 76 0 76 421 103 525 77 26 103 574 129 7031009Maharashtra 187 13 199 976 5941570 200 82 281 1362 688 2051 4776Manipur 2 0 2 16 0 16 0 0 0 18 0 18 189Meghalaya 5 2 7 26 4 30 2 0 2 33 6 39 355
Mizoram 0 0 0 0 0 0 0 0 0 0 0 0 8Nagaland 0 0 0 1 0 1 0 0 0 1 0 2 81Orissa 51 1 52 236 85 321 29 4 33 317 89 406 827Punjab 50 0 50 448 95 543 3 0 3 501 95 596 2223Rajasthan 44 1 45 198 126 323 22 11 33 263 138 401 1061
Sikkim 0 0 0 1 1 2 0 0 0 1 1 2 177Tamil Nadu 323 35 357 1277 984 2261 116 188 304 1716 1206 2922 8543Tripura 2 0 2 12 0 12 2 0 2 15 0 16 42Uttar Pradesh 654 86 740 5300 921 6221 468 28 496 6423 1035 7458 8703West Bengal 434 40 4741971 789 2759 289 104 393 2693 933 3626 5882
A & N Islands 1 0 1 6 0 6 1 0 1 8 0 8 188Chandigarh 1 0 1 3 0 3 0 0 0 4 0 4 31D & N Haveli 1 0 1 5 1 5 1 0 1 6 1 7 150Daman & Diu 3 0 3 16 0 16 0 0 0 19 0 19 264Delhi 13 0 13 37 7 43 1 0 1 51 7 58 174
Lakshadweep - - - - - - - - - - - - -Pondicherry 7 1 8 31 14 45 2 1 3 40 16 56 415Jharkhand 39 0 40 169 54 222 4 0 4 212 54 266 968Chhatisgarh 15 0 15 85 99 184 11 18 29 111 117 228 400Uttaranchal 56 0 56 70 2 71 3 0 3 128 2 130 279
all India 3158 301 3460 16227 6554 22781 1857 959 2816 21242 7814 29057 64042
Annex-IV

SARVEKSHANA 179
Table 8: Estimated number of workers by type of worker, sex and by States/ UTs separately by sectorand type of enterprise
rural: allestimated number (in ‘00s) of workers
State/UT sampleworking owner hired worker other worker total worker number
ofworkers
male female all male female all male female all male female all
(1) (2) (3) (4) (5) (6) (7) (8) (9) (10) (11) (12) (13) (14)
Andhra Pr. 8981 4958 13939 2309 936 3245 1923 4738 6662 13213 10633 23846 18261Arunachal Pr. 2 0 2 1 1 3 0 0 0 4 1 5 235Assam 2084 692 2776 290 29 319 489 521 1009 2863 1242 4104 5593Bihar 7047 1397 8444 609 98 707 1751 1454 3206 9407 2950 12356 9952Goa 157 54 210 76 17 92 33 97 130 266 167 433 917
Gujarat 2383 382 2765 1375 249 1624 629 610 1238 4387 1240 5627 5020Haryana 1135 198 1333 313 33 346 74 29 103 1522 260 1782 2515Himachal Pr. 824 276 1100 203 17 220 25 29 54 1051 322 1374 2832Jammu & 1289 200 1489 191 57 248 674 639 1313 2154 897 3050 5414KashmirKarnataka 3128 4074 7202 1956 851 2807 1321 1413 2734 6405 6338 12743 7552
Kerala 2346 2578 4924 1509 1274 2784 237 538 775 4093 4390 8483 12426Madhya Pr. 4856 1524 6380 592 115 707 1035 1616 2651 6484 3255 9739 4565Maharashtra 5652 1328 6980 1477 619 2096 1802 1533 3335 8931 3480 12411 9475Manipur 56 324 380 24 1 25 18 53 71 99 377 476 1259Meghalaya 247 158 405 71 5 76 10 6 16 329 169 498 1378
Mizoram 40 9 48 3 1 4 1 0 2 44 9 54 502Nagaland 24 14 38 4 1 5 6 4 9 34 18 52 941Orissa 7273 3457 10730 500 143 644 3579 5666 9245 11352 9267 20618 6952Punjab 1237 1084 2322 688 128 816 85 105 189 2010 1317 3327 4789Rajasthan 3406 950 4356 456 131 587 658 938 1596 4520 2019 6539 4679
Sikkim 13 0 13 4 1 5 1 0 1 17 1 18 335Tamil Nadu 4716 4908 9624 2191 1233 3424 890 2778 3668 7797 8919 16715 16903Tripura 297 209 506 36 5 41 26 49 75 359 262 6213202Uttar Pradesh 14808 5451 20260 6863 963 7826 4563 4178 8741 26233 10593 36826 16562West Bengal 16218 10929 27148 3381 933 4314 4717 7982 12699 24317 19844 44161 15851
A & N Islands 20 1 21 11 1 12 10 1 11 42 2 44 623Chandigarh 7 2 9 6 0 6 0 0 0 13 2 15 128D & N Haveli 12 1 13 8 1 8 1 1 2 21 2 23 313Daman & Diu 8 1 9 20 0 20 0 0 1 28 1 29 389Delhi 106 7 113 106 7 113 15 0 15 227 14 241 308
Lakshadweep 0 0 0 0 0 0 0 0 0 0 0 0 16Pondicherry 20 13 33 43 14 58 5 7 12 68 34 102 639Jharkhand 4044 935 4979 330 78 409 748 2171 2920 5123 3184 8307 5117Chhatisgarh 1774 261 2035 146 110 256 453 824 1277 2373 1195 3568 2112Uttaranchal 901 164 1065 148 4 152 225 225 450 1274 393 1667 1038
all India 95112 46539 141651 25940 8055 33995 26008 38203 64212 147060 92797 239857 168793
Annex-IV

180 SARVEKSHANA
Table 8: Estimated number of workers by type of worker, sex and by States/ UTs separately by sectorand type of enterprise
urban: OAMEestimated number (in ‘00s) of workers
State/UT sampleworking owner hired worker other worker total worker number
ofworkers
male female all male female all male female all male female all
(1) (2) (3) (4) (5) (6) (7) (8) (9) (10) (11) (12) (13) (14)
Andhra Pr. 2245 1359 3604 45 6 51 661 1179 1840 2950 2545 5495 7004Arunachal Pr. 1 0 1 0 0 0 0 0 0 1 0 1 36Assam 211 65 276 1 0 1 50 33 83 262 99 361 1437Bihar 983 258 1241 19 2 20 306 240 546 1308 499 1807 4588Goa 26 14 40 1 0 1 10 8 18 37 23 59 227
Gujarat 1564 431 1995 4 0 4 590 294 884 2158 725 2882 4391Haryana 611 153 764 13 0 13 78 52 131 701 205 907 1441Himachal Pr. 53 8 61 0 0 0 1 0 1 55 8 63 870Jammu & 505 94 599 0 0 0 297 362 659 802 456 1258 2706KashmirKarnataka 1558 1534 3092 4 2 7 556 669 1225 2119 2205 4324 3823
Kerala 334 337 671 8 5 13 54 68 122 395 410 805 2104Madhya Pr. 1307 710 2017 12 0 13 368 548 916 1688 1258 2945 6955Maharashtra 2334 1435 3769 69 3 72 1128 915 2043 3530 2353 5884 8239Manipur 30 167 197 0 0 0 5 23 28 36 190 226 1752Meghalaya 11 4 15 0 0 0 0 0 0 11 4 15 120
Mizoram 19 7 26 0 0 0 1 1 2 20 8 28 556Nagaland 7 12 19 0 0 0 2 2 4 10 14 24 587Orissa 414 161 575 4 2 6 104 167 271 522 329 852 2325Punjab 790 326 1116 22 0 22 88 63 151 900 389 1289 3239Rajasthan 1359 910 2269 7 2 9 409 380 789 1775 1292 3067 5652
Sikkim 2 0 2 0 0 0 1 0 1 2 0 2 61Tamil Nadu 2633 2575 5208 124 45 170 577 1541 2119 3335 4161 7496 7707Tripura 25 8 34 0 0 0 3 2 5 28 10 39 708Uttar Pradesh 4019 1866 5885 92 33 126 1884 1661 3545 5995 3561 9556 15003West Bengal 2634 2645 5279 80 1 81 757 834 1591 3471 3480 6951 5281
A & N Islands 2 0 3 0 0 0 1 1 2 3 2 4 96Chandigarh 20 13 33 0 0 0 1 1 2 21 14 35 90D & N Haveli 1 0 1 0 0 0 0 0 0 1 0 2 62Daman & Diu 2 1 3 0 0 0 0 0 1 2 2 4 56Delhi 655 91 746 22 0 22 138 48 186 814 140 954 517
Lakshadweep 0 1 1 0 0 0 0 0 0 1 1 1 31Pondicherry 35 24 59 2 1 3 16 17 33 53 41 95 195Jharkhand 378 103 481 2 0 2 71 43 113 450 146 5961917Chhatisgarh 272 220 492 2 0 2 100 282 382 373 502 8761563Uttaranchal 123 37 159 1 0 1 43 35 79 166 72 238 606
all India 25162 15571 40733 534 102 636 8301 9472 17772 33996 25145 59141 91945
Annex-IV

SARVEKSHANA 181
Table 8: Estimated number of workers by type of worker, sex and by States/ UTs separately by sectorand type of enterprise
urban: NDMEestimated number (in ‘00s) of workers
State/UT sampleworking owner hired worker other worker total worker number
ofworkers
male female all male female all male female all male female all
(1) (2) (3) (4) (5) (6) (7) (8) (9) (10) (11) (12) (13) (14)
Andhra Pr. 663 49 711 1035 100 1135 142 66 208 1839 215 2054 4483Arunachal Pr. 1 0 1 2 0 2 0 0 1 4 0 4 51Assam 137 10 147 227 23 250 16 3 19 379 36 415 1993Bihar 217 2 219 360 3 363 47 1 48 623 7 630 2151Goa 16 2 19 29 4 33 3 2 5 48 9 57 337
Gujarat 814 36 850 1672 56 1728 218 13 231 2705 104 2809 4378Haryana 325 14 339 452 18 469 23 2 25 799 34 833 2263Himachal Pr. 26 3 29 40 3 43 1 0 1 67 6 73 1472Jammu & 94 5 98 132 9 141 23 1 24 249 15 2641770KashmirKarnataka 493 19 512 860 49 909 118 41 159 1471 110 1580 2818
Kerala 229 50 278 373 90 463 21 14 35 623 153 776 3243Madhya Pr. 344 21 365 548 31 579 82 22 104 974 741047 3087Maharashtra 1331 129 1460 2663 149 2812 382 57 439 4376 335 4711 9573Manipur 13 3 16 31 6 37 2 0 2 47 8 55 733Meghalaya 8 1 9 13 3 16 0 0 0 21 4 25 411
Mizoram 6 3 9 11 4 15 0 0 0 18 7 25 612Nagaland 6 1 7 11 1 12 0 0 0 18 2 20 517Orissa 104 3 108 174 9 183 20 4 24 298 17 315 1132Punjab 540 23 562 860 9 869 65 2 67 1465 34 1499 5405Rajasthan 358 13 370 569 11 580 80 8 88 1007 32 1039 3756
Sikkim 2 0 2 5 0 5 0 0 0 7 0 8 190Tamil Nadu 1433 91 1524 2600 309 2909 289 175 464 4322 575 4897 6962Tripura 19 2 20 28 3 31 2 0 2 48 5 53 942Uttar Pradesh 1400 54 1455 2294 61 2355 437 65 502 4132 181 4312 12684West Bengal 1260 87 1346 2112 155 2267 271 114 385 3642 356 3998 7119
A & N Islands 4 0 4 9 1 9 0 0 0 13 1 14 295Chandigarh 19 0 19 26 0 27 3 0 3 48 1 49 198D & N Haveli 1 0 1 1 0 1 0 0 0 2 0 2 80Daman & Diu 1 0 1 1 0 1 0 0 0 2 0 2 30Delhi 1130 48 1178 2390 62 2452 193 6 199 3714 115 3829 1769
Lakshadweep 0 0 0 0 0 0 0 0 0 1 0 1 28Pondicherry 33 3 36 61 47 108 11 1 11 104 51 155 230Jharkhand 81 3 83 123 2 125 13 1 13 216 6 221 906Chhatisgarh 82 5 87 185 5 189 26 3 29 293 12 306 784Uttaranchal 68 5 73 117 4 120 16 1 16 201 9 210 607
all India 11256 682 11938 20014 1228 21242 2504 603 3107 33774 2513 36287 83009
Annex-IV

182 SARVEKSHANA
Table 8: Estimated number of workers by type of worker, sex and by States/ UTs separately by sectorand type of enterprise
urban: DMEestimated number (in ‘00s) of workers
State/UT sampleworking owner hired worker other worker total worker number
ofworkers
male female all male female all male female all male female all
(1) (2) (3) (4) (5) (6) (7) (8) (9) (10) (11) (12) (13) (14)
Andhra Pr. 230 15 245 947 239 1186 115 51 166 1292 305 1597 4667Arunachal Pr. 0 0 0 1 0 1 0 0 0 1 0 1 34Assam 18 4 22 59 21 80 3 2 6 81 28 108 1015Bihar 44 0 44 115 3 118 34 2 37 193 6 199 702Goa 7 1 9 32 5 37 2 6 8 41 13 54 425
Gujarat 473 13 486 2684 210 2894 174 8 182 3332 231 3563 12942Haryana 120 2 122 531 20 551 8 0 8 659 22 682 2667Himachal Pr. 7 0 7 28 3 31 1 0 1 36 3 39 1033Jammu & 27 1 28 99 6 105 17 4 21 143 11 1541396KashmirKarnataka 227 13 240 1095 211 1306 108 18 126 1430 242 1672 3394
Kerala 81 19 100 276 242 518 15 12 26 372 273 645 3556Madhya Pr. 114 13 127 448 57 505 68 15 83 630 85 7153501Maharashtra 878 44 922 4775 599 5374 385 36 421 6038 680 6717 17754Manipur 3 1 4 18 7 24 2 1 3 22 9 31 558Meghalaya 2 0 2 12 1 13 0 0 0 14 1 15 268
Mizoram 1 1 1 6 4 10 0 0 0 7 5 12 285Nagaland 1 0 1 3 1 4 0 0 0 4 2 5 192Orissa 33 3 36 120 34 154 13 5 17 166 41 208 745Punjab 239 5 244 1037 13 1050 39 0 39 1315 18 1333 7968Rajasthan 132 2 134 624 17 641 42 2 44 798 21 819 3986
Sikkim 0 0 0 2 0 2 0 0 0 2 0 2 45Tamil Nadu 694 54 748 2875 1253 4128 245 205 450 3813 1512 5326 13994Tripura 2 0 2 10 0 10 1 0 1 13 0 13 275Uttar Pradesh 491 36 526 2212 179 2391 368 57 424 3070 271 3341 15352West Bengal 486 42 527 2273 437 2709 226 109 335 2984 588 3572 9853
A & N Islands 1 0 1 5 2 7 1 0 1 7 2 9 286Chandigarh 19 4 22 97 4 101 6 1 7 122 8 130 709D & N Haveli 0 0 0 1 0 1 0 0 0 1 0 1 27Daman & Diu 0 0 0 0 0 0 0 0 0 1 0 1 16Delhi 668 18 686 3257 96 3353 154 1 154 4079 115 4194 4753
Lakshadweep 0 0 0 1 0 1 0 0 0 1 0 1 67Pondicherry 6 1 6 38 10 47 1 0 1 44 10 55 421Jharkhand 12 1 13 41 0 41 5 0 5 58 1 59 246Chhatisgarh 23 3 26 122 6 128 14 3 17 159 11 1711081Uttaranchal 10 0 11 45 19 64 7 0 7 62 19 82 503
all India 5047 298 5345 23889 3698 27587 2052 539 2591 30988 4534 35522 114716
Annex-IV

SARVEKSHANA 183
Table 8: Estimated number of workers by type of worker, sex and by States/ UTs separately by sectorand type of enterprise
urban: allestimated number (in ‘00s) of workers
State/UT sampleworking owner hired worker other worker total worker number
ofworkers
male female all male female all male female all male female all
(1) (2) (3) (4) (5) (6) (7) (8) (9) (10) (11) (12) (13) (14)
Andhra Pr. 3137 1423 4560 2026 345 2372 917 1297 2214 6081 3065 9146 16154Arunachal Pr. 2 0 2 3 0 3 1 0 1 6 1 6 121Assam 366 80 446 287 44 331 69 39 107 722 162 884 4445Bihar 1244 260 1504 494 8 502 387 244 631 2125 512 2637 7441Goa 50 18 68 62 10 71 14 17 31 126 44 170 989
Gujarat 2851 480 3331 4360 266 4626 983 315 1297 8194 1060 9254 21711Haryana 1055 170 1225 995 38 1033 109 55 164 2159 262 2422 6371Himachal Pr. 87 11 98 68 6 74 3 0 3 158 17 175 3375Jammu & 626 99 725 231 16 247 337 367 704 1194 4821676 5872KashmirKarnataka 2278 1566 3844 1959 262 2222 782 728 1510 5019 2556 7576 10035
Kerala 643 406 1049 658 336 994 89 94 183 1390 836 2226 8903Madhya Pr. 1765 744 2509 1009 87 1096 518 584 1102 3291 1416 4707 13543Maharashtra 4542 1609 6151 7507 751 8258 1895 1009 2903 13944 3368 17312 35566Manipur 46 171 217 49 13 62 9 24 34 105 208 313 3043Meghalaya 20 5 25 25 3 29 0 0 0 46 9 54 799
Mizoram 27 10 37 17 9 26 1 1 2 44 20 64 1453Nagaland 15 12 27 14 3 17 2 2 4 31 17 48 1296Orissa 552 167 718 298 45 343 137 176 313 987 388 1374 4202Punjab 1568 354 1922 1919 22 1941 192 65 257 3679 441 4120 16612Rajasthan 1849 925 2774 1200 30 1230 531 391 922 3580 1345 4925 13394
Sikkim 4 0 4 6 0 7 1 0 1 12 0 12 296Tamil Nadu 4760 2720 7480 5600 1607 7206 1111 1922 3033 11470 6249 17719 28663Tripura 46 10 56 38 3 41 5 2 8 89 15 105 1925Uttar Pradesh 5910 1956 7866 4598 273 4871 2689 1783 4472 13197 4012 17210 43039West Bengal 4379 2774 7153 4464 593 5057 1253 1057 2311 10097 4424 14521 22253
A & N Islands 7 1 8 14 2 17 2 2 3 23 5 27 677Chandigarh 57 17 74 123 4 128 11 1 12 191 23 214 997D & N Haveli 2 0 2 2 0 2 0 0 0 4 0 4 169Daman & Diu 3 2 4 1 0 2 1 0 1 5 2 7 102Delhi 2453 157 2610 5669 159 5828 485 55 539 8606 370 8977 7039
Lakshadweep 1 1 1 1 0 2 0 0 0 2 1 3 126Pondicherry 74 27 101 100 58 158 28 17 45 202 102 304 846Jharkhand 470 107 577 165 2 168 89 43 132 724 153 8773069Chhatisgarh 377 228 605 308 11 319 141 287 428 826 5261353 3428Uttaranchal 201 42 242 163 22 185 66 36 102 429 100 529 1716
all India 41465 16551 58016 44436 5028 49465 12857 10613 23470 98758 32193 130951 289670
Annex-IV

184 SARVEKSHANA
Table 8: Estimated number of workers by type of worker, sex and by States/ UTs separately by sectorand type of enterprise
combined: OAMEestimated number (in ‘00s) of workers
State/UT sampleworking owner hired worker other worker total worker number
ofworkers
male female all male female all male female all male female all
(1) (2) (3) (4) (5) (6) (7) (8) (9) (10) (11) (12) (13) (14)
Andhra Pr. 10269 6253 16522 420 163 584 2326 5543 7869 13015 11959 24975 14858Arunachal Pr. 2 0 3 0 0 0 0 0 0 3 0 3 68Assam 2117 747 2864 2 1 3 517 541 1058 2636 1289 3925 5145Bihar 7744 1647 9391 26 2 28 2002 1652 3654 9773 3300 13073 11741Goa 148 66 214 6 0 6 34 102 136 187 169 356 469
Gujarat 3650 805 4455 5 0 5 1125 880 2004 4780 1685 6464 6403Haryana 1603 349 1952 13 0 13 138 81 219 1754 431 2184 2409Himachal Pr. 777 273 1050 1 0 1 20 26 45 797 299 1096 2317Jammu & 1709 292 2002 0 16 17 953 995 1948 2663 1304 3967 5270KashmirKarnataka 3965 5579 9544 12 7 19 1431 1865 3296 5408 7451 12858 6602
Kerala 1802 2595 4397 54 58 112 162 454 616 2018 3107 5125 5566Madhya Pr. 5962 2231 8193 26 0 26 1310 2130 3441 7298 4361 11660 10050Maharashtra 7458 2731 10188 82 3 85 2638 2317 4955 10178 5050 15228 11752Manipur 80 491 571 0 0 0 23 76 99 103 567 669 2643Meghalaya 227 156 384 0 0 0 7 5 12 234 161 395 701
Mizoram 56 15 71 0 0 0 2 1 3 59 16 74 951Nagaland 30 25 55 0 0 0 7 6 13 37 31 68 1318Orissa 7460 3612 11072 49 54 103 3603 5822 9425 11112 9488 20600 7819Punjab 1797 1396 3193 24 0 24 150 167 316 1971 1562 3534 4900Rajasthan 4558 1853 6411 23 2 25 1013 1296 2310 5594 3151 8745 8522
Sikkim 12 0 13 0 0 0 1 0 2 14 0 14 174Tamil Nadu 6386 7372 13758 158 57 215 1225 3976 5201 7770 11404 19174 12625Tripura 298 214 512 0 0 1 23 49 72 321 264 5843176Uttar Pradesh 17110 7187 24297 181 66 247 5674 5739 11413 22964 12992 35957 21278West Bengal 17502 13458 30960 123 13 136 5016 8517 13532 22640 21987 44628 12914
A & N Islands 18 1 19 0 0 0 9 2 12 28 3 31 312Chandigarh 23 15 38 0 0 0 1 1 2 24 16 40 115D & N Haveli 10 1 11 0 0 0 1 1 1 10 2 13 140Daman & Diu 4 3 7 0 0 0 1 1 1 5 3 8 117Delhi 706 98 803 25 0 26 141 48 190 872 146 1019 552
Lakshadweep 1 1 1 0 0 0 0 0 0 1 1 1 47Pondicherry 44 34 78 2 1 3 19 22 41 65 56 121 313Jharkhand 4259 1036 5295 2 22 24 806 2207 3013 5067 3265 8332 5725Chhatisgarh 1980 479 2459 3 4 7 530 1085 1615 2512 1569 4081 3156Uttaranchal 910 199 1108 4 0 4 238 260 499 1152 459 1611 1147
all India 110677 61214 171891 1242 469 1711 31145 45865 77011 143064 107549 250612 171295
Annex-IV

SARVEKSHANA 185
Table 8: Estimated number of workers by type of worker, sex and by States/ UTs separately by sectorand type of enterprise
combined: NDMEestimated number (in ‘00s) of workers
State/UT sampleworking owner hired worker other worker total worker number
ofworkers
male female all male female all male female all male female all
(1) (2) (3) (4) (5) (6) (7) (8) (9) (10) (11) (12) (13) (14)
Andhra Pr. 1295 77 1372 1955 219 2174 244 234 478 3495 529 4024 6866Arunachal Pr. 2 0 2 4 0 4 0 0 1 6 1 6 176Assam 295 16 311 428 34 462 35 3 38 758 54 811 2812Bihar 453 8 461 703 8 710 85 8 93 1240 23 1264 3210Goa 47 3 50 79 12 92 10 4 14 136 20 156 535
Gujarat 934 41 975 1825 81 1906 235 17 252 2995 139 3133 4936Haryana 441 16 457 583 18 601 35 2 37 1059 36 1095 2672Himachal Pr. 94 10 103 125 11 135 4 3 8 223 24 247 2088Jammu & 163 7 169 210 11 221 31 2 33 404 19 4232491KashmirKarnataka 887 39 926 1555 84 1639 245 88 333 2687 211 2898 3864
Kerala 889 307 1196 1178 532 1710 111 121 232 2178 960 3138 6508Madhya Pr. 470 24 494 706 42 748 98 29 1271273 96 1369 3548Maharashtra 1673 149 1822 3151 174 3325 475 107 581 5298 429 5728 10759Manipur 18 3 21 39 6 46 3 0 3 60 10 70 912Meghalaya 33 5 38 59 3 62 2 1 3 94 9 103 853
Mizoram 9 3 13 14 5 19 0 0 0 24 8 32 711Nagaland 8 1 9 14 2 16 0 0 0 23 3 25 646Orissa 280 8 288 393 15 408 71 13 83 743 36 779 1763Punjab 719 37 757 1098 42 1140 86 3 88 1903 82 1984 6310Rajasthan 522 18 540 811 17 828 113 18 131 1445 53 1498 4504
Sikkim 4 0 4 8 0 8 0 0 0 12 0 12 235Tamil Nadu 2073 167 2241 3480 546 4026 415 331 746 5968 1045 7013 10404Tripura 42 5 47 51 7 59 6 1 7 99 14 113 1634Uttar Pradesh 2463 99 2562 3768 71 3839 742 137 879 6974 307 7280 14268West Bengal 2176 164 2339 3480 287 3767 441 309 750 6096 759 6856 9455
A & N Islands 6 0 7 14 1 15 1 0 1 22 2 23 514Chandigarh 22 0 22 30 0 30 3 0 3 54 1 55 270D & N Haveli 3 0 3 4 0 4 1 0 1 8 0 8 165Daman & Diu 3 0 3 5 0 5 0 0 0 8 0 9 94Delhi 1172 48 1220 2456 62 2518 203 6 209 3832 115 3948 1868
Lakshadweep 0 0 0 0 0 0 0 0 0 1 0 1 28Pondicherry 37 5 42 72 48 120 12 1 13 121 54 175 336Jharkhand 204 4 209 284 5 289 22 7 29 511 16 5271247Chhatisgarh 133 8 141 244 12 257 39 5 44 417 25 442 903Uttaranchal 125 6 132 192 6 198 43 1 44 360 13 373 825
all India 17695 1277 18972 29019 2361 31380 3811 1454 5264 50525 5092 55616 108410
Annex-IV

186 SARVEKSHANA
Table 8: Estimated number of workers by type of worker, sex and by States/ UTs separately by sectorand type of enterprise
combined: DMEestimated number (in ‘00s) of workers
State/UT sampleworking owner hired worker other worker total worker number
ofworkers
male female all male female all male female all male female all
(1) (2) (3) (4) (5) (6) (7) (8) (9) (10) (11) (12) (13) (14)
Andhra Pr. 555 51 605 1960 900 2859 270 259 529 2785 1209 3994 12691Arunachal Pr. 0 0 0 1 1 2 0 0 0 1 1 2 112Assam 38 8 46 147 38 185 6 15 21 191 61 252 2081Bihar 93 3 96 373 97 470 52 39 90 518 138 656 2442Goa 12 2 14 52 14 66 4 7 11 68 23 91 902
Gujarat 650 16 665 3905 433 4339 252 28 279 4807 477 5283 15392Haryana 147 2 149 713 52 765 10 0 10 869 55 924 3805Himachal Pr. 40 5 45 145 12 157 4 0 4 189 17 206 1802Jammu & 43 1 43 211 46 257 27 9 36 281 56 3363525KashmirKarnataka 554 23 577 2349 1023 3371 427 187 614 3330 1233 4562 7121
Kerala 298 82 381 935 1020 1955 54 57 111 1288 1159 2447 9255Madhya Pr. 189 13 203 869 1601030 145 40 185 1204 214 1418 4510Maharashtra 1064 57 1121 5751 1193 6944 585 118 703 7400 1368 8768 22530Manipur 5 1 6 33 7 40 2 1 3 40 9 49 747Meghalaya 7 2 9 38 5 43 2 0 2 46 7 54 623
Mizoram 1 1 1 6 4 10 0 0 0 7 5 12 293Nagaland 1 0 1 4 1 6 0 0 0 5 2 7 273Orissa 85 3 88 357 119 476 42 8 50 483 131 614 1572Punjab 289 5 294 1485 108 1593 42 0 42 1815 113 1929 10191Rajasthan 176 3 179 822 142 964 64 14 77 1061 159 1220 5047
Sikkim 0 0 0 3 1 3 0 0 0 3 1 4 222Tamil Nadu 1016 89 1105 4152 2237 6389 361 393 754 5529 2719 8248 22537Tripura 3 0 3 23 0 23 3 0 3 28 0 29 317Uttar Pradesh 1145 122 1267 7512 1099 8612 836 85 920 9493 1306 10799 24055West Bengal 920 82 1001 4243 1226 5469 514 214 728 5677 1521 7198 15735
A & N Islands 2 0 2 11 2 13 1 0 1 14 2 17 474Chandigarh 20 4 24 100 4 103 7 1 7 126 8 134 740D & N Haveli 1 0 1 5 1 6 1 0 1 7 1 7 177Daman & Diu 3 0 3 16 0 17 0 0 0 19 0 20 280Delhi 681 18 699 3294 103 3397 155 1 155 4129 122 4251 4927
Lakshadweep 0 0 0 1 0 1 0 0 0 1 0 1 67Pondicherry 13 1 14 69 24 92 3 1 4 84 26 110 836Jharkhand 51 2 53 209 54 263 9 0 10 270 56 3261214Chhatisgarh 38 3 40 207 105 312 25 21 46 270 128 3991481Uttaranchal 66 1 67 115 20 135 9 0 10 191 21 212 782
all India 8205 599 8805 40116 10252 50368 3909 1498 5407 52230 12349 64579 178758
Annex-IV

SARVEKSHANA 187
Table 8: Estimated number of workers by type of worker, sex and by States/ UTs separately by sectorand type of enterprise
combined: allestimated number (in ‘00s) of workers
State/UT sampleworking owner hired worker other worker total worker number
ofworkers
male female all male female all male female all male female all
(1) (2) (3) (4) (5) (6) (7) (8) (9) (10) (11) (12) (13) (14)
Andhra Pr. 12119 6381 18500 4335 1282 5617 2841 6035 8876 19294 13698 32992 34415Arunachal Pr. 4 0 5 5 1 6 1 0 1 10 2 12 356Assam 2450 771 3221 577 73 650 557 559 1117 3584 1404 4988 10038Bihar 8291 1657 9948 1102 106 1208 2139 1698 3837 11531 3462 14993 17393Goa 207 71 278 137 27 164 47 113 161 391 211 603 1906
Gujarat 5234 861 6095 5735 514 6249 1612 924 2536 12581 2300 14881 26731Haryana 2190 367 2558 1309 71 1379 183 84 267 3682 522 4204 8886Himachal Pr. 911 287 1198 271 23 293 28 30 57 1209 339 1548 6207Jammu & 1915 299 2214 422 73 495 1011 1006 2017 3348 1378 4726 11286KashmirKarnataka 5406 5640 11046 3915 1113 5029 2103 2141 4244 11424 8894 20319 17587
Kerala 2989 2984 5973 2167 1610 3777 327 632 959 5483 5226 10709 21329Madhya Pr. 6621 2268 8890 1601 203 1803 1553 2200 3753 9775 4671 14446 18108Maharashtra 10194 2937 13131 8984 1370 10354 3697 2542 6239 22876 6848 29724 45041Manipur 103 495 598 73 13 86 28 77 105 203 585 789 4302Meghalaya 268 163 431 97 8 105 11 6 17 375 177 552 2177
Mizoram 66 19 85 20 10 30 2 1 3 89 29 118 1955Nagaland 39 26 65 18 3 22 8 6 14 65 35 101 2237Orissa 7824 3624 11448 798 188 987 3716 5843 9558 12338 9654 21993 11154Punjab 2806 1438 4244 2607 150 2757 277 170 447 5689 1757 7447 21401Rajasthan 5255 1875 7130 1656 161 1817 1190 1328 2518 8100 3364 11464 18073
Sikkim 17 0 17 10 1 11 2 0 2 29 1 30 631Tamil Nadu 9476 7628 17104 7790 2840 10630 2001 4700 6701 19267 15168 34435 45566Tripura 343 219 562 74 8 82 31 51 82 448 278 7265127Uttar Pradesh 20718 7408 28126 11461 1236 12697 7252 5961 13213 39431 14605 54036 59601West Bengal 20597 13703 34300 7846 1525 9371 5971 9039 15010 34414 24268 58681 38104
A & N Islands 27 1 28 26 3 28 12 3 14 64 7 71 1300Chandigarh 64 19 83 129 4 134 11 2 12 205 25 229 1125D & N Haveli 14 1 15 9 1 10 2 1 2 25 3 28 482Daman & Diu 10 3 13 21 0 22 1 1 2 33 4 36 491Delhi 2559 164 2723 5775 165 5941 500 55 554 8834 384 9218 7347
Lakshadweep 1 1 2 1 0 2 0 0 0 2 1 3 142Pondicherry 94 40 134 143 72 215 33 24 57 270 136 407 1485Jharkhand 4514 1042 5557 496 81 576 837 2215 3052 5847 3337 9185 8186Chhatisgarh 2151 489 2640 454 122 576 594 1111 1705 3199 1722 4921 5540Uttaranchal 1101 205 1307 311 26 337 291 262 552 1703 493 2196 2754
all India 136577 63090 199667 70376 13083 83459 38865 48817 87682 245819 124989 370808 458463
Annex-IV

188 SARVEKSHANA
Table 9: Annual emoluments (in Rs.) per hired worker by Industry division and by type of enterprise
rural
industry annual emoluments (in Rs.) estimated number of hired estimatedper hired worker workers total number of workers
NDME DME all NDME DME all NDME DME all
(1) (2) (3) (4) (5) (6) (7) (8) (9) (10)
01405 10689 4718 5539 250 1567 1817 586 1708 2294
15 11028 7817 9113 274175 405034 679209 564547 590291 1154838
16 11688 5056 6033 30463 176231 206694 48382 226309 274691
17 12039 16125 14830 155868 336045 491913 321468 464676 786143
18 9714 10762 9863 173508 28659 202167 319068 39838 358905
19 16182 17879 16972 5224 4552 9776 9971 6120 16091
20 15584 17767 16257 94772 42188 136960 172879 58683 231562
21 12382 22876 21345 1027 6011 7038 1771 7086 8857
22 15426 14914 15320 15462 3996 19458 24520 6981 31501
23 14189 13218 13875 5257 2520 7778 7837 3502 11339
24 14024 9066 9326 7395 133430 140824 11824 163136 174960
25 23214 19363 20508 11967 28287 40254 20139 36882 57021
26 19897 14542 14902 65074 902912 967985 119740 1046928 1166668
27 10679 28567 25272 3670 16254 19924 6035 18223 24258
28 16920 21006 18019 68158 25079 93237 122552 36294 158847
29 15421 32730 24180 10331 10583 20914 19040 14471 33511
30 - - - - - - - - -
31 11812 18306 16144 5755 11527 17282 10435 14443 24878
32 15297 13576 13955 321 1140 1461 638 1521 2159
33 16481 36898 24905 1199 842 2042 1878 1211 3089
34 19587 24767 23784 1093 4671 5764 2175 5745 7920
35 14511 43367 25891 2953 1923 4875 6105 2247 8352
36 14985 17175 16359 79800 134218 214018 141148 158806 299954
37 15127 26185 24813 66 466 532 149 564 713
all 13034 13104 13082 1013787 2278137 3291923 1932886 2905664 4838550
Annex-IV

SARVEKSHANA 189
Table 9: Annual emoluments (in Rs.) per hired worker by Industry division and by type of enterprise
urban
industry annual emoluments (in Rs.) estimated number of hired estimatedper hired worker workers total number of workers
NDME DME all NDME DME all NDME DME all
(1) (2) (3) (4) (5) (6) (7) (8) (9) (10)
01405 11358 12054 11736 1041 1234 2275 1911 1307 3218
15 17165 20084 18547 256466 230705 487171 492170 326974 819144
16 12350 13676 13282 5296 12532 17828 8998 15092 24090
17 21079 23440 22777 255695 654159 909854 430498 837672 1268170
18 17607 23580 20384 404499 351326 755825 683254 443282 1126537
19 18815 21316 20409 41276 72549 113825 73117 93713 166829
20 21119 22818 21850 118388 89360 207749 205094 124328 329422
21 22178 21823 21937 24665 52291 76957 41256 65878 107134
22 19983 26092 22880 121492 109567 231059 202882 142718 345601
23 14890 17971 15715 2947 1077 4024 4177 1465 5642
24 17083 26047 24135 17805 65695 83500 31426 84004 115430
25 23113 25975 24944 51243 91062 142305 81452 116559 198011
26 16082 17871 17429 48576 148116 196692 84330 186315 270645
27 20858 28122 24821 23740 28508 52248 41602 35651 77253
28 20178 24982 22352 250989 207395 458383 412748 271296 684044
29 24747 32207 28841 93294 113501 206796 145158 146088 291247
30 21976 38164 29760 348 322 670 590 381 971
31 18023 31750 28605 31358 105490 136848 51519 129633 181152
32 22823 25819 25262 5279 23082 28362 7831 28230 36061
33 24577 35676 31285 5541 8465 14006 8793 11160 19953
34 24978 29299 27920 21315 45475 66790 32692 57539 90231
35 21738 27231 25679 9412 23902 33314 15388 29405 44793
36 18431 25797 22040 329534 316700 646234 565279 394654 959933
37 17792 19335 18726 4014 6153 10167 6581 8902 15484
all 19365 24264 22133 2124214 2758668 4882882 3628747 3552248 7180994
Annex-IV

190 SARVEKSHANA
Table 9: Annual emoluments (in Rs.) per hired worker by Industry division and by type of enterprise
combined
industry annual emoluments (in Rs.) estimated number of hired estimatedper hired worker workers total number of workers
NDME DME all NDME DME all NDME DME all
(1) (2) (3) (4) (5) (6) (7) (8) (9) (10)
01405 11228 7950 8984 1291 2801 4092 2497 3015 5512
15 13994 12269 13054 530641 635739 1166380 1056717 917265 1973982
16 11786 5628 6609 35758 188763 224521 57381 241401 298781
17 17655 20958 19988 411563 990205 1401768 751966 1302348 2054314
18 15238 22614 18163 578007 379985 957992 1002322 483120 1485442
19 18519 21113 20137 46501 77100 123601 83087 99833 182920
20 18659 21198 19628 213161 131549 344709 377974 183010 560984
21 21787 21932 21888 25692 58303 83995 43027 72964 115991
22 19469 25699 22293 136954 113563 250517 227403 149699 377102
23 14441 14641 14502 8204 3597 11801 12014 4967 16980
24 16185 14668 14839 25199 199125 224324 43249 247140 290389
25 23132 24408 23966 63210 119349 182559 101591 153441 255032
26 18266 15011 15329 113650 1051027 1164677 204070 1233243 1437313
27 19496 28283 24946 27410 44762 72172 47636 53875 101511
28 19482 24553 21619 319146 232474 551620 535300 307591 842891
29 23817 32251 28413 103626 124084 227710 164199 160559 324758
30 21976 38164 29760 348 322 670 590 381 971
31 17060 30426 27208 37112 117018 154130 61954 144076 206030
32 22392 25243 24708 5601 24222 29823 8469 29751 38220
33 23136 35786 30473 6740 9308 16048 10671 12371 23042
34 24715 28877 27591 22408 50147 72554 34867 63284 98151
35 20012 28433 25706 12365 25825 38190 21493 31652 53145
36 17759 23231 20627 409334 450918 860252 706427 553460 1259887
37 17749 19817 19028 4080 6619 10699 6730 9467 16197
all 17320 19216 18488 3138000 5036805 8174805 5561632 6457912 12019544
Annex-IV
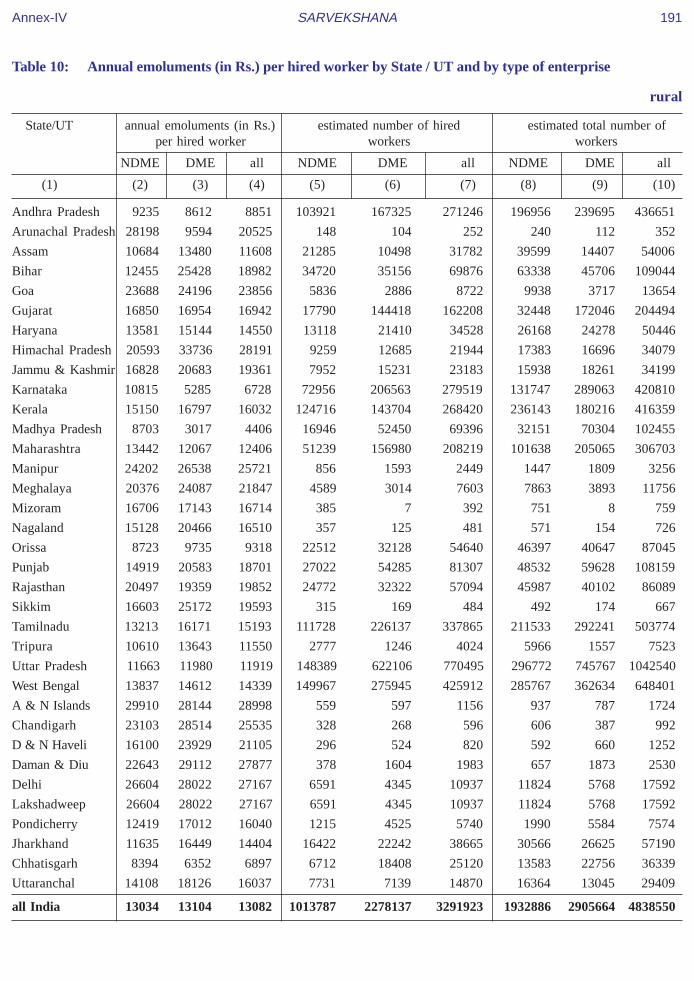
SARVEKSHANA 191
Table 10: Annual emoluments (in Rs.) per hired worker by State / UT and by type of enterprise
rural
State/UT annual emoluments (in Rs.) estimated number of hired estimated total number ofper hired worker workers workers
NDME DME all NDME DME all NDME DME all
(1) (2) (3) (4) (5) (6) (7) (8) (9) (10)
Andhra Pradesh 9235 8612 8851 103921 167325 271246 196956 239695 436651
Arunachal Pradesh 28198 9594 20525 148 104 252 240 112 352
Assam 10684 13480 11608 21285 10498 31782 39599 14407 54006
Bihar 12455 25428 18982 34720 35156 69876 63338 45706 109044
Goa 23688 24196 23856 5836 2886 8722 9938 3717 13654
Gujarat 16850 16954 16942 17790 144418 162208 32448 172046 204494
Haryana 13581 15144 14550 13118 21410 34528 26168 24278 50446
Himachal Pradesh 20593 33736 28191 9259 12685 21944 17383 16696 34079
Jammu & Kashmir 16828 20683 19361 7952 15231 23183 15938 18261 34199
Karnataka 10815 5285 6728 72956 206563 279519 131747 289063 420810
Kerala 15150 16797 16032 124716 143704 268420 236143 180216 416359
Madhya Pradesh 8703 3017 4406 16946 52450 69396 32151 70304 102455
Maharashtra 13442 12067 12406 51239 156980 208219 101638 205065 306703
Manipur 24202 26538 25721 856 1593 2449 1447 1809 3256
Meghalaya 20376 24087 21847 4589 3014 7603 7863 3893 11756
Mizoram 16706 17143 16714 385 7 392 751 8 759
Nagaland 15128 20466 16510 357 125 481 571 154 726
Orissa 8723 9735 9318 22512 32128 54640 46397 40647 87045
Punjab 14919 20583 18701 27022 54285 81307 48532 59628 108159
Rajasthan 20497 19359 19852 24772 32322 57094 45987 40102 86089
Sikkim 16603 25172 19593 315 169 484 492 174 667
Tamilnadu 13213 16171 15193 111728 226137 337865 211533 292241 503774
Tripura 10610 13643 11550 2777 1246 4024 5966 1557 7523
Uttar Pradesh 11663 11980 11919 148389 622106 770495 296772 745767 1042540
West Bengal 13837 14612 14339 149967 275945 425912 285767 362634 648401
A & N Islands 29910 28144 28998 559 597 1156 937 787 1724
Chandigarh 23103 28514 25535 328 268 596 606 387 992
D & N Haveli 16100 23929 21105 296 524 820 592 660 1252
Daman & Diu 22643 29112 27877 378 1604 1983 657 1873 2530
Delhi 26604 28022 27167 6591 4345 10937 11824 5768 17592
Lakshadweep 26604 28022 27167 6591 4345 10937 11824 5768 17592
Pondicherry 12419 17012 16040 1215 4525 5740 1990 5584 7574
Jharkhand 11635 16449 14404 16422 22242 38665 30566 26625 57190
Chhatisgarh 8394 6352 6897 6712 18408 25120 13583 22756 36339
Uttaranchal 14108 18126 16037 7731 7139 14870 16364 13045 29409
all India 13034 13104 13082 1013787 2278137 3291923 1932886 2905664 4838550
Annex-IV

192 SARVEKSHANA
Table 10: Annual emoluments (in Rs.) per hired worker by State / UT and by type of enterprise
urban
State/UT annual emoluments (in Rs.) estimated number of hired estimated total number ofper hired worker workers workers
NDME DME all NDME DME all NDME DME all
(1) (2) (3) (4) (5) (6) (7) (8) (9) (10)
Andhra Pradesh 14742 19093 16965 113491 118589 232080 205436 159656 365092
Arunachal Pradesh 43689 30351 40163 236 85 321 405 109 514
Assam 13787 17435 14675 24954 8022 32976 41510 10824 52334
Bihar 14960 19757 16141 36297 11848 48145 63021 19931 82953
Goa 20967 32125 26875 3319 3735 7053 5679 5362 11040
Gujarat 22302 28699 26308 172801 289432 462233 280880 356275 637154
Haryana 20487 27086 24050 46945 55113 102057 83305 68164 151469
Himachal Pradesh 20831 25698 22859 4287 3064 7351 7281 3927 11208
Jammu & Kashmir 22499 23226 22809 14126 10513 24639 26374 15357 41731
Karnataka 17353 22441 20352 90913 130577 221490 158031 167164 325195
Kerala 20963 20968 20966 46314 51791 98105 77631 64451 142082
Madhya Pradesh 15846 22352 18879 57852 50507 108359 104745 71455 176199
Maharashtra 23379 27744 26244 281232 537436 818668 471117 671732 1142849
Manipur 20172 17938 19287 3710 2432 6141 5510 3138 8648
Meghalaya 22275 24832 23407 1594 1266 2860 2469 1482 3950
Mizoram 23356 37664 29110 1518 1021 2540 2452 1171 3623
Nagaland 20206 20363 20247 1235 437 1672 1975 517 2493
Orissa 14567 14964 14749 18303 15431 33734 31500 20752 52252
Punjab 20797 25461 23348 86948 104987 191934 149909 133254 283163
Rajasthan 21154 23713 22497 58031 64072 122103 103855 81923 185778
Sikkim 20792 25945 22159 479 173 651 756 218 974
Tamilnadu 18614 21739 20448 290894 412768 703662 489717 532576 1022293
Tripura 14030 14887 14245 3084 1035 4120 5296 1326 6622
Uttar Pradesh 16126 19953 18054 235508 239060 474568 431244 334119 765363
West Bengal 14746 17944 16487 226695 270934 497629 399800 357162 756962
A & N Islands 21028 26339 23305 947 711 1658 1387 902 2289
Chandigarh 21686 33504 31009 2692 10060 12752 4914 12995 17909
D & N Haveli 20560 23415 21614 102 60 161 176 78 254
Daman & Diu 13603 23395 16348 121 47 168 202 98 299
Delhi 25410 29701 27889 245240 335310 580550 382939 419371 802310
Lakshadweep 25410 29701 27889 245240 335310 580550 382939 419371 802310
Pondicherry 11297 17044 13046 10796 4724 15520 15486 5465 20951
Jharkhand 16398 17077 16565 12518 4083 16601 22140 5926 28066
Chhatisgarh 16132 18425 17058 18946 12836 31782 30577 17093 47670
Uttaranchal 16738 18794 17451 12048 6396 18444 20956 8153 29109
all India 19365 24264 22133 2124214 2758668 4882882 3628747 3552248 7180994
Annex-IV

SARVEKSHANA 193
Table 10: Annual emoluments (in Rs.) per hired worker by State / UT and by type of enterprise
combined
State/UT annual emoluments (in Rs.) estimated number of hired estimated total number ofper hired worker workers workers
NDME DME all NDME DME all NDME DME all
(1) (2) (3) (4) (5) (6) (7) (8) (9) (10)
Andhra Pradesh 12110 12959 12592 217412 285914 503326 402392 399351 801743
Arunachal Pradesh 37728 18937 31539 384 189 573 645 220 866
Assam 12359 15193 13169 46239 18520 64758 81109 25231 106340
Bihar 13735 23999 17823 71017 47004 118021 126360 65637 191997
Goa 22702 28669 25206 9155 6621 15776 15616 9078 24695
Gujarat 21793 24790 23875 190590 433850 624440 313327 528321 841648
Haryana 18979 23744 21649 60063 76523 136585 109473 92442 201915
Himachal Pradesh 20668 32172 26853 13546 15749 29295 24664 20623 45288
Jammu & Kashmir 20457 21721 21137 22079 25743 47822 42312 33618 75929
Karnataka 14442 11929 12751 163869 337140 501009 289777 456227 746005
Kerala 16724 17902 17352 171029 195495 366525 313775 244667 558441
Madhya Pradesh 14228 12502 13228 74798 102957 177755 136896 141758 278655
Maharashtra 21848 24200 23438 332471 694416 1026887 572755 876796 1449552
Manipur 20927 21342 21122 4566 4025 8591 6957 4947 11904
Meghalaya 20866 24307 22273 6183 4279 10462 10331 5374 15706
Mizoram 22012 37524 27453 1903 1028 2931 3203 1179 4382
Nagaland 19068 20386 19412 1592 561 2153 2547 672 3218
Orissa 11344 11431 11391 40815 47558 88373 77897 61399 139296
Punjab 19403 23798 21965 113969 159272 273241 198441 192881 391323
Rajasthan 20957 22253 21655 82803 96394 179197 149843 122025 271868
Sikkim 19129 25563 21065 793 342 1135 1248 392 1641
Tamilnadu 17115 19769 18743 402622 638905 1041527 701250 824817 1526067
Tripura 12409 14207 12913 5862 2282 8143 11262 2883 14145
Uttar Pradesh 14401 14194 14257 383896 861166 1245063 728016 1079887 1807903
West Bengal 14384 16262 15496 376662 546879 923541 685567 719796 1405363
A & N Islands 24325 27163 25644 1506 1308 2814 2323 1689 4013
Chandigarh 21840 33374 30765 3020 10328 13348 5520 13382 18902
D & N Haveli 17240 23876 21189 397 583 981 769 737 1506
Daman & Diu 20452 28948 26975 499 1651 2151 859 1970 2830
Delhi 25442 29680 27875 251831 339655 591486 394763 425139 819902
Lakshadweep 25442 29680 27875 251831 339655 591486 394763 425139 819902
Pondicherry 11410 17028 13854 12012 9249 21260 17476 11049 28525
Jharkhand 13695 16546 15053 28941 26325 55266 52706 32551 85257
Chhatisgarh 14108 11312 12572 25658 31243 56901 44159 39850 84009
Uttaranchal 15710 18442 16820 19779 13535 33315 37320 21198 58517
all India 17320 19216 18488 3138000 5036805 8174805 5561632 6457912 12019544
Annex-IV

194 SARVEKSHANA
Table 11: Fixed assets and outstanding loans per enterprise as on date of survey by industry (NIC Code)
rural: OAME
industry market value (in Rs.) of assets net annual loans outstanding number of(NIC addition to rent (in (in Rs.) enterprisesCode) owned hired all fixed assets Rs.) amount annual sample estimated
(in Rs.) payable interest (in ‘00s)during last on hired365 days assets
(1) (2) (3) (4) (5) (6) (7) (8) (9) (10)
01405 34997 4290 39287 745 297 1451 513 16 18
15 29687 2533 32220 974 145 1042 200 8952 21043
16 6456 126 6582 21 6 2 1 3526 16159
17 16687 586 17273 256 30 323 82 6249 15520
18 15056 6100 21156 239 331 262 60 8464 15457
19 14176 3951 18127 33 240 381 92 565 876
20 7914 516 8429 57 29 176 57 10783 24024
21 6584 61 6645 25 2 32 7 84 252
22 173908 16143 190051 1014 911 3677 642 77 138
23 1731 354 2085 8 36 0 0 19 22
24 11490 548 12038 287 23 1261 29 349 902
25 15117 2042 17159 71 48 1002 329 187 246
26 15143 523 15666 71 22 104 24 3310 5942
27 16028 15262 31290 236 525 184 1 98 112
28 15074 2437 17511 321 149 637 126 1779 3253
29 21655 2258 23913 247 105 854 127 329 730
30 - - - - - - - - -
31 34809 11287 46097 3279 589 300 46 82 180
32 29787 447 30234 320 22 3909 938 4 6
33 111881 425 112307 2855 1702 0 0 7 9
34 8173 30007 38180 144 2235 966 191 9 25
35 28241 7083 35325 392 48 3352 490 27 31
36 17763 4446 22209 319 208 692 137 2617 5573
37 13087 18328 31415 61 860 0 0 35 65
all 15633 2001 17634 311 108 406 86 47568 110582
Annex-IV

SARVEKSHANA 195
Table 11: Fixed assets and outstanding loans per enterprise as on date of survey by industry (NIC Code)
rural: NDME
industry market value (in Rs.) of assets net annual loans outstanding number of(NIC addition to rent (in (in Rs.) enterprisesCode) owned hired all fixed assets Rs.) amount annual sample estimated
(in Rs.) payable interest (in ‘00s)during last on hired365 days assets
(1) (2) (3) (4) (5) (6) (7) (8) (9) (10)
01405 61139 13835 74974 2587 210 0 0 5 2
15 97061 12543 109604 3837 874 9499 1831 1998 1906
16 36542 7455 43998 131 472 968 51 154 127
17 49708 5292 55001 620 315 5396 878 1113 922
18 22439 36230 58669 1111 2323 1202 243 1491 1201
19 41526 41620 83147 16 2083 5254 2318 61 32
20 64844 19009 83852 948 1292 8424 2108 799 562
21 342047 62079 404125 869 1995 294542 44631 14 4
22 127592 80223 207815 7862 4894 16970 2653 117 75
23 168558 43784 212341 8 2025 0 0 9 24
24 100414 53729 154143 3282 2137 19337 5004 58 30
25 268469 40697 309167 6099 4351 37348 5976 85 54
26 51273 25518 76791 2714 2911 4777 771 443 346
27 74563 2941 77504 167 330 5622 357 47 17
28 73867 36806 110673 3478 2627 13715 2791 724 407
29 148063 61736 209798 2543 1840 11366 1839 127 65
30 - - - - - - - - -
31 128689 25257 153945 5355 1970 7007 1186 37 31
32 24981 14068 39049 793 2533 15043 2050 5 2
33 76039 21 76060 274 85 0 0 4 5
34 120219 107040 227258 2449 7123 21020 4639 23 6
35 33973 4786 38759 770 131 707 127 15 17
36 36458 32736 69194 2115 2584 5633 977 765 460
37 54514 0 54514 0 0 4293 600 9 0
all 65771 22375 88146 2301 1561 7256 1392 8103 6295
Annex-IV

196 SARVEKSHANA
Table 11: Fixed assets and outstanding loans per enterprise as on date of survey by industry (NIC Code)
rural: DME
industry market value (in Rs.) of assets net annual loans outstanding number of(NIC addition to rent (in (in Rs.) enterprisesCode) owned hired all fixed assets Rs.) amount annual sample estimated
(in Rs.) payable interest (in ‘00s)during last on hired365 days assets
(1) (2) (3) (4) (5) (6) (7) (8) (9) (10)
01405 1715750 0 1715750 2627 0 1044665 49163 8 1
15 190502 22350 212852 8347 2547 69784 11832 1039 658
16 77339 4676 82015 685 183 16575 2004 359 196
17 217150 13296 230446 15975 1083 131753 8984 1078 453
18 87733 43636 131369 2884 3010 28091 4757 100 55
19 74449 84440 158889 8770 8880 15685 2311 13 7
20 355204 53977 409180 27712 2198 81881 14816 261 78
21 1481265 153216 1634481 35228 5493 521716 80091 33 6
22 224964 59536 284500 21560 4114 41827 4071 28 11
23 222998 149 223147 168 673 34930 5794 9 5
24 296402 24793 321195 23267 1229 445097 85323 178 141
25 481534 90199 571733 14030 9407 237471 35506 124 43
26 382683 183084 565767 88727 9867 54094 10396 1250 579
27 587037 61609 648646 169 5823 1252099 158859 27 14
28 450756 53208 503964 26056 4017 126434 19329 163 48
29 562410 83767 646177 16845 8389 160954 63633 77 18
30 - - - - - - - - -
31 271802 146255 418057 41217 18921 171902 26240 38 12
32 143898 358203 502100 77432 18581 117738 14955 5 2
33 296052 127346 423398 154468 14217 74179 10017 9 1
34 904515 88885 993400 53178 10411 125035 19336 38 6
35 102882 48431 151313 2036 2512 14579 2795 8 3
36 128799 25356 154154 4853 1882 31514 5507 244 133
37 325732 63885 389617 1786 7305 83984 13160 10 1
all 257720 62964 320684 30106 4054 105204 15949 5099 2469
Annex-IV

SARVEKSHANA 197
Table 11: Fixed assets and outstanding loans per enterprise as on date of survey by industry (NIC Code)
rural: all
industry market value (in Rs.) of assets net annual loans outstanding number of(NIC addition to rent (in (in Rs.) enterprisesCode) owned hired all fixed assets Rs.) amount annual sample estimated
(in Rs.) payable interest (in ‘00s)during last on hired365 days assets
(1) (2) (3) (4) (5) (6) (7) (8) (9) (10)
01405 91064 5168 96231 1000 278 34373 2001 29 21
15 39609 3894 43503 1411 271 3641 656 11989 23607
16 7531 236 7767 30 12 207 25 4039 16482
17 23859 1183 25042 697 74 4120 364 8440 16894
18 15824 8388 24212 311 483 421 89 10055 16712
19 15573 5856 21429 98 368 664 186 639 915
20 10312 1107 11419 165 64 623 151 11843 24664
21 45465 4521 49986 842 158 16516 2528 131 263
22 160892 39630 200522 4288 2395 9950 1479 222 224
23 101151 20559 121709 24 1025 3430 569 37 51
24 51352 5218 56570 3385 240 59983 11356 585 1073
25 114096 19287 133382 2787 1911 36586 5661 396 344
26 47959 17178 65138 7681 998 4893 936 5003 6868
27 80008 18385 98393 221 1029 125553 15869 172 143
28 27113 6862 33975 997 471 3685 664 2666 3707
29 43627 8805 52431 794 426 5205 1657 533 813
30 - - - - - - - - -
31 60824 20659 81483 5658 1791 10692 1648 157 223
32 51408 73692 125101 15639 4165 28508 3918 14 10
33 116818 11225 128043 15117 2286 6384 862 20 15
34 168612 51740 220352 8942 4320 23904 3948 70 36
35 34134 8534 42668 605 207 3076 493 50 50
36 21546 7007 28554 551 421 1723 315 3626 6166
37 16065 18617 34682 76 911 759 119 54 66
all 23285 4336 27621 1033 266 2935 483 60770 119346
Annex-IV

198 SARVEKSHANA
Table 11: Fixed assets and outstanding loans per enterprise as on date of survey by industry (NIC Code)
urban: OAME
industry market value (in Rs.) of assets net annual loans outstanding number of(NIC addition to rent (in (in Rs.) enterprisesCode) owned hired all fixed assets Rs.) amount annual sample estimated
(in Rs.) payable interest (in ‘00s)during last on hired365 days assets
(1) (2) (3) (4) (5) (6) (7) (8) (9) (10)
01405 23595 22110 45705 108 1937 0 0 59 36
15 46087 22040 68127 1132 1655 1585 348 7866 4524
16 9966 1933 11899 53 85 21 2 4212 4515
17 35023 7737 42760 455 381 647 170 7937 5221
18 23913 20238 44152 226 971 311 72 13563 8709
19 40000 30632 70632 203 1223 2608 454 1075 527
20 19123 11187 30310 431 391 1886 176 4490 2659
21 24858 9164 34022 448 421 169 10 591 436
22 71465 60159 131624 3807 3171 5363 896 825 436
23 58290 25282 83572 1 1762 5802 0 12 6
24 10276 8777 19052 137 290 229 39 992 961
25 37946 25680 63626 1341 1741 972 254 441 250
26 27340 6295 33635 819 256 375 99 1819 923
27 46900 23510 70411 1341 1900 395 48 233 87
28 53503 36954 90457 901 1961 1783 302 2121 1154
29 96680 68757 165437 1624 3588 5456 1184 569 261
30 - - - - - - - - -
31 31123 95222 126345 1573 3520 18127 3452 293 133
32 79715 11049 90764 429 75 2398 1236 16 10
33 45954 38751 84705 4210 2896 13945 2114 58 32
34 116567 92149 208716 6269 5917 4304 650 57 26
35 123035 21628 144663 260 1623 232 23 64 32
36 38616 31971 70587 847 1616 1174 232 6854 5079
37 52759 34071 86830 108 1230 192 64 115 57
all 30711 18486 49197 567 970 983 188 54262 36072
Annex-IV

SARVEKSHANA 199
Table 11: Fixed assets and outstanding loans per enterprise as on date of survey by industry (NIC Code)
urban: NDME
industry market value (in Rs.) of assets net annual loans outstanding number of(NIC addition to rent (in (in Rs.) enterprisesCode) owned hired all fixed assets Rs.) amount annual sample estimated
(in Rs.) payable interest (in ‘00s)during last on hired365 days assets
(1) (2) (3) (4) (5) (6) (7) (8) (9) (10)
01405 87339 50186 137525 195 2545 280 0 18 7
15 147546 67322 214868 5123 3252 8169 1292 3420 1578
16 43648 15661 59309 965 649 3891 687 72 28
17 140269 56929 197198 3775 3361 13294 2195 3172 1128
18 63611 102848 166460 1096 5703 2328 516 4726 2196
19 88292 78031 166323 2094 4222 5492 786 564 212
20 152854 64526 217380 6827 3195 12105 1776 1641 627
21 160765 220040 380805 8971 13878 6581 1377 215 114
22 190340 169553 359893 8659 8142 20845 3134 1369 606
23 286463 6267 292731 1413 492 16136 2198 15 10
24 187764 77267 265031 11023 4192 19927 2882 243 91
25 229509 158438 387946 7444 9384 48491 9304 476 222
26 146408 76264 222672 5660 4165 16079 2571 682 240
27 165610 97626 263236 677 5236 13971 2046 312 119
28 173034 107459 280493 3422 6869 10617 2002 2899 1212
29 293382 131366 424748 23208 10209 42763 9738 877 402
30 85248 183300 268548 1723 22196 637 0 6 1
31 142203 115225 257428 3064 6249 8593 1412 335 143
32 325560 157368 482927 13959 8326 13724 547 30 20
33 174126 106687 280812 6159 6659 8106 1673 72 26
34 674251 150669 824920 2638 5606 9276 1334 156 89
35 282347 62517 344865 8152 5985 35815 8048 98 43
36 120802 85646 206448 3512 3843 5850 1008 3434 1689
37 162614 108889 271502 454 3682 10192 1544 59 18
all 142757 94495 237252 4692 5175 10881 1942 24891 10822
Annex-IV

200 SARVEKSHANA
Table 11: Fixed assets and outstanding loans per enterprise as on date of survey by industry (NIC Code)
urban: DME
industry market value (in Rs.) of assets net annual loans outstanding number of(NIC addition to rent (in (in Rs.) enterprisesCode) owned hired all fixed assets Rs.) amount annual sample estimated
(in Rs.) payable interest (in ‘00s)during last on hired365 days assets
(1) (2) (3) (4) (5) (6) (7) (8) (9) (10)
01405 359025 544994 904019 1067 8131 243981 30172 5 1
15 426695 174531 601225 23244 8643 73395 14245 1139 404
16 162168 79141 241309 1405 4114 24812 2952 56 14
17 410284 120577 530860 12191 11042 55899 9303 3141 889
18 279312 233251 512563 11261 14915 37648 5018 1008 479
19 199367 184582 383949 12115 15961 31520 3921 306 106
20 568013 156415 724428 20550 4777 59027 8970 569 167
21 456887 330859 787747 24160 19081 140562 18337 219 77
22 677026 290797 967823 58228 64588 150120 28471 522 174
23 483327 35128 518454 6 976 120329 35820 15 2
24 749084 373362 1122446 44247 18105 241403 44931 318 78
25 653895 294610 948505 27684 24361 237411 36677 438 137
26 594288 136102 730391 57481 2548 113248 14656 574 170
27 1403868 183064 1586932 3210 12696 473881 67915 188 39
28 432561 221898 654460 10503 12899 51411 9453 1264 352
29 761175 295873 1057047 34987 20879 164525 27509 749 188
30 499451 560967 1060418 4600 37262 81523 16437 10 0
31 340481 318261 658742 13546 17217 242275 28448 242 157
32 626628 513289 1139917 25988 21061 75849 17931 43 28
33 699914 274326 974240 307884 17386 195369 33123 55 13
34 592712 364642 957353 18757 15163 69878 14013 190 72
35 988089 120207 1108296 14908 5278 116160 19626 173 37
36 257813 238738 496551 8548 10284 58991 8975 1312 403
37 199917 319882 519799 4614 12123 569 136 35 14
all 452222 211395 663617 20524 14739 90598 14449 12571 4002
Annex-IV

SARVEKSHANA 201
Table 11: Fixed assets and outstanding loans per enterprise as on date of survey by industry (NIC Code)
urban: all
industry market value (in Rs.) of assets net annual loans outstanding number of(NIC addition to rent (in (in Rs.) enterprisesCode) owned hired all fixed assets Rs.) amount annual sample estimated
(in Rs.) payable interest (in ‘00s)during last on hired365 days assets
(1) (2) (3) (4) (5) (6) (7) (8) (9) (10)
01405 37521 32710 70231 133 2105 2948 359 82 43
15 94342 42497 136839 3474 2477 7643 1440 12425 6506
16 10646 2257 12903 62 100 122 15 4340 4557
17 97512 29261 126773 2414 2155 9404 1607 14250 7237
18 42320 45137 87457 858 2471 2271 366 19297 11384
19 72069 61799 133868 2168 3821 6950 971 1945 845
20 69979 27905 97884 2567 1113 6507 893 6700 3454
21 102903 87231 190134 4925 5172 18662 2521 1025 628
22 217114 147594 364708 13990 14411 33732 5946 2716 1216
23 237001 15591 252592 805 949 24845 5367 42 18
24 75701 39532 115233 4066 1837 18522 3378 1553 1129
25 246616 134706 381323 9503 9626 71583 11763 1355 610
26 121137 35458 156595 8923 1252 17609 2402 3075 1333
27 322451 85123 407574 1318 5253 83021 11916 733 246
28 155866 92332 248198 3268 5566 12145 2245 6284 2718
29 336232 148448 484680 19187 10532 58176 11034 2195 851
30 189786 278617 468403 2449 25998 21051 4148 16 2
31 180036 182746 362781 6409 9390 96300 11847 870 432
32 430426 305645 736071 17525 13124 41999 9109 89 58
33 214925 107656 322581 61416 6981 45535 7719 185 71
34 565543 225404 790946 9380 9349 32047 6147 403 187
35 468015 69731 537745 8110 4507 51967 9547 335 112
36 70294 56234 126528 1907 2628 5524 906 11600 7171
37 97463 92908 190371 867 3392 2270 374 209 89
all 87676 49815 137491 3013 2947 10134 1682 91724 50895
Annex-IV

202 SARVEKSHANA
Table 11: Fixed assets and outstanding loans per enterprise as on date of survey by industry (NIC Code)
combined: OAME
industry market value (in Rs.) of assets net annual loans outstanding number of(NIC addition to rent (in (in Rs.) enterprisesCode) owned hired all fixed assets Rs.) amount annual sample estimated
(in Rs.) payable interest (in ‘00s)during last on hired365 days assets
(1) (2) (3) (4) (5) (6) (7) (8) (9) (10)
01405 27389 16180 43569 320 1391 483 171 75 54
15 32589 5985 38574 1002 412 1138 226 16818 25567
16 7223 521 7743 28 23 7 1 7738 20674
17 21303 2386 23689 306 119 404 104 14186 20741
18 18248 11195 29444 235 562 280 64 22027 24166
19 23873 13969 37842 97 609 1217 228 1640 1403
20 9031 1579 10610 95 65 346 69 15273 26683
21 18157 5826 23982 293 267 119 9 675 688
22 96093 49578 145670 3136 2628 4958 835 902 575
23 13255 5433 18688 7 388 1182 0 31 28
24 10864 4791 15655 210 161 729 34 1341 1863
25 26624 13958 40582 711 902 987 291 628 496
26 16782 1299 18081 172 53 140 34 5129 6865
27 29560 18877 48437 721 1128 277 21 331 199
28 25137 11476 36612 473 624 937 172 3900 4406
29 41396 19756 61151 609 1022 2065 406 898 991
30 - - - - - - - - -
31 33243 46936 80179 2554 1834 7871 1493 375 312
32 60410 6950 67360 387 55 2983 1121 20 16
33 60894 30066 90960 3903 2625 10785 1635 65 41
34 63678 61827 125505 3280 4120 2676 426 66 50
35 76628 14507 91135 325 852 1759 252 91 63
36 27705 17570 45276 571 879 921 182 9471 10652
37 31707 25717 57424 83 1034 90 30 150 122
all 19342 6055 25397 374 320 548 111 101830 146654
Annex-IV

SARVEKSHANA 203
Table 11: Fixed assets and outstanding loans per enterprise as on date of survey by industry (NIC Code)
combined: NDME
industry market value (in Rs.) of assets net annual loans outstanding number of(NIC addition to rent (in (in Rs.) enterprisesCode) owned hired all fixed assets Rs.) amount annual sample estimated
(in Rs.) payable interest (in ‘00s)during last on hired365 days assets
(1) (2) (3) (4) (5) (6) (7) (8) (9) (10)
01405 80866 41205 122071 786 1969 211 0 23 9
15 119926 37353 157279 4419 1951 8896 1587 5418 3484
16 37827 8939 46767 282 504 1496 166 226 155
17 99535 33703 133237 2356 1991 9742 1603 4285 2049
18 49053 79292 128345 1102 4508 1930 419 6217 3397
19 82207 73293 155500 1823 3944 5461 985 625 244
20 111260 43014 154274 4048 2296 10365 1933 2440 1190
21 167011 214598 381608 8692 13468 16502 2867 229 118
22 183460 159759 343219 8572 7786 20420 3081 1486 681
23 204111 32471 236582 432 1563 4866 663 24 34
24 165983 71398 237381 9093 3680 19780 3411 301 121
25 237173 135275 372449 7179 8394 46299 8650 561 277
26 90203 46283 136486 3920 3424 9402 1508 1125 586
27 154057 85611 239668 612 4613 12912 1832 359 137
28 148103 89696 237799 3436 5803 11396 2201 3623 1619
29 273144 121669 394812 20330 9043 38390 8638 1004 467
30 85248 183300 268548 1723 22196 637 0 6 1
31 139811 99300 239111 3470 5491 8312 1372 372 173
32 299374 144884 444257 12812 7821 13839 678 35 22
33 159423 90698 250120 5277 5674 6891 1422 76 31
34 640150 147984 788134 2626 5700 9999 1537 179 94
35 213715 46565 260280 6112 4368 26114 5859 113 60
36 102744 74318 177063 3213 3573 5804 1001 4199 2150
37 160303 106561 266864 444 3603 10066 1524 68 18
all 114445 67972 182417 3813 3846 9548 1740 32994 17117
Annex-IV

204 SARVEKSHANA
Table 11: Fixed assets and outstanding loans per enterprise as on date of survey by industry (NIC Code)
combined: DME
industry market value (in Rs.) of assets net annual loans outstanding number of(NIC addition to rent (in (in Rs.) enterprisesCode) owned hired all fixed assets Rs.) amount annual sample estimated
(in Rs.) payable interest (in ‘00s)during last on hired365 days assets
(1) (2) (3) (4) (5) (6) (7) (8) (9) (10)
01405 1121314 238784 1360098 1943 3563 693853 40842 13 1
15 280385 80262 360647 14016 4867 71158 12751 2178 1062
16 83051 9690 92741 734 448 17129 2067 415 210
17 345128 84384 429512 13468 7682 81489 9196 4219 1341
18 259722 213861 473583 10404 13698 36671 4991 1108 534
19 191806 178520 370325 11913 15533 30562 3823 319 113
20 500181 123763 623943 22833 3955 66312 10833 830 245
21 530483 318097 848580 24956 18105 167945 22773 252 83
22 650678 277318 927996 56091 61063 143808 27049 550 184
23 299132 10378 309510 121 761 59905 14575 24 7
24 458170 149356 607526 30764 7260 372306 70888 496 219
25 612558 245587 858144 24409 20774 237426 36396 562 181
26 430720 172418 603138 81634 8206 67523 11363 1824 749
27 1187208 150848 1338056 2403 10873 680300 92038 215 54
28 434727 201820 636547 12354 11841 60341 10629 1427 399
29 743919 277459 1021377 33412 19795 164215 30645 826 205
30 499451 560967 1060418 4600 37262 81523 16437 10 0
31 335490 305761 641251 15557 17341 237161 28287 280 169
32 594840 503077 1097916 29376 20898 78607 17735 48 30
33 663556 261093 924649 294072 17100 184458 31043 64 15
34 615681 344328 960009 21293 14813 73941 14405 228 78
35 928047 115339 1043386 14035 5090 109270 18484 181 39
36 225865 185898 411763 7633 8203 52187 8116 1556 536
37 205019 309500 514519 4500 11927 3952 664 45 14
all 378014 154765 532778 24180 10662 96170 15021 17670 6470
Annex-IV

SARVEKSHANA 205
Table 11: Fixed assets and outstanding loans per enterprise as on date of survey by industry (NIC Code)
combined: all
industry market value (in Rs.) of assets net annual loans outstanding number of(NIC addition to rent (in (in Rs.) enterprisesCode) owned hired all fixed assets Rs.) amount annual sample estimated
(in Rs.) payable interest (in ‘00s)during last on hired365 days assets
(1) (2) (3) (4) (5) (6) (7) (8) (9) (10)
01405 54923 23758 78681 415 1512 13161 893 111 64
15 51434 12234 63669 1857 747 4506 826 24414 30113
16 8206 674 8880 37 31 189 23 8379 21039
17 45947 9604 55551 1212 698 5705 737 22690 24131
18 26560 23278 49837 533 1288 1171 201 29352 28096
19 42694 32712 75406 1092 2025 3682 563 2584 1759
20 17641 4398 22039 460 193 1346 242 18543 28118
21 85962 62837 148799 3721 3693 18029 2523 1156 890
22 208385 130832 339217 12484 12545 30040 5252 2938 1440
23 136612 19262 155874 228 1005 9020 1822 79 69
24 63837 22813 86651 3734 1059 38723 7265 2138 2202
25 198846 93100 291946 7082 6845 58967 9563 1751 953
26 59851 20149 79999 7883 1039 6959 1174 8078 8201
27 233265 60572 293837 915 3699 98667 13370 905 389
28 81574 43014 124588 1958 2626 7263 1333 8950 6425
29 193207 80191 273398 10197 5592 32284 6451 2728 1664
30 189786 278617 468403 2449 25998 21051 4148 16 2
31 139496 127626 267122 6154 6806 67188 8379 1027 655
32 374412 271366 645777 17246 11800 40005 8342 103 68
33 197643 90669 288311 53260 6154 38639 6511 205 87
34 501127 197221 698348 9309 8533 30726 5790 473 223
35 334282 50868 385150 5797 3182 36897 6757 385 162
36 47757 33476 81233 1280 1608 3767 633 15226 13337
37 62841 61309 124150 530 2337 1627 265 263 154
all 42535 17933 60468 1625 1068 5087 842 152494 170241
Annex-IV

206 SARVEKSHANA
Table 12: Fixed assets and outstanding loans per enterprise as on date of survey by States/ UTs
rural: OAME
State/UT market value (in Rs.) of assets net annual loans outstanding number of addition to rent (in (in Rs.) enterprises
owned hired all fixed assets Rs.) amount annual sample estimated(in Rs.) hired interest (in ‘00s)
during last assets365 days
(1) (2) (3) (4) (5) (6) (7) (8) (9) (10)
Andhra Pradesh 13083 3178 16261 307 146 336 66 4719 11150Arunachal Pradesh 18075 5661 23737 540 1062 484 269 30 2Assam 9848 560 10407 82 49 133 50 2327 2241Bihar 15981 625 16605 83 62 205 39 4240 6603Goa 31278 6261 37539 65 216 664 100 133 150
Gujarat 24656 2065 26721 839 211 265 35 1255 2220Haryana 38574 13655 52228 1348 616 893 168 650 897Himachal Pradesh 22965 4565 27530 763 255 439 55 1085 828Jammu & Kashmir 29672 2362 32034 80 94 332 45 1464 1324Karnataka 15017 1375 16392 88 81 589 96 1726 6133
Kerala 16587 6581 23169 422 311 1468 271 2571 3279Madhya Pradesh 14385 1022 15407 161 69 277 84 1819 5126Maharashtra 21966 3844 25810 811 219 1052 178 2288 6173Manipur 24395 0 24395 0 0 15 10 677 341Meghalaya 11204 454 11658 39 124 6 1 331 234
Mizoram 28579 862 29441 308 155 1080 178 270 32Nagaland 35515 390 35905 233 59 172 71 502 31Orissa 7053 323 7375 86 16 164 40 2632 8979Punjab 21988 7090 29077 422 354 706 102 1258 1661Rajasthan 30500 5268 35768 340 254 1347 238 1837 3733
Sikkim 19393 7514 26907 13 531 17 0 92 10Tamil Nadu 16407 2446 18853 389 127 338 180 3226 7538Tripura 11036 579 11615 210 41 21 12 1336 287Uttar Pradesh 17537 1667 19204 442 85 319 47 3560 14860West Bengal 10458 142 10600 226 17 157 48 4076 20003
A & N. Island 33963 6545 40508 258 487 768 282 118 16Chandigarh 69707 25712 95419 1626 3713 286 42 20 4D & N Haveli 17192 1135 18327 246 137 78 13 60 8Daman & Diu 27624 2279 29903 35 447 8 0 50 3Delhi 39192 54862 94054 1163 4445 655 199 30 55
Lakshadweep 26071 3750 29821 253 150 0 0 12 0Pondicherry 18531 5732 24262 59 272 637 395 78 19Jharkhand 21298 196 21495 50 9 109 70 1956 3906Chhatisgarh 11783 2031 13814 473 131 786 122 766 1809Uttaranchal 16704 8849 25552 797 381 859 110 374 926
all India 15633 2001 17634 311 108 406 86 47568 110582
Annex-IV

SARVEKSHANA 207
Table 12: Fixed assets and outstanding loans per enterprise as on date of survey by States/ UTs
rural: NDME
State/UT market value (in Rs.) of assets net annual loans outstanding number of addition to rent (in (in Rs.) enterprises
owned hired all fixed assets Rs.) amount annual sample estimated(in Rs.) hired interest (in ‘00s)
during last assets365 days
(1) (2) (3) (4) (5) (6) (7) (8) (9) (10)
Andhra Pradesh 58494 17562 76056 1100 1597 3655 661 726 630Arunachal Pradesh 11577 35014 46591 1863 8238 548 329 28 1Assam 38284 5868 44153 212 636 2397 2065 288 149Bihar 42312 13194 55506 364 1376 2867 743 337 200Goa 151399 38185 189584 7376 3484 36877 4332 55 30
Gujarat 96789 41818 138607 4066 3982 9468 1600 165 106Haryana 128985 55970 184955 8812 2326 8509 1123 140 97Himachal Pradesh 173043 39956 212999 2686 3029 44197 7491 210 62Jammu & Kashmir 109963 30385 140348 783 1283 22082 2661 249 60Karnataka 47092 11233 58326 1170 957 8453 1082 325 409
Kerala 76024 38966 114991 2624 1976 14466 2865 1050 750Madhya Pradesh 62299 27224 89523 1634 880 9628 918 143 105Maharashtra 85783 31673 117456 974 2152 18740 3130 385 328Manipur 52355 2429 54784 10 248 157 70 53 4Meghalaya 77568 14365 91933 66 2811 278 122 138 24
Mizoram 28404 10009 38413 1037 3181 4450 731 34 3Nagaland 103708 21588 125295 3009 3051 331 179 43 2Orissa 70469 6935 77404 2695 699 4720 976 214 172Punjab 116087 31683 147770 5729 1870 12001 2036 326 178Rajasthan 94321 39739 134060 1136 2187 7396 1223 234 140
Sikkim 12542 125068 137611 1 1816 1592 63 15 2Tamil Nadu 74791 25717 100509 4511 1808 7888 2012 1018 640Tripura 70823 4131 74954 279 502 58 19 272 21Uttar Pradesh 60403 18347 78750 3346 1284 2958 777 505 985West Bengal 40448 4837 45284 454 830 1051 169 723 909
A & N. Island 60157 85780 145937 770 6403 25218 4718 62 3Chandigarh 192985 195181 388166 12 9092 0 0 22 2D & N Haveli 73193 15135 88328 6606 2391 6957 600 28 2Daman & Diu 125434 22602 148036 6492 5879 241 22 19 2Delhi 24464 142353 166816 2146 9045 728 131 31 42
Lakshadweep - - - - - - - - -Pondicherry 195752 26636 222388 1517 907 15033 2056 25 5Jharkhand 40753 7461 48215 1922 585 2923 511 125 121Chhatisgarh 56550 4517 61067 178 311 5370 565 45 53Uttaranchal 40619 66682 107302 6976 3392 3705 1796 70 58
all India 65771 22375 88146 2301 1561 7256 1392 8103 6295
Annex-IV

208 SARVEKSHANA
Table 12: Fixed assets and outstanding loans per enterprise as on date of survey by States/ UTs
rural: DME
State/UT market value (in Rs.) of assets net annual loans outstanding number of addition to rent (in (in Rs.) enterprises
owned hired all fixed assets Rs.) amount annual sample estimated(in Rs.) hired interest (in ‘00s)
during last assets365 days
(1) (2) (3) (4) (5) (6) (7) (8) (9) (10)
Andhra Pradesh 150072 32647 182718 7558 2911 55402 11670 791 249Arunachal Pradesh 326837 45333 372170 573 2725 0 0 4 0Assam 214823 44024 258847 4893 2910 53010 7962 53 14Bihar 149948 79141 229089 2089 3774 4785 623 123 32Goa 738163 194479 932642 63517 3438 117056 15417 53 4
Gujarat 227310 37106 264416 8097 3368 46081 8070 189 135Haryana 699995 291212 991207 41592 15877 131989 22943 73 13Himachal Pradesh 1065043 56167 1121211 13829 9097 3343484 664887 77 17Jammu & Kashmir 621451 85146 706597 381 2433 24288 1173 85 11Karnataka 101362 3950 105312 1402 407 16706 2582 379 322
Kerala 437400 47529 484928 19338 2906 204773 29373 536 178Madhya Pradesh 119375 11394 130769 7628 2271 22043 1593 89 58Maharashtra 443048 53428 496476 60008 2990 203060 31598 427 180Manipur 82478 4303 86781 0 640 7801 5535 19 2Meghalaya 218380 52773 271153 8260 13058 2755 1711 28 4
Mizoram 35000 200000 235000 1000 72000 0 0 1 0Nagaland 1451622 26054 1477675 0 8437 1002 601 10 0Orissa 125395 8385 133779 2117 415 18278 3088 79 44Punjab 1647601 433514 2081115 955046 16895 170721 22785 72 27Rajasthan 236576 35299 271875 18994 3055 43203 8287 110 40
Sikkim 6161134 11104972 17266107 35262 613260 4143646 149171 4 0Tamil Nadu 342264 31129 373394 10411 2295 68199 15298 799 281Tripura 103298 0 103298 30 0 0 0 5 2Uttar Pradesh 207809 165262 373071 7119 9367 99402 4634 386 469West Bengal 175253 15515 190767 67389 1591 68719 10179 485 325
A & N. Island 392237 143978 536215 7792 4815 88586 13878 21 1Chandigarh 88050 370000 458050 0 37620 0 0 4 0D & N Haveli 404186 453039 857225 4606 19461 10850 4601 14 1Daman & Diu 425015 405606 830622 10125 56825 487357 87486 29 2Delhi 322798 217892 540690 11054 23870 24347 7865 22 7
Lakshadweep - - - - - - - - -Pondicherry 653258 186158 839416 41190 8792 318755 48663 29 5Jharkhand 234991 36098 271089 3441 6958 42698 9583 61 20Chhatisgarh 57651 6737 64387 619 333 4011 2474 13 15Uttaranchal 193151 236545 429696 5994 19294 38098 5888 29 11
all India 257720 62964 320684 30106 4054 105204 15949 5099 2469
Annex-IV

SARVEKSHANA 209
Table 12: Fixed assets and outstanding loans per enterprise as on date of survey by States/ UTs
rural: all
State/UT market value (in Rs.) of assets net annual loans outstanding number of addition to rent (in (in Rs.) enterprises
owned hired all fixed assets Rs.) amount annual sample estimated(in Rs.) hired interest (in ‘00s)
during last assets365 days
(1) (2) (3) (4) (5) (6) (7) (8) (9) (10)
Andhra Pradesh 18300 4542 22842 499 279 1651 338 6236 12029Arunachal Pradesh 24302 14026 38327 873 2903 488 277 62 2Assam 12797 1140 13937 118 102 580 221 2668 2404Bihar 17381 1361 18742 101 118 305 62 4700 6835Goa 67399 15869 83269 2736 828 9314 1151 241 184
Gujarat 38851 5696 44547 1375 546 3168 542 1609 2461Haryana 55878 21337 77215 2590 979 3331 557 863 1007Himachal Pradesh 52882 7949 60831 1141 611 66624 13131 1372 907Jammu & Kashmir 37887 4235 42122 113 164 1462 167 1798 1395Karnataka 20981 2083 23064 214 148 1814 272 2430 6864
Kerala 45019 14090 59109 1616 718 12402 1967 4157 4208Madhya Pradesh 16489 1656 18145 272 110 702 117 2051 5289Maharashtra 36417 6543 42961 2410 388 7350 1168 3100 6681Manipur 25107 57 25164 0 7 65 44 749 348Meghalaya 20287 2488 22774 162 558 71 37 497 262
Mizoram 28568 1604 30171 362 402 1332 220 305 35Nagaland 47037 1783 48820 396 281 186 80 555 33Orissa 8807 485 9293 145 31 336 72 2925 9196Punjab 54282 15552 69835 14609 736 4222 612 1656 1866Rajasthan 34864 6801 41666 557 351 1987 355 2181 3913
Sikkim 37501 56969 94470 121 2591 13032 469 111 12Tamil Nadu 31641 5159 36800 1033 327 3162 820 5043 8459Tripura 15631 822 16452 214 73 23 12 1613 310Uttar Pradesh 25592 7375 32966 809 424 3325 223 4451 16313West Bengal 14264 578 14843 1264 76 1245 208 5284 21237
A & N. Island 55999 24975 80973 716 1561 8769 1615 201 20Chandigarh 113559 105570 219129 967 7657 169 25 46 7D & N Haveli 52192 31821 84012 1776 1777 2107 413 102 11Daman & Diu 160995 117487 278481 4436 17212 133006 23870 98 7Delhi 53507 101488 154995 2261 7670 2372 718 83 104
Lakshadweep 26071 3750 29821 253 150 0 0 12 0Pondicherry 151153 38137 189290 6852 1739 53737 8358 132 28Jharkhand 22934 591 23525 123 61 403 130 2142 4047Chhatisgarh 13401 2138 15538 466 137 940 153 824 1877Uttaranchal 20116 14819 34935 1215 773 1451 274 473 995
all India 23285 4336 27621 1033 266 2935 483 60770 119346
Annex-IV

210 SARVEKSHANA
Table 12: Fixed assets and outstanding loans per enterprise as on date of survey by States/ UTs
urban: OAME
State/UT market value (in Rs.) of assets net annual loans outstanding number of addition to rent (in (in Rs.) enterprises
owned hired all fixed assets Rs.) amount annual sample estimated(in Rs.) hired interest (in ‘00s)
during last assets365 days
(1) (2) (3) (4) (5) (6) (7) (8) (9) (10)
Andhra Pradesh 18918 17335 36254 492 1204 887 227 4039 3217Arunachal Pradesh 16068 43241 59309 61 6587 0 0 17 1Assam 15130 9605 24735 61 1190 216 77 887 233Bihar 22926 11533 34459 63 938 198 39 2714 1027Goa 33803 17664 51466 818 1145 385 84 145 40
Gujarat 57558 23149 80707 1345 1200 894 129 2634 1807Haryana 63991 60806 124797 4988 2056 1520 384 927 578Himachal Pradesh 56641 55261 111902 1284 2324 2266 345 634 47Jammu & Kashmir 37458 14440 51898 67 562 238 19 1526 582Karnataka 20842 14485 35328 280 883 1379 226 2510 2818
Kerala 24613 12882 37495 613 566 1566 263 1465 579Madhya Pradesh 31116 12220 43336 374 638 674 1163834 1726Maharashtra 38038 32663 70701 807 1671 3524 434 4918 3555Manipur 36691 1230 37921 7 97 79 20 1338 172
Meghalaya 16419 14782 31202 29 1566 0 0 78 9Mizoram 48391 15560 63950 109 1097 59 14 376 19Nagaland 19737 14504 34241 71 1766 122 79 410 17Orissa 13889 6619 20508 139 460 362 115 1394 513Punjab 61854 37873 99727 1224 1377 1462 199 2227 906Rajasthan 42324 21945 64269 904 1120 727 145 3267 1901
Sikkim 16708 25575 42283 0 2342 186 11 43 2Tamil Nadu 20587 19569 40157 383 1137 1036 328 4851 4856Tripura 14747 13823 28570 576 1008 168 106 433 25Uttar Pradesh 30331 13445 43776 411 619 366 137 7251 4887West Bengal 15414 5884 21298 192 193 190 18 3326 4848
A & N. Island 23914 51085 74999 265 1766 494 155 57 2Chandigarh 21460 30012 51472 81 1634 45 8 61 25D & N Haveli 47839 13930 61768 3502 2053 2483 475 44 1Daman & Diu 17583 36206 53789 643 2000 557 97 39 3Delhi 146499 65660 212158 678 3435 2 19 321 626
Lakshadweep 20255 6439 26693 2028 706 330 12 28 1Pondicherry 49416 17212 66629 18 1354 2013 684 128 59Jharkhand 20262 7847 28109 50 654 80 24 1165 368Chhatisgarh 18988 5905 24893 193 626 406 66 800 471Uttaranchal 31129 26376 57505 2796 1099 817 101 375 151
all India 30711 18486 49197 567 970 983 188 54262 36072
Annex-IV

SARVEKSHANA 211
Table 12: Fixed assets and outstanding loans per enterprise as on date of survey by States/ UTs
urban: NDME
State/UT market value (in Rs.) of assets net annual loans outstanding number of addition to rent (in (in Rs.) enterprises
owned hired all fixed assets Rs.) amount annual sample estimated(in Rs.) hired interest (in ‘00s)
during last assets365 days
(1) (2) (3) (4) (5) (6) (7) (8) (9) (10)
Andhra Pradesh 60894 81736 142630 3025 6055 6547 1188 1387 634Arunachal Pradesh 36563 188414 224977 281 31794 19198 8351 15 1Assam 45130 32051 77182 142 3820 2684 633 627 133Bihar 72044 47540 119584 428 4081 1741 186 675 196Goa 202453 111671 314124 4147 5528 20171 2178 102 18
Gujarat 210048 70421 280469 6896 4424 19160 2900 1245 784Haryana 222342 118694 341036 5853 5284 11415 1872 712 272Himachal Pradesh 161738 153454 315193 3603 6439 14158 1900 472 23Jammu & Kashmir 207571 79979 287550 3207 2803 6710 1100 574 85Karnataka 94493 96526 191019 6692 6476 16311 2387 845 481
Kerala 126525 81819 208344 6570 4097 26086 4212 1000 237Madhya Pradesh 112177 75850 188028 3001 4171 10972 1751 914 311Maharashtra 169576 150808 320385 3158 6928 20407 2929 2736 1377Manipur 70659 32964 103623 25 5250 5314 1355 212 16Meghalaya 40162 78037 118199 279 9431 1072 101 129 8
Mizoram 150518 109812 260330 653 6621 3824 379 184 7Nagaland 47029 59643 106672 1099 8674 1731 541 166 7Orissa 105246 47618 152863 1145 3779 14316 3239 358 101Punjab 275073 97878 372951 7031 3676 20125 4204 1660 462Rajasthan 139476 88278 227754 2101 4762 6562 1271 1123 324
Sikkim 58577 131451 190028 0 13228 747 226 57 2Tamil Nadu 101468 117863 219331 9872 7360 17996 4270 2038 1423Tripura 71490 17485 88975 3736 1451 2366 638 312 18Uttar Pradesh 95535 55359 150894 3951 3151 2974 636 3755 1317West Bengal 64008 35579 99587 1621 1068 2644 364 2119 1227
A & N. Island 61593 182856 244449 600 11696 12397 2228 78 4Chandigarh 1080577 134070 1214647 12651 12414 4654 394 56 15D & N Haveli 177281 26273 203555 1293 3286 999 1079 26 1Daman & Diu 129462 31209 160671 54 1143 2069 306 8 1Delhi 290367 165286 455653 4692 8805 729 133 502 1075
Lakshadweep 152881 0 152881 6097 0 9310 1173 12 0Pondicherry 138236 49673 187909 206 4749 9475 1756 77 35Jharkhand 43447 34559 78006 646 3338 2568 363 296 73Chhatisgarh 137988 49714 187702 3114 3472 4378 953 224 86Uttaranchal 108597 77814 186411 4944 3314 5086 608 195 70
all India 142757 94495 237252 4692 5175 10881 1942 24891 10822
Annex-IV

212 SARVEKSHANA
Table 12: Fixed assets and outstanding loans per enterprise as on date of survey by States/ UTs
urban: DME
State/UT market value (in Rs.) of assets net annual loans outstanding number of addition to rent (in (in Rs.) enterprises
owned hired all fixed assets Rs.) amount annual sample estimated(in Rs.) hired interest (in ‘00s)
during last assets365 days
(1) (2) (3) (4) (5) (6) (7) (8) (9) (10)
Andhra Pradesh 213055 185297 398352 17141 11590 38723 7951 559 184Arunachal Pradesh 71656 59929 131585 3186 41862 9558 5735 4 0Assam 130029 102383 232411 224 5778 10550 4346 128 14Bihar 230077 81281 311357 1994 6809 26818 3087 97 28Goa 495318 115527 610845 19850 5536 78594 9474 46 7
Gujarat 509081 96089 605170 16990 7286 99245 16113 1198 371Haryana 893097 238995 1132092 28742 15519 131558 21621 297 76Himachal Pradesh 620525 414067 1034592 10689 8669 107182 16982 116 5Jammu & Kashmir 646543 96524 743068 14356 2123 146290 13489 157 19Karnataka 632584 108779 741363 49128 9723 119469 16129 389 180
Kerala 465335 131225 596560 9734 8584 145519 24120 397 68Madhya Pradesh 442353 118310 560663 36231 6814 100634 15212 402 87Maharashtra 399469 334697 734166 21503 29497 121519 18608 2039 776Manipur 114796 78009 192805 529 8952 8370 4462 68 4Meghalaya 266938 109069 376007 1629 16160 4120 12146 33 2
Mizoram 1169179 158257 1327437 1718 16558 0 0 26 1Nagaland 90669 99060 189729 2237 12039 1890 1134 22 1Orissa 248438 102596 351034 6116 6167 65024 11548 89 25Punjab 813894 197995 1011889 15289 10368 130883 24913 963 171Rajasthan 469667 175234 644901 24799 10622 71342 10968 464 98
Sikkim 765251 78393 843644 0 19609 60480 8129 5 0Tamil Nadu 422010 262321 684331 21030 16556 89367 16438 1324 543Tripura 582146 75724 657869 7843 2780 17662 1259 34 2Uttar Pradesh 346296 87386 433682 7787 6043 47482 7570 1745 384West Bengal 223500 121279 344779 8934 6626 43593 7761 1099 398
A & N. Island 109691 344969 454660 8545 16007 94549 16520 36 1Chandigarh 4439111 441283 4880394 14373 44778 852300 85794 78 13D & N Haveli 296090 27435 323526 2494 8231 0 0 3 0Daman & Diu 138312 0 138312 113 0 5480 7 2 0Delhi 542261 323567 865828 32207 17937 78027 10758 504 499
Lakshadweep 1195845 0 1195845 1214 0 0 0 3 0Pondicherry 764020 503238 1267258 9125 14038 115613 22516 31 6Jharkhand 122672 45792 168464 564 3956 3436 2862 34 8Chhatisgarh 422964 24207 447170 44796 1812 151798 27252 132 23Uttaranchal 625149 133536 758685 8323 5586 30531 4518 47 8
all India 452222 211395 663617 20524 14739 90598 14449 12571 4002
Annex-IV

SARVEKSHANA 213
Table 12: Fixed assets and outstanding loans per enterprise as on date of survey by States/ UTs
urban: all
State/UT market value (in Rs.) of assets net annual loans outstanding number of addition to rent (in (in Rs.) enterprises
owned hired all fixed assets Rs.) amount annual sample estimated(in Rs.) hired interest (in ‘00s)
during last assets365 days
(1) (2) (3) (4) (5) (6) (7) (8) (9) (10)
Andhra Pradesh 34386 35130 69515 1650 2441 3505 731 5985 4035Arunachal Pradesh 31824 129027 160851 403 23699 11848 5262 36 2Assam 29860 20875 50735 96 2280 1460 428 1642 380Bihar 35220 18720 53940 163 1560 1031 129 3486 1251Goa 129851 54182 184032 3774 2829 14223 1667 293 65
Gujarat 154518 44805 199323 4775 2816 18057 2866 5077 2962Haryana 178381 92405 270786 7185 4107 15068 2559 1936 926Himachal Pradesh 123766 107611 231378 2578 3982 12397 1849 1222 75Jammu & Kashmir 75585 24835 100420 857 882 5147 531 2257 686Karnataka 62656 30704 93360 3692 2113 9549 1347 3744 3479
Kerala 85776 40447 126223 2910 2128 19194 3154 2862 883Madhya Pradesh 59871 25888 85759 2231 1409 6287 976 5150 2124Maharashtra 118898 102218 221115 4187 6722 23636 3506 9693 5708Manipur 41040 5370 46410 19 696 673 219 1618 191Meghalaya 51580 51113 102693 296 6370 868 1258 240 19
Mizoram 118892 45932 164824 315 3154 1048 109 586 28Nagaland 28852 28787 57639 402 3887 601 230 598 24Orissa 37356 16791 54147 529 1204 5060 1049 1841 639Punjab 209524 73698 283221 4532 3067 21464 4151 4850 1540Rajasthan 73869 37647 111516 2078 2028 4515 758 4854 2323
Sikkim 83344 87305 170649 0 9376 3996 601 105 4Tamil Nadu 69427 59403 128830 4007 3663 11609 2433 8213 6822Tripura 57632 17488 75120 2101 1249 1670 360 779 45Uttar Pradesh 61781 26132 87912 1548 1441 3633 670 12751 6588West Bengal 37417 18607 56023 1000 754 3323 560 6544 6474
A & N. Island 56706 164800 221505 1744 9086 21435 3800 171 8Chandigarh 1370887 157209 1528096 7075 14938 202966 20411 195 53D & N Haveli 101926 18597 120523 2735 2752 1880 649 73 2Daman & Diu 39258 34122 73380 533 1795 969 126 49 3Delhi 306588 172853 479441 9794 9349 18065 2512 1327 2200
Lakshadweep 95731 4587 100318 3023 503 2580 304 43 1Pondicherry 121951 56605 178556 607 3288 11176 2316 236 100Jharkhand 25912 12902 38814 157 1153 548 131 1495 449Chhatisgarh 52612 13111 65724 2394 1094 6998 1275 1156 579Uttaranchal 75650 45896 121546 3648 1936 3165 411 617 229
all India 87676 49815 137491 3013 2947 10134 1682 91724 50895
Annex-IV

214 SARVEKSHANA
Table 12: Fixed assets and outstanding loans per enterprise as on date of survey by States/ UTs
combined: OAME
State/UT market value (in Rs.) of assets net annual loans outstanding number of addition to rent (in (in Rs.) enterprises
owned hired all fixed assets Rs.) amount annual sample estimated(in Rs.) hired interest (in ‘00s)
during last assets365 days
(1) (2) (3) (4) (5) (6) (7) (8) (9) (10)
Andhra Pradesh 14390 6348 20738 349 383 459 102 8758 14367Arunachal Pradesh 17540 15688 33228 412 2536 355 197 47 2Assam 10345 1412 11757 80 156 141 53 3214 2474Bihar 16916 2093 19009 81 180 204 39 6954 7630Goa 31811 8668 40479 224 412 605 97 278 190
Gujarat 39417 11524 50941 1066 655 547 77 3889 4027Haryana 48535 32134 80669 2775 1180 1139 253 1577 1475Himachal Pradesh 24781 7299 32080 791 367 538 71 1719 875Jammu & Kashmir 32049 6050 38100 76 237 303 37 2990 1906Karnataka 16851 5502 22353 148 333 838 137 4236 8951
Kerala 17792 7526 25318 450 349 1483 270 4036 3858Madhya Pradesh 18600 3843 22443 214 213 377 92 5653 6852Maharashtra 27840 14376 42216 809 749 1955 272 7206 9728Manipur 28509 411 28921 2 32 36 13 2015 513Meghalaya 11394 976 12370 39 176 6 1 409 243
Mizoram 35987 6358 42345 233 507 698 117 646 52Nagaland 29948 5370 35318 176 661 154 74 912 48Orissa 7422 663 8085 89 40 175 44 4026 9493Punjab 36061 17956 54017 705 715 973 136 3485 2567Rajasthan 34490 10896 45386 530 546 1138 207 5104 5635
Sikkim 19042 9878 28920 11 768 39 1 135 12Tamil Nadu 18045 9155 27199 387 523 612 238 8077 12394Tripura 11336 1650 12986 239 119 33 19 1769 313Uttar Pradesh 20704 4582 25286 434 217 331 70 10811 19747West Bengal 11425 1262 12687 219 51 164 42 7402 24851
A & N. Island 32616 12514 45130 259 659 732 265 175 19Chandigarh 28220 29409 57630 297 1925 79 13 81 29D & N Haveli 20901 2683 23584 640 369 369 69 104 9Daman & Diu 23123 17487 40610 308 1143 254 43 89 6Delhi 137852 64790 202641 717 3516 54 34 351 681
Lakshadweep 21041 6075 27116 1788 630 286 10 40 1Pondicherry 41897 14417 56314 28 1091 1678 614 206 77Jharkhand 21209 854 22064 50 65 107 66 3121 4274Chhatisgarh 13270 2830 16101 415 233 708 111 1566 2280Uttaranchal 18723 11303 30026 1077 482 853 108 749 1077
all India 19342 6055 25397 374 320 548 111 101830 146654
Annex-IV

SARVEKSHANA 215
Table 12: Fixed assets and outstanding loans per enterprise as on date of survey by States/ UTs
combined: NDME
State/UT market value (in Rs.) of assets net annual loans outstanding number of addition to rent (in (in Rs.) enterprises
owned hired all fixed assets Rs.) amount annual sample estimated(in Rs.) hired interest (in ‘00s)
during last assets365 days
(1) (2) (3) (4) (5) (6) (7) (8) (9) (10)
Andhra Pradesh 59698 49756 109454 2066 3834 5106 925 2113 1264Arunachal Pradesh 27508 132818 160326 854 23257 12439 5444 43 2Assam 41520 18245 59765 179 2141 2533 1388 915 282Bihar 57006 30168 87174 396 2713 2311 468 1012 396Goa 170448 65603 236051 6171 4247 30644 3528 157 48
Gujarat 196543 67010 263553 6558 4372 18004 2745 1410 890Haryana 197838 102230 300068 6630 4507 10652 1675 852 369Himachal Pradesh 169971 70797 240768 2935 3956 36034 5972 682 85Jammu & Kashmir 167012 59371 226384 2200 2171 13098 1749 823 145Karnataka 72721 57349 130070 4155 3941 12702 1788 1170 890
Kerala 88140 49248 137388 3570 2485 17254 3188 2050 987Madhya Pradesh 99583 63572 163154 2656 3340 10633 1540 1057 416Maharashtra 153453 127885 281338 2738 6009 20086 2968 3121 1705Manipur 66613 26214 92827 21 4144 4174 1071 265 20Meghalaya 68252 30222 98474 119 4460 476 117 267 32
Mizoram 118259 83447 201706 754 5713 3990 472 218 10Nagaland 60185 50810 110995 1542 7369 1406 457 209 9Orissa 83287 21930 105216 2124 1834 8257 1810 572 273Punjab 230768 79431 310199 6668 3173 17861 3600 1986 641Rajasthan 125875 73659 199534 1810 3986 6813 1256 1357 463
Sikkim 39788 128846 168634 1 8571 1092 159 72 4Tamil Nadu 93188 89262 182449 8208 5637 14859 3569 3056 2063Tripura 71127 10223 81350 1856 935 1111 302 584 39Uttar Pradesh 80501 39521 120022 3692 2352 2967 696 4260 2301West Bengal 53983 22498 76481 1125 967 1966 281 2842 2136
A & N. Island 60977 141200 202176 673 9425 17898 3296 140 7Chandigarh 959511 142406 1101916 10927 11961 4019 340 78 18D & N Haveli 95128 17483 112611 5486 2580 5702 701 54 3Daman & Diu 126333 24522 150855 5056 4823 649 85 27 2Delhi 280469 164432 444901 4597 8814 729 133 533 1116
Lakshadweep 152881 0 152881 6097 0 9310 1173 12 0Pondicherry 145485 46769 192254 371 4265 10175 1794 102 41Jharkhand 41769 17680 59449 1441 1623 2789 455 421 195Chhatisgarh 106948 32487 139436 1995 2267 4756 805 269 138Uttaranchal 77901 72787 150688 5862 3349 4463 1144 265 128
all India 114445 67972 182417 3813 3846 9548 1740 32994 17117
Annex-IV
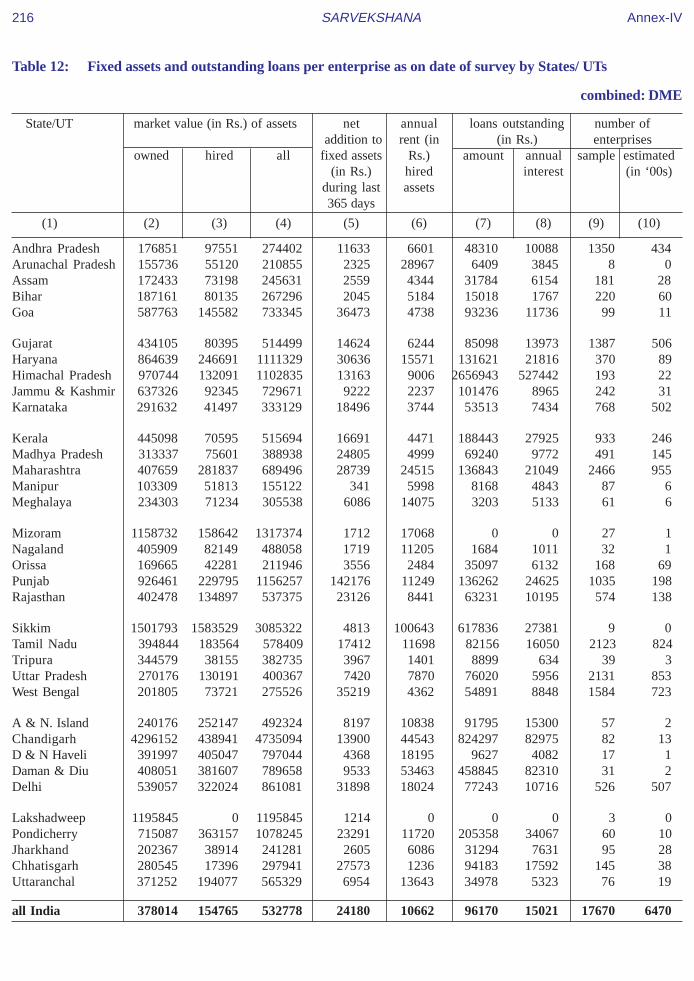
216 SARVEKSHANA
Table 12: Fixed assets and outstanding loans per enterprise as on date of survey by States/ UTs
combined: DME
State/UT market value (in Rs.) of assets net annual loans outstanding number of addition to rent (in (in Rs.) enterprises
owned hired all fixed assets Rs.) amount annual sample estimated(in Rs.) hired interest (in ‘00s)
during last assets365 days
(1) (2) (3) (4) (5) (6) (7) (8) (9) (10)
Andhra Pradesh 176851 97551 274402 11633 6601 48310 10088 1350 434Arunachal Pradesh 155736 55120 210855 2325 28967 6409 3845 8 0Assam 172433 73198 245631 2559 4344 31784 6154 181 28Bihar 187161 80135 267296 2045 5184 15018 1767 220 60Goa 587763 145582 733345 36473 4738 93236 11736 99 11
Gujarat 434105 80395 514499 14624 6244 85098 13973 1387 506Haryana 864639 246691 1111329 30636 15571 131621 21816 370 89Himachal Pradesh 970744 132091 1102835 13163 9006 2656943 527442 193 22Jammu & Kashmir 637326 92345 729671 9222 2237 101476 8965 242 31Karnataka 291632 41497 333129 18496 3744 53513 7434 768 502
Kerala 445098 70595 515694 16691 4471 188443 27925 933 246Madhya Pradesh 313337 75601 388938 24805 4999 69240 9772 491 145Maharashtra 407659 281837 689496 28739 24515 136843 21049 2466 955Manipur 103309 51813 155122 341 5998 8168 4843 87 6Meghalaya 234303 71234 305538 6086 14075 3203 5133 61 6
Mizoram 1158732 158642 1317374 1712 17068 0 0 27 1Nagaland 405909 82149 488058 1719 11205 1684 1011 32 1Orissa 169665 42281 211946 3556 2484 35097 6132 168 69Punjab 926461 229795 1156257 142176 11249 136262 24625 1035 198Rajasthan 402478 134897 537375 23126 8441 63231 10195 574 138
Sikkim 1501793 1583529 3085322 4813 100643 617836 27381 9 0Tamil Nadu 394844 183564 578409 17412 11698 82156 16050 2123 824Tripura 344579 38155 382735 3967 1401 8899 634 39 3Uttar Pradesh 270176 130191 400367 7420 7870 76020 5956 2131 853West Bengal 201805 73721 275526 35219 4362 54891 8848 1584 723
A & N. Island 240176 252147 492324 8197 10838 91795 15300 57 2Chandigarh 4296152 438941 4735094 13900 44543 824297 82975 82 13D & N Haveli 391997 405047 797044 4368 18195 9627 4082 17 1Daman & Diu 408051 381607 789658 9533 53463 458845 82310 31 2Delhi 539057 322024 861081 31898 18024 77243 10716 526 507
Lakshadweep 1195845 0 1195845 1214 0 0 0 3 0Pondicherry 715087 363157 1078245 23291 11720 205358 34067 60 10Jharkhand 202367 38914 241281 2605 6086 31294 7631 95 28Chhatisgarh 280545 17396 297941 27573 1236 94183 17592 145 38Uttaranchal 371252 194077 565329 6954 13643 34978 5323 76 19
all India 378014 154765 532778 24180 10662 96170 15021 17670 6470
Annex-IV

SARVEKSHANA 217
Table 12: Fixed assets and outstanding loans per enterprise as on date of survey by States/ UTs
combined: all
State/UT market value (in Rs.) of assets net annual loans outstanding number of addition to rent (in (in Rs.) enterprises
owned hired all fixed assets Rs.) amount annual sample estimated(in Rs.) hired interest (in ‘00s)
during last assets365 days
(1) (2) (3) (4) (5) (6) (7) (8) (9) (10)
Andhra Pradesh 22341 12225 34567 788 822 2117 436 12221 16064Arunachal Pradesh 27540 63539 91080 670 11857 5379 2423 98 4Assam 15128 3837 18965 115 399 700 249 4310 2784Bihar 20140 4046 24186 111 341 417 73 8186 8086Goa 83689 25863 109552 3007 1350 10594 1285 534 249
Gujarat 102027 27056 129083 3232 1786 11300 1811 6686 5423Haryana 114569 55386 169955 4792 2477 8954 1516 2799 1933Himachal Pradesh 58286 15547 73833 1250 868 62490 12271 2594 981Jammu & Kashmir 50310 11024 61334 358 401 2676 287 4055 2081Karnataka 34998 11709 46707 1384 809 4416 633 6174 10343
Kerala 52091 18664 70755 1841 962 13580 2173 7019 5091Madhya Pradesh 28920 8599 37519 833 482 2302 363 7201 7413Maharashtra 74419 50624 125043 3229 3306 14854 2245 12793 12389Manipur 30755 1941 32696 7 251 280 106 2367 539Meghalaya 22366 5720 28086 171 944 124 118 737 280
Mizoram 68480 21192 89671 341 1618 1207 171 891 63Nagaland 39402 13121 52523 399 1795 360 143 1153 57Orissa 10661 1544 12205 170 107 643 136 4766 9834Punjab 124459 41837 166296 10054 1790 12017 2212 6506 3406Rajasthan 49395 18293 67688 1124 976 2929 505 7035 6236
Sikkim 49058 64616 113675 90 4302 10754 503 216 16Tamil Nadu 48510 29375 77885 2361 1816 6933 1540 13256 15281Tripura 20934 2926 23860 452 221 231 56 2392 355Uttar Pradesh 36002 12770 48772 1022 717 3414 352 17202 22901West Bengal 19673 4790 24463 1202 234 1731 290 11828 27710
A & N. Island 56192 63167 119359 997 3616 12229 2212 372 28Chandigarh 1225260 151228 1376487 6367 14095 179477 18050 241 60D & N Haveli 59149 29971 89120 1910 1913 2075 446 175 13Daman & Diu 121855 90684 212538 3181 12255 90554 16236 147 10Delhi 295183 169637 464820 9455 9274 17358 2431 1410 2304
Lakshadweep 88750 4503 93253 2745 467 2321 273 55 2Pondicherry 128438 52502 180940 1994 2944 20630 3658 368 128Jharkhand 23232 1821 25053 126 170 418 130 3637 4496Chhatisgarh 22649 4726 27374 921 363 2369 418 1980 2456Uttaranchal 30503 20632 51135 1670 990 1772 299 1090 1224
all India 42535 17933 60468 1625 1068 5087 842 152494 170241
Annex-IV

218 SARVEKSHANA
Table 13: Per thousand distribution of manufacturing enterprises by agency of purchase of basic input andby State / UT, sector and by type of enterprise
rural: OAME
State / UT source agency for purchase of basic input no. of enterprises
no govern- co- private contrac- pvt. others n.r. in estimatedsource ment operative/ enter- tor/ indi- sampleagency marke- prise middle- vidual /
ting man house-society hold
(1) (2) (3) (4) (5) (6) (7) (8) (9) (10) (11)
Andhra Pradesh 268 54 3 455 39 160 91 0 4719 1114984Arunachal Pradesh 105 0 0 183 0 632 81 0 30 171Assam 108 0 11 667 10 397 29 0 2327 224130Bihar 223 5 3 492 55 356 19 0 4240 660305Goa 176 0 0 368 0 68 394 0 133 14963
Gujarat 348 0 3 482 66 124 18 0 1255 222032Haryana 162 0 0 575 0 238 47 0 650 89689Himachal Pradesh 295 6 0 220 57 444 45 0 1085 82781Jammu & Kashmir 600 0 2 246 130 116 3 0 1464 132388Karnataka 386 6 6 284 232 151 13 0 1726 613347
Kerala 156 4 15 513 141 213 9 0 2571 327915Madhya Pradesh 412 12 0 407 21 314 59 0 1819 512584Maharashtra 341 15 2 504 7 172 25 0 2288 617324Manipur 14 0 7 887 5 256 14 0 677 34144Meghalaya 275 0 0 473 3 339 149 0 331 23387
Mizoram 108 0 30 288 24 554 102 0 270 3229Nagaland 100 6 0 604 2 187 127 0 502 3111Orissa 388 0 2 277 8 297 198 0 2632 897926Punjab 522 1 6 368 14 93 3 0 1258 166102Rajasthan 186 14 8 534 5 276 45 0 1837 373334
Sikkim 10 7 0 602 0 398 0 0 92 1016Tamil Nadu 476 6 11 351 62 112 11 0 3226 753817Tripura 176 0 98 409 23 376 12 0 1336 28725Uttar Pradesh 461 0 4 265 78 146 74 0 3560 1485961West Bengal 311 0 1 278 185 280 45 0 4076 2000252
A & N Islands 831 8 3 151 0 17 3 0 118 1608Chandigarh 12 0 181 739 10 249 0 0 20 410D & N Haveli 351 0 0 584 0 65 56 0 60 801Daman & Diu 527 0 0 410 2 110 61 0 50 332Delhi 309 0 0 659 0 82 29 0 30 5488
Lakshadweep 0 0 0 1000 0 0 0 0 12 15Pondicherry 200 0 0 762 2 151 11 0 78 1884Jharkhand 90 0 0 348 174 419 103 0 1956 390587Chhattisgarh 238 5 0 402 17 299 194 0 766 180916Uttaranchal 436 0 11 371 66 47 101 0 374 92591
all-India 333 9 4 370 85 229 62 0 47568 11058248
Annex-IV

SARVEKSHANA 219
Table 13: Per thousand distribution of manufacturing enterprises by agency of purchase of basic input andby State / UT, sector and by type of enterprise
rural: NDME
State / UT source agency for purchase of basic input no. of enterprises
no govern- co- private contrac- pvt. others n.r. in estimatedsource ment operative/ enter- tor/ indi- sampleagency marke- prise middle- vidual /
ting man house-society hold
(1) (2) (3) (4) (5) (6) (7) (8) (9) (10) (11)
Andhra Pradesh 235 1 3 567 3 101 123 0 726 62982Arunachal Pradesh 55 0 0 858 0 51 37 0 28 59Assam 155 0 2 658 36 353 19 0 288 14881Bihar 126 1 1 637 24 461 61 0 337 20033Goa 80 11 46 638 46 237 36 0 55 3028
Gujarat 336 0 0 493 73 115 4 0 165 10615Haryana 89 0 0 794 0 152 6 0 140 9691Himachal Pradesh 62 9 3 749 0 276 0 0 210 6171Jammu& Kashmir 148 13 0 732 110 153 11 0 249 6014Karnataka 198 13 0 494 19 386 183 0 325 40862
Kerala 154 1 76 620 61 146 4 0 1050 75012Madhya Pradesh 199 18 0 452 0 396 23 4 143 10498Maharashtra 344 6 0 572 5 124 5 0 385 32804Manipur 79 0 0 800 0 234 0 0 53 441Meghalaya 54 0 55 669 115 270 28 0 138 2388
Mizoram 0 0 0 670 0 282 250 0 34 261Nagaland 58 181 0 579 5 43 150 0 43 197Orissa 532 0 17 373 3 149 1 0 214 17249Punjab 273 0 2 637 7 103 0 0 326 17849Rajasthan 62 1 0 735 22 241 0 0 234 13951
Sikkim 0 0 0 607 0 216 176 0 15 151Tamil Nadu 450 7 9 397 105 86 9 0 1018 64037Tripura 152 0 1 640 0 337 4 0 272 2143Uttar Pradesh 393 0 0 491 21 133 3 0 505 98485West Bengal 266 0 0 572 34 252 34 0 723 90903
A & N Islands 2 96 0 861 53 97 0 0 62 288Chandigarh 18 0 21 817 183 21 168 0 22 240D & N Haveli 432 0 0 568 0 0 0 0 28 215Daman & Diu 516 0 0 471 0 0 13 0 19 180Delhi 476 0 0 780 0 14 0 0 31 4155
Lakshadweep - - - - - - - - - -Pondicherry 66 0 0 702 205 27 0 0 25 511Jharkhand 106 2 0 674 153 292 9 0 125 12128Chhattisgarh 380 17 0 295 0 317 8 0 45 5277Uttaranchal 251 32 106 481 0 149 0 0 70 5781
all-India 274 3 12 551 37 189 35 0 8103 629481
Annex-IV

220 SARVEKSHANA
Table 13: Per thousand distribution of manufacturing enterprises by agency of purchase of basic input andby State / UT, sector and by type of enterprise
rural: DME
State / UT source agency for purchase of basic input no. of enterprises
no govern- co- private contrac- pvt. others n.r. in estimatedsource ment operative/ enter- tor/ indi- sampleagency marke- prise middle- vidual /
ting man house-society hold
(1) (2) (3) (4) (5) (6) (7) (8) (9) (10) (11)
Andhra Pradesh 100 6 4 405 19 112 467 0 791 24933Arunachal Pradesh 0 0 453 773 0 227 0 0 4 6Assam 16 0 0 811 181 354 72 0 53 1395Bihar 38 20 0 555 279 397 52 0 123 3207Goa 77 17 0 767 0 116 66 0 53 427
Gujarat 149 10 5 522 78 380 92 0 189 13460Haryana 56 0 2 673 31 337 0 0 73 1310Himachal Pradesh 0 418 6 381 10 253 0 0 77 1714Jammu & Kashmir 215 14 0 552 113 428 0 0 85 1121Karnataka 59 18 0 377 15 437 433 0 379 32233
Kerala 69 13 7 709 134 165 12 0 536 17833Madhya Pradesh 71 4 5 219 14 484 325 0 89 5805Maharashtra 149 61 3 646 56 249 29 0 427 17957Manipur 0 0 0 943 0 66 0 0 19 214Meghalaya 0 9 12 737 199 274 0 0 28 382
Mizoram 0 0 0 1000 0 0 0 0 1 1Nagaland 0 0 0 884 0 214 116 0 10 18Orissa 359 0 17 490 2 180 49 0 79 4391Punjab 29 0 0 796 0 294 0 0 72 2674Rajasthan 14 16 1 629 215 125 60 0 110 3964
Sikkim 0 0 0 1000 0 0 0 0 4 4Tamil Nadu 423 1 6 413 52 89 53 0 799 28073Tripura 0 0 975 1000 0 0 0 0 5 157Uttar Pradesh 317 0 0 358 76 373 8 0 386 46869West Bengal 241 7 1 478 88 313 9 0 485 32510
A & N Islands 250 355 0 694 42 11 0 0 21 102Chandigarh 0 0 0 1000 0 0 0 0 4 42D & N Haveli 443 0 0 557 0 0 64 0 14 67Daman & Diu 29 0 0 971 193 7 0 0 29 192Delhi 273 123 0 605 21 0 0 0 22 740
Lakshadweep - - - - - - - - - -Pondicherry 58 12 0 900 0 88 0 0 29 452Jharkhand 30 7 0 634 0 345 39 0 61 1994Chhattisgarh 27 120 31 141 0 0 709 0 13 1468Uttaranchal 0 4 0 534 0 466 0 0 29 1141
all-India 194 15 4 465 64 280 136 0 5099 246854
Annex-IV

SARVEKSHANA 221
Table 13: Per thousand distribution of manufacturing enterprises by agency of purchase of basic input andby State / UT, sector and by type of enterprise
rural: all
State / UT source agency for purchase of basic input no. of enterprises
no govern- co- private contrac- pvt. others n.r. in estimatedsource ment operative/ enter- tor/ indi- sampleagency marke- prise middle- vidual /
ting man house-society hold
(1) (2) (3) (4) (5) (6) (7) (8) (9) (10) (11)
Andhra Pradesh 263 51 3 460 37 156 100 0 6236 1202900Arunachal Pradesh 90 0 12 367 0 476 68 0 62 236Assam 110 0 11 667 13 394 28 0 2668 240405Bihar 220 4 3 496 55 359 20 0 4700 683545Goa 158 2 8 422 8 97 328 0 241 18418
Gujarat 336 1 3 485 67 137 21 0 1609 246108Haryana 154 0 0 597 0 231 42 0 863 100690Himachal Pradesh 274 14 0 259 53 429 41 0 1372 90666Jammu & Kashmir 578 1 1 269 129 120 3 0 1798 139523Karnataka 359 7 5 301 209 179 42 0 2430 686442
Kerala 152 4 25 540 127 199 8 0 4157 420760Madhya Pradesh 404 12 0 406 20 317 61 0 2051 528887Maharashtra 336 15 2 511 8 172 24 0 3100 668085Manipur 15 0 7 887 5 255 13 0 749 34799Meghalaya 250 0 5 495 16 332 135 0 497 26156
Mizoram 100 0 27 317 22 534 113 0 305 3492Nagaland 97 16 0 604 2 179 128 0 555 3325Orissa 390 0 3 280 8 293 193 0 2925 919566Punjab 491 1 6 400 13 96 3 0 1656 186625Rajasthan 180 13 8 542 8 273 43 0 2181 391250
Sikkim 9 6 0 604 0 374 23 0 111 1171Tamil Nadu 472 6 11 356 65 109 13 0 5043 845927Tripura 174 0 95 428 21 372 11 0 1613 31024Uttar Pradesh 453 0 4 282 74 152 68 0 4451 1631315West Bengal 308 0 1 293 177 279 44 0 5284 2123665
A & N Islands 682 38 3 281 10 28 2 0 201 1999Chandigarh 13 0 115 782 70 154 58 0 46 693D & N Haveli 372 0 0 579 0 48 45 0 102 1083Daman & Diu 388 0 0 579 53 54 32 0 98 704Delhi 374 9 0 703 1 49 15 0 83 10383
Lakshadweep 0 0 0 1000 0 0 0 0 12 15Pondicherry 153 2 0 773 38 119 7 0 132 2847Jharkhand 90 0 0 359 172 415 100 0 2142 404708Chhattisgarh 241 6 0 397 16 297 193 0 824 187660Uttaranchal 420 2 17 379 61 57 94 0 473 99513
all-India 327 9 4 381 82 228 62 0 60770 11934583
Annex-IV

222 SARVEKSHANA
Table 13: Per thousand distribution of manufacturing enterprises by agency of purchase of basic input andby State / UT, sector and by type of enterprise
urban: OAME
State / UT source agency for purchase of basic input no. of enterprises
no govern- co- private contrac- pvt. others n.r. in estimatedsource ment operative/ enter- tor/ indi- sampleagency marke- prise middle- vidual /
ting man house-society hold
(1) (2) (3) (4) (5) (6) (7) (8) (9) (10) (11)
Andhra Pradesh 291 0 6 606 44 81 34 0 4039 321696Arunachal Pradesh 206 0 0 794 0 127 9 0 17 62Assam 78 1 0 748 10 403 15 0 887 23310Bihar 198 3 1 538 113 272 24 0 2714 102704Goa 72 0 5 826 0 88 9 0 145 4003
Gujarat 244 0 2 621 53 164 1 0 2634 180665Haryana 150 1 5 759 11 91 17 0 927 57803Himachal Pradesh 96 4 0 728 23 215 9 0 634 4718Jammu & Kashmir 250 6 2 584 108 107 12 0 1526 58192Karnataka 271 12 6 585 173 89 8 0 2510 281799
Kerala 196 27 17 623 60 125 3 0 1465 57879Madhya Pradesh 314 5 1 511 89 157 9 0 3834 172616Maharashtra 320 2 3 611 26 49 12 0 4918 355524Manipur 80 0 12 852 15 229 12 0 1338 17169Meghalaya 145 0 0 747 60 278 153 0 78 884
Mizoram 101 7 5 705 3 264 41 0 376 1929Nagaland 35 10 0 891 18 82 26 0 410 1696Orissa 224 0 12 527 22 243 92 0 1394 51324Punjab 334 0 0 554 32 103 6 0 2227 90627Rajasthan 200 0 1 633 57 125 30 0 3267 190145
Sikkim 0 0 0 623 0 377 0 0 43 153Tamil Nadu 418 0 15 476 56 58 1 0 4851 485593Tripura 160 0 2 763 3 97 6 0 433 2527Uttar Pradesh 364 0 2 465 124 91 17 0 7251 488710West Bengal 704 0 4 206 74 43 7 0 3326 484836
A & N Islands 63 41 28 928 7 3 0 0 57 249Chandigarh 3 0 0 977 0 39 0 0 61 2517D & N Haveli 231 0 0 769 0 0 0 0 44 110Daman & Diu 568 0 0 250 53 187 0 0 39 270Delhi 245 0 0 687 33 71 0 0 321 62621
Lakshadweep 67 0 0 901 0 31 0 0 28 96Pondicherry 66 16 0 808 70 25 37 0 128 5853Jharkhand 145 1 2 663 10 296 29 0 1165 36763Chhattisgarh 97 11 0 403 401 198 34 0 800 47054Uttaranchal 258 1 0 629 52 75 10 0 375 15074
all-India 353 2 5 513 78 98 14 0 54262 3607172
Annex-IV

SARVEKSHANA 223
Table 13: Per thousand distribution of manufacturing enterprises by agency of purchase of basic input andby State / UT, sector and by type of enterprise
urban: NDME
State / UT source agency for purchase of basic input no. of enterprises
no govern- co- private contrac- pvt. others n.r. in estimatedsource ment operative/ enter- tor/ indi- sampleagency marke- prise middle- vidual /
ting man house-society hold
(1) (2) (3) (4) (5) (6) (7) (8) (9) (10) (11)
Andhra Pradesh 256 1 3 678 31 68 24 0 1387 63403Arunachal Pradesh 37 0 0 925 517 75 37 0 15 104Assam 36 2 0 825 20 436 6 0 627 13339Bihar 50 14 3 849 33 245 2 0 675 19575Goa 193 0 0 707 3 3 97 0 102 1802
Gujarat 290 3 0 589 91 65 1 0 1245 78409Haryana 94 3 4 788 7 128 9 0 712 27231Himachal Pradesh 48 8 4 834 1 178 2 0 472 2302Jammu & Kashmir 86 26 2 867 11 88 2 0 574 8460Karnataka 141 8 12 734 78 155 0 0 845 48100
Kerala 162 5 8 754 18 119 1 0 1000 23678Madhya Pradesh 127 23 3 701 31 242 3 0 914 31077Maharashtra 293 5 3 623 37 67 6 0 2736 137681Manipur 127 0 1 828 0 356 11 0 212 1554Meghalaya 0 0 0 904 14 105 4 0 129 792
Mizoram 32 14 37 770 15 449 32 0 184 728Nagaland 119 24 8 708 31 167 9 0 166 652Orissa 176 8 3 750 19 95 9 0 358 10068Punjab 194 5 1 739 15 85 4 0 1660 46202Rajasthan 130 3 0 795 41 95 3 0 1123 32369
Sikkim 0 35 0 590 25 484 0 0 57 219Tamil Nadu 318 1 3 580 36 79 3 0 2038 142273Tripura 106 5 0 849 3 55 0 0 312 1797Uttar Pradesh 282 1 5 639 52 74 1 0 3755 131658West Bengal 373 2 1 531 47 100 12 0 2119 122732
A & N Islands 19 140 0 924 9 5 0 0 78 383Chandigarh 15 12 0 978 0 123 0 0 56 1520D & N Haveli 238 0 37 725 0 37 0 0 26 57Daman & Diu 0 0 0 638 439 106 0 0 8 52Delhi 294 0 0 670 48 69 10 0 502 107459
Lakshadweep 309 0 0 691 0 0 0 0 12 34Pondicherry 30 0 0 929 29 122 9 0 77 3547Jharkhand 49 7 4 772 26 273 36 0 296 7341Chhattisgarh 137 31 12 589 31 341 6 0 224 8568Uttaranchal 269 1 4 683 14 50 2 0 195 7022
all-India 257 4 3 653 43 99 6 0 24891 1082189
Annex-IV

224 SARVEKSHANA
Table 13: Per thousand distribution of manufacturing enterprises by agency of purchase of basic input andby State / UT, sector and by type of enterprise
urban: DME
State / UT source agency for purchase of basic input no. of enterprises
no govern- co- private contrac- pvt. others n.r. in estimatedsource ment operative/ enter- tor/ indi- sampleagency marke- prise middle- vidual /
ting man house-society hold
(1) (2) (3) (4) (5) (6) (7) (8) (9) (10) (11)
Andhra Pradesh 164 18 6 805 26 70 66 0 559 18442Arunachal Pradesh 319 0 0 363 0 319 0 0 4 12Assam 34 8 18 863 39 492 0 0 128 1394Bihar 81 19 0 830 79 184 10 0 97 2781Goa 57 6 0 904 0 39 23 0 46 694
Gujarat 216 5 0 752 79 32 0 0 1198 37125Haryana 57 16 0 862 18 55 36 0 297 7576Himachal Pradesh 30 30 56 893 13 55 1 0 116 462Jammu & Kashmir 159 55 0 773 18 92 7 0 157 1930Karnataka 87 75 51 704 104 94 5 0 389 17988
Kerala 99 15 11 744 93 99 46 0 397 6785Madhya Pradesh 85 52 5 652 137 163 9 0 402 8727Maharashtra 262 33 1 682 58 32 4 0 2039 77592Manipur 56 0 0 885 0 353 0 0 68 388Meghalaya 0 0 33 972 21 7 126 0 33 186
Mizoram 13 0 0 840 0 314 0 0 26 108Nagaland 35 0 126 965 0 76 0 0 22 58Orissa 76 25 12 877 0 79 0 0 89 2467Punjab 44 5 1 893 34 106 0 0 963 17132Rajasthan 45 1 1 916 37 57 13 0 464 9789
Sikkim 0 0 0 726 0 274 0 0 5 23Tamil Nadu 249 21 6 642 55 83 3 0 1324 54336Tripura 0 0 4 1000 0 0 0 0 34 159Uttar Pradesh 216 7 5 651 116 63 2 0 1745 38400West Bengal 313 9 9 599 90 61 6 0 1099 39790
A & N Islands 7 310 0 848 74 103 0 0 36 119Chandigarh 4 6 1 969 6 159 24 0 78 1251D & N Haveli 249 0 0 751 0 0 0 0 3 8Daman & Diu 548 0 0 452 0 0 0 0 2 12Delhi 173 0 0 777 85 21 1 0 504 49934
Lakshadweep 0 0 0 1000 0 0 0 0 3 5Pondicherry 124 0 0 875 1 10 0 0 31 571Jharkhand 34 0 0 900 33 262 0 0 34 816Chhattisgarh 100 64 6 679 86 248 91 0 132 2297Uttaranchal 196 22 0 666 127 6 0 0 47 800
all-India 200 19 6 715 72 62 8 0 12571 400159
Annex-IV

SARVEKSHANA 225
Table 13: Per thousand distribution of manufacturing enterprises by agency of purchase of basic input andby State / UT, sector and by type of enterprise
urban: all
State / UT source agency for purchase of basic input no. of enterprises
no govern- co- private contrac- pvt. others n.r. in estimatedsource ment operative/ enter- tor/ indi- sampleagency marke- prise middle- vidual /
ting man house-society hold
(1) (2) (3) (4) (5) (6) (7) (8) (9) (10) (11)
Andhra Pradesh 279 1 5 627 41 78 34 0 5985 403541Arunachal Pradesh 115 0 0 841 302 110 25 0 36 178Assam 61 2 1 779 15 418 11 0 1642 38043Bihar 172 5 2 593 99 266 21 0 3486 125059Goa 104 1 3 801 1 59 35 0 293 6499
Gujarat 253 2 1 629 66 121 1 0 5077 296199Haryana 126 3 4 776 10 99 16 0 1936 92611Himachal Pradesh 77 7 5 771 16 194 6 0 1222 7482Jammu & Kashmir 227 10 2 624 93 104 10 0 2257 68583Karnataka 243 15 9 612 156 99 6 0 3744 347886
Kerala 180 20 14 668 51 121 6 0 2862 88341Madhya Pradesh 278 9 1 545 83 169 8 0 5150 212420Maharashtra 305 7 3 624 33 51 9 0 9693 570797Manipur 83 0 11 850 14 242 12 0 1618 19111Meghalaya 69 0 3 836 37 178 87 0 240 1862
Mizoram 79 9 13 727 6 315 37 0 586 2765Nagaland 58 14 5 843 21 105 21 0 598 2407Orissa 211 2 11 576 21 213 75 0 1841 63860Punjab 260 2 0 647 27 98 5 0 4850 153962Rajasthan 183 1 1 668 54 118 26 0 4854 232303
Sikkim 0 20 0 611 14 430 0 0 105 395Tamil Nadu 384 2 12 511 52 64 2 0 8213 682202Tripura 133 2 1 806 3 77 3 0 779 4483Uttar Pradesh 339 1 3 510 109 86 13 0 12751 658768West Bengal 617 1 3 292 70 55 8 0 6544 647358
A & N Islands 32 134 9 913 19 20 0 0 171 751Chandigarh 7 5 0 976 2 91 6 0 195 5289D & N Haveli 234 0 12 754 0 12 0 0 73 176Daman & Diu 480 0 0 318 111 168 0 0 49 334Delhi 253 0 0 699 52 59 5 0 1327 220014
Lakshadweep 126 0 0 852 0 22 0 0 43 135Pondicherry 56 9 0 855 52 59 25 0 236 9971Jharkhand 127 2 2 685 13 292 30 0 1495 44921Chhattisgarh 103 16 2 442 334 221 32 0 1156 57919Uttaranchal 259 2 1 647 43 65 7 0 617 22896
all-India 321 4 5 559 70 95 12 0 91724 5089520
Annex-IV

226 SARVEKSHANA
Table 13: Per thousand distribution of manufacturing enterprises by agency of purchase of basic input andby State / UT, sector and by type of enterprise
combined: OAME
State / UT source agency for purchase of basic input no. of enterprises
no govern- co- private contrac- pvt. others n.r. in estimatedsource ment operative/ enter- tor/ indi- sampleagency marke- prise middle- vidual /
ting man house-society hold
(1) (2) (3) (4) (5) (6) (7) (8) (9) (10) (11)
Andhra Pradesh 273 42 3 489 40 142 78 0 8758 1436680Arunachal Pradesh 132 0 0 346 0 497 61 0 47 233Assam 105 0 10 674 10 398 27 0 3214 247440Bihar 220 4 3 498 63 345 19 0 6954 763009Goa 154 0 1 465 0 72 313 0 278 18966
Gujarat 301 0 3 545 60 142 10 0 3889 402697Haryana 157 0 2 647 4 180 35 0 1577 147492Himachal Pradesh 284 6 0 248 56 432 43 0 1719 87499Jammu & Kashmir 493 2 2 349 123 113 5 0 2990 190580Karnataka 350 8 6 379 213 132 11 0 4236 895145
Kerala 162 8 15 530 129 200 8 0 4036 385793Madhya Pradesh 388 10 0 433 38 274 47 0 5653 685200Maharashtra 333 10 2 543 14 127 20 0 7206 972848Manipur 36 0 9 875 8 247 13 0 2015 51313Meghalaya 270 0 0 483 5 337 149 0 409 24271
Mizoram 105 3 20 444 16 446 79 0 646 5158Nagaland 77 7 0 706 7 150 91 0 912 4807Orissa 379 0 3 291 9 294 192 0 4026 949250Punjab 455 1 4 434 21 96 4 0 3485 256729Rajasthan 191 9 6 568 23 225 40 0 5104 563479
Sikkim 9 6 0 605 0 396 0 0 135 1169Tamil Nadu 453 4 12 400 60 91 7 0 8077 1239410Tripura 175 0 90 438 21 354 12 0 1769 31251Uttar Pradesh 437 0 4 315 89 133 60 0 10811 1974671West Bengal 388 0 1 264 163 234 38 0 7402 2485088
A & N Islands 728 12 6 255 1 15 3 0 175 1857Chandigarh 4 0 25 944 1 68 0 0 81 2928D & N Haveli 336 0 0 607 0 57 49 0 104 912Daman & Diu 545 0 0 339 24 145 34 0 89 602Delhi 251 0 0 684 30 72 2 0 351 68109
Lakshadweep 58 0 0 915 0 27 0 0 40 111Pondicherry 99 12 0 797 53 56 31 0 206 7737Jharkhand 95 0 0 375 160 408 97 0 3121 427350Chhattisgarh 209 6 0 402 96 278 161 0 1566 227970Uttaranchal 411 0 10 407 64 51 88 0 749 107665
all-India 338 7 4 405 84 197 50 0 101830 14665421
Annex-IV

SARVEKSHANA 227
Table 13: Per thousand distribution of manufacturing enterprises by agency of purchase of basic input andby State / UT, sector and by type of enterprise
combined: NDME
State / UT source agency for purchase of basic input no. of enterprises
no govern- co- private contrac- pvt. others n.r. in estimatedsource ment operative/ enter- tor/ indi- sampleagency marke- prise middle- vidual /
ting man house-society hold
(1) (2) (3) (4) (5) (6) (7) (8) (9) (10) (11)
Andhra Pradesh 246 1 3 622 17 84 73 0 2113 126385Arunachal Pradesh 44 0 0 901 330 66 37 0 43 163Assam 98 1 1 737 29 392 13 0 915 28220Bihar 88 7 2 742 28 354 32 0 1012 39608Goa 122 7 29 664 30 150 59 0 157 4830
Gujarat 295 3 0 578 89 71 1 0 1410 89025Haryana 93 2 3 790 5 135 8 0 852 36923Himachal Pradesh 58 9 3 772 0 250 1 0 682 8473Jammu & Kashmir 112 21 1 811 52 115 6 0 823 14474Karnataka 167 11 6 624 51 261 84 0 1170 88961
Kerala 156 2 60 652 51 139 3 0 2050 98689Madhya Pradesh 145 22 3 638 23 281 8 1 1057 41575Maharashtra 303 5 3 613 31 78 6 0 3121 170485Manipur 116 0 1 822 0 329 9 0 265 1995Meghalaya 41 0 41 728 90 229 22 0 267 3179
Mizoram 23 11 27 744 11 405 90 0 218 989Nagaland 105 61 6 678 25 138 42 0 209 850Orissa 401 3 12 512 9 129 4 0 572 27317Punjab 216 4 1 710 13 90 3 0 1986 64052Rajasthan 110 2 0 777 35 139 2 0 1357 46320
Sikkim 0 21 0 597 15 375 72 0 72 369Tamil Nadu 359 3 5 523 57 81 5 0 3056 206310Tripura 131 3 0 735 2 208 2 0 584 3940Uttar Pradesh 329 1 3 576 39 100 2 0 4260 230144West Bengal 328 1 1 549 42 165 21 0 2842 213635
A & N Islands 12 121 0 897 28 44 0 0 140 672Chandigarh 15 11 3 956 25 109 23 0 78 1760D & N Haveli 391 0 8 601 0 8 0 0 54 272Daman & Diu 401 0 0 509 98 24 10 0 27 231Delhi 301 0 0 674 46 67 9 0 533 111614
Lakshadweep 309 0 0 691 0 0 0 0 12 34Pondicherry 35 0 0 900 51 110 8 0 102 4058Jharkhand 85 4 1 711 105 285 19 0 421 19469Chhattisgarh 229 26 7 477 19 332 7 0 269 13845Uttaranchal 261 15 50 592 8 95 1 0 265 12803
all-India 263 4 6 615 41 132 17 0 32994 1711670
Annex-IV

228 SARVEKSHANA
Table 13: Per thousand distribution of manufacturing enterprises by agency of purchase of basic input andby State / UT, sector and by type of enterprise
combined: DME
State / UT source agency for purchase of basic input no. of enterprises
no govern- co- private contrac- pvt. others n.r. in estimatedsource ment operative/ enter- tor/ indi- sampleagency marke- prise middle- vidual /
ting man house-society hold
(1) (2) (3) (4) (5) (6) (7) (8) (9) (10) (11)
Andhra Pradesh 127 11 5 575 22 94 297 0 1350 43375Arunachal Pradesh 214 0 149 498 0 288 0 0 8 18Assam 25 4 9 837 110 423 36 0 181 2789Bihar 58 20 0 683 186 298 32 0 220 5987Goa 65 10 0 852 0 68 39 0 99 1121
Gujarat 198 7 1 691 79 125 25 0 1387 50585Haryana 57 14 0 834 20 96 31 0 370 8886Himachal Pradesh 6 335 17 489 11 211 0 0 193 2176Jammu & Kashmir 180 40 0 692 53 216 4 0 242 3051Karnataka 69 39 18 494 47 315 280 0 768 50221
Kerala 77 14 8 718 123 147 21 0 933 24618Madhya Pradesh 79 33 5 479 88 292 135 0 491 14532Maharashtra 241 38 1 675 58 73 9 0 2466 95548Manipur 36 0 0 905 0 251 0 0 87 603Meghalaya 0 6 19 814 141 187 41 0 61 568
Mizoram 13 0 0 841 0 311 0 0 27 109Nagaland 27 0 97 947 0 108 27 0 32 76Orissa 257 9 15 629 1 143 31 0 168 6858Punjab 42 4 1 880 30 132 0 0 1035 19807Rajasthan 36 6 1 833 89 77 26 0 574 13753
Sikkim 0 0 0 763 0 237 0 0 9 27Tamil Nadu 308 14 6 564 54 85 20 0 2123 82409Tripura 0 0 486 1000 0 0 0 0 39 316Uttar Pradesh 272 3 2 490 94 234 6 0 2131 85269West Bengal 281 8 5 545 89 174 7 0 1584 72300
A & N Islands 119 331 0 777 59 61 0 0 57 221Chandigarh 4 6 1 970 6 154 23 0 82 1294D & N Haveli 421 0 0 579 0 0 57 0 17 75Daman & Diu 59 0 0 941 181 6 0 0 31 204Delhi 175 2 0 774 84 21 1 0 526 50673
Lakshadweep 0 0 0 1000 0 0 0 0 3 5Pondicherry 95 5 0 886 1 45 0 0 60 1023Jharkhand 31 5 0 711 10 321 28 0 95 2810Chhattisgarh 72 86 16 469 52 152 332 0 145 3765Uttaranchal 81 11 0 588 52 276 0 0 76 1941
all-India 198 17 5 620 68 145 57 0 17670 647013
Annex-IV

SARVEKSHANA 229
Table 13: Per thousand distribution of manufacturing enterprises by agency of purchase of basic input andby State / UT, sector and by type of enterprise
combined: all
State / UT source agency for purchase of basic input no. of enterprises
no govern- co- private contrac- pvt. others n.r. in estimatedsource ment operative/ enter- tor/ indi- sampleagency marke- prise middle- vidual /
ting man house-society hold
(1) (2) (3) (4) (5) (6) (7) (8) (9) (10) (11)
Andhra Pradesh 267 38 3 502 38 136 84 0 12221 1606441Arunachal Pradesh 101 0 7 571 130 318 49 0 98 414Assam 104 1 9 682 13 398 26 0 4310 278449Bihar 212 5 3 511 62 345 20 0 8186 808604Goa 144 2 6 521 6 87 251 0 534 24917
Gujarat 291 1 2 564 67 129 10 0 6686 542307Haryana 140 1 2 683 5 168 30 0 2799 193301Himachal Pradesh 259 14 1 298 50 411 38 0 2594 98148Jammu & Kashmir 462 4 2 386 117 115 5 0 4055 208105Karnataka 320 10 6 406 191 152 30 0 6174 1034328
Kerala 157 7 23 562 114 186 8 0 7019 509101Madhya Pradesh 368 11 1 446 38 275 46 0 7201 741307Maharashtra 322 11 2 563 20 116 17 0 12793 1238882Manipur 39 0 8 874 8 250 13 0 2367 53911Meghalaya 238 0 5 518 17 322 132 0 737 28018
Mizoram 91 4 21 498 15 437 79 0 891 6256Nagaland 81 15 2 705 10 148 83 0 1153 5732Orissa 379 0 3 299 9 288 186 0 4766 983425Punjab 386 2 3 512 20 97 4 0 6506 340587Rajasthan 181 9 5 589 25 215 37 0 7035 623553
Sikkim 7 10 0 606 4 388 17 0 216 1565Tamil Nadu 433 4 11 425 59 89 8 0 13256 1528129Tripura 168 0 84 476 19 335 10 0 2392 35507Uttar Pradesh 420 0 3 347 84 133 52 0 17202 2290083West Bengal 380 0 1 293 152 227 36 0 11828 2771023
A & N Islands 504 64 4 454 12 26 2 0 372 2750Chandigarh 7 4 14 953 9 99 12 0 241 5982D & N Haveli 353 0 2 604 0 43 39 0 175 1259Daman & Diu 418 0 0 495 72 90 22 0 147 1038Delhi 258 1 0 699 50 58 5 0 1410 230397
Lakshadweep 113 0 0 867 0 20 0 0 55 150Pondicherry 78 8 0 836 48 72 21 0 368 12818Jharkhand 94 0 0 391 156 402 93 0 3637 449629Chhattisgarh 208 8 1 408 91 279 155 0 1980 245579Uttaranchal 390 2 14 429 58 59 78 0 1090 122409
all-India 325 7 4 434 79 188 47 0 152494 17024104
Annex-IV

230 SARVEKSHANA
Table 14: Per thousand distribution of manufacturing enterprises by destination agency separately by State/UT, sector and type of enterprise
rural: OAME
State / UT destination agency for sale of final products / services no. of enterprises
govern- co- private contrac- pvt. others n.r. in estimatedment operative/ enterprise tor/ individual/ sample
marketing middle- house-society man hold
(1) (2) (3) (4) (5) (6) (7) (8) (9) (10)
Andhra Pradesh 0 42 173 200 666 27 0 4719 1114984Arunch'l Pradesh 0 0 47 0 919 37 3 30 171Assam 1 13 261 24 935 25 0 2327 224130Bihar 0 3 203 73 877 14 1 4240 660305Goa 0 0 542 0 912 0 0 133 14963
Gujarat 2 5 115 72 866 4 0 1255 222032Haryana 2 6 85 6 899 45 8 650 89689H P 6 3 20 60 948 18 0 1085 82781Jammu & Kashmir 0 0 87 612 382 18 0 1464 132388Karnataka 11 11 117 460 472 21 0 1726 613347
Kerala 2 18 322 194 583 2 0 2571 327915Madhya Pradesh 0 2 211 289 700 7 0 1819 512584Maharashtra 0 3 134 9 878 27 0 2288 617324Manipur 0 10 691 5 770 116 2 677 34144Meghalaya 0 0 127 0 982 205 0 331 23387
Mizoram 2 0 120 21 930 21 0 270 3229Nagaland 0 0 111 10 988 5 12 502 3111Orissa 0 5 554 63 625 5 1 2632 897926Punjab 0 7 192 143 740 3 0 1258 166102Rajasthan 2 7 100 9 932 11 0 1837 373334
Sikkim 0 0 1 0 999 0 0 92 1016Tamil Nadu 13 27 399 219 412 2 0 3226 753817Tripura 0 70 372 34 722 36 0 1336 28725Uttar Pradesh 2 5 220 133 693 19 0 3560 1485961West Bengal 0 1 388 330 411 49 5 4076 2000252
A & N Islands 1 15 45 0 969 2 0 118 1608Chandigarh 0 0 57 10 1000 0 0 20 410D & N Haveli 0 0 162 0 964 0 0 60 801Daman & Diu 0 0 86 8 965 0 0 50 332Delhi 0 0 138 1 778 124 0 30 5488
Lakshadweep 0 0 83 0 1000 0 0 12 15Pondicherry 0 14 114 41 878 0 0 78 1884Jharkhand 0 1 260 187 790 7 0 1956 390587Chhattisgarh 0 1 53 27 943 7 0 766 180916Uttaranchal 0 35 194 90 848 1 0 374 92591
all-India 2 10 266 187 648 22 1 47568 11058248
Annex-IV

SARVEKSHANA 231
Table 14: Per thousand distribution of manufacturing enterprises by destination agency separately by State/UT, sector and type of enterprise
rural: NDME
State / UT destination agency for sale of final products / services no. of enterprises
govern- co- private contrac- pvt. others n.r. in estimatedment operative/ enterprise tor/ individual/ sample
marketing middle- house-society man hold
(1) (2) (3) (4) (5) (6) (7) (8) (9) (10)
Andhra Pradesh 36 32 276 21 762 14 0 726 62982Arunch'l Pradesh 55 0 359 0 340 328 0 28 59Assam 0 8 355 39 883 28 2 288 14881Bihar 0 6 197 28 902 57 0 337 20033Goa 4 0 520 12 884 5 0 55 3028
Gujarat 0 0 328 77 762 0 0 165 10615Haryana 0 0 49 10 978 0 0 140 9691H P 20 2 135 0 974 13 0 210 6171Jammu & Kashmir 0 0 190 142 911 13 0 249 6014Karnataka 4 38 599 40 648 0 0 325 40862
Kerala 2 78 458 71 608 4 0 1050 75012Madhya Pradesh 4 0 161 6 887 11 0 143 10498Maharashtra 17 0 232 6 891 15 5 385 32804Manipur 0 0 606 20 911 61 0 53 441Meghalaya 13 0 205 4 947 141 0 138 2388
Mizoram 62 0 339 55 976 21 0 34 261Nagaland 0 0 67 36 995 0 0 43 197Orissa 3 18 359 3 919 21 1 214 17249Punjab 0 0 249 6 801 7 0 326 17849Rajasthan 0 0 360 5 775 36 0 234 13951
Sikkim 70 0 0 0 824 176 0 15 151Tamil Nadu 0 27 489 135 545 42 0 1018 64037Tripura 1 1 535 34 648 35 47 272 2143Uttar Pradesh 0 0 322 93 662 11 0 505 98485West Bengal 3 3 486 106 606 25 4 723 90903
A &N Islands 26 40 317 30 864 0 0 62 288Chandigarh 0 0 224 165 835 168 0 22 240D & N Haveli 0 0 326 0 867 19 0 28 215Daman & Diu 0 0 701 3 369 0 0 19 180Delhi 0 0 161 84 783 0 0 31 4155
Pondicherry 0 0 443 227 441 9 0 25 511Jharkhand 0 2 292 275 690 2 0 125 12128Chhattisgarh 0 0 102 4 996 0 0 45 5277Uttaranchal 11 106 79 0 852 1 0 70 5781
all-India 6 20 370 68 707 18 1 8103 629481
Annex-IV

232 SARVEKSHANA
Table 14: Per thousand distribution of manufacturing enterprises by destination agency separately by State/UT, sector and type of enterprise
rural: DME
State / UT destination agency for sale of final products / services no. of enterprises
govern- co- private contrac- pvt. others n.r. in estimatedment operative/ enterprise tor/ individual/ sample
marketing middle- house-society man hold
(1) (2) (3) (4) (5) (6) (7) (8) (9) (10)
Andhra Pradesh 76 9 632 61 455 24 0 791 24933Arunch'l Pradesh 0 227 547 0 773 0 0 4 6Assam 39 0 408 165 793 118 0 53 1395Bihar 0 0 484 352 691 0 0 123 3207Goa 34 9 805 17 438 9 0 53 427
Gujarat 5 1 566 264 460 10 0 189 13460Haryana 18 2 826 0 697 0 0 73 1310H P 449 16 733 5 467 0 0 77 1714Jammu & Kashmir 0 0 596 189 568 0 0 85 1121Karnataka 332 53 573 27 364 19 0 379 32233
Kerala 0 13 741 147 353 2 0 536 17833Madhya Pradesh 15 389 249 36 332 0 0 89 5805Maharashtra 18 29 278 81 807 17 0 427 17957Manipur 4 0 790 27 996 0 0 19 214Meghalaya 15 0 401 19 985 12 0 28 382
Mizoram 0 0 0 0 1000 0 0 1 1Nagaland 100 0 271 0 1000 0 0 10 18Orissa 9 50 541 68 822 7 0 79 4391Punjab 6 0 619 29 752 0 0 72 2674Rajasthan 4 0 637 210 257 0 0 110 3964
Sikkim 0 0 829 0 171 0 0 4 4Tamil Nadu 2 9 708 182 299 0 0 799 28073Tripura 0 975 20 0 980 0 0 5 157Uttar Pradesh 2 0 441 102 529 19 0 386 46869West Bengal 9 2 596 138 545 32 2 485 32510
A & N Islands 409 0 341 85 972 0 0 21 102Chandigarh 0 0 800 0 1000 0 0 4 42D & N Haveli 0 0 936 0 519 64 0 14 67Daman & Diu 0 47 750 143 246 0 0 29 192Delhi 0 0 576 247 248 0 0 22 740
Pondicherry 0 58 682 51 456 25 0 29 452Jharkhand 0 0 211 431 877 52 0 61 1994Chhattisgarh 0 31 155 0 771 198 0 13 1468Uttaranchal 5 0 787 98 234 0 0 29 1141
all-India 59 23 552 116 486 17 0 5099 246854
Annex-IV

SARVEKSHANA 233
Table 14: Per thousand distribution of manufacturing enterprises by destination agency separately by State/UT, sector and type of enterprise
rural: all
State / UT destination agency for sale of final products / services no. of enterprises
govern- co- private contrac- pvt. others n.r. in estimatedment operative/ enterprise tor/ individual/ sample
marketing middle- house-society man hold
(1) (2) (3) (4) (5) (6) (7) (8) (9) (10)
Andhra Pradesh 3 41 188 187 667 26 0 6236 1202900Arunch'l Pradesh 14 6 138 0 771 109 2 62 236Assam 1 13 267 26 931 26 0 2668 240405Bihar 0 3 204 73 877 15 0 4700 683545Goa 1 0 545 2 896 1 0 241 18418
Gujarat 2 5 149 83 840 4 0 1609 246108Haryana 2 5 92 7 904 40 7 863 100690H P 15 3 41 55 940 18 0 1372 90666Jammu& Kashmir 0 0 96 589 406 18 0 1798 139523Karnataka 26 14 167 415 477 19 0 2430 686442
Kerala 2 29 364 170 578 3 0 4157 420760Madhya Pradesh 1 6 211 280 700 7 0 2051 528887Maharashtra 1 3 142 11 877 26 0 3100 668085Manipur 0 10 690 5 773 114 2 749 34799Meghalaya 1 0 138 1 979 196 0 497 26156
Mizoram 6 0 136 24 934 21 0 305 3492Nagaland 1 0 109 12 989 5 11 555 3325Orissa 0 6 550 62 631 5 1 2925 919566Punjab 0 7 204 129 746 3 0 1656 186625Rajasthan 2 7 115 11 919 12 0 2181 391250
Sikkim 9 0 3 0 974 23 0 111 1171Tamil Nadu 12 26 416 211 419 5 0 5043 845927Tripura 0 70 381 34 718 35 3 1613 31024Uttar Pradesh 1 4 233 130 686 19 0 4451 1631315West Bengal 0 1 395 317 421 48 5 5284 2123665
A & N Islands 25 18 99 9 954 2 0 201 1999Chandigarh 0 0 161 63 943 58 0 46 693D & N Haveli 0 0 242 0 917 8 0 102 1083Daman & Diu 0 13 424 44 617 0 0 98 704Delhi 0 0 178 52 742 66 0 83 10383
Lakshadweep 0 0 83 0 1000 0 0 12 15Pondicherry 0 18 263 76 733 6 0 132 2847Jharkhand 0 1 261 191 787 7 0 2142 404708Chhattisgarh 0 1 56 26 943 8 0 824 187660Uttaranchal 1 39 194 85 841 1 0 473 99513
all-India 3 11 278 180 648 21 1 60770 11934583
Annex-IV

234 SARVEKSHANA
Table 14: Per thousand distribution of manufacturing enterprises by destination agency separately by State/UT, sector and type of enterprise
urban: OAME
State / UT destination agency for sale of final products / services no. of enterprises
govern- co- private contrac- pvt. others n.r. in estimatedment operative/ enterprise tor/ individual/ sample
marketing middle- house-society man hold
(1) (2) (3) (4) (5) (6) (7) (8) (9) (10)
Andhra Pradesh 0 7 300 121 702 34 1 4039 321696Arunch'l Pradesh 0 0 596 0 277 325 0 17 62Assam 1 5 240 6 902 100 0 887 23310Bihar 6 1 246 159 766 11 1 2714 102704Goa 0 14 334 0 735 0 0 145 4003
Gujarat 0 1 361 99 689 9 0 2634 180665Haryana 0 3 250 13 781 58 0 927 57803H P 5 6 54 20 932 17 0 634 4718Jammu & Kashmir 4 1 395 353 337 19 0 1526 58192Karnataka 12 11 334 194 600 4 1 2510 281799
Kerala 3 15 285 104 757 11 0 1465 57879Madhya Pradesh 2 4 173 302 582 8 0 3834 172616Maharashtra 6 7 267 57 702 28 0 4918 355524Manipur 2 2 622 22 699 99 0 1338 17169Meghalaya 0 0 345 86 934 243 0 78 884
Mizoram 7 0 207 5 910 75 0 376 1929Nagaland 0 0 123 37 986 28 5 410 1696Orissa 0 9 323 50 824 12 1 1394 51324Punjab 3 1 354 52 670 11 0 2227 90627Rajasthan 0 4 398 94 569 10 0 3267 190145
Sikkim 0 0 0 0 1000 0 0 43 153Tamil Nadu 2 23 529 113 472 2 0 4851 485593Tripura 59 11 257 11 769 28 2 433 2527Uttar Pradesh 2 6 346 221 491 17 0 7251 488710West Bengal 0 4 282 265 488 49 7 3326 484836
A & N Islands 0 0 89 0 917 0 0 57 249Chandigarh 17 0 298 0 715 0 0 61 2517D & N Haveli 0 0 154 0 846 0 0 44 110Daman & Diu 0 0 166 77 908 0 0 39 270Delhi 1 0 407 142 527 3 0 321 62621
Lakshadweep 0 0 216 0 1000 0 0 28 96Pondicherry 16 8 156 243 805 37 0 128 5853Jharkhand 0 3 212 11 907 9 1 1165 36763Chhattisgarh 0 0 155 405 508 0 0 800 47054Uttaranchal 9 0 166 94 835 9 0 375 15074
all-India 3 8 336 160 591 20 1 54262 3607172
Annex-IV

SARVEKSHANA 235
Table 14: Per thousand distribution of manufacturing enterprises by destination agency separately by State/UT, sector and type of enterprise
urban: NDME
State / UT destination agency for sale of final products / services no. of enterprises
govern- co- private contrac- pvt. others n.r. in estimatedment operative/ enterprise tor/ individual/ sample
marketing middle- house-society man hold
(1) (2) (3) (4) (5) (6) (7) (8) (9) (10)
Andhra Pradesh 3 4 353 60 793 35 0 1387 63403Arunch'l Pradesh 37 0 258 480 888 37 0 15 104Assam 0 0 298 11 940 78 0 627 13339Bihar 7 1 363 36 893 8 0 675 19575Goa 0 11 453 10 936 0 0 102 1802
Gujarat 2 1 493 281 453 2 0 1245 78409Haryana 0 7 334 10 763 50 0 712 27231H P 16 10 98 0 940 26 0 472 2302Jammu & Kashmir 6 1 300 24 960 2 0 574 8460Karnataka 7 6 292 69 838 6 0 845 48100
Kerala 1 8 448 26 770 26 0 1000 23678Madhya Pradesh 5 2 269 65 787 7 1 914 31077Maharashtra 3 6 481 51 542 16 0 2736 137681Manipur 4 0 468 5 864 49 0 212 1554Meghalaya 14 0 188 53 970 48 0 129 792
Mizoram 66 11 467 35 974 7 0 184 728Nagaland 0 13 120 79 905 68 12 166 652Orissa 8 0 352 23 899 25 0 358 10068Punjab 1 3 394 21 736 7 0 1660 46202Rajasthan 3 1 372 58 729 9 1 1123 32369
Sikkim 45 0 48 16 964 0 0 57 219Tamil Nadu 1 11 574 66 569 4 0 2038 142273Tripura 12 2 284 23 727 8 20 312 1797Uttar Pradesh 4 5 378 99 637 15 0 3755 131658West Bengal 2 2 437 167 543 43 10 2119 122732
A & N Islands 84 0 105 11 968 0 0 78 383Chandigarh 24 0 447 0 712 0 0 56 1520D & N Haveli 0 0 349 0 878 0 0 26 57Daman & Diu 0 0 244 439 744 0 0 8 52Delhi 4 3 682 158 305 0 0 502 107459
Lakshadweep 0 0 0 0 1000 0 0 12 34Pondicherry 0 15 530 29 779 9 0 77 3547Jharkhand 0 0 216 11 906 7 0 296 7341Chhattisgarh 5 0 355 53 899 0 2 224 8568Uttaranchal 15 0 193 17 897 4 0 195 7022
all-India 3 5 450 96 617 16 1 24891 1082189
Annex-IV

236 SARVEKSHANA
Table 14: Per thousand distribution of manufacturing enterprises by destination agency separately by State/UT, sector and type of enterprise
urban: DME
State / UT destination agency for sale of final products / services no. of enterprises
govern- co- private contrac- pvt. others n.r. in estimatedment operative/ enterprise tor/ individual/ sample
marketing middle- house-society man hold
(1) (2) (3) (4) (5) (6) (7) (8) (9) (10)
Andhra Pradesh 14 1 671 71 566 8 0 559 18442Arunch'l Pradesh 0 0 0 0 681 319 0 4 12Assam 13 3 492 52 886 46 0 128 1394Bihar 10 10 546 87 626 10 0 97 2781Goa 39 0 471 33 818 0 0 46 694
Gujarat 7 5 828 157 205 0 0 1198 37125Haryana 6 12 690 10 388 28 0 297 7576H P 99 3 297 2 793 5 0 116 462Jammu & Kashmir 17 2 455 145 683 0 0 157 1930Karnataka 88 30 568 154 512 6 0 389 17988
Kerala 17 6 594 63 606 7 0 397 6785Madhya Pradesh 16 3 425 210 505 6 0 402 8727Maharashtra 4 3 752 79 215 35 0 2039 77592Manipur 7 7 548 78 849 61 0 68 388Meghalaya 45 0 490 0 820 0 126 33 186
Mizoram 138 0 322 0 979 126 0 26 108Nagaland 126 0 232 90 942 0 0 22 58Orissa 43 0 745 14 840 0 0 89 2467Punjab 0 1 706 36 419 7 0 963 17132Rajasthan 20 0 685 53 445 1 0 464 9789
Sikkim 0 0 242 0 758 0 0 5 23Tamil Nadu 2 17 788 107 271 4 0 1324 54336Tripura 56 68 285 0 696 0 0 34 159Uttar Pradesh 2 5 657 180 286 14 0 1745 38400West Bengal 12 6 596 225 325 17 6 1099 39790
A & N Islands 146 0 195 36 848 0 0 36 119Chandigarh 12 0 792 7 293 24 0 78 1251D & N Haveli 0 0 1000 0 751 0 0 3 8Daman & Diu 0 0 452 548 452 0 0 2 12Delhi 6 0 808 119 113 3 0 504 49934
Lakshadweep 0 0 595 0 595 0 0 3 5Pondicherry 4 0 452 1 680 0 0 31 571Jharkhand 0 0 371 0 867 0 32 34 816Chhattisgarh 22 3 454 270 613 24 0 132 2297Uttaranchal 22 0 361 127 656 0 0 47 800
all-India 11 6 711 121 307 13 1 12571 400159
Annex-IV

SARVEKSHANA 237
Table 14: Per thousand distribution of manufacturing enterprises by destination agency separately by State/UT, sector and type of enterprise
urban: all
State / UT destination agency for sale of final products / services no. of enterprises
govern- co- private contrac- pvt. others n.r. in estimatedment operative/ enterprise tor/ individual/ sample
marketing middle- house-society man hold
(1) (2) (3) (4) (5) (6) (7) (8) (9) (10)
Andhra Pradesh 1 6 325 109 710 33 1 5985 403541Arunch'l Pradesh 22 0 358 280 661 157 0 36 178Assam 1 3 269 9 915 90 0 1642 38043Bihar 6 1 271 138 783 11 1 3486 125059Goa 4 12 382 6 799 0 0 293 6499
Gujarat 1 1 454 154 566 6 0 5077 296199Haryana 1 5 310 12 744 53 0 1936 92611H P 14 7 83 13 926 19 0 1222 7482Jammu & Kashmir 5 1 385 307 424 16 0 2257 68583Karnataka 15 12 340 174 628 5 1 3744 347886
Kerala 4 12 353 80 749 15 0 2862 88341Madhya Pradesh 3 3 197 264 609 8 0 5150 212420Maharashtra 5 6 385 59 597 26 0 9693 570797Manipur 2 2 608 22 716 94 0 1618 19111Meghalaya 11 0 292 63 938 136 13 240 1862
Mizoram 27 3 280 13 930 59 0 586 2765Nagaland 3 3 125 49 963 38 7 598 2407Orissa 3 7 344 44 836 14 1 1841 63860Punjab 2 1 405 41 662 10 0 4850 153962Rajasthan 1 4 407 87 586 9 0 4854 232303
Sikkim 25 0 41 9 966 0 0 105 395Tamil Nadu 2 20 559 102 476 2 0 8213 682202Tripura 40 10 269 15 749 19 9 779 4483Uttar Pradesh 2 6 370 194 508 17 0 12751 658768West Bengal 1 3 331 244 489 46 8 6544 647358
A & N Islands 66 0 114 11 932 0 0 171 751Chandigarh 18 0 458 2 615 6 0 195 5289D & N Haveli 0 0 258 0 852 0 0 73 176Daman & Diu 0 0 189 150 866 0 0 49 334Delhi 4 1 633 144 324 1 0 1327 220014
Lakshadweep 0 0 175 0 986 0 0 43 135Pondicherry 9 10 306 153 788 25 0 236 9971Jharkhand 0 2 216 10 906 9 2 1495 44921Chhattisgarh 2 0 196 347 570 1 0 1156 57919Uttaranchal 11 0 181 71 848 7 0 617 22896
all-India 3 7 389 143 574 19 1 91724 5089520
Annex-IV

238 SARVEKSHANA
Table 14: Per thousand distribution of manufacturing enterprises by destination agency separately by State/UT, sector and type of enterprise
combined: OAME
State / UT destination agency for sale of final products / services no. of enterprises
govern- co- private contrac- pvt. others n.r. in estimatedment operative/ enterprise tor/ individual/ sample
marketing middle- house-society man hold
(1) (2) (3) (4) (5) (6) (7) (8) (9) (10)
Andhra Pradesh 0 34 201 182 674 28 0 8758 1436680Arunch'l Pradesh 0 0 193 0 748 113 2 47 233Assam 1 12 259 22 932 32 0 3214 247440Bihar 1 3 208 85 862 14 1 6954 763009Goa 0 3 498 0 874 0 0 278 18966
Gujarat 1 3 225 84 787 6 0 3889 402697Haryana 2 5 150 9 853 50 5 1577 147492H P 6 3 21 58 947 18 0 1719 87499Jammu & Kashmir 2 0 181 533 368 18 0 2990 190580Karnataka 11 11 185 376 512 15 0 4236 895145
Kerala 2 18 317 181 609 4 0 4036 385793Madhya Pradesh 1 2 202 292 671 7 0 5653 685200Maharashtra 2 4 183 27 813 27 0 7206 972848Manipur 1 7 668 11 747 110 1 2015 51313Meghalaya 0 0 135 3 981 206 0 409 24271
Mizoram 4 0 152 15 923 41 0 646 5158Nagaland 0 0 116 19 988 13 9 912 4807Orissa 0 5 541 63 635 5 1 4026 949250Punjab 1 5 249 111 715 6 0 3485 256729Rajasthan 1 6 201 38 809 11 0 5104 563479
Sikkim 0 0 1 0 999 0 0 135 1169Tamil Nadu 9 25 450 177 436 2 0 8077 1239410Tripura 5 65 363 32 725 35 0 1769 31251Uttar Pradesh 2 5 251 155 643 19 0 10811 1974671West Bengal 0 2 367 317 426 49 5 7402 2485088
A & N Islands 1 13 51 0 962 2 0 175 1857Chandigarh 15 0 264 1 755 0 0 81 2928D & N Haveli 0 0 161 0 950 0 0 104 912Daman & Diu 0 0 122 39 939 0 0 89 602Delhi 1 0 386 131 547 12 0 351 68109
Lakshadweep 0 0 198 0 1000 0 0 40 111Pondicherry 12 9 145 193 823 28 0 206 7737Jharkhand 0 1 256 172 800 7 0 3121 427350Chhattisgarh 0 1 74 105 853 5 0 1566 227970Uttaranchal 1 30 190 90 846 2 0 749 107665
all-India 2 10 284 181 634 21 1 101830 14665421
Annex-IV

SARVEKSHANA 239
Table 14: Per thousand distribution of manufacturing enterprises by destination agency separately by State/UT, sector and type of enterprise
combined: NDME
State / UT destination agency for sale of final products / services no. of enterprises
govern- co- private contrac- pvt. others n.r. in estimatedment operative/ enterprise tor/ individual/ sample
marketing middle- house-society man hold
(1) (2) (3) (4) (5) (6) (7) (8) (9) (10)
Andhra Pradesh 19 18 315 40 778 24 0 2113 126385Arunch'l Pradesh 44 0 295 306 689 143 0 43 163Assam 0 4 328 26 910 51 1 915 28220Bihar 4 3 279 32 898 32 0 1012 39608Goa 2 4 495 11 904 3 0 157 4830
Gujarat 2 1 473 257 490 1 0 1410 89025Haryana 0 5 259 10 819 37 0 852 36923H P 19 4 125 0 965 16 0 682 8473Jammu & Kashmir 4 0 254 73 939 6 0 823 14474Karnataka 5 21 433 56 751 3 0 1170 88961
Kerala 2 61 456 60 647 9 0 2050 98689Madhya Pradesh 5 1 241 50 813 8 1 1057 41575Maharashtra 5 5 433 43 609 16 1 3121 170485Manipur 3 0 498 8 874 52 0 265 1995Meghalaya 13 0 201 16 953 118 0 267 3179
Mizoram 65 8 433 40 974 11 0 218 989Nagaland 0 10 108 69 926 52 9 209 850Orissa 5 12 356 11 912 22 1 572 27317Punjab 1 2 354 17 754 7 0 1986 64052Rajasthan 2 0 368 42 743 17 0 1357 46320
Sikkim 55 0 29 10 907 72 0 72 369Tamil Nadu 1 16 548 87 562 15 0 3056 206310Tripura 6 1 420 29 684 23 35 584 3940Uttar Pradesh 2 3 354 96 648 13 0 4260 230144West Bengal 3 2 458 141 570 35 7 2842 213635
A & N Islands 59 17 196 19 924 0 0 140 672Chandigarh 21 0 416 23 729 23 0 78 1760D & N Haveli 0 0 331 0 869 15 0 54 272Daman & Diu 0 0 599 100 452 0 0 27 231Delhi 4 2 663 155 323 0 0 533 111614
Lakshadweep 0 0 0 0 1000 0 0 12 34Pondicherry 0 13 519 54 736 9 0 102 4058Jharkhand 0 1 264 175 771 4 0 421 19469Chhattisgarh 3 0 259 35 936 0 1 269 13845Uttaranchal 13 48 141 10 877 2 0 265 12803
all-India 4 10 420 86 650 16 1 32994 1711670
Annex-IV

240 SARVEKSHANA
Table 14: Per thousand distribution of manufacturing enterprises by destination agency separately by State/UT, sector and type of enterprise
combined: DME
State / UT destination agency for sale of final products / services no. of enterprises
govern- co- private contrac- pvt. others n.r. in estimatedment operative/ enterprise tor/ individual/ sample
marketing middle- house-society man hold
(1) (2) (3) (4) (5) (6) (7) (8) (9) (10)
Andhra Pradesh 50 6 649 65 502 17 0 1350 43375Arunch'l Pradesh 0 75 180 0 712 214 0 8 18Assam 26 2 450 109 840 82 0 181 2789Bihar 4 4 513 229 661 4 0 220 5987Goa 37 4 598 27 673 4 0 99 1121
Gujarat 6 4 758 185 273 3 0 1387 50585Haryana 8 11 710 8 434 24 0 370 8886H P 375 14 640 5 536 1 0 193 2176Jammu & Kashmir 11 1 507 161 641 0 0 242 3051Karnataka 245 45 571 72 417 14 0 768 50221
Kerala 5 11 700 124 423 4 0 933 24618Madhya Pradesh 16 157 355 140 436 3 0 491 14532Maharashtra 6 8 663 79 326 32 0 2466 95548Manipur 6 5 634 60 901 39 0 87 603Meghalaya 25 0 430 13 931 8 41 61 568
Mizoram 137 0 319 0 979 125 0 27 109Nagaland 120 0 241 69 955 0 0 32 76Orissa 21 32 614 48 829 4 0 168 6858Punjab 1 1 694 35 464 6 0 1035 19807Rajasthan 15 0 671 99 391 1 0 574 13753
Sikkim 0 0 322 0 678 0 0 9 27Tamil Nadu 2 15 761 132 280 2 0 2123 82409Tripura 28 518 154 0 837 0 0 39 316Uttar Pradesh 2 2 538 137 420 17 0 2131 85269West Bengal 10 4 596 186 424 24 4 1584 72300
A &N Islands 267 0 263 58 905 0 0 57 221Chandigarh 12 0 792 7 316 23 0 82 1294D & N Haveli 0 0 943 0 545 57 0 17 75Daman & Diu 0 44 732 167 258 0 0 31 204Delhi 6 0 805 121 115 3 0 526 50673
Lakshadweep 0 0 595 0 595 0 0 3 5Pondicherry 2 25 554 23 581 11 0 60 1023Jharkhand 0 0 257 306 874 37 9 95 2810Chhattisgarh 13 14 337 165 674 92 0 145 3765Uttaranchal 12 0 612 110 408 0 0 76 1941
all-India 29 13 650 119 375 15 1 17670 647013
Annex-IV

SARVEKSHANA 241
Table 14: Per thousand distribution of manufacturing enterprises by destination agency separately by State/UT, sector and type of enterprise
combined: all
State / UT destination agency for sale of final products / services no. of enterprises
govern- co- private contrac- pvt. others n.r. in estimatedment operative/ enterprise tor/ individual/ sample
marketing middle- house-society man hold
(1) (2) (3) (4) (5) (6) (7) (8) (9) (10)
Andhra Pradesh 3 32 222 168 678 28 0 12221 1606441Arunch'l Pradesh 17 3 233 120 723 129 1 98 414Assam 1 11 268 24 929 35 0 4310 278449Bihar 1 3 214 83 862 14 1 8186 808604
Gujarat 2 3 502 3 871 1 0 534 24917Goa 2 3 316 122 690 5 0 6686 542307Haryana 2 5 196 9 827 46 4 2799 193301H P 15 3 44 51 939 18 0 2594 98148Jammu & Kashmir 2 0 191 496 412 17 0 4055 208105Karnataka 22 13 225 334 528 14 0 6174 1034328
Kerala 2 26 362 154 607 5 0 7019 509101Madhya Pradesh 1 5 207 276 674 7 0 7201 741307Maharashtra 3 5 254 33 748 26 012793 1238882Manipur 1 7 661 11 753 107 1 2367 53911Meghalaya 2 0 149 5 976 192 1 737 28018
Mizoram 16 1 199 19 932 38 0 891 6256Nagaland 2 1 116 27 978 19 9 1153 5732Orissa 1 6 537 61 644 5 1 4766 983425Punjab 1 4 295 89 708 6 0 6506 340587Rajasthan 2 6 224 39 795 11 0 7035 623553
Sikkim 13 0 13 2 972 17 0 216 1565Tamil Nadu 7 23 480 163 444 4 0 13256 1528129Tripura 5 62 367 31 722 33 4 2392 35507Uttar Pradesh 2 5 272 148 635 18 0 17202 2290083West Bengal 1 2 380 300 437 48 6 11828 2771023
A & N Islands 36 13 103 9 948 1 0 372 2750Chandigarh 16 0 423 9 653 12 0 241 5982D & N Haveli 0 0 245 0 908 7 0 175 1259Daman & Diu 0 9 349 78 697 0 0 147 1038Delhi 3 1 612 140 343 4 0 1410 230397
Lakshadweep 0 0 166 0 987 0 0 55 150Pondicherry 7 12 296 136 776 21 0 368 12818Jharkhand 0 1 256 173 799 7 0 3637 449629Chhattisgarh 0 1 89 102 855 6 0 1980 245579Uttaranchal 3 32 192 82 842 2 0 1090 122409
all-India 3 10 311 169 626 21 1 152494 17024104
Annex-IV

242 SARVEKSHANA
Table 15: Annual value added (in Rs.) per enterprise by industry
rural: OAME
industry annual value added (in Rs.) annual value added (in Rs.) number ofper enterprise (method II) per enterprise (method I) enterprises
emolu rent interest net value total distributive total value sample estimatedments surplus added expenditure expenses receipt added
(1) (2) (3) (4) (5) (6) (7) (8) (9) (10) (11) (12)
01405 0 297 513 9815 10625 13194 0 23464 10270 16 1804
15 144 118 200 19473 19935 49743 156 70757 20858 8952 2104292
16 16 6 1 9885 9907 1623 1 11695 10071 3526 1615877
17 54 19 82 13780 13935 5910 27 20343 14407 6249 1552011
18 50 321 60 12387 12818 4746 1 17874 13126 8464 1545661
19 12 234 92 18505 18843 23428 19 42870 19423 565 87631
20 42 19 57 12676 12795 5648 31 18825 13147 10783 2402384
21 0 2 7 5906 5915 7161 9 13320 6150 84 25243
22 6 911 642 61745 63305 62262 54 129142 66825 77 13813
23 0 36 0 6247 6284 5982 0 12791 6809 19 2208
24 500 23 29 7875 8428 4405 23 12877 8448 349 90219
25 4 43 329 12814 13191 10967 1 24467 13499 187 24588
26 16 21 24 16463 16524 8657 144 25984 17183 3310 594246
27 8 523 1 22506 23038 34922 11 57647 22714 98 11150
28 99 149 126 16033 16406 13114 9 30203 17079 1779 325253
29 217 105 127 16288 16738 8396 92 25554 17067 329 73033
30 - - - - - - - - - - -
31 22 589 46 26356 27014 25064 16 53944 28864 82 17969
32 0 22 938 35137 36097 137845 0 174969 37124 4 618
33 0 0 0 55081 55081 52827 743 124078 70509 7 931
34 378 2235 191 9034 11838 22817 0 35477 12660 9 2461
35 0 48 490 29364 29902 45845 0 77389 31543 27 3076
36 65 205 137 20072 20479 21950 13 43032 21069 2617 557312
37 0 860 0 17188 18048 7249 0 24667 17418 35 6468
all 66 97 86 14470 14720 14889 50 30146 15207 47568 11058248
Method I: Product approach, Method II: Factor Income approach.
Annex-IV

SARVEKSHANA 243
Table 15: Annual value added (in Rs.) per enterprise by industry
rural: NDME
industry annual value added (in Rs.) annual value added (in Rs.) number ofper enterprise (method II) per enterprise (method I) enterprises
emolu rent interest net value total distributive total value sample estimatedments surplus added expenditure expenses receipt added
(1) (2) (3) (4) (5) (6) (7) (8) (9) (10) (11) (12)
01405 12016 210 0 26534 38761 189372 0 227070 37698 5 222
15 15865 605 1831 35736 54037 121116 287 174624 53221 1998 190597
16 28037 444 51 30725 59256 93771 1739 151486 55976 154 12699
17 20358 177 878 26438 47852 34796 92 83124 48236 1113 92178
18 14034 2313 243 26666 43255 19618 50 63841 44174 1491 120099
19 26651 1906 2318 46881 77757 148021 146 230903 82736 61 3172
20 26268 1156 2108 38572 68104 78139 362 150721 72219 799 56227
21 31218 1995 44631 27127 104969 170918 446 283045 111682 14 407
22 31948 4811 2653 36755 76168 54798 364 129602 74440 117 7465
23 31634 2025 0 65527 99187 363499 274 463591 99818 9 2358
24 34494 2137 5004 47166 88801 201105 2456 292217 88655 58 3006
25 50999 3255 5976 73677 133908 242172 3721 381576 135683 85 5447
26 37389 2902 771 42411 83474 125317 711 210789 84761 443 34629
27 22580 328 357 25789 49054 206186 8 257350 51155 47 1736
28 28331 2565 2791 42803 76490 141596 473 221755 79686 724 40706
29 24484 1766 1839 34921 63009 115042 932 182373 66399 127 6507
30 - - - - - - - - - - -
31 22152 1970 1186 40578 65885 173059 1449 239728 65219 37 3069
32 25562 2533 2050 66503 96649 224335 1631 321894 95928 5 192
33 42480 0 0 19111 61591 333558 629 396474 62287 4 465
34 36837 5766 4639 66694 113935 213591 14 330152 116548 23 581
35 25860 131 127 33367 59486 194649 319 260870 65902 15 1657
36 25983 2556 977 35486 65002 82509 88 148135 65539 765 46022
37 25518 0 600 54413 80530 265769 0 352974 87205 9 39
all 20991 1424 1392 34165 57971 86098 322 145077 58657 8103 629481
Method I: Product approach, Method II: Factor Income approach.
Annex-IV

244 SARVEKSHANA
Table 15: Annual value added (in Rs.) per enterprise by industry
rural: DME
industry annual value added (in Rs.) annual value added (in Rs.) number ofper enterprise (method II) per enterprise (method I) enterprises
emolu rent interest net value total distributive total value sample estimatedments surplus added expenditure expenses receipt added
(1) (2) (3) (4) (5) (6) (7) (8) (9) (10) (11) (12)
01405 111432 0 49163 286202 446797 856376 0 1326290 469914 8 66
15 48115 1064 11832 78415 139426 732702 8308 885728 144718 1039 65804
16 45472 183 2004 53945 101604 363845 7764 472430 100821 359 19593
17 119736 953 8984 64512 194185 273272 1768 471838 196799 1078 45255
18 56512 2934 4757 45659 109861 104288 1970 216113 109855 100 5458
19 119489 8880 2311 90673 221353 173963 4045 399452 221445 13 681
20 95860 1718 14816 97227 209620 894663 4799 1192649 293187 261 7819
21 229404 5493 80091 155266 470254 1991874 9230 2572786 571682 33 599
22 55501 4114 4071 63818 127505 149374 344 275640 125922 28 1074
23 66985 673 5794 66090 139542 923828 738 1065596 141031 9 497
24 85952 860 85323 75462 247597 626734 21417 809387 161235 178 14074
25 126355 8196 35506 158632 328690 1463691 28849 1824193 331653 124 4335
26 226707 9294 10396 172461 418858 743527 17029 1200231 439674 1250 57917
27 325704 5823 158859 1033632 1524019 4384154 6470 5789856 1399232 27 1426
28 110884 4017 19329 95973 230204 677399 4434 914565 232732 163 4751
29 194251 7573 63633 206494 471951 1809155 23737 2287736 454844 77 1783
30 - - - - - - - - - - -
31 171770 16059 26240 118531 332600 833220 9280 1117313 274813 38 1229
32 77542 18581 14955 88342 199420 651398 1433 856712 203881 5 200
33 236358 13542 10017 302490 562408 1138815 2856 1696758 555087 9 132
34 201290 8348 19336 167968 396942 442726 1106 845852 402020 38 575
35 311684 2512 2795 746847 1063838 2498322 2233 3890047 1389491 8 268
36 173815 1866 5507 81572 262760 180716 399 440479 259364 244 13263
37 212788 6877 13160 199227 432052 903126 0 1353953 450827 10 57
all 120930 3415 15949 105526 245820 619238 9480 878377 249659 5099 246854
Method I: Product approach, Method II: Factor Income approach.
Annex-IV
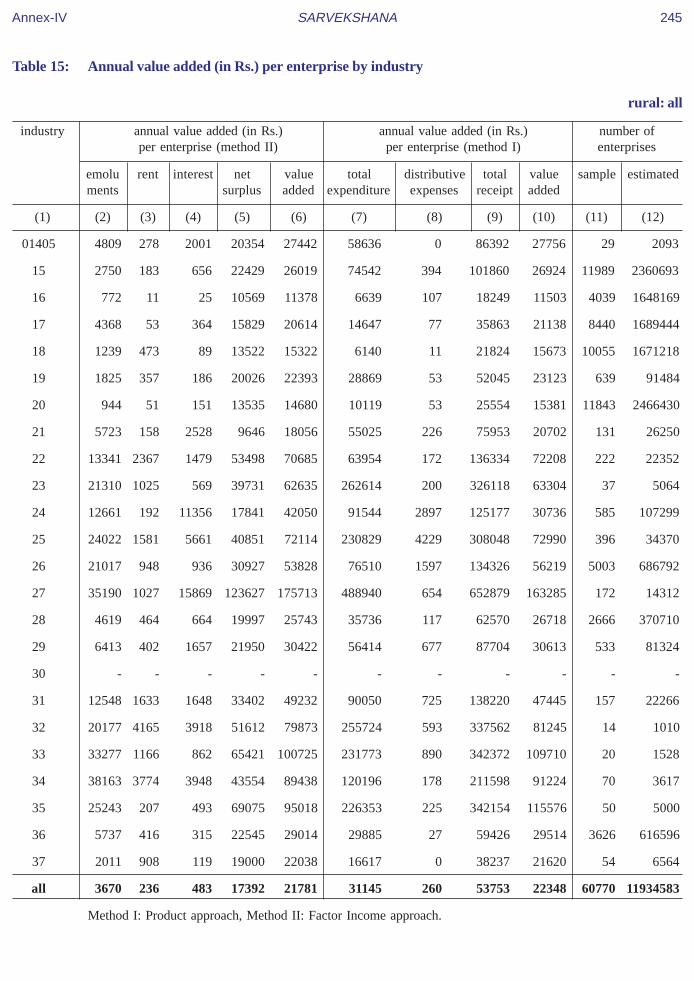
SARVEKSHANA 245
Table 15: Annual value added (in Rs.) per enterprise by industry
rural: all
industry annual value added (in Rs.) annual value added (in Rs.) number ofper enterprise (method II) per enterprise (method I) enterprises
emolu rent interest net value total distributive total value sample estimatedments surplus added expenditure expenses receipt added
(1) (2) (3) (4) (5) (6) (7) (8) (9) (10) (11) (12)
01405 4809 278 2001 20354 27442 58636 0 86392 27756 29 2093
15 2750 183 656 22429 26019 74542 394 101860 26924 11989 2360693
16 772 11 25 10569 11378 6639 107 18249 11503 4039 1648169
17 4368 53 364 15829 20614 14647 77 35863 21138 8440 1689444
18 1239 473 89 13522 15322 6140 11 21824 15673 10055 1671218
19 1825 357 186 20026 22393 28869 53 52045 23123 639 91484
20 944 51 151 13535 14680 10119 53 25554 15381 11843 2466430
21 5723 158 2528 9646 18056 55025 226 75953 20702 131 26250
22 13341 2367 1479 53498 70685 63954 172 136334 72208 222 22352
23 21310 1025 569 39731 62635 262614 200 326118 63304 37 5064
24 12661 192 11356 17841 42050 91544 2897 125177 30736 585 107299
25 24022 1581 5661 40851 72114 230829 4229 308048 72990 396 34370
26 21017 948 936 30927 53828 76510 1597 134326 56219 5003 686792
27 35190 1027 15869 123627 175713 488940 654 652879 163285 172 14312
28 4619 464 664 19997 25743 35736 117 62570 26718 2666 370710
29 6413 402 1657 21950 30422 56414 677 87704 30613 533 81324
30 - - - - - - - - - - -
31 12548 1633 1648 33402 49232 90050 725 138220 47445 157 22266
32 20177 4165 3918 51612 79873 255724 593 337562 81245 14 1010
33 33277 1166 862 65421 100725 231773 890 342372 109710 20 1528
34 38163 3774 3948 43554 89438 120196 178 211598 91224 70 3617
35 25243 207 493 69075 95018 226353 225 342154 115576 50 5000
36 5737 416 315 22545 29014 29885 27 59426 29514 3626 616596
37 2011 908 119 19000 22038 16617 0 38237 21620 54 6564
all 3670 236 483 17392 21781 31145 260 53753 22348 60770 11934583
Method I: Product approach, Method II: Factor Income approach.
Annex-IV

246 SARVEKSHANA
Table 15: Annual value added (in Rs.) per enterprise by industry
urban: OAME
industry annual value added (in Rs.) annual value added (in Rs.) number ofper enterprise (method II) per enterprise (method I) enterprises
emolu rent interest net value total distributive total value sample estimatedments surplus added expenditure expenses receipt added
(1) (2) (3) (4) (5) (6) (7) (8) (9) (10) (11) (12)
01405 0 1937 0 13581 15518 7661 0 23598 15937 59 3617
15 278 1347 348 31524 33496 87123 343 122808 35341 7866 452388
16 2 82 2 9238 9324 2139 10 11610 9461 4212 451515
17 325 350 170 19684 20529 15157 20 36291 21114 7937 522061
18 281 958 72 17063 18373 7278 13 26058 18767 13563 870905
19 36 1203 454 33121 34814 46489 42 83052 36521 1075 52688
20 278 372 176 22863 23690 14892 60 39380 24428 4490 265907
21 183 420 10 12820 13434 10581 61 24587 13945 591 43590
22 395 3149 896 29404 33844 27478 37 62003 34488 825 43644
23 10 1762 0 39965 41736 171531 27 211426 39868 12 565
24 2 290 39 8370 8701 14102 74 22984 8808 992 96050
25 1713 1734 254 25444 29145 35676 89 65796 30031 441 24993
26 130 236 99 22477 22943 17597 212 41983 24173 1819 92263
27 523 1879 48 41678 44127 63545 16 110532 46970 233 8701
28 634 1913 302 35628 38477 43907 39 83889 39942 2121 115384
29 268 3497 1184 40032 44982 40406 20 86451 46025 569 26078
30 - - - - - - - - - - -
31 634 3464 3452 40021 47571 89780 15 139531 49736 293 13266
32 371 75 1236 38316 39999 49644 74 93313 43595 16 981
33 2133 2896 2114 48991 56134 52078 29 109213 57105 58 3178
34 3414 5777 650 50959 60800 57823 0 120124 62301 57 2583
35 0 1622 23 37111 38756 58054 0 99518 41465 64 3207
36 229 1608 232 29614 31683 32214 21 65048 32814 6854 507888
37 108 1230 64 30498 31900 32590 27 65955 33338 115 5721
all 256 918 188 21770 23131 25409 69 49408 23930 54262 3607172
Method I: Product approach, Method II: Factor Income approach.
Annex-IV

SARVEKSHANA 247
Table 15: Annual value added (in Rs.) per enterprise by industry
urban: NDME
industry annual value added (in Rs.) annual value added (in Rs.) number ofper enterprise (method II) per enterprise (method I) enterprises
emolu rent interest net value total distributive total value sample estimatedments surplus added expenditure expenses receipt added
(1) (2) (3) (4) (5) (6) (7) (8) (9) (10) (11) (12)
01405 17462 2495 0 40510 60467 17345 0 77056 59711 18 677
15 27901 3085 1292 54285 86563 293499 445 384764 90820 3420 157784
16 23325 649 687 47384 72044 106127 179 180927 74621 72 2804
17 47802 3030 2195 59614 112641 267911 720 383487 114857 3172 112752
18 32439 5649 516 41550 80154 40585 76 122952 82291 4726 219551
19 36621 4210 786 55582 97199 144802 558 248235 102875 564 21206
20 39848 3066 1776 52899 97589 145596 156 245863 100111 1641 62745
21 47915 13452 1377 64057 126802 248511 1370 381112 131230 215 11417
22 40047 8084 3134 56632 107897 110875 1078 222990 111037 1369 60624
23 43100 492 2198 73060 118851 386048 0 511309 125261 15 1018
24 33608 4180 2882 67090 107760 454762 2391 569678 112525 243 9050
25 53248 9346 9304 68752 140651 309220 1333 455918 145365 476 22243
26 32569 4084 2571 82525 121748 187825 1245 318552 129482 682 23986
27 41463 4890 2046 64279 112679 247968 759 368519 119791 312 11943
28 41785 6652 2002 58268 108707 152344 159 262807 110305 2899 121203
29 57408 10114 9738 72319 149579 220397 1881 382859 160581 877 40216
30 62074 22196 0 99438 183708 505308 42 690142 184792 6 123
31 39614 6119 1412 68423 115567 240249 648 358497 117599 335 14267
32 59825 8326 547 77979 146677 193769 692 342052 147591 30 2014
33 51610 6324 1673 103695 163302 318735 193 487549 168621 72 2639
34 60089 5605 1334 72980 140008 130218 612 291891 161061 156 8860
35 47153 5985 8048 70604 131790 173165 65 332999 159769 98 4339
36 35951 3810 1008 63007 103775 118402 114 224358 105841 3434 168937
37 39861 3682 1544 66101 111189 133887 64 247625 113674 59 1792
all 38012 5048 1942 56640 101642 166839 455 272341 105046 24891 1082189
Method I: Product approach, Method II: Factor Income approach.
Annex-IV

248 SARVEKSHANA
Table 15: Annual value added (in Rs.) per enterprise by industry
urban: DME
industry annual value added (in Rs.) annual value added (in Rs.) number ofper enterprise (method II) per enterprise (method I) enterprises
emolu rent interest net value total distributive total value sample estimatedments surplus added expenditure expenses receipt added
(1) (2) (3) (4) (5) (6) (7) (8) (9) (10) (11) (12)
01405 287548 4433 30172 142715 464867 3582237 58472 4109201 468492 5 52
15 114620 8019 14245 148731 285616 1858680 5405 2170745 306660 1139 40425
16 121166 4114 2952 154999 283231 821264 15345 1120216 283607 56 1414
17 172503 7839 9303 105312 294958 701174 2770 1004390 300446 3141 88889
18 172896 14351 5018 127966 320230 406981 5097 738341 326263 1008 47916
19 146298 12241 3921 119030 281490 653781 3516 962856 305559 306 10571
20 122011 3403 8970 118230 252614 876376 3468 1151608 271764 569 16712
21 147360 18798 18337 138923 323418 1168376 4423 1506512 333713 219 7744
22 164768 14019 28471 183096 390353 802170 16312 1188464 369983 522 17351
23 94147 976 35820 143751 274694 1791265 528810 2616919 296845 15 206
24 218646 18047 44931 234692 516315 2690947 13263 3227130 522920 318 7826
25 172154 23747 36677 230177 462755 1295249 4283 1772523 472991 438 13739
26 155616 2512 14656 103952 276736 809571 13132 1120822 298119 574 17009
27 203001 12117 67915 140760 423794 3483899 14503 3987399 488996 188 3949
28 147335 11991 9453 117640 286419 758481 1342 1053474 293651 1264 35166
29 194892 17540 27509 171591 411531 1052077 6469 1492520 433973 749 18757
30 295767 25241 16437 231218 568663 4886868 27700 5506484 591916 10 42
31 213654 17105 28448 151939 411145 17161270 5777 17612171 445125 242 15677
32 210576 20514 17931 182333 431354 583506 246 1022002 438250 43 2830
33 227214 17386 33123 227955 505677 799372 32579 1338586 506636 55 1329
34 184354 14881 14013 153205 366453 876309 15685 1270536 378542 190 7227
35 177044 5208 19626 159176 361054 900500 4469 1342697 437728 173 3676
36 202748 9982 8975 110729 332434 526197 1840 865729 337692 1312 40296
37 87689 12123 136 108760 208707 810257 643 1022596 211696 35 1357
all 167274 11232 14449 133545 326499 1549101 5516 1892516 337900 12571 400159
Method I: Product approach, Method II: Factor Income approach.
Annex-IV

SARVEKSHANA 249
Table 15: Annual value added (in Rs.) per enterprise by industry
urban: all
industry annual value added (in Rs.) annual value added (in Rs.) number ofper enterprise (method II) per enterprise (method I) enterprises
emolu rent interest net value total distributive total value sample estimatedments surplus added expenditure expenses receipt added
(1) (2) (3) (4) (5) (6) (7) (8) (9) (10) (11) (12)
01405 6144 2053 359 19314 27871 51725 696 80566 28145 82 4346
15 14082 2183 1440 44327 62032 247250 683 313588 65655 12425 650597
16 521 98 15 9925 10560 5321 59 16092 10712 4340 455733
17 28869 1688 1607 36422 68587 138797 466 209291 70028 14250 723702
18 13748 2426 366 26453 42994 30526 239 74726 43961 19297 1138371
19 27526 3339 971 49511 81347 147173 607 234629 86849 1945 84465
20 13357 1009 893 32934 48193 80324 243 130713 50146 6700 345364
21 27031 5059 2521 37705 72316 196755 838 272340 74747 1025 62750
22 43611 7160 5946 64903 121619 179571 2878 302959 120509 2716 121618
23 35353 949 5367 70728 112397 479759 60777 658537 118001 42 1789
24 17848 1832 3378 28760 51818 234928 1174 288851 52749 1553 112926
25 58917 9471 11763 87375 167526 419279 1488 592682 171915 1355 60975
26 25815 1219 2402 43685 73122 149326 2047 229468 78095 3075 133258
27 52918 4985 11916 68564 138384 702349 2704 858367 153314 733 24593
28 37971 5331 2245 56338 101884 184738 261 289154 104155 6284 271753
29 70207 9723 11034 84312 175276 348620 2322 536690 185748 2195 85051
30 121054 22964 4148 132697 280864 1611139 7022 1905705 287543 16 165
31 90788 9290 11847 90003 201928 6333029 2314 6550934 215591 870 43210
32 123053 12858 9109 121998 267018 358845 371 630506 271290 89 5825
33 62270 6857 7719 102480 179326 289547 6144 477591 181900 185 7146
34 100352 9220 6147 100989 216709 409018 6362 646967 231587 403 18670
35 76229 4484 9547 90048 180308 378537 1489 597044 217017 335 11223
36 20024 2597 906 42038 65566 80275 145 147569 67149 11600 717120
37 21536 3392 374 49663 74965 172020 129 249000 76851 209 8869
all 21415 2607 1682 37973 63677 175280 579 241723 65863 91724 5089520
Method I: Product approach, Method II: Factor Income approach.
Annex-IV

250 SARVEKSHANA
Table 15: Annual value added (in Rs.) per enterprise by industry
combined: OAME
industry annual value added (in Rs.) annual value added (in Rs.) number ofper enterprise (method II) per enterprise (method I) enterprises
emolu rent interest net value total distributive total value sample estimatedments surplus added expenditure expenses receipt added
(1) (2) (3) (4) (5) (6) (7) (8) (9) (10) (11) (12)
01405 0 1391 171 12328 13890 9502 0 23553 14051 75 5421
15 168 335 226 21606 22335 56357 189 79967 23421 16818 2556680
16 13 23 1 9744 9780 1735 3 11676 9938 7738 2067391
17 122 102 104 15266 15595 8237 25 24357 16095 14186 2074072
18 133 551 64 14072 14820 5658 6 20823 15159 22027 2416566
19 21 598 228 23993 24840 32087 28 57958 25843 1640 140319
20 66 55 69 13691 13881 6569 34 20874 14271 15273 2668291
21 116 267 9 10285 10677 9327 42 20455 11086 675 68833
22 302 2611 835 37179 40927 35840 41 78143 42262 902 57456
23 2 388 0 13117 13507 39713 5 53264 13545 31 2773
24 244 161 34 8130 8569 9406 49 18089 8634 1341 186269
25 865 896 291 19181 21233 23423 45 45301 21833 628 49580
26 31 50 34 17271 17386 9859 153 28134 18122 5129 686509
27 234 1117 21 30909 32282 47468 13 80828 33346 331 19851
28 239 611 172 21164 22185 21178 17 44261 23066 3900 440637
29 230 998 406 22536 24170 16818 73 41577 24687 898 99112
30 - - - - - - - - - - -
31 282 1810 1493 32160 35745 52550 15 90295 37729 375 31234
32 228 55 1121 37087 38490 83747 45 124886 41093 20 1600
33 1650 2240 1635 50371 55895 52248 191 112581 60143 65 4109
34 1933 4049 426 30502 36910 40743 0 78822 38079 66 5044
35 0 851 252 33318 34421 52077 0 88684 36608 91 6283
36 143 874 182 24622 25821 26844 17 53529 26669 9471 1065200
37 51 1034 30 23435 24550 19143 13 44045 24890 150 12189
all 113 299 111 16265 16789 17476 55 34884 17352 101830 14665421
Method I: Product approach, Method II: Factor Income approach.
Annex-IV

SARVEKSHANA 251
Table 15: Annual value added (in Rs.) per enterprise by industry
combined: NDME
industry annual value added (in Rs.) annual value added (in Rs.) number ofper enterprise (method II) per enterprise (method I) enterprises
emolu rent interest net value total distributive total value sample estimatedments surplus added expenditure expenses receipt added
(1) (2) (3) (4) (5) (6) (7) (8) (9) (10) (11) (12)
01405 16117 1930 0 37057 55104 59846 0 114118 54273 23 899
15 21316 1729 1587 44137 68768 199189 358 269798 70250 5418 348380
16 27185 481 166 33738 61569 96006 1457 156811 59348 226 15503
17 35458 1747 1603 44692 83499 163055 437 248383 84891 4285 204931
18 25931 4469 419 36287 67107 33171 67 102051 68813 6217 339650
19 35324 3910 985 54450 94669 145221 504 245980 100254 625 24378
20 33430 2163 1933 46128 83655 113715 254 200898 86929 2440 118972
21 47340 13058 2867 62785 126050 245838 1339 377734 130557 229 11824
22 39159 7725 3081 54452 104418 104727 1000 212751 107024 1486 68089
23 35092 1563 663 67799 105116 370298 191 477980 107490 24 3376
24 33829 3671 3411 62122 103033 391513 2408 500493 106573 301 12056
25 52806 8148 8650 69721 139325 296030 1803 441293 143460 561 27690
26 35417 3386 1508 58826 99136 150896 930 254887 103061 1125 58615
27 39067 4311 1832 59395 104605 242667 664 354412 111082 359 13678
28 38403 5625 2201 54380 100607 149642 238 252487 102607 3623 161909
29 52823 8952 8638 67111 137523 205724 1749 354938 147465 1004 46724
30 62074 22196 0 99438 183708 505308 42 690142 184792 6 123
31 36523 5385 1372 63494 106773 228356 790 337474 108328 372 17336
32 56840 7821 678 76979 142319 196432 774 340296 143091 35 2206
33 50241 5376 1422 91016 148056 320957 258 473897 152682 76 3104
34 58658 5615 1537 72593 138403 135350 575 294246 158321 179 9441
35 41269 4368 5859 60315 111811 179101 135 313068 133831 113 5996
36 33817 3541 1001 57115 95474 110718 108 208039 97213 4199 214958
37 39554 3603 1524 65852 110533 136706 63 249877 113108 68 1831
all 31753 3715 1740 48374 85582 137146 406 225538 87986 32994 1711670
Method I: Product approach, Method II: Factor Income approach.
Annex-IV

252 SARVEKSHANA
Table 15: Annual value added (in Rs.) per enterprise by industry
combined: DME
industry annual value added (in Rs.) annual value added (in Rs.) number ofper enterprise (method II) per enterprise (method I) enterprises
emolu rent interest net value total distributive total value sample estimatedments surplus added expenditure expenses receipt added
(1) (2) (3) (4) (5) (6) (7) (8) (9) (10) (11) (12)
01405 188596 1942 40842 223334 454714 2050686 25619 2545596 469291 13 118
15 73423 3711 12751 105173 195058 1161190 7203 1374738 206345 2178 106229
16 50569 448 2067 60749 113833 394644 8275 516047 113129 415 21008
17 154701 5516 9196 91548 260961 556817 2432 824728 265479 4219 134144
18 160995 13183 4991 119549 298718 376028 4778 684939 304133 1108 53374
19 144676 12037 3823 117314 277850 624737 3548 928752 300467 319 11252
20 113675 2866 10833 111535 238910 882205 3892 1164690 278593 830 24531
21 153255 17842 22773 140097 333967 1227540 4769 1583118 350809 252 8344
22 158400 13442 27049 176144 375034 764122 15381 1135262 355758 550 18425
23 74928 761 14575 88802 179067 1177512 155173 1519284 186599 24 703
24 133371 7002 70888 132364 343625 1364391 18503 1673379 290485 496 21900
25 161170 20017 36396 213019 430602 1335646 10174 1784915 439094 562 18074
26 210568 7754 11363 156909 386595 758520 16144 1182204 407539 1824 74926
27 235548 10448 92038 377590 715623 3722688 12372 4465492 730432 215 5375
28 142997 11042 10629 115061 279728 748830 1710 1036941 286400 1427 39917
29 194836 16674 30645 174621 416776 1117803 7968 1561557 435785 826 20540
30 295767 25241 16437 231218 568663 4886868 27700 5506484 591916 10 42
31 210610 17029 28287 149511 405437 15974690 6031 16413469 432748 280 16905
32 201816 20387 17735 176144 416081 587977 324 1011117 422816 48 3030
33 228037 17040 31043 234665 510784 829931 29903 1370831 510997 64 1461
34 185601 14400 14405 154293 368699 844369 14611 1239252 380271 228 7802
35 186176 5026 18484 199037 408722 1008876 4317 1515478 502284 181 3944
36 195583 7972 8116 103509 315180 440645 1483 760424 318296 1556 53558
37 92762 11910 664 112428 217765 814023 617 1036034 221394 45 1414
all 149592 8249 15021 122855 295718 1194331 7028 1505592 304233 17670 647013
Method I: Product approach, Method II: Factor Income approach.
Annex-IV

SARVEKSHANA 253
Table 15: Annual value added (in Rs.) per enterprise by industry
combined: all
industry annual value added (in Rs.) annual value added (in Rs.) number ofper enterprise (method II) per enterprise (method I) enterprises
emolu rent interest net value total distributive total value sample estimatedments surplus added expenditure expenses receipt added
(1) (2) (3) (4) (5) (6) (7) (8) (9) (10) (11) (12)
01405 5710 1477 893 19652 27732 53971 470 82460 28019 111 6439
15 5198 615 826 27160 33800 111856 456 147604 35291 24414 3011289
16 718 30 23 10430 11200 6353 96 17782 11332 8379 2103902
17 11716 543 737 22005 35001 51880 194 87874 35800 22690 2413147
18 6307 1264 201 18761 26534 16020 104 43259 27135 29352 2809589
19 14163 1788 563 34181 50695 85661 319 139695 53715 2584 175949
20 2469 168 242 15917 18796 18742 77 38470 19651 18543 2811794
21 20746 3614 2523 29429 56312 154953 657 214417 58807 1156 89000
22 38911 6416 5252 63132 113712 161621 2458 277089 113010 2938 143970
23 24976 1005 1822 47822 75624 319295 16012 412890 77582 79 6852
24 15321 1033 7265 23440 47059 165068 2013 209105 42024 2138 220225
25 46338 6627 9563 70604 133132 351347 2476 490078 136255 1751 95345
26 21797 992 1174 33000 56963 88343 1670 149787 59774 8078 820050
27 46397 3529 13370 88820 152116 623844 1950 782775 156982 905 38904
28 18726 2522 1333 35368 57950 98762 178 158412 59473 8950 642462
29 39025 5167 6451 53829 104472 205790 1518 317227 109918 2728 166375
30 121054 22964 4148 132697 280864 1611139 7022 1905705 287543 16 165
31 64182 6686 8379 70755 150002 4210029 1774 4370214 158411 1027 65475
32 107849 11573 8342 111596 239360 343605 404 587212 243203 103 6836
33 57162 5855 6511 95952 165480 279369 5218 453771 169183 205 8674
34 90260 8336 5790 91669 196055 362147 5359 576314 208808 473 22287
35 60514 3166 6757 83583 154019 331630 1100 518480 185751 385 16223
36 13419 1589 633 33026 48667 56979 90 106819 49750 15226 1333716
37 13232 2335 265 36621 52453 105921 74 159354 53359 263 15433
all 8975 945 842 23545 34306 74236 355 109948 35357 152494 17024104
Method I: Product approach, Method II: Factor Income approach.
Annex-IV

254 SARVEKSHANA
Table 16: Annual value added (in Rs.) per enterprise by State / UT
rural: OAME
State/UT annual value added (in Rs.) annual value added (in Rs.) number ofper enterprise (method II) per enterprise (method I) enterprises
emolu rent interest net value total distributive total value sample estimatedments surplus addedexpenditure expenses receipt added
(1) (2) (3) (4) (5) (6) (7) (8) (9) (10) (11) (12)
Andhra Pr. 262 123 66 12997 13448 10338 33 24243 13872 4719 1114984
Arunachal Pr. 70 1048 269 21611 22999 26182 25 54308 28102 30 171
Assam 2 44 50 17720 17817 15757 54 34377 18565 2327 224130
Bihar 31 62 39 19511 19643 15648 9 35492 19835 4240 660305
Goa 344 189 100 13455 14088 11929 375 26874 14571 133 14963
Gujarat 9 211 35 20539 20794 16873 9 38033 21150 1255 222032
Haryana 26 549 168 21610 22353 20280 7 43356 23069 650 89689
Himachal Pr. 14 253 55 12109 12431 7407 22 20532 13103 1085 82781
Jammu & 3 28 45 34900 34976 9513 102 47167 37552 1464 132388
Kashmir
Karnataka 15 72 96 11604 11786 5005 2 17162 12154 1726 613347
Kerala 412 300 271 12588 13571 10300 36 24132 13796 2571 327915
Madhya Pradesh 12 69 84 11803 11969 6208 5 18311 12098 1819 512584
Maharashtra 34 196 178 17158 17567 17289 70 36248 18888 2288 617324
Manipur 0 0 10 10931 10941 11316 36 23443 12091 677 34144
Meghalaya 0 124 1 19711 19836 23797 10 45127 21320 331 23387
Mizoram 1 154 178 23478 23812 30573 1 55566 24991 270 3229
Nagaland 0 49 71 17039 17159 12385 3 31044 18656 502 3111
Orissa 40 14 40 9286 9380 8295 1 17846 9550 2632 897926
Punjab 26 341 102 19483 19952 10711 24 30757 20023 1258 166102
Rajasthan 102 250 238 22326 22916 17312 23 40497 23163 1837 373334
Sikkim 0 407 0 17493 17900 4518 47 23630 19065 92 1016
Tamilnadu 62 114 180 12669 13026 8789 16 21965 13160 3226 753817
Tripura 112 40 12 14409 14573 19431 38 35176 15708 1336 28725
Uttar Pradesh 37 74 47 12344 12503 8877 8 21798 12913 3560 1485961
West Bengal 16 6 48 14654 14724 33817 186 49467 15465 4076 2000252
A & N Islands 414 366 282 10614 11677 14439 82 26835 12314 118 1608
Chandigarh 201 3713 42 37055 41011 68165 0 114269 46103 20 410
D & N Haveli 0 137 13 23778 23927 10328 0 34716 24388 60 801
Daman & Diu 0 447 0 19237 19683 22208 0 42516 20308 50 332
Delhi 2362 4445 199 30362 37369 13698 0 51665 37967 30 5488
Lakshadweep 0 150 0 17304 17454 15855 0 33692 17837 12 15
Pondicherry 274 272 395 12768 13709 13436 0 27031 13596 78 1884
Jharkhand 1 9 70 16571 16652 10522 8 27273 16743 1956 390587
Chhatisgarh 3 129 122 11109 11364 7042 30 19240 12168 766 180916
Uttaranchal 52 381 110 13096 13639 10646 1 25750 15102 374 92591
all India 66 97 86 14470 14720 14889 50 30146 15207 47568 11058248
Method I: Product approach, Method II: Factor Income approach.
Annex-IV

SARVEKSHANA 255
Table 16: Annual value added (in Rs.) per enterprise by State / UT
rural: NDME
State/UT annual value added (in Rs.) annual value added (in Rs.) number ofper enterprise (method II) per enterprise (method I) enterprises
emolu rent interest net value total distributive total value sample estimatedments surplus addedexpenditure expenses receipt added
(1) (2) (3) (4) (5) (6) (7) (8) (9) (10) (11) (12)
Andhra Pr. 15237 1061 661 27829 44788 46055 491 91413 44866 726 62982
Arunachal Pr. 70527 8200 329 36114 115170 859286 0 993174 133887 28 59
Assam 15282 636 2065 40671 58653 94199 1095 153487 58193 288 14881
Bihar 21586 1367 743 41474 65170 98736 371 164123 65016 337 20033
Goa 45655 1557 4332 48974 100518 124543 987 231031 105501 55 3028
Gujarat 28238 3887 1600 49906 83631 215527 1047 301358 84784 165 10615
Haryana 18383 2280 1123 47221 69008 102946 0 174039 71093 140 9691
Himachal Pr. 30900 3011 7491 104885 146288 218537 66 326499 107895 210 6171
Jammu & 22251 1281 2661 52241 78434 199962 934 283815 82919 249 6014
Kashmir
Karnataka 19309 916 1082 40108 61416 76496 10 138945 62439 325 40862
Kerala 25189 1875 2865 33475 63404 110410 628 174523 63485 1050 75012
Madhya Pradesh14049 670 918 42366 58004 106412 1390 165535 57733 143 10498
Maharashtra 20996 2092 3130 45389 71607 145101 656 221699 75941 385 32804
Manipur 46984 248 70 54025 101326 146382 115 246961 100464 53 441
Meghalaya 39166 2811 122 62726 104826 319404 476 426715 106836 138 2388
Mizoram 24594 3181 731 66507 95013 74868 0 157502 82635 34 261
Nagaland 27348 3051 179 45350 75929 40296 0 121985 81690 43 197
Orissa 11384 460 976 24949 37769 52053 0 90376 38323 214 17249
Punjab 22585 1820 2036 45133 71573 98410 24 168945 70511 326 17849
Rajasthan 36394 2105 1223 57188 96910 172007 93 269622 97522 234 13951
Sikkim 34670 912 63 30567 66210 25246 84 100681 75351 15 151
Tamilnadu 23053 1721 2012 30548 57334 62214 113 120044 57718 1018 64037
Tripura 13754 487 19 37430 51690 140773 775 197094 55547 272 2143
Uttar Pradesh 17572 1114 777 25516 44979 46517 3 93822 47302 505 98485
West Bengal 22827 825 169 26551 50371 83760 310 135150 51080 723 90903
A & N Islands 58023 6370 4718 79984 149095 450428 2745 615567 162393 62 288
Chandigarh 31554 9092 0 59425 100070 293977 0 397119 103142 22 240
D & N Haveli 22179 2391 600 50802 75972 95499 0 171782 76283 28 215
Daman & Diu 47654 5879 22 72583 126138 41059 0 172961 131901 19 180
Delhi 42207 9045 131 46519 97902 38593 0 136431 97838 31 4155
Lakshadweep - - - - - - - - - - -
Pondicherry 29511 907 2056 25442 57915 363480 0 416307 52827 25 511
Jharkhand 15755 539 511 28440 45245 54940 270 100683 45473 125 12128
Chhatisgarh 10677 135 565 31358 42735 57315 0 99949 42634 45 5277
Uttaranchal 18866 3324 1796 26823 50809 74392 13 138513 64108 70 5781
all India 20991 1424 1392 34165 57971 86098 322 145077 58657 8103 629481
Method I: Product approach, Method II: Factor Income approach.
Annex-IV

256 SARVEKSHANA
Table 16: Annual value added (in Rs.) per enterprise by State / UT
rural: DME
State/UT annual value added (in Rs.) annual value added (in Rs.) number ofper enterprise (method II) per enterprise (method I) enterprises
emolu rent interest net value total distributive total value sample estimatedments surplus addedexpenditure expenses receipt added
(1) (2) (3) (4) (5) (6) (7) (8) (9) (10) (11) (12)
Andhra Pr. 57797 1758 11670 83295 154519 398717 17984 574801 158101 791 24933
Arunachal Pr. 165916 2725 0 80757 249399 972217 0 1106431 134214 4 6
Assam 101464 2910 7962 142230 254566 2561827 2639 3242383 677917 53 1395
Bihar 278771 3736 623 173666 456796 704146 1482 1168521 462892 123 3207
Goa 163703 2902 15417 220323 402345 1042937 13016 1483840 427886 53 427
Gujarat 181899 2990 8070 106904 299863 949772 2888 1247018 294357 189 13460
Haryana 247589 15576 22943 127575 413684 1652260 23642 2129919 454017 73 1310
Himachal Pr. 249640 8945 664887 270493 1193965 7852784 35822 8373787 485181 77 1714
Jammu & 281087 2433 1173 162543 447235 1621405 6450 2141326 513471 85 1121
Kashmir
Karnataka 33866 386 2582 63756 100590 232414 4954 338228 100859 379 32233
Kerala 135349 2152 29373 99365 266239 672556 16316 952233 263362 536 17833
Madhya Pr. 27260 772 1593 83500 113125 378288 2098 495559 115172 89 5805
Maharashtra 105494 1874 31598 104859 243826 740364 12442 1010342 257536 427 17957
Manipur 197409 640 5535 104792 308375 564064 0 883454 319390 19 214
Meghalaya 190096 13058 1711 165258 370122 1257995 1942 1652605 392668 28 382
Mizoram 120000 72000 0 444000 636000 1083600 0 1488000 404400 1 1
Nagaland 145173 8437 601 250647 404858 785642 0 1306946 521304 10 18
Orissa 71232 409 3088 76133 150862 355798 2727 515523 156998 79 4391
Punjab 417817 16196 22785 196313 653111 2359266 108785 3304247 836196 72 2674
Rajasthan 157831 2910 8287 135122 304151 707206 3633 1031396 320558 110 3964
Sikkim 1173229 613260 149171 3126762 5062422 21408349 1147734 5088850328332420 4 4
Tamilnadu 130265 2131 15298 86199 233893 383174 3150 614566 228241 799 28073
Tripura 108524 0 0 75226 183750 145479 872 328447 182096 5 157
Uttar Pradesh 159020 8245 4634 97748 269647 570316 8767 862561 283478 386 46869
West Bengal 124024 1446 10179 161340 296990 557334 4381 855068 293353 485 32510
A & N Islands 164894 4815 13878 131331 314917 905892 18432 1260792 336467 21 102
Chandigarh 179640 37620 0 150000 367260 2052424 25200 2450460 372836 4 42
D & N Haveli 187457 19461 4601 311714 523233 1734453 0 2267217 532763 14 67
Daman & Diu 243132 39114 87486 487898 857630 2944409 0 3827571 883163 29 192
Delhi 164580 21902 7865 157307 351654 400044 0 771562 371518 22 740
Lakshadweep - - - - - - - - - - -
Pondicherry 170250 8357 48663 425033 652303 3287579 90493 4080916 702844 29 452
Jharkhand 183477 6837 9583 169245 369142 463513 18962 849076 366601 61 1994
Chhatisgarh 79662 333 2474 41411 123881 98379 2558 231866 130929 13 1468
Uttaranchal 113424 10190 5888 70545 200047 637025 3036 913943 273882 29 1141
all India 120930 3415 15949 105526 245820 619238 9480 878377 249659 5099 246854
Method I: Product approach, Method II: Factor Income approach.
Annex-IV
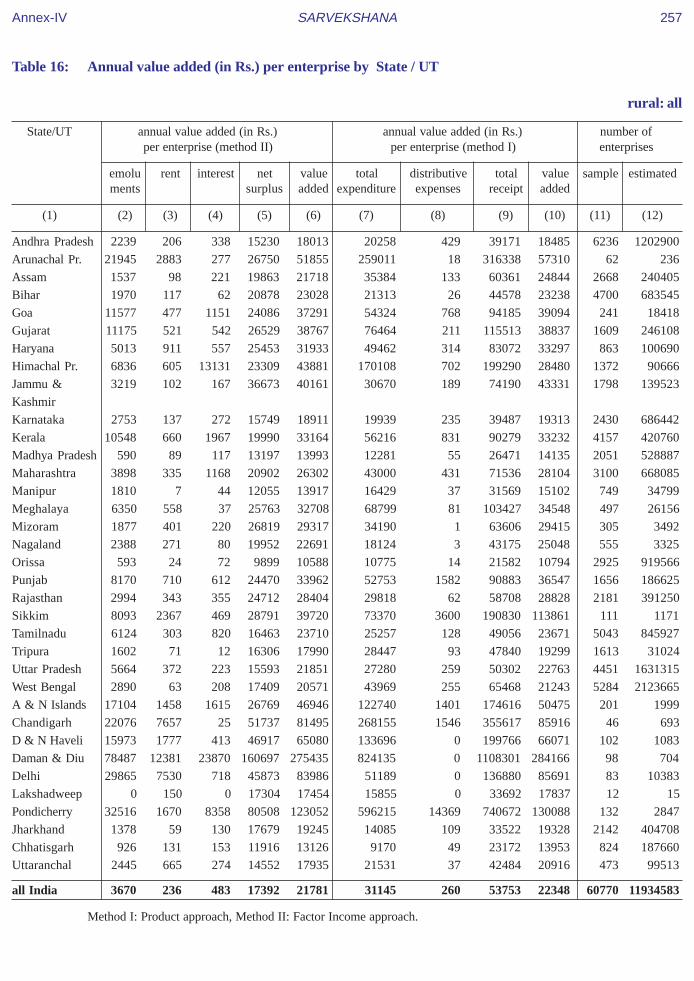
SARVEKSHANA 257
Table 16: Annual value added (in Rs.) per enterprise by State / UT
rural: all
State/UT annual value added (in Rs.) annual value added (in Rs.) number ofper enterprise (method II) per enterprise (method I) enterprises
emolu rent interest net value total distributive total value sample estimatedments surplus addedexpenditure expenses receipt added
(1) (2) (3) (4) (5) (6) (7) (8) (9) (10) (11) (12)
Andhra Pradesh 2239 206 338 15230 18013 20258 429 39171 18485 6236 1202900
Arunachal Pr. 21945 2883 277 26750 51855 259011 18 316338 57310 62 236
Assam 1537 98 221 19863 21718 35384 133 60361 24844 2668 240405
Bihar 1970 117 62 20878 23028 21313 26 44578 23238 4700 683545
Goa 11577 477 1151 24086 37291 54324 768 94185 39094 241 18418
Gujarat 11175 521 542 26529 38767 76464 211 115513 38837 1609 246108
Haryana 5013 911 557 25453 31933 49462 314 83072 33297 863 100690
Himachal Pr. 6836 605 13131 23309 43881 170108 702 199290 28480 1372 90666
Jammu & 3219 102 167 36673 40161 30670 189 74190 43331 1798 139523
Kashmir
Karnataka 2753 137 272 15749 18911 19939 235 39487 19313 2430 686442
Kerala 10548 660 1967 19990 33164 56216 831 90279 33232 4157 420760
Madhya Pradesh 590 89 11713197 13993 12281 55 26471 14135 2051 528887
Maharashtra 3898 335 1168 20902 26302 43000 431 71536 28104 3100 668085
Manipur 1810 7 44 12055 13917 16429 37 31569 15102 749 34799
Meghalaya 6350 558 37 25763 32708 68799 81 103427 34548 497 26156
Mizoram 1877 401 220 26819 29317 34190 1 63606 29415 305 3492
Nagaland 2388 271 80 19952 22691 18124 3 43175 25048 555 3325
Orissa 593 24 72 9899 10588 10775 14 21582 10794 2925 919566
Punjab 8170 710 612 24470 33962 52753 1582 90883 36547 1656 186625
Rajasthan 2994 343 355 24712 28404 29818 62 58708 28828 2181 391250
Sikkim 8093 2367 469 28791 39720 73370 3600 190830 113861 111 1171
Tamilnadu 6124 303 820 16463 23710 25257 128 49056 23671 5043 845927
Tripura 1602 71 12 16306 17990 28447 93 47840 19299 1613 31024
Uttar Pradesh 5664 372 223 15593 21851 27280 259 50302 22763 4451 1631315
West Bengal 2890 63 208 17409 20571 43969 255 65468 21243 5284 2123665
A & N Islands 17104 1458 1615 26769 46946 122740 1401 174616 50475 201 1999
Chandigarh 22076 7657 25 51737 81495 268155 1546 355617 85916 46 693
D & N Haveli 15973 1777 413 46917 65080 133696 0 199766 66071 102 1083
Daman & Diu 78487 12381 23870 160697 275435 824135 0 1108301 284166 98 704
Delhi 29865 7530 718 45873 83986 51189 0 136880 85691 83 10383
Lakshadweep 0 150 0 17304 17454 15855 0 33692 17837 12 15
Pondicherry 32516 1670 8358 80508 123052 596215 14369 740672 130088 132 2847
Jharkhand 1378 59 130 17679 19245 14085 109 33522 19328 2142 404708
Chhatisgarh 926 131 153 11916 13126 9170 49 23172 13953 824 187660
Uttaranchal 2445 665 274 14552 17935 21531 37 42484 20916 473 99513
all India 3670 236 483 17392 21781 31145 260 53753 22348 60770 11934583
Method I: Product approach, Method II: Factor Income approach.
Annex-IV

258 SARVEKSHANA
Table 16: Annual value added (in Rs.) per enterprise by State / UT
urban: OAME
State/UT annual value added (in Rs.) annual value added (in Rs.) number ofper enterprise (method II) per enterprise (method I) enterprises
emolu rent interest net value total distributive total value sample estimatedments surplus addedexpenditure expenses receipt added
(1) (2) (3) (4) (5) (6) (7) (8) (9) (10) (11) (12)
Andhra Pr. 180 1156 227 20968 22531 28049 98 51153 23006 4039 321696
Arunachal Pr. 2436 5876 0 66130 74442 222382 0 325649 103267 17 62
Assam 90 1177 77 28721 30065 35595 13 66284 30676 887 23310
Bihar 246 915 39 25929 27129 39416 13 67233 27804 2714 102704
Goa 359 1006 84 17419 18868 18653 109 38702 19940 145 4003
Gujarat 55 1125 129 33225 34533 27460 11 62613 35142 2634 180665
Haryana 312 2053 384 30255 33003 43509 34 78921 35378 927 57803
Himachal Pr. 180 2262 345 31110 33897 56059 70 93809 37680 634 4718
Jammu & 10 534 19 35697 36260 43434 7 81278 37837 1526 58192
Kashmir
Karnataka 16 859 226 19157 20259 21518 24 42368 20826 2510 281799
Kerala 284 558 263 18156 19261 18672 118 38381 19591 1465 57879
Madhya Pr. 96 622 116 17889 18723 17021 2 36295 19271 3834 172616
Maharashtra 484 1383 434 23535 25836 31433 58 59043 27552 4918 355524
Manipur 34 96 20 15430 15580 21288 28 37186 15870 1338 17169
Meghalaya 0 1566 0 33672 35237 54721 0 92124 37403 78 884
Mizoram 170 1075 14 35228 36487 60831 117 99872 38923 376 1929
Nagaland 161 1651 79 21599 23489 24102 2 49820 25716 410 1696
Orissa 106 438 115 14972 15631 15327 4 31561 16231 1394 51324
Punjab 359 1370 199 30274 32203 28120 42 61814 33653 2227 90627
Rajasthan 208 1062 145 25455 26869 22922 100 50243 27220 3267 190145
Sikkim 0 2276 11 23910 26197 19305 0 46643 27338 43 153
Tamilnadu 423 1120 328 15681 17552 19228 24 37051 17798 4851 485593
Tripura 699 957 106 20200 21963 36803 399 61948 24746 433 2527
Uttar Pradesh 258 596 137 23346 24337 27291 24 52682 25367 7251 488710
West Bengal 247 172 18 15747 16184 19717 257 36945 16970 3326 484836
A & N Islands 34 1763 155 31637 33589 39072 73 73739 34594 57 249
Chandigarh 35 1634 8 11178 12856 23548 0 45262 21714 61 2517
D & N Haveli 0 2053 475 36348 38876 28603 0 67966 39363 44 110
Daman & Diu 0 2000 97 28927 31024 46657 0 78243 31586 39 270
Delhi 849 3435 19 49401 53704 43516 1 97820 54303 321 62621
Lakshadweep 0 706 12 22643 23360 16724 0 40025 23301 28 96
Pondicherry 1153 1354 684 19982 23173 22981 11 45839 22846 128 5853
Jharkhand 56 654 24 23773 24507 40286 28 65748 25433 1165 36763
Chhatisgarh 33 618 66 12373 13090 13730 33 27543 13780 800 47054
Uttaranchal 58 1061 101 20891 22110 31251 37 54473 23184 375 15074
all India 256 918 188 21770 23131 25409 69 49408 23930 54262 3607172
Method I: Product approach, Method II: Factor Income approach.
Annex-IV

SARVEKSHANA 259
Table 16: Annual value added (in Rs.) per enterprise by State / UT
urban: NDME
State/UT annual value added (in Rs.) annual value added (in Rs.) number ofper enterprise (method II) per enterprise (method I) enterprises
emolu rent interest net value total distributive total value sample estimatedments surplus addedexpenditure expenses receipt added
(1) (2) (3) (4) (5) (6) (7) (8) (9) (10) (11) (12)
Andhra Pradesh26388 5945 1188 46017 79538 91918 526 172336 79892 1387 63403
Arunachal Pr. 99315 30093 8351 98548 236307 480599 449 725415 244367 15 104
Assam 25793 3753 633 54794 84973 120703 59 208324 87561 627 13339
Bihar 27740 4013 186 51987 83927 167252 375 253959 86331 675 19575
Goa 38608 5492 2178 55240 101518 175409 531 283301 107362 102 1802
Gujarat 49150 4368 2900 87087 143504 238339 1028 384926 145559 1245 78409
Haryana 35318 5233 1872 57324 99746 241026 863 345230 103341 712 27231
Himachal Pr. 38787 6404 1900 73706 120797 222692 101 355855 133062 472 2302
Jammu & 37570 2795 1100 57952 99417 250080 59 358459 108320 574 8460
Kashmir
Karnataka 32799 6155 2387 52637 93978 81983 261 173688 91444 845 48100
Kerala 41003 3889 4212 74782 123886 184976 1114 314369 128280 1000 23678
Madhya Pradesh29499 4021 1751 45061 80332 198432 373 281694 82890 914 31077
Maharashtra 47756 6606 2929 62749 120040 251192 722 380012 128098 2736 137681
Manipur 48160 5245 1355 46397 101158 150115 848 255597 104634 212 1554
Meghalaya 44835 9423 101 58045 112405 144013 126 259347 115208 129 792
Mizoram 48714 6523 379 112300 167914 197766 222 372978 174990 184 728
Nagaland 38256 8574 541 47360 94731 101113 339 198603 97150 166 652
Orissa 26482 3653 3239 41203 74576 127196 372 202935 75367 358 10068
Punjab 39137 3642 4204 69906 116889 229460 863 362427 132105 1660 46202
Rajasthan 37925 4690 1271 65272 109158 188943 142 300597 111512 1123 32369
Sikkim 45500 13014 226 45298 104039 102393 216 211617 109008 57 219
Tamilnadu 38059 7251 4270 42525 92105 138491 62 231493 92940 2038 142273
Tripura 24077 1419 638 49154 75289 158160 315 273524 115049 312 1797
Uttar Pradesh 28846 3056 636 45675 78212 129051 444 210377 80883 3755 131658
West Bengal 27237 982 364 43978 72561 163894 371 240720 76455 2119 122732
A & N Islands 51929 11566 2228 58643 124365 195306 172 324507 129029 78 383
Chandigarh 38397 12101 394 55708 106600 267274 0 411769 144496 56 1520
D & N Haveli 36443 3286 1079 90468 131276 131922 0 267460 135538 26 57
Daman & Diu 31909 1143 306 62576 95933 340774 0 439893 99120 8 52
Delhi 57991 8758 133 77340 144222 108292 205 253528 145031 502 107459
Lakshadweep 93494 0 1173 112367 207034 322027 0 531945 209918 12 34
Pondicherry 34389 4749 1756 44186 85080 305818 188 391110 85105 77 3547
Jharkhand 27961 3198 363 53027 84549 176595 267 262054 85192 296 7341
Chhatisgarh 35673 3201 953 38269 78096 124320 171 202966 78475 224 8568
Uttaranchal 28720 3314 608 39294 71936 177769 799 258767 80199 195 7022
all India 38012 5048 1942 56640 101642 166839 455 272341 105046 24891 1082189
Method I: Product approach, Method II: Factor Income approach.
Annex-IV

260 SARVEKSHANA
Table 16: Annual value added (in Rs.) per enterprise by State / UT
urban: DME
State/UT annual value added (in Rs.) annual value added (in Rs.) number ofper enterprise (method II) per enterprise (method I) enterprises
emolu rent interest net value total distributive total value sample estimatedments surplus addedexpenditure expenses receipt added
(1) (2) (3) (4) (5) (6) (7) (8) (9) (10) (11) (12)
Andhra Pr. 122772 11392 7951 107172 249286 598880 2105 849270 248285 559 18442
Arunachal Pr. 211118 24765 5735 149528 391145 902431 0 1401781 499350 4 12
Assam 100312 5616 4346 103940 214214 539714 992 772037 231331 128 1394
Bihar 84184 6809 3087 104957 199037 502812 1205 708063 204046 97 2781
Goa 172873 4766 9474 150873 337986 764381 7165 1170954 399408 46 694
Gujarat 223745 5973 16113 136228 382059 1030030 6348 1421456 385077 1198 37125
Haryana 197027 14646 21621 143498 376793 1478307 499 1883971 405165 297 7576
Himachal Pr. 170600 8669 16982 245956 442208 865049 2155 1347573 480368 116 462
Jammu & 126488 2117 13489 145174 287268 2048659 707 2370217 320850 157 1930
Kashmir
Karnataka 162899 8738 16129 126145 313912 1114437 11116 1441488 315934 389 17988
Kerala 160063 8352 24120 122210 314745 920400 16285 1254504 317819 397 6785
Madhya Pr. 129358 6296 15212 154636 305501 1784966 9967 2111993 317060 402 8727
Maharashtra 192166 15507 18608 142953 369233 4054838 6642 4444804 383324 2039 77592
Manipur 112303 8700 4462 82694 208160 259270 2023 475252 213958 68 388
Meghalaya 168693 16160 12146 236815 433815 1170676 386 1610897 439836 33 186
Mizoram 357598 16339 0 562365 936302 884624 0 1851504 966880 26 108
Nagaland 152726 11892 1134 123445 289198 406098 12865 723520 304557 22 58
Orissa 93578 6109 11548 84318 195554 570958 8700 777615 197957 89 2467
Punjab 156023 6181 24913 148100 335217 1242606 3803 1614906 368498 963 17132
Rajasthan 155215 7819 10968 155635 329638 862981 2488 1200852 335384 464 9789
Sikkim 195752 19609 8129 80321 303811 691056 5806 1025261 328399 5 23
Tamilnadu 165147 15637 16438 143506 340728 995526 2972 1339282 340785 1324 54336
Tripura 96876 2780 1259 188366 289281 1132955 1078 1507522 373490 34 159
Uttar Pradesh 124215 5668 7570 99239 236693 636073 4815 888824 247937 1745 38400
West Bengal 122180 5205 7761 109648 244794 894453 5282 1170154 270419 1099 39790
A & N Islands 157765 16007 16520 110432 300724 1294473 418 1612952 318062 36 119
Chandigarh 269418 44407 85794 112686 512305 4511886 741 5329592 816964 78 1251
D & N Haveli 163904 8231 0 147078 319212 323671 0 648840 325169 3 8
Daman & Diu 91333 0 7 205291 296631 1416881 0 1731577 314696 2 12
Delhi 199446 17676 10758 157966 385846 820442 3957 1216684 392285 504 49934
Lakshadweep 610673 0 0 222436 833108 323049 87386 1240602 830167 3 5
Pondicherry 140940 14038 22516 88930 266425 826485 5380 1077529 245664 31 571
Jharkhand 85415 3956 2862 92422 184655 286155 386 474766 188225 34 816
Chhatisgarh 102959 1594 27252 78338 210143 853330 57146 1133968 223492 132 2297
Uttaranchal 150200 5586 4518 90467 250771 656048 1084 911522 254389 47 800
all India 167274 11232 14449 133545 326499 1549101 5516 1892516 337900 12571 400159
Method I: Product approach, Method II: Factor Income approach.
Annex-IV

SARVEKSHANA 261
Table 16: Annual value added (in Rs.) per enterprise by State / UT
urban: all
State/UT annual value added (in Rs.) annual value added (in Rs.) number ofper enterprise (method II) per enterprise (method I) enterprises
emolu rent interest net value total distributive total value sample estimatedments surplus addedexpenditure expenses receipt added
(1) (2) (3) (4) (5) (6) (7) (8) (9) (10) (11) (12)
Andhra Pradesh 9900 2376 731 28843 41851 64172 257 106668 42239 5985 403541
Arunachal Pr. 73211 21289 5262 90742 190503 419501 262 632419 212657 36 178
Assam 12775 2243 428 40620 56066 83912 65 141952 57975 1642 38043
Bihar 6416 1531 129 31765 39842 69728 96 110708 40883 3486 125059
Goa 29387 2651 1667 42157 75863 141752 979 227433 84702 293 6499
Gujarat 41088 2591 2866 60393 106938 208944 1075 318250 108232 5077 296199
Haryana 26698 4018 2559 47478 80753 218966 316 304895 85613 1936 92611
Himachal Pr. 22573 3932 1849 57471 85826 157241 208 251788 94339 1222 7482
Jammu & 8203 858 531 41524 51115 125364 33 179893 54497 2257 68583
Kashmir
Karnataka 12971 1999 1347 29318 45636 86389 631 132868 45849 3744 347886
Kerala 23469 2049 3154 41324 69997 132499 1627 205752 71626 2862 88341
Madhya Pradesh 9708 1353 976 27482 39519 116198 466 157477 40813 5150 212420
Maharashtra 37943 4563 3506 49227 95238 631365 1114 732644 100166 9693 570797
Manipur 6228 690 219 19314 26452 36599 135 63847 27113 1618 19111
Meghalaya 35943 6367 1258 64361 107929 204344 92 315188 110751 240 1862
Mizoram 26860 3104 109 76034 106106 128943 140 239943 110860 586 2765
Nagaland 14181 3775 230 31047 49233 54224 405 106458 51829 598 2407
Orissa 7876 1164 1049 21787 31877 54434 398 87407 32576 1841 63860
Punjab 29318 2587 4151 55278 91335 223684 706 324849 100458 4850 153962
Rajasthan 11995 1852 758 36489 51094 81454 207 133612 51951 4854 232303
Sikkim 36571 9232 601 39034 85438 104324 456 194841 90061 105 395
Tamilnadu 21392 3555 2433 31460 58840 121860 267 181321 59194 8213 682202
Tripura 13484 1207 360 37776 52828 124358 389 198071 73324 779 4483
Uttar Pradesh 13197 1383 670 32233 47483 83115 387 132938 49436 12751 658768
West Bengal 12859 635 560 26871 40924 100817 588 145231 43826 6544 647358
A & N Islands 51454 9018 3800 57876 122148 317230 178 445011 127602 171 751
Chandigarh 74784 14761 20411 47990 157946 1155302 175 1400598 245121 195 5289
D & N Haveli 19765 2752 649 59297 82462 76453 0 160894 84441 73 176
Daman & Diu 8242 1795 126 40516 50679 141753 0 194034 52280 49 334
Delhi 73831 9267 2512 87687 173297 251483 998 427805 175324 1327 220014
Lakshadweep 45402 503 304 52388 98597 104570 3128 206873 99176 43 135
Pondicherry 20983 3288 2316 32541 59129 169618 382 227757 57757 236 9971
Jharkhand 6167 1130 131 29802 37230 67031 74 105263 38158 1495 44921
Chhatisgarh 9387 1039 1275 18820 30521 63387 2318 97372 31667 1156 57919
Uttaranchal 14096 1910 411 28966 45383 98023 307 147081 48751 617 22896
all India 21415 2607 1682 37973 63677 175280 579 241723 65863 91724 5089520
Method I: Product approach, Method II: Factor Income approach.
Annex-IV

262 SARVEKSHANA
Table 16: Annual value added (in Rs.) per enterprise by State / UT
combined: OAME
State/UT annual value added (in Rs.) annual value added (in Rs.) number ofper enterprise (method II) per enterprise (method I) enterprises
emolu rent interest net value total distributive total value sample estimatedments surplus addedexpenditure expenses receipt added
(1) (2) (3) (4) (5) (6) (7) (8) (9) (10) (11) (12)
Andhra Pr. 244 355 102 14782 15482 14304 47 30268 15917 8758 1436680
Arunachal Pr. 702 2336 197 33489 36725 78532 18 126708 48158 47 233
Assam 11 151 53 18756 18971 17626 50 37382 19706 3214 247440
Bihar 60 177 39 20375 20650 18847 9 39765 20908 6954 763009
Goa 347 361 97 14292 15097 13348 319 29371 15704 278 18966
Gujarat 30 621 77 26230 26958 21623 10 49060 27428 3889 402697
Haryana 138 1138 253 24998 26527 29384 18 57294 27893 1577 147492
Himachal Pr 23 362 71 13133 13589 10031 25 24483 14428 1719 87499
Jammu & 5 183 37 35143 35368 19871 73 57583 37639 2990 190580
Kashmir
Karnataka 15 320 137 13982 14454 10204 9 25097 14884 4236 895145
Kerala 393 339 270 13423 14424 11556 48 26269 14665 4036 385793
Madhya Pr. 33 208 92 13337 13670 8932 4 22841 13905 5653 685200
Maharashtra 199 630 272 19488 20589 22458 66 44578 22054 7206 972848
Manipur 11 32 13 12436 12493 14653 34 28042 13356 2015 51313
Meghalaya 0 176 1 20220 20397 24924 10 46839 21906 409 24271
Mizoram 64 498 117 27872 28552 41888 44 72134 30201 646 5158
Nagaland 57 614 74 18648 19392 16519 3 37669 21147 912 4807
Orissa 44 36 44 9593 9718 8675 1 18587 9911 4026 949250
Punjab 144 704 136 23292 24276 16856 30 41721 24834 3485 256729
Rajasthan 138 524 207 23382 24250 19205 49 43786 24532 5104 563479
Sikkim 0 651 1 18333 18986 6454 41 26643 20148 135 1169
Tamilnadu 204 508 238 13849 14799 12879 19 27876 14977 8077 1239410
Tripura 160 114 19 14877 15170 20836 67 37341 16438 1769 31251
Uttar Pradesh 92 203 70 15067 15432 13434 12 29441 15995 10811 1974671
West Bengal 61 39 42 14867 15009 31066 200 47024 15759 7402 2485088
A & N Islands 363 553 265 13432 14613 17741 81 33121 15300 175 1857
Chandigarh 58 1925 13 14804 16801 29799 0 54930 25131 81 2928
D & N Haveli 0 369 69 25299 25736 12540 0 38740 26200 104 912
Daman & Diu 0 1143 43 23580 24767 33168 0 58531 25364 89 602
Delhi 971 3516 34 47866 52387 41113 1 94100 52987 351 68109
Lakshadweep 0 630 10 21921 22561 16606 0 39169 22562 40 111
Pondicherry 939 1091 614 18226 20869 20657 9 41260 20594 206 7737
Jharkhand 6 65 66 17191 17327 13082 10 30583 17491 3121 427350
Chhatisgarh 9 230 111 11370 11720 8423 30 20953 12500 1566 227970
Uttaranchal 53 476 108 14187 14825 13531 6 29771 16234 749 107665
all India 113 299 111 16265 16789 17476 55 34884 17352 101830 14665421
Method I: Product approach, Method II: Factor Income approach.
Annex-IV

SARVEKSHANA 263
Table 16: Annual value added (in Rs.) per enterprise by State / UT
combined: NDME
State/UT annual value added (in Rs.) annual value added (in Rs.) number ofper enterprise (method II) per enterprise (method I) enterprises
emolu rent interest net value total distributive total value sample estimatedments surplus addedexpenditure expenses receipt added
(1) (2) (3) (4) (5) (6) (7) (8) (9) (10) (11) (12)
Andhra Pradesh20831 3511 925 36953 62221 69063 509 132009 62438 2113 126385
Arunachal Pr. 88882 22158 5444 75921 192404 617843 286 822457 204327 43 163
Assam 20250 2109 1388 47347 71094 106727 605 179408 72075 915 28220
Bihar 24627 2675 468 46670 74440 132597 373 208521 75550 1012 39608
Goa 43026 3025 3528 51312 100891 143522 817 250534 106195 157 4830
Gujarat 46656 4310 2745 82654 136365 235619 1030 374961 138312 1410 89025
Haryana 30873 4458 1675 54672 91678 204783 636 300296 94876 852 36923
Himachal Pr. 33043 3933 5972 96413 139361 219666 76 334476 114733 682 8473
Jammu & 31204 2166 1749 55579 90698 229255 423 327442 97765 823 14474
Kashmir
Karnataka 26603 3749 1788 46882 79022 79462 146 157730 78122 1170 88961
Kerala 28983 2358 3188 43385 77915 128300 744 208075 79031 2050 98689
Madhya Pradesh25598 3175 1540 44381 74694 175196 630 252363 76538 1057 41575
Maharashtra 42607 5737 2968 59409 110721 230778 709 349550 118062 3121 170485
Manipur 47900 4140 1071 48083 101195 149290 686 253688 103712 265 1995
Meghalaya 40578 4458 117 61561 106713 275723 388 385032 108921 267 3179
Mizoram 42342 5640 472 100203 148656 165300 163 316056 150593 218 989
Nagaland 35724 7292 457 46894 90367 86996 261 180818 93562 209 850
Orissa 16949 1637 1810 30940 51335 79748 137 131862 51976 572 27317
Punjab 34524 3134 3600 63003 104261 192940 629 308509 114940 1986 64052
Rajasthan 37464 3911 1256 62837 105469 183842 127 291268 107298 1357 46320
Sikkim 41080 8075 159 39285 88599 70906 162 166338 95271 72 369
Tamilnadu 33401 5535 3569 38807 81312 114815 78 196900 82007 3056 206310
Tripura 18463 912 302 42778 62455 148704 565 231959 82690 584 3940
Uttar Pradesh 24022 2225 696 37048 63991 93732 256 160500 66512 4260 230144
West Bengal 25361 915 281 36563 63119 129796 345 195799 65658 2842 213635
A & N Islands 54544 9336 3296 67801 134977 304782 1276 449403 143346 140 672
Chandigarh 37463 11690 340 56215 105709 270916 0 409771 138855 78 1760
D & N Haveli 25185 2580 701 59161 87627 103175 0 191945 88770 54 272
Daman & Diu 44142 4823 85 70351 119401 107911 0 232501 124589 27 231
Delhi 57403 8769 133 76193 142498 105698 197 249170 143275 533 111614
Lakshadweep 93494 0 1173 112367 207034 322027 0 531945 209918 12 34
Pondicherry 33774 4265 1794 41823 81656 313085 164 394286 81037 102 4058
Jharkhand 20358 1542 455 37711 60066 100815 269 161534 60450 421 19469
Chhatisgarh 26146 2033 805 35635 64619 98781 106 163702 64814 269 13845
Uttaranchal 24270 3319 1144 33663 62396 131087 444 204465 72933 265 12803
all India 31753 3715 1740 48374 85582 137146 406 225538 87986 32994 1711670
Method I: Product approach, Method II: Factor Income approach.
Annex-IV

264 SARVEKSHANA
Table 16: Annual value added (in Rs.) per enterprise by State / UT
combined: DME
State/UT annual value added (in Rs.) annual value added (in Rs.) number ofper enterprise (method II) per enterprise (method I) enterprises
emolu rent interest net value total distributive total value sample estimatedments surplus addedexpenditure expenses receipt added
(1) (2) (3) (4) (5) (6) (7) (8) (9) (10) (11) (12)
Andhra Pr. 85423 5854 10088 93447 194812 483822 11232 691500 196445 1350 43375
Arunachal Pr. 196225 17503 3845 126869 344441 925425 0 1304467 379042 8 18
Assam 100888 4263 6154 123088 234394 1550948 1816 2007427 454663 181 2789
Bihar 188402 5163 1767 141756 337089 610644 1354 954678 342680 220 5987
Goa 169382 4056 11736 177311 362486 870421 9393 1290062 410249 99 1121
Gujarat 212610 5179 13973 128425 360187 1008674 5428 1375040 360938 1387 50585
Haryana 204479 14783 21816 141151 382230 1503943 3910 1920218 412365 370 8886
Himachal Pr. 232873 8887 527442 265288 1034489 6370425 28680 6883265 484160 193 2176
Jammu & 183275 2233 8965 151554 346027 1891720 2817 2286140 391604 242 3051
Kashmir
Karnataka 80082 3377 7434 86103 176997 548332 7161 733386 177894 768 50221
Kerala 142160 3861 27925 105661 279607 740861 16307 1035538 278370 933 24618
Madhya Pr. 88574 4090 9772 126220 228655 1223056 6824 1466293 236414 491 14532
Maharashtra 175877 12945 21049 135794 345665 3431932 7732 3799348 359684 2466 95548
Manipur 142551 5836 4843 90548 243778 367600 1304 620335 251431 87 603
Meghalaya 183077 14075 5133 188724 391009 1229361 1432 1638928 408135 61 568
Mizoram 355409 16852 0 561274 933536 886457 0 1848155 961698 27 109
Nagaland 150977 11092 1011 152909 315989 494012 9885 858660 354762 32 76
Orissa 79272 2460 6132 79078 166942 433212 4876 609822 171735 168 6858
Punjab 191371 7533 24625 154610 378139 1393378 17977 1843002 431647 1035 19807
Rajasthan 155969 6404 10195 149722 322291 818078 2818 1152006 331110 574 13753
Sikkim 329178 100643 27381 496163 953365 3518982 161680 7831631 4150969 9 27
Tamilnadu 153264 11036 16050 123984 304334 786925 3033 1092404 302446 2123 82409
Tripura 102655 1401 634 132235 236925 643048 976 922559 278535 39 316
Uttar Pradesh 143346 7084 5956 98420 254807 599929 6987 874389 267472 2131 85269
West Bengal 123009 3515 8848 132892 268264 742865 4877 1028474 280732 1584 72300
A & N Islands 161057 10838 15300 120084 307279 1115018 8737 1450317 326562 57 221
Chandigarh 266468 44184 82975 113912 507539 4431078 1544 5234995 802372 82 1294
D & N Haveli 184801 18195 4082 293149 500227 1575371 0 2084725 509355 17 75
Daman & Diu 234150 36799 82310 471176 824436 2854026 0 3703553 849527 31 204
Delhi 198937 17738 10716 157957 385347 814305 3899 1210185 391982 526 50673
Lakshadweep 610673 0 0 222436 833108 323049 87386 1240602 830167 3 5
Pondicherry 153889 11528 34067 237415 436900 1913756 42981 2404375 447639 60 1023
Jharkhand 154995 6000 7631 146932 315557 411998 13567 740356 314791 95 2810
Chhatisgarh 93877 1102 17592 63942 176513 559009 35865 782280 187406 145 3765
Uttaranchal 128586 8292 5323 78758 220959 644868 2231 912945 265846 76 1941
all India 149592 8249 15021 122855 295718 1194331 7028 1505592 304233 17670 647013
Method I: Product approach, Method II: Factor Income approach.
Annex-IV

SARVEKSHANA 265
Table 16: Annual value added (in Rs.) per enterprise by State / UT
combined: all
State/UT annual value added (in Rs.) annual value added (in Rs.) number ofper enterprise (method II) per enterprise (method I) enterprises
emolu rent interest net value total distributive total value sample estimatedments surplus addedexpenditure expenses receipt added
(1) (2) (3) (4) (5) (6) (7) (8) (9) (10) (11) (12)
Andhra Pradesh 4163 751 436 18650 24001 31289 385 56126 24452 12221 1606441
Arunachal Pr. 44017 10808 2423 54301 111550 328109 123 452426 124194 98 414
Assam 3072 391 249 22699 26411 42014 124 71508 29370 4310 278449
Bihar 2658 336 73 22562 25628 28801 37 54805 25967 8186 808604
Goa16223 1044 1285 28800 47352 77128 823 128941 50990 534 24917
Gujarat 27513 1652 1811 45025 76001 148822 683 226244 76740 6686 542307
Haryana 15402 2399 1516 36005 55323 130672 315 189348 58362 2799 193301
Himachal Pr. 8035 859 12271 25913 47078 169127 664 203292 33501 2594 98148
Jammu & 4862 351 287 38271 43771 61877 137 109025 47011 4055 208105
Kashmir
Karnataka 6190 763 633 20313 27899 42289 368 70895 28238 6174 1034328
Kerala 12790 901 2173 23692 39555 69453 969 110317 39894 7019 509101
Madhya Pradesh 3203 451 363 17291 21307 42058 173 64011 21780 7201 741307
Maharashtra 19584 2283 2245 33952 58063 314080 746 376132 61306 12793 1238882
Manipur 3377 249 106 14628 18360 23579 72 43011 19360 2367 53911
Meghalaya 8317 944 118 28328 37707 77808 81 117502 39612 737 28018
Mizoram 12916 1595 171 48566 63248 76060 62 141526 65404 891 6256
Nagaland 7340 1742 143 24610 33835 33281 172 69745 36293 1153 5732
Orissa 1066 98 136 10671 11970 13610 39 25857 12208 4766 983425
Punjab 17730 1558 2212 38397 59897 130022 1186 196646 65438 6506 340587
Rajasthan 6348 905 505 29099 36857 49055 116 86613 37442 7035 623553
Sikkim 15272 4097 503 31373 51245 81173 2808 191841 107861 216 1565
Tamilnadu 12940 1755 1540 23158 39393 68384 190 108103 39529 13256 1528129
Tripura 3102 214 56 19017 22389 40557 130 66808 26120 2392 35507
Uttar Pradesh 7831 663 352 20379 29225 43341 296 74073 30435 17202 2290083
West Bengal 5219 197 290 19619 25326 57249 333 84102 26519 11828 2771023
A & N Islands 26486 3523 2212 35266 67488 175864 1067 248473 71542 372 2750
Chandigarh 68679 13938 18050 48424 149091 1052549 334 1279565 226682 241 5982
D & N Haveli 16504 1913 446 48649 67512 125688 0 194328 68641 175 1259
Daman & Diu 55902 8978 16236 122057 203173 604740 0 814352 209612 147 1038
Delhi 71850 9189 2431 85802 169272 242456 953 414694 171285 1410 230397
Lakshadweep 40852 467 273 48872 90464 95678 2814 189516 91023 55 150
Pondicherry 23545 2929 3658 43196 73328 264378 3489 341690 73824 368 12818
Jharkhand 1856 166 130 18890 21042 19375 106 40689 21209 3637 449629
Chhatisgarh 2922 345 418 13544 17228 21957 584 40672 18131 1980 245579
Uttaranchal 4624 898 299 17248 23069 35839 87 62048 26122 1090 122409
all India 8975 945 842 23545 34306 74236 355 109948 35357 152494 17024104
Method I: Product approach, Method II: Factor Income approach.
Annex-IV

JÉhb III - ÉÊcxnÉÒ
ºÉ´ÉæFÉhÉ
®É]ÅÉÒªÉ |ÉÉÊiÉn¶ÉÇ ºÉ´ÉæFÉhÉ ºÉÆMÉ~xÉBÉEÉÒ {ÉÉÊjÉBÉEÉ
£ÉÉMÉ -XXVI ºÉÆ.2+ÉÆBÉE ºÉÆJªÉÉ 89(VÉÖãÉÉ<Ç, 2006)
®É]ÅÉÒªÉ |ÉÉÊiÉn¶ÉÇ ºÉ´ÉæFÉhÉ ºÉÆMÉ~xɺÉÉÆÉÎJªÉBÉEÉÒ +ÉÉè® BÉEɪÉǵÉEàÉ BÉEɪÉÉÇx´ÉªÉxÉ àÉÆjÉÉãɪÉ
£ÉÉ®iÉ ºÉ®BÉEÉ®xÉ<Ç ÉÊnããÉÉÒ

ºÉà{ÉÉnBÉEÉÒªÉ ºÉãÉÉcBÉEÉ® ¤ÉÉäbÇ
1. |ÉÉä.bÉÒ.BÉÖEÆnÚ
2. |ÉÉä.]ÉÒ.VÉä.®É´É
3. |ÉÉä.®ÉÊ É gÉÉÒ ÉɺiÉ´É
4. bÉ.àÉxÉÉäVÉ {ÉÉÆbÉ
5. bÉ.BÉEä.´ÉÉÒ.®É´É
6. gÉÉÒ ´ÉÉÒ.BÉEä.àÉãcÉäjÉÉ
7. gÉÉÒ BÉEä.AºÉ. |ɺÉÉnɮɴÉ
ºÉà{ÉÉnBÉEÉÒªÉ ºÉÉÊSÉ´ÉÉãɪÉ
ºÉàÉx´ÉªÉ A´ÉÆ |ÉBÉEɶÉxÉ |É£ÉÉMÉ,®É]ÅÉÒªÉ |ÉÉÊiÉn¶ÉÇ ºÉ´ÉæFÉhÉ ºÉÆMÉ~xÉ
ºÉ®nÉ® {É]äãÉ £É´ÉxɺÉƺÉn àÉÉMÉÇ
xÉ<Ç ÉÊnããÉÉÒ-110001
gÉÉÒ ®ÉàÉ BÉßE{ÉÉãÉ, ÉÊxÉnä¶ÉBÉEgÉÉÒ £ÉÚ{Éäxp BÉÖEàÉÉ®, ´ÉÉÊ®~ ºÉÉÆÉÎJªÉBÉEÉÒªÉ +ÉÉÊvÉBÉEÉ®ÉÒ
gÉÉÒ AºÉ.A.¤ÉäMÉ, BÉEÉÊxÉ~ +Éx´ÉäÉBÉE
àÉÚãªÉ& +ÉÆiÉnæ¶ÉÉÒªÉ 200/- °ô.
ºÉ´ÉæFÉhÉ£ÉÉMÉ XXVI ºÉÆ. 2
ÉÊ ÉÉªÉ - ºÉÚSÉÉÒ
+ɺÉÆMÉÉÊ~iÉ ÉÊ ÉÉÊxÉàÉÉÇhÉBÉEÉ®ÉÒ FÉäjÉ ÉÊcxnÉÒ 1 - 15®É.|É.ºÉ´Éæ.U{{ÉxÉ´ÉÉ nÉè® (VÉÖãÉÉ<Ç 2000-VÉÚxÉ 2001)ºÉƤÉÆvÉÉÒ ºÉ´ÉæFÉhÉ {ÉÉÊ®hÉÉàÉÉå BÉEÉ ABÉEÉÒBÉßEiÉ ºÉÉ®

losZ{k.k fg- & 1
+ɺÉÆMÉÉÊ~iÉ ÉÊ ÉÉÊxÉàÉÉÇhÉBÉEÉ®ÉÒ FÉäjÉ {É® ®É]ÅÉÒªÉ |ÉÉÊiÉn¶ÉǺɴÉæFÉhÉ 56 ´Éå nÉè® ºÉ´ÉæFÉhÉ BÉEä {ÉÉÊ®hÉÉàÉÉå {É® ABÉE ABÉEÉÒBÉßEiÉ ºÉÉ®
(VÉÖãÉÉ<Ç 2000-VÉÚxÉ 2001)
A.VÉä.®ÉªÉ +ÉÉè® AàÉ àÉÉÎããÉBÉE
|ɺiÉÉ´ÉxÉÉ
1.1 £ÉÚÉÊàÉBÉEÉ& 1950 BÉEä n¶ÉBÉE àÉå £ÉÉ®iÉÉÒªÉ ªÉÉäVÉxÉÉBÉEÉ®Éå A´ÉÆxÉÉÒÉÊiÉ-ÉÊxÉàÉÉÇiÉÉ+ÉÉäÆ uÉ®É +ɺÉÆMÉÉÊ~iÉ FÉäjÉ BÉEä àÉci´É iÉlÉÉ <ºÉBÉEäºÉƤÉÆÉÊvÉiÉ ºÉÉÆÉÎJªÉBÉEÉÒªÉ ºÉÚSÉxÉÉ BÉEÉÒ +ÉɴɶªÉBÉEiÉÉ àÉcºÉÚºÉ BÉEÉÒ MÉ<Ç cè*1950 àÉå <ºÉBÉEä |ÉɮƣÉhÉ ºÉä cÉÒ ®É]ÅÉÒªÉ |ÉÉÊiÉn¶ÉÇ ºÉ´ÉæFÉhÉ ºÉÆMÉ~xÉ(®É.|É.ºÉ´Éæ.ºÉÆ.) {ÉÉÊ®´ÉÉ®-+ÉÉvÉÉÉÊ®iÉ MÉè®-BÉßEÉÉÒªÉ MÉÉÊiÉÉÊ ÉÉÊvɪÉÉå {É® +ÉÉ´ÉÉÊvÉBÉEºÉ´ÉæFÉhÉ +ÉɪÉÉäÉÊVÉiÉ BÉE®iÉÉ ®cÉ cè * {É®xiÉÖ, ¤ÉÉn àÉå, ºÉcBÉEÉ®ÉÒ-ºÉÉÊàÉÉÊiɪÉÉå, xªÉɺÉÉå, ÉÊxÉMÉÉÊàÉiÉ <BÉEÉ<ǪÉÉå VÉèºÉÉÒ {ÉÉÊ®´ÉÉ® <BÉEÉ<ǪÉÉå BÉEÉä¶ÉÉÉÊàÉãÉ ÉÊBÉEªÉÉ MɪÉÉ lÉÉ *
1.1.1 1998 BÉEä nÉè®ÉxÉ, BÉEäxpÉÒªÉ ºÉÉÆÉÎJªÉBÉEÉÒªÉ ºÉÆMÉ~xÉ (ºÉÉÒ AºÉ+ÉÉä) uÉ®É SÉÉèlÉÉ +ÉÉÉÌlÉBÉE ºÉ´ÉæFÉhÉ ÉÊBÉEªÉÉ MɪÉÉ * +ɺÉÆMÉÉÊ~iÉÉÊ ÉÉÊxÉàÉÉÇhÉBÉEÉ®ÉÒ {É® ºÉ´ÉæFÉhÉ 56 ´Éå nÉè® (VÉÖãÉÉ<Ç 2000 ºÉä VÉÚxÉ2001 iÉBÉE) BÉEä âó{É àÉå, <ºÉ +ÉÉÉÌlÉBÉE MÉhÉxÉÉ BÉEÉ +ÉxÉÖ ÉiÉÉÔ ºÉ´ÉæFÉhÉBÉE®ÉªÉÉ MɪÉÉ * <ºÉ ºÉ´ÉæFÉhÉ àÉå, ºiÉ®ÉÒBÉßEiÉ BÉEä ÉÊãÉA iÉlÉÉ MÉÉÆ ÉÉå BÉEÉÒºÉÚSÉÉÒ BÉEä ÉÊãÉA 1998 BÉEÉÒ +ÉÉÉÌlÉBÉE MÉhÉxÉÉ ºÉä ºÉÚSÉxÉÉ ={ɪÉÉäMÉ BÉEÉÒMÉ<Ç iÉlÉÉ OÉÉàÉÉÒhÉ A´ÉÆ ¶Éc®ÉÒ FÉäjÉÉå àÉå |ÉlÉàÉ SÉ®hÉ <ÇBÉEÉ<ªÉÉå {É®SÉÖxÉÉ´É BÉEä ÉÊãÉA fÉÆSÉä BÉEä âó{É àÉå ¶Éc®ÉÒ fÉÆSÉÉ ºÉ´ÉæFÉhÉ (ªÉÚ A{ÉE AºÉ)BÉEÉ ={ɪÉÉäMÉ ÉÊBÉEªÉÉ MɪÉÉ *
1.1.2 +ÉÉÉÌlÉBÉE MÉhÉxÉÉ BÉEä ÉÊ ÉºiÉÉ® A´ÉÆ BÉE´É®äVÉ àÉå º´É-ãÉäJÉÉ=tÉàÉÉå +ÉlÉÉÇiÉ AäºÉä =tÉàÉ ÉÊVÉxcÉåxÉä {ÉÚhÉÇiÉ& ÉÊxɪÉÉÊàÉiÉ +ÉÉvÉÉ® {É®BÉEÉä<Ç £Éɽä BÉEÉ BÉEàÉÇSÉÉ®ÉÒ (ãÉäJÉÉå BÉEä ®JÉ-®JÉÉ´É BÉEä ÉÊãÉA) xÉÉÊxɪÉÉäÉÊVÉiÉ ÉÊBÉEªÉÉ cÉä iÉlÉÉ ´Éä ºlÉÉ{ÉxÉÉAÆ +ÉlÉÉÇiÉ =xÉ =tÉàÉÉå BÉEÉäÉÊVÉxcÉåxÉä BÉEàÉ ºÉä BÉEàÉ {ÉÚhÉÇiÉ& ÉÊxɪÉÉÊàÉiÉ +ÉÉvÉÉ® {É® BÉEàÉ ºÉä BÉEàÉABÉE £Éɽä BÉEÉ BÉEàÉÇSÉÉ®ÉÒ (ãÉäJÉÉå BÉEä ÉÊãÉA) ÉÊxɪÉÉäÉÊVÉiÉ BÉE® ®JÉÉ cÉä,nÉäxÉÉå |ÉBÉEÉ® BÉEä =tÉàÉÉå BÉEÉä ¶ÉÉÉÊàÉãÉ ÉÊBÉEªÉÉ VÉÉxÉÉ lÉÉ * <xɺlÉÉ{ÉxÉÉ+ÉÉäÆ BÉEÉä {ÉÖxÉ& nÉä ´ÉMÉÉç ªÉlÉÉ (i) ÉÊxÉnäÉʶÉBÉEÉ ºlÉÉ{ÉxÉÉ (bÉÒ <Ç)iÉlÉÉ (ii ) MÉè®-ÉÊxÉnäÉʶÉBÉEÉ ºlÉÉ{ÉxÉÉ (AxÉ bÉÒ <Ç) àÉå ÉÊ É£ÉBÉDiÉ ÉÊBÉEªÉÉMɪÉÉ lÉÉ * <xÉàÉå +ÉxiÉ® ªÉcÉÒ lÉÉ ÉÊBÉE {ÉÚ ÉÇ ´ÉÉãÉÉÒ ºlÉÉ{ÉxÉÉ àÉå 6+ÉlÉ´ÉÉ +ÉÉÊvÉBÉE BÉEÉàÉMÉ® ÉÊxɪÉÉäÉÊVÉiÉ lÉä iÉlÉÉ ¤ÉÉn ´ÉÉãÉÉÒ àÉå 5 +ÉlÉ´ÉÉ=ºÉºÉä BÉEàÉ BÉEÉàÉMÉ® ÉÊxɪÉÉäÉÊVÉiÉ lÉä * <ºÉ |ÉBÉEÉ® SÉÉèlÉÉÒ +ÉÉÉÌlÉBÉEMÉhÉxÉÉ àÉå iÉÉÒxÉ |ÉBÉEÉ® BÉEä =tÉàÉ +ÉlÉÉÇiÉ (i) +ÉÉä A <Ç AºÉ (ii ) AxÉ
A bÉÒ AºÉ iÉlÉÉ (iii ) bÉÒ <Ç AºÉ MÉÉÊ~iÉ ÉÊBÉEA MÉA * 56´Éå nÉè® àÉåBÉEä ÉãÉ ÉÊ ÉÉÊxÉàÉÉÇhÉBÉEÉ®ÉÒ iÉlÉÉ àÉ®ààÉiÉ MÉÉÊiÉÉÊ ÉÉÊvɪÉÉå àÉå ãÉMÉä =tÉàÉÉåBÉEÉä cÉÒ ¶ÉÉÉÊàÉãÉ ÉÊBÉEªÉÉ MɪÉÉ lÉÉ * AäºÉä =tÉàÉÉå BÉEÉä µÉEàɶÉ& º´É-ãÉäJÉÉ ÉÊ ÉÉÊxÉàÉÉÇhÉBÉEÉ®ÉÒ =tÉàÉ (+ÉÉä A AàÉ <Ç), ÉÊxÉnäÉʶÉBÉEÉ ÉÊ ÉÉÊxÉàÉÉÇhÉBÉEÉ®ÉÒºlÉÉ{ÉxÉÉ (bÉÒ AàÉ <Ç) iÉlÉÉ MÉè®-ÉÊxÉnäÉʶÉBÉEÉ ÉÊ ÉÉÊxÉàÉÉÇhÉBÉEÉ®ÉÒ ºlÉÉ{ÉxÉÉxÉÉàÉ ÉÊnªÉÉ MɪÉÉ *
1.2 ºÉ´ÉæFÉhÉ, ºÉÆFÉä{É àÉå : AxÉ AºÉ AºÉ +ÉÉä xÉä VÉÖãÉÉ<Ç 2000ºÉä VÉÚxÉ 2001 BÉEä nÉè®ÉxÉ, +É{ÉxÉä 56 ´Éå nÉè® àÉå =tÉàÉÉå iÉlÉÉ{ÉÉÊ®´ÉÉ®Éå BÉEÉ ABÉE ºÉàÉäÉÊBÉEiÉ ºÉ´ÉæFÉhÉ +ÉɪÉÉäÉÊVÉiÉ ÉÊBÉEªÉÉ MɪÉÉ * <ºÉºÉ´ÉæFÉhÉ àÉå +ɺÉÆMÉÉÊ~iÉ FÉäjÉ àÉå ÉÊ ÉÉÊxÉàÉÉÇhÉBÉEÉ®ÉÒ =tÉàÉÉå {É® àÉÖJªÉiÉ&vªÉÉxÉ ÉÊnªÉÉ MɪÉÉ * ºÉ´ÉæFÉhÉ ÉÊBÉEA MÉA =tÉàÉÉå ºÉä, =tÉàÉÉå BÉEÉÒÉÊ ÉÉÊ£ÉxxÉ ÉÊ ÉÉʶÉ]iÉÉ+ÉÉäÆ, ÉκlÉ® {ÉÉÊ®ºÉà{ÉÉÊiɪÉÉå, ®ÉäVÉMÉÉ®, |ÉSÉÉãÉxÉJÉSÉÉç iÉlÉÉ |ÉÉÉÎ{iɪÉÉå àÉÚãªÉ´ÉÉÊriÉ +ÉÉÉÊn {É® ºÉÚSÉxÉÉ ABÉEjÉ BÉEÉÒ MÉ<ÇlÉÉÒ *
1.2.1 +ɺÉÆMÉÉÊ~iÉ ÉÊ ÉÉÊxÉàÉÉÇhÉBÉEÉ®ÉÒ FÉäjÉ& 56´Éå nÉè® àÉå ÉÊu-+ÉÆBÉEÉÒªÉBÉEÉäb弃 15 ºÉä 37 (AxÉ +ÉÉ<Ç ºÉÉÒ 1998 BÉEÉ) ºÉÉ®hÉÉÒªÉhÉ ´ÉMÉÇÞPÉ Þ BÉEä iÉciÉ ºÉ£ÉÉÒ +ɺÉÆMÉÉÊ~iÉ ÉÊ ÉÉÊxÉàÉÉÇhÉBÉEÉ®ÉÒ =tÉàÉÉå iÉlÉÉ ºÉÚiÉ,+ÉÉè]É<Ç ºÉ{ÉEÉ<Ç +ÉÉè® MÉ]Â~É (AxÉ +ÉÉ<Ç ºÉÉÒ 1998 BÉEÉ BÉEÉäb01405) BÉEÉä ¶ÉÉÉÊàÉãÉ ÉÊBÉEªÉÉ MɪÉÉ lÉÉ * AxÉ +ÉÉ<Ç ºÉÉÒ 1998 BÉE䤪ÉÉè®ä xÉÉÒSÉä iÉÉÉÊãÉBÉEÉ Þ BÉE Þ àÉå ÉÊnA MÉA cé *
(BÉE) BÉEÉ®JÉÉxÉÉ +ÉÉÊvÉÉÊxɪÉàÉ 1948 BÉEä JÉÆb 2 AàÉ (i) iÉlÉÉ 2AàÉ (ii ) BÉEä iÉciÉ {ÉÆVÉÉÒBÉßEiÉ BÉEÉä UÉä½BÉE® ºÉ£ÉÉÒ +ɺÉÆMÉÉÊ~iÉ=tÉàÉ *
(JÉ) ºÉÚiÉ +ÉÉè]É<Ç, ºÉ{ÉEÉ<Ç +ÉÉè® MÉ]Â~É àÉå ãÉMÉä ´Éä ºÉ£ÉÉÒ =tÉàÉÉÊVÉxcå ´ÉÉÉÌÉBÉE =tÉÉäMÉ ºÉ´ÉæFÉhÉ àÉå ¶ÉÉÉÊàÉãÉ xÉcÉÓ ÉÊBÉEªÉÉMɪÉÉ lÉÉ *
(MÉ) ¤ÉÉÒ½ÉÒ, ÉʺÉMÉÉ® ÉÊ ÉÉÊxÉàÉÉÇhÉBÉEÉ®ÉÒ Éä ºÉ£ÉÉÒ =tÉàÉ ÉÊVÉxcå ÉÉÉÌÉBÉE=tÉÉäMÉ ºÉ´ÉæFÉhÉ àÉå ¶ÉÉÉÊàÉãÉ xÉcÉÓ ÉÊBÉEªÉÉ MɪÉÉ cÉä, ÉʤÉxÉÉ<ºÉ ¤ÉÉiÉ BÉEÉ ÉÊ ÉSÉÉ® ÉÊBÉEA ÉÊBÉE ´Éä ¤ÉÉÒ½ÉÒ A´ÉÆ ÉʺÉMÉÉ®BÉEÉàÉMÉ® (®ÉäVÉMÉÉ® ÉκlÉÉÊiÉ) +ÉÉÊvÉÉÊxɪÉàÉ 1966 BÉEä +ÉÆiÉMÉÇiÉ{ÉÆVÉÉÒBÉßEiÉ cé +ÉlÉ´ÉÉ xÉcÉÓ *

fg- & 2 losZ{k.k
BÉEÉ®JÉÉxÉÉ +ÉÉÊvÉÉÊxɪÉàÉ 1948 BÉEä 2 AàÉ (i) iÉlÉÉ 2 AàÉ(ii ) JÉÆbÉå BÉEä iÉciÉ {ÉÆVÉÉÒBÉßEiÉ =tÉàÉÉå BÉEÉä BÉEäxpÉÒªÉ ºÉÉÆÉÎJªÉBÉEÉҪɺÉÆMÉ~xÉ uÉ®É ÉÊBÉEA MÉA ÉÉÉÌÉBÉE =tÉÉäMÉ ºÉ´ÉæFÉhÉ àÉå ¶ÉÉÉÊàÉãÉÉÊBÉEªÉÉ MɪÉÉ cè*
1.2.2 BÉE´É®äVÉ iÉlÉÉ |ÉÉÊiÉn¶ÉÇ +ÉÉBÉEÉ®& ºÉ´ÉæFÉhÉ àÉå (i) VÉààÉÚ´É BÉE¶àÉÉÒ® BÉEä ãÉäc É BÉEÉ®ÉÊMÉãÉ ÉÊVÉãÉÉå (ii ) xÉÉMÉÉãÉéb ®ÉVªÉ àÉå ¤ÉºÉâó] BÉEä 5 ÉÊBÉE.àÉÉÒ.ºÉä {É®ä ÉκlÉiÉ MÉÉÆ ÉÉå (iii ) +ÉÆbàÉÉxÉ ´É ÉÊxÉBÉEÉä¤ÉÉ®uÉÒ{ÉÉå BÉEä +ÉMÉàªÉ MÉÉÆ ÉÉå (iv) BÉEÉÊiÉ{ÉªÉ |ÉlÉàÉ SÉ®hÉ <BÉEÉ<ǪÉÉå (BÉÖEãÉBÉEÉ 0.1 |ÉÉÊiɶÉiÉ ºÉä £ÉÉÒ BÉEàÉ), VÉcÉÆ +ÉÉÉÌlÉBÉE ºÉ´ÉæFÉhÉ 1998 (<ǺÉÉÒ 98) +ÉɪÉÉäÉÊVÉiÉ xÉcÉÓ BÉE®ÉªÉÉ VÉÉ ºÉBÉEÉ, BÉEä +ÉãÉÉ´ÉÉ ºÉàɺiÉ£ÉÉ®iÉÉÒªÉ ºÉÆPÉ BÉEÉä ¶ÉÉÉÊàÉãÉ ÉÊBÉEªÉÉ MɪÉÉ lÉÉ * +ÉiÉ&, <ºÉ ÉÊ®{ÉÉä]Ç àÉå|ɺiÉÖiÉ ÉÊBÉEA MÉA iÉnxÉÖâó{ÉÉÒ ®ÉVªÉ/ºÉÆPÉ ¶ÉɺÉxÉ ºiÉ®ÉÒªÉ +ÉxÉÖàÉÉxÉÉåiÉlÉÉ +ÉÉÊJÉãÉ-£ÉÉ®iÉ {ÉÉÊ®hÉÉàÉ ºÉ´ÉæFÉhÉ BÉE¤É®äVÉ BÉEä iÉciÉ FÉäjÉÉå {É®+ÉÉvÉÉÉÊ®iÉ cé * <ºÉ ºÉ´ÉæFÉhÉ BÉEä ÉÊãÉA BÉÖEãÉ 14788 |ÉlÉàÉ SÉ®hÉ<BÉEÉ<ǪÉÉå (5696 MÉÉÆ ÉÉå iÉlÉÉ 9092 ¶Éc®ÉÒ JÉÆbÉå) BÉEÉä SÉÖxÉÉ MɪÉÉlÉÉ *
1.2.3 |ÉÉÊiÉn¶ÉÇ +ÉÉÊ£ÉBÉEã{É& |ÉÉÊiÉn¶ÉÇ |ÉlÉàÉ ºiÉ® <BÉEÉ<ǪÉÉå (A{ÉEAºÉ ªÉÚ AºÉ) BÉEä SÉÖxÉÉ´É cäiÉÖ ºiÉ®ÉÒBÉßEiÉ |ÉÉÊiÉn¶ÉÇ +ÉÉÊ£ÉBÉEã{É +É{ÉxÉɪÉÉMɪÉÉ * A{ÉE AºÉ ªÉÚ (BÉEä®ãÉ àÉå {ÉÆSÉɪÉiÉ cããÉBÉEä) OÉÉàÉÉÒhÉ FÉäjÉÉå àÉåMÉÉÆ É lÉä iÉlÉÉ ¶Éc®ÉÒ FÉäjÉÉå àÉå ªÉÚ A{ÉE AºÉ JÉhb lÉä * ÉʤÉcÉ® +ÉÉè®=½ÉÒºÉÉ BÉEä ®ÉVªÉÉå iÉlÉÉ BÉExÉÉÇ]BÉE BÉEä ÞBÉEº¤ÉÉå BÉEä +ÉãÉÉ´ÉÉ +ÉÉÉÌlÉBÉEMÉhÉxÉÉ 98 BÉEÉÒ =tÉàÉ ºiÉ® ºÉÚSÉxÉÉ ºÉÉÊciÉ MÉÉÆ ÉÉå/¶Éc®ÉÒ JÉhbÉå BÉEÉÒºÉÚSÉÉÒ BÉEÉ |ÉÉÊiÉn¶ÉÇ fÉÆSÉä BÉEä âó{É àÉå ={ɪÉÉäMÉ ÉÊBÉEªÉÉ MɪÉÉ lÉÉ *ÉÊxÉhÉÉǪÉBÉE SÉ®hÉ <BÉEÉ<ǪÉÉÆ (ªÉÚ AºÉ ªÉÚ) +ɺÉÆMÉÉÊ~iÉ ÉÊ ÉÉÊxÉàÉÉÇhÉBÉEÉ®ÉҺɴÉæFÉhÉ {É® ºÉ´ÉæFÉhÉ cäiÉÖ =tÉàÉ lÉä * ªÉÚ AºÉ ªÉÚ BÉEÉä, A{ÉE AºÉ ªÉÚàÉå iÉnxÉÖâó{ÉÉÒ fÉÆSÉä ºÉä ´ÉiÉÇÖãÉ µÉEàɤÉr |ÉÉÊiÉn¶ÉÇ uÉ®É SÉÖxÉÉ MɪÉÉ lÉÉ*¤Éßcn A{ÉE AºÉ ªÉÚ BÉEÉä JÉä½É ºÉàÉÚc (OÉÉàÉÉÒhÉ)iÉlÉÉ ={É JÉhb(¶Éc®ÉÒ) xÉÉàÉBÉE ãÉPÉÖiÉ® FÉäjÉÉå àÉå ÉÊ É£ÉBÉDiÉ ÉÊBÉEªÉÉ MɪÉÉ lÉÉ * <xÉJÉä½É ºÉàÉÚcÉå/={É JÉÆbÉå àÉå ºÉä iÉÉÒxÉ BÉEÉä SÉÖxÉÉ MɪÉÉ lÉÉ * +ÉÉÊvÉBÉEiÉàɺÉÆJªÉÉ ´ÉÉãÉä ABÉE ºÉàÉÚc BÉEÉä ÉÊxÉÉζSÉiÉ âó{É ºÉä iÉlÉÉ nÉä +ÉxªÉ ´ÉiÉÇÖãɵÉEàɤÉr |ÉÉÊiÉn¶ÉÇ âó{É ºÉä SÉÖxÉÉ MɪÉÉ lÉÉ * {ÉcãÉä £ÉÉMÉ BÉEÉä JÉÆb-* ´ÉnÚºÉ®É £ÉÉMÉ JÉÆb-** BÉEcÉ MɪÉÉ * <xÉ JÉÆbÉå àÉå |ÉiªÉäBÉE JÉhb ºÉä ªÉÚAºÉ ªÉÚ (ÉÊxÉhÉÉǪÉBÉE SÉ®hÉ <BÉEÉ<ǪÉÉå) BÉEÉä SÉÖxÉÉ MɪÉÉ lÉÉ *
1.2.4 +ÉÉÆBÉE½É ABÉEjÉhÉ BÉEÉÒ ÉÊ ÉÉÊvÉ& |ÉiªÉäBÉE A{ÉE AºÉ ªÉÚ àÉå FÉäjÉBÉEɪÉÇ BÉEä ÉÊãÉA ABÉE {ɪÉÇ ÉäFÉBÉE BÉEä ºÉÉlÉ nÉä +ÉlÉ´ÉÉ iÉÉÒxÉ +Éx´ÉäÉBÉEÉåBÉEÉÒ ABÉE ]ÉÒàÉ ÉÊxɪÉÉäÉÊVÉiÉ BÉEÉÒ MÉ<Ç lÉÉÒ * +Éx´ÉäÉBÉEÉå xÉä |ÉiªÉäBÉE PÉ®/|ÉÉÊiÉn¶ÉÇ A{ÉE AºÉ ªÉÚ àÉå fÉÆSÉä (+ÉlÉ´ÉÉ ¤É½ä A{ÉE AºÉ ªÉÚ BÉEä àÉÉàÉãÉäàÉå SÉÖÉËxÉnÉ ÉÊcººÉÉå) BÉEÉ nÉè®É ÉÊBÉEªÉÉ iÉlÉÉ ºÉ£ÉÉÒ {ÉÉÊ®´ÉÉ®Éå +ÉlÉ´ÉÉ
|ÉiªÉäBÉE PÉ® àÉå =tÉàÉÉå/fÉÆSÉä BÉEÉä iÉÉÉÊãÉBÉEɤÉr ÉÊBÉEªÉÉ * {ÉÉÊ®´ÉÉ®ÉåiÉlÉÉ =tÉàÉÉå BÉEä SÉÖxÉÉ´É BÉEä ÉÊãÉA {ÉÉÊ®´ÉÉ®Éå iÉlÉÉ =tÉàÉÉå BÉEÉä iÉÉÉÊãÉBÉEÉBÉEä ÉÊãÉA +ÉãÉMÉ fÉÆSÉÉ ={ÉãɤvÉ BÉE®ÉªÉÉ MɪÉÉ * |ÉiªÉäBÉE A{ÉE AºÉ ªÉÚàÉå =tÉàÉ ºÉ´ÉæFÉhÉ BÉEä ÉÊãÉA +ÉÉÊvÉBÉEiÉàÉ 16 =tÉàÉÉå BÉEÉä SÉÖxÉÉ MɪÉÉ*|ÉÉÊiÉnÉ̶ÉiÉ {ÉÉÊ®´ÉÉ®Éå iÉlÉÉ =tÉàÉÉå ºÉä +ÉÉÆBÉE½É ABÉEjÉhÉ BÉEä ÉÊãÉAºÉÉFÉÉiBÉEÉ® ÉÊ ÉÉÊvÉ BÉEÉä +É{ÉxÉɪÉÉ MɪÉÉ *
1.2.5 ={É-nÉè®& ºÉÉ®ÉÒ ºÉ´ÉæFÉhÉ +É´ÉÉÊvÉ ( 1 VÉÖãÉÉ<Ç 2000 ºÉä30 VÉÚxÉ 2001 iÉBÉE) BÉEÉä iÉÉÒxÉ�iÉÉÒxÉ àÉÉc BÉEä SÉÉ® ={É-nÉè®Éå (={ÉnÉè®-*-VÉÖãÉÉ<Ç-ÉʺÉiÉà¤É® 2000, ={É nÉè® 2-+ÉBÉDiÉڤɮ-ÉÊnºÉà¤É® 2000,={É nÉè®-3 : VÉxÉ´É®ÉÒ-àÉÉSÉÇ 2001, ={É-nÉè® 4-+É|ÉèãÉ-VÉÚxÉ 2001)àÉå ÉÊ É£ÉBÉDiÉ ÉÊBÉEªÉÉ MɪÉÉ * |ÉiªÉäBÉE ={É-nÉè® BÉEÉä |ÉÉÊiÉn¶ÉÇ MÉÉÆ ÉÉå +ÉÉè®JÉhbÉå BÉEÉÒ ¤É®É¤É® ºÉÆJªÉÉ +ÉɤÉÆÉÊ]iÉ BÉEÉÒ MÉ<Ç * |ÉiªÉäBÉE A{ÉE AºÉ ªÉÚBÉEÉä <ºÉä +ÉɤÉÆÉÊ]iÉ ={É-nÉè® +É´ÉÉÊvÉ BÉEä nÉè®ÉxÉ ºÉ´ÉæFÉhÉ ÉÊBÉEªÉÉ MɪÉÉ*ABÉE ÉÊ ÉÉʶÉ] ={É-nÉè® BÉEä +ÉÆiÉMÉÇiÉ FÉäjÉ BÉEɪÉÇ BÉEÉä ªÉlÉÉ-ºÉƣɴÉ&ÉÊ ÉÉÊ£ÉxxÉ àÉÉcÉå àÉå ºÉàÉâó{É iÉÉè® {É® {ÉEèãÉɪÉÉ (ÉÊ ÉiÉÉÊ®iÉ ÉÊBÉEªÉÉ) MɪÉÉ*
1.2.6 iÉèªÉÉ® BÉEÉÒ MÉ<Ç +ÉxÉÖºÉÚÉÊSɪÉÉÆ : {ÉÉÊ®´ÉÉ® iÉlÉÉ ÉÊ ÉÉÊxÉàÉÉÇhÉBÉEä ºÉÉ®hÉÉÒªÉxÉ BÉEä ÉÊãÉA ABÉE ºÉÉ®hÉÉÒªÉxÉ +ÉxÉÖºÉÚSÉÉÒ (+ÉxÉÖºÉÚSÉÉÒ 0.0)={ɪÉÉäMÉ BÉEÉÒ MÉ<Ç * ªÉc +ÉxÉÖºÉÚSÉÉÒ àÉÖJªÉiÉ& |ÉiªÉäBÉE SɪÉÉÊxÉiÉ MÉÉÆ É/JÉhb àÉå ÉÊ ÉºiÉßiÉ ºÉÚSÉxÉÉ ABÉEjÉ BÉE®xÉä BÉEä ÉÊãÉA |ÉÉÊiÉn¶ÉÇ {ÉÉÊ®´ÉÉ®ÉåA´ÉÆ =tÉàÉÉå BÉEÉÒ +É{ÉäÉÊFÉiÉ ºÉÆJªÉÉ |ÉÉ{iÉ BÉE®xÉä cäiÉÖ fÉÆSÉÉ iÉèªÉÉ® BÉE®xÉäBÉEä ÉÊãÉA ={ɪÉÉäMÉ BÉEÉÒ MÉ<Ç * ºÉÉ®hÉÉÒªÉxÉ +ÉxÉÖºÉÚSÉÉÒ uÉ®É ABÉEjÉ BÉEÉÒMÉ<Ç ºÉÚSÉxÉÉ +ÉxÉÖàÉÉxÉ =qä¶ªÉ cäiÉÖ MÉÖhÉBÉE +ÉÉÊ£ÉBÉEãÉxÉ àÉå ={ɪÉÉäMÉ BÉEÉÒMÉ<Ç * |ÉiªÉäBÉE SÉÖÉËxÉnÉ |ÉÉÊiÉn¶ÉÇ =tÉàÉÉå àÉå, ®ÉäVÉMÉÉ®, ÉκlÉ® {ÉÉÊ®ºÉÆ{ÉÉÊkɪÉÉÆ,BÉEɪÉÇMÉiÉ {ÉÚÆVÉÉÒ, =vÉÉ®ÉÒ, ÉÊxÉ´Éä¶É, =i{ÉÉnxÉ iÉlÉÉ |ÉÉÊiÉnÉ̶ÉiÉ =tÉàÉÉåBÉEä àÉÚãªÉ-´ÉÉÌvÉiÉ VÉèºÉÉÒ àÉÚãÉ-ºÉÚSÉxÉÉ ABÉEjÉhÉ cäiÉÖ =tÉàÉ +ÉxÉÖºÉÚSÉÉÒ(+ÉxÉÖºÉÚSÉÉÒ 2.2) iÉèªÉÉ® BÉEÉÒ MÉ<Ç *
1.2.7 ºÉÆn£ÉÇ +É´ÉÉÊvÉ& MÉiÉ àÉÉc BÉEÉä +ÉÉÊvÉBÉEÉÆ¶É +ÉÉÆBÉEbÉå BÉEäABÉEjÉhÉ cäiÉÖ ºÉÆn£ÉÇ +É´ÉÉÊvÉ BÉEä âó{É àÉå ={ɪÉÉäMÉ ÉÊBÉEªÉÉ MɪÉÉ cè*BÉEä ÉãÉ MÉiÉ àÉÉc BÉEä ÉÊãÉA ÉÊ ÉÉÊ£ÉxxÉ |ÉÉÉÎ{iɪÉÉÆ +ÉÉè® JÉSÉÉç BÉEä ºÉÉlÉ-ºÉÉlÉ ®ÉäVÉMÉÉ®, {ÉÉÊ®ãÉÉΤvɪÉÉÆ, ÉÊBÉE®ÉªÉÉ, ¤ªÉÉVÉ, iÉlÉÉ àÉÚãªÉ ´ÉÉÌvÉiÉ=tÉàÉÉå BÉEä ÉÊãÉA ABÉEjÉ ÉÊBÉEA MÉA lÉä * ÉÊSÉ®ºlÉɪÉÉÒ iÉlÉÉ +ÉÉBÉEÉκàÉBÉE=tÉàÉÉå BÉEä ÉÊãÉA, MÉiÉ 30 ÉÊnxÉÉå (ºÉÉFÉÉiBÉEÉ® ºÉä {ÉÚ ÉÇ) BÉEÉä MÉiÉ àÉÉcBÉEcÉ MɪÉÉ cè, ÉʤÉxÉÉ <ºÉ ¤ÉÉiÉ {É® ÉÊ ÉSÉÉ® ÉÊBÉEA ÉÊBÉE |ÉSÉÉãÉxÉ BÉEäÉÊnxÉÉå BÉEÉÒ ºÉÆJªÉÉ BÉDªÉÉ cè ? àÉÉèºÉàÉÉÒ =tÉàÉÉå BÉEä ÉÊãÉA £ÉÉÒ MÉiÉ àÉÉcºÉä +ÉÉÊ£É|ÉÉªÉ (ºÉÉFÉÉiBÉEÉ® ºÉä {ÉÚ ÉÇ) 30 ÉÊnxÉÉå ºÉä cè, ªÉÉÊn =xcÉåxÉäSÉÉãÉÚ àÉÉèºÉàÉ àÉå ãÉMÉÉiÉÉ® 30 ÉÊnxÉ +ÉlÉ´ÉÉ +ÉÉÊvÉBÉE (+ÉxÉÖºÉÚÉÊSÉiÉUÖÉÊ]Â]ªÉÉå ºÉÉÊciÉ) ÉÊnxÉÉå BÉEä ÉÊãÉA BÉEɪÉÇ ÉÊBÉEªÉÉ cÉä * BÉEä ÉãÉ àÉÉèºÉàÉÉÒ=tÉàÉÉå BÉEä ÉÊãÉA, ÉÊVÉxcÉåxÉä SÉÉãÉÚ àÉÉèºÉàÉ àÉå 30 ÉÊnxÉÉå ºÉä BÉEàÉ BÉEä

losZ{k.k fg- & 3
ÉÊãÉA BÉEɪÉÇ ÉÊBÉEªÉÉ cÉä, MÉiÉ ´ÉÉÇ ºÉä +ÉÉÊ£É|ÉÉªÉ MÉiÉ BÉEɪÉÇ BÉEä àÉÉèºÉàÉàÉå ABÉE +ÉÉèºÉiÉ àÉÉc ºÉä lÉÉ * ªÉÉÊn BÉÖEU =tÉàÉ MÉiÉ 30 ÉÊnxÉÉå BÉEäÉÊãÉA ºÉÚSÉxÉÉ näxÉä àÉå ºÉàÉlÉÇ xÉcÉÓ lÉä +ÉÉè® ´Éä +ÉtÉiÉxÉ SÉÉãÉÚ BÉEãÉéb®àÉÉc BÉEä ºÉƤÉÆvÉ àÉå +É{ÉxÉä JÉÉiÉÉå ºÉä ºÉÚSÉxÉÉ näxÉä àÉå ºÉàÉlÉÇ lÉä, =xÉBÉEÉÒ+ÉtÉiÉxÉ BÉEãÉéb® àÉÉc BÉEÉÒ ºÉÚSÉxÉÉ ãÉÉÒ MÉ<Ç lÉÉÒ * BÉÖEU +ÉxªÉ àÉnÉåVÉèºÉä ÉÊBÉE ÉκlÉ® {ÉÉÊ®ºÉà{ÉÉÊiɪÉÉå BÉEä àÉÚãªÉ, ¤ÉBÉEɪÉÉ jÉ@hÉ BÉEÉÒ ®ÉÉʶÉ<iªÉÉÉÊn BÉEä ÉÊãÉA ºÉÆn£ÉÇ +É´ÉÉÊvÉ Þ ºÉ´ÉæFÉhÉ BÉEÉÒ iÉÉ®ÉÒJÉ iÉBÉE Þ àÉÉxÉÉÒMÉ<Ç lÉÉÒ* ÉκlÉ® {ÉÉÊ®ºÉÆ{ÉÉÊiɪÉÉå àÉå ÉÊxÉ´ÉãÉ ´ÉßÉÊrªÉÉÆ, |ÉSÉÉÊãÉiÉ ÉÊnxÉÉå BÉEÉÒ
ºÉÆJªÉÉ, BÉEÉÒ MÉ<Ç +ÉxªÉ +ÉÉÉÌlÉBÉE MÉÉÊiÉÉÊ ÉÉÊvɪÉÉå BÉEÉÒ ºÉÆJªÉÉ, <iªÉÉÉÊnBÉEä ÉÊãÉA Þ ºÉÉFÉÉiBÉEÉ® BÉEä ÉÊnxÉ ºÉä 365 ÉÊnxÉ {ÉÚ ÉÇ Þ BÉEÉä ºÉÆn£ÉÇ +É´ÉÉÊvÉàÉÉxÉÉ MɪÉÉ lÉÉ *
1.3 BÉE´É® BÉEÉÒ MÉ<Ç MÉÉÊiÉÉÊ ÉÉÊvɪÉÉÆ :
ºÉÉ®hÉÉÒ- 56´Éå nÉè® àÉå BÉE´É® BÉEÉÒ MÉ<Ç ÉÊ ÉÉÊ£ÉxxÉ ÉÊ ÉÉÊxÉàÉÉÇhÉBÉEÉ®ÉÒMÉÉÊiÉÉÊ ÉÉÊvɪÉÉÆ +ÉÉè® AxÉ +ÉÉ<Ç ºÉÉÒ 1998 BÉEä +ÉÆiÉMÉÇiÉ =xÉBÉEä´ÉMÉÉÔBÉE®hÉ xÉÉÒSÉä n¶ÉÉÇA MÉA cé *
ºÉÉ®hÉÉÒ-BÉE : ºÉ´ÉæFÉhÉ àÉå BÉE´É® BÉEÉÒ MÉ<Ç MÉÉÊiÉÉÊ ÉÉÊvɪÉÉÆ +ÉÉè® =xÉBÉEÉ AxÉ +ÉÉ<Ç ºÉÉÒ 1998 ´ÉMÉÉÔBÉE®hÉ
AxÉ +ÉÉ<Ç ºÉÉÒ MÉÉÊiÉÉÊ ÉÉÊvÉ1998 BÉEÉäbºÉ
01405 ºÉÚiÉ +ÉÉä]É<Ç +ÉÉè® MÉ]Â~É
15 JÉÉtÉ =i{ÉÉn +ÉÉè® {ÉäªÉ {ÉnÉlÉÉç BÉEÉ ÉÊ ÉÉÊxÉàÉÉÇhÉ
16 iÉà¤ÉÉBÉÚE =i{ÉÉnÉå BÉEÉ ÉÊ ÉÉÊxÉàÉÉÇhÉ
17 ´ÉºjÉ ÉÊ ÉÉÊxÉàÉÉÇhÉ
18 {ÉcxÉxÉä BÉEä {ÉÉÊ®vÉÉxÉ BÉEÉ ÉÊ ÉÉÊxÉàÉÉÇhÉ ; {ÉE® BÉEÉÒ ®ÆMÉÉ<Ç +ÉÉè® bÅäÉ˺ÉMÉ
19 SÉàɽä BÉEÉÒ ]äÉËxÉMÉ +ÉÉè® bÅäÉ˺ÉMÉ ; +ɺɤÉɤÉ, cèxb¤ÉäMɺÉ, VÉÉÒxÉ, ºÉVVÉÉ +ÉÉè® VÉÚiÉä-SÉ{{ÉãÉ BÉEÉ ÉÊ ÉÉÊxÉàÉÉÇhÉ
20 ãÉBÉE½ÉÒ BÉEä ºÉÉàÉÉxÉ BÉEÉä UÉä½BÉE®, ãÉBÉE½ÉÒ +ÉÉè® ãÉBÉE½ÉÒ A´ÉÆ BÉEÉäBÉEÇ BÉEä =i{ÉÉnÉå BÉEÉ ÉÊ ÉÉÊxÉàÉÉÇhÉ;
21 BÉEÉMÉVÉ +ÉÉè® BÉEÉMÉVÉ =i{ÉÉn BÉEÉ ÉÊ ÉÉÊxÉàÉÉÇhÉ
22 ÉÊ®BÉEÉbæb àÉÉÒÉÊbªÉÉ BÉEÉ |ÉBÉEɶÉxÉ, àÉÖphÉ +ÉÉè® {ÉÖxÉ|ÉǺiÉÖÉÊiÉBÉE®hÉ
23 BÉEÉäBÉE, {ÉÉÊ®BÉßEiÉ {Éä]ÅÉäÉÊãɪÉàÉ =i{ÉÉn +ÉÉè® {É®àÉÉhÉÖ <ÇÆvÉxÉ BÉEÉ ÉÊ ÉÉÊxÉàÉÉÇhÉ
24 ®ºÉɪÉxÉ A´ÉÆ ®ºÉɪÉxÉ =i{ÉÉnÉå BÉEÉ ÉÊ ÉÉÊxÉàÉÉÇhÉ
25 ®¤É½ A´ÉÆ {ãÉÉÉκ]BÉDºÉ =i{ÉÉnÉå BÉEÉ ÉÊ ÉÉÊxÉàÉÉÇhÉ
26 +ÉxªÉ MÉè®-vÉÉÉÎi´ÉBÉE JÉÉÊxÉVÉ =i{ÉÉnÉå BÉEÉ ÉÊ ÉÉÊxÉàÉÉÇhÉ
27 àÉÚãÉ vÉÉiÉÖ BÉEÉ ÉÊ ÉÉÊxÉàÉÉÇhÉ
28 àɶÉÉÒxÉ®ÉÒ +ÉÉè® ={ÉBÉE®hÉ BÉEÉä UÉä½BÉE® BÉßEÉÊjÉàÉ vÉÉiÉÖ =i{ÉÉnÉå BÉEÉ ÉÊ ÉÉÊxÉàÉÉÇhÉ
29 àɶÉÉÒxÉ®ÉÒ +ÉÉè® ={ÉBÉE®hÉ +É.BÉE.´É.xÉcÉÓ BÉEÉ ÉÊ ÉÉÊxÉàÉÉÇhÉ
30 BÉEɪÉÉÇãɪÉ, ABÉEÉ=ÉÏx]MÉ +ÉÉè® BÉEà{ªÉÚÉË]MÉ àɶÉÉÒxÉ®ÉÒ BÉEÉ ÉÊ ÉÉÊxÉàÉÉÇhÉ
31 ÉÊ ÉtÉÖiÉ àɶÉÉÒxÉ®ÉÒ +ÉÉè® ={ɺBÉE® +É.BÉE.´É.xÉcÉÓ BÉEÉ ÉÊ ÉÉÊxÉàÉÉÇhÉ
32 ®äÉÊbªÉÉä, ]äãÉÉÒÉÊ ÉVÉxÉ +ÉÉè® ºÉÆSÉÉ® ={ÉBÉE®hÉ A´ÉÆ ={ɺBÉE®Éå BÉEÉ ÉÊ ÉÉÊxÉàÉÉÇhÉ
33 àÉèÉÊbBÉEãÉ, ÉÊ|ɺÉÉÒVÉxÉ +ÉÉè® +ÉÉÉÎ{]BÉEãÉ <xº]ÚàÉå], ´ÉÉSÉ A´ÉÆ BÉDãÉÉBÉDºÉ BÉEÉ ÉÊ ÉÉÊxÉàÉÉÇhÉ
34 àÉÉä]® ´ÉÉcxÉ, ]ÅäãɺÉÇ A´ÉÆ ºÉäàÉÉÒ ]ÅäãÉäºÉÇ BÉEÉ ÉÊ ÉÉÊxÉàÉÉÇhÉ
35 +ÉxªÉ {ÉÉÊ®´ÉcxÉ ={ÉBÉE®hÉ BÉEÉ ÉÊ ÉÉÊxÉàÉÉÇhÉ
36 ãÉBÉE½ÉÒ BÉEä ºÉÉàÉÉxÉ BÉEÉ ÉÊ ÉÉÊxÉàÉÉÇhÉ ; ÉÊ ÉÉÊxÉàÉÉÇhÉBÉEÉ®ÉÒ +É.BÉE.´É.xÉcÉÓ
37 {ÉÖxÉSÉǵÉEhÉ

fg- & 4 losZ{k.k
ÉÊxÉBÉEÉÉç BÉEÉ ºÉÆÉÊFÉ{iÉ ºÉÉ®
2.0 ªÉc ÉÊ®{ÉÉä]Ç +ɺÉÆMÉÉÊ~iÉ FÉäjÉ-£ÉÉ®iÉÉÒªÉ +ÉlÉÇBªÉ´ÉºlÉÉ àÉå =xÉBÉEɪÉÉäMÉnÉxÉ, =xÉBÉEÉÒ àÉVɤÉÚiÉÉÒ +ÉÉè® BÉEàÉVÉÉä®ÉÒ, àÉå MÉè®-BÉßEÉÉÒªÉ ÉÊ ÉÉÊxÉàÉÉÇhÉBÉEÉ®ÉÒ=tÉàÉÉå {É® BÉEäÉÎxpiÉ cè * ´ÉiÉÇàÉÉxÉ ÉÊ®{ÉÉä]Ç ®É.|É.ºÉ´Éæ.56 ´ÉÉÆ nÉè®(VÉÖãÉÉ<Ç, 2000-VÉÚxÉ, 2001)ºÉä +ÉxÉÖºÉÚSÉÉÒ 2.2 BÉEä àÉÉvªÉàÉ ºÉäABÉEÉÊjÉiÉ +ÉÉÆBÉE½Éå BÉEä +ÉÉvÉÉ® {É® +ɺÉÆMÉÉÊ~iÉ FÉäjÉ ÉÊ ÉÉÊxÉàÉÉÇhÉBÉEÉ®ÉÒ=tÉàÉÉå {É® VÉÉ®ÉÒ BÉEÉÒ MɪÉÉÒ ÉÊ®{ÉÉä]Éç BÉEÉÒ +ÉÆBÉEàÉÉãÉÉ {É® +ÉÉvÉÉÉÊ®iÉABÉE ºÉàÉäÉÊBÉEiÉ ºÉÆÉÊFÉ{iÉ ºÉÉ® cè *
ÉÊxÉBÉEÉÉç BÉEä ºÉÉ® BÉEÉä {ÉÉÆSÉ ÉÊ ÉÉÊ£ÉxxÉ ={É JÉÆbÉå BÉE) =tÉàÉÉå BÉEÉÒºÉÉàÉÉxªÉ ÉÊ É¶ÉäÉiÉÉAÆ, JÉ) ®ÉäVÉMÉÉ®, MÉ) {ÉÉÊ®ºÉà{ÉÉÊkɪÉÉÆ +ÉÉè® =vÉÉÉÊ®ªÉÉÆ,PÉ) =tÉàÉÉå BÉEä +ÉxÉÖºÉÉ® ºÉBÉEãÉ àÉÚãªÉ ´ÉÉÌvÉiÉ, +ÉÉè® ½) ºÉàÉªÉ BÉEäºÉÉlÉ {ÉÉÊ®´ÉiÉÇxÉ àÉå ¤ÉÉÆ]É MɪÉÉ cè *
BÉE. =tÉàÉÉå BÉEÉÒ ºÉÉàÉÉxªÉ ÉÊ É¶ÉäÉiÉÉAÆ
FÉäjÉ +ÉÉè® =tÉàÉ |ÉBÉEÉ® BÉEä +ÉxÉÖºÉÉ® <ºÉ ºÉ´ÉæFÉhÉ ºÉä +ÉxÉÖàÉÉÉÊxÉiÉnä¶É àÉå ÉÊ ÉÉÊxÉàÉÉÇhÉBÉEÉ®ÉÒ =tÉàÉÉå BÉEÉÒ =tÉÉäMÉ-´ÉÉ® ºÉÆJªÉÉ ÉÊxÉàxÉÉÊãÉÉÊJÉiÉÉÊ É´É®hÉÉÒ-* àÉå nÉÒ MɪÉÉÒ cè *
ÉÊ É´É®hÉÉÒ-1 : FÉäjÉ +ÉÉè® =tÉàÉÉå BÉEä |ÉBÉEÉ® BÉEä +ÉxÉÖºÉÉ® ÉÊ ÉÉÊ£ÉxxÉ =tÉÉäMÉÉå àÉå =tÉàÉÉå BÉEÉÒ +ÉxÉÖàÉÉÉÊxÉiÉ ºÉÆJªÉÉ
=tÉàÉÉå BÉEÉÒ +ÉxÉÖàÉÉÉÊxÉiÉ ºÉÆJªÉÉ (ºÉèBÉEbÃÉ àÉå)
AxÉ FÉäjÉ =tÉàÉÉå BÉEä |ÉBÉEÉ®+ÉÉ<ǺÉÉÒ OÉÉàÉÉÒhÉ ¶Éc®ÉÒ ºÉƪÉÖBÉDiÉ +ÉÉä A AàÉ <Ç AxÉ bÉÒ AàÉ <Ç bÉÒ AàÉ <Ç ºÉ£ÉÉÒ
1998
BÉEÉäbºÉ
(1) (2) (3) (4) (5) (6) (7) (8)
01405 21 43 64 54 9 1 6415 23607 6506 30113 25567 3484 1062 3011316 16482 4557 21039 20674 155 210 2103917 16894 7237 24131 20741 2049 1341 2413118 16712 11384 28096 24166 3397 534 28096
19 915 845 1759 1403 244 113 175920 24664 3454 28118 26683 1190 245 2811821 262 628 890 688 118 83 89022 224 1216 1440 575 681 184 144023 51 18 69 28 34 7 69
24 1073 1129 2202 1863 121 219 220225 344 610 953 496 277 181 95326 6868 1333 8201 6865 586 749 820127 143 246 389 199 137 54 38928 3707 2718 6425 4406 1619 399 642529 813 851 1664 991 467 205 1664
30 - 2 2 - 1 1 231 223 432 655 312 173 169 65532 10 58 68 16 22 30 6833 15 71 87 41 31 15 8734 36 187 223 50 94 78 22335 50 112 162 63 60 39 16236 6166 7171 13337 10652 2150 536 1333737 66 89 154 122 18 14 154
ºÉàɺiÉ 119346 50895 170241 146654 17117 6470 170241

losZ{k.k fg- & 5
2.1 ÉÊ ÉÉÊ£ÉxxÉ =tÉÉäMÉÉå àÉå =tÉàÉÉå BÉEÉÒ +ÉxÉÖàÉÉÉÊxÉiÉ ºÉÆJªÉÉ& ªÉcnäJÉÉ MɪÉÉ cè ÉÊBÉE AxÉ bÉÒ AàÉ <Ç (10.1 |ÉÉÊiɶÉiÉ) +ÉÉè® bÉÒ AàÉ<Ç (4 |ÉÉÊiɶÉiÉ) BÉEä ¤ÉÉn =tÉàÉÉå BÉEÉ ãÉMÉ£ÉMÉ 86 |ÉÉÊiɶÉiÉ +ÉÉä AAàÉ <Ç ºÉä ºÉƤÉÆÉÊvÉiÉ cè * {ÉÉÆSÉ =tÉÉäMÉÉå xÉÉàÉiÉ& JÉÉtÉ =i{ÉÉnÉå +ÉÉè®{ÉäªÉ {ÉnÉlÉÉæ BÉEÉ ÉÊ ÉÉÊxÉàÉÉÇhÉ (AxÉ +ÉÉ<Ç ºÉÉÒ BÉEÉäb 15), ãÉBÉE½ÉÒ BÉEäºÉÉàÉÉxÉ BÉEÉä UÉä½BÉE®, ãÉBÉE½ÉÒ +ÉÉè® ãÉBÉE½ÉÒ BÉEä =i{ÉÉn iÉlÉÉ BÉEÉäBÉEÇBÉEÉ ÉÊ ÉÉÊxÉàÉÉÇhÉ; º]ÅÉ +ÉÉè® {ãÉäÉË]MÉ ºÉÉàÉOÉÉÒ BÉEÉÒ ÉºiÉÖ+ÉÉäÆ BÉEÉ ÉÊ ÉÉÊxÉàÉÉÇhÉ(AxÉ +ÉÉ<Ç ºÉÉÒ BÉEÉäb 20), {ÉcxÉxÉä BÉEä {ÉÉÊ®vÉÉxÉ BÉEÉ ÉÊ ÉÉÊxÉàÉÉÇhÉ; ®ä¶ÉäBÉEÉÒ ®ÆMÉÉ<Ç iÉlÉÉ bÅäÉ˺ÉMÉ (AxÉ +ÉÉ<Ç ºÉÉÒ BÉEÉäb 18), ´ÉºjÉÉå BÉEÉÉÊ ÉÉÊxÉàÉÉÇhÉ (AxÉ +ÉÉ<Ç ºÉÉÒ BÉEÉäb 17)+ÉÉè® iÉà¤ÉÉBÉÚE =i{ÉÉnÉå BÉEÉÉÊ ÉÉÊxÉàÉÉÇhÉ (AxÉ +ÉÉ<Ç ºÉÉÒ 16) xÉä =tÉàÉÉå BÉEÉÒ ºÉÆJªÉÉ àÉå 77
|ÉÉÊiɶÉiÉ ºÉä £ÉÉÒ +ÉÉÊvÉBÉE BÉEÉ ªÉÉäMÉnÉxÉ ÉÊnªÉÉ * FÉäjÉ´ÉÉ® =tÉàÉÉå BÉEÉ70 |ÉÉÊiɶÉiÉ OÉÉàÉÉÒhÉ FÉäjÉÉå àÉå ÉκlÉiÉ lÉÉ *
2.2 ÉÊ ÉÉÊ£ÉxxÉ ®ÉVªÉÉå/ºÉÆPÉ ¶ÉÉÉʺÉiÉ FÉäjÉÉå àÉå =tÉàÉÉå BÉEÉÒ +ÉxÉÖàÉÉÉÊxÉiɺÉÆJªÉÉ& FÉäjÉ +ÉÉè® =tÉàÉ |ÉBÉEÉ® BÉEä +ÉxÉÖºÉÉ® <ºÉ ºÉ´ÉæFÉhÉ ºÉä+ÉxÉÖàÉÉÉÊxÉiÉ |ÉiªÉäBÉE ®ÉVªÉ/ºÉÆPÉ ¶ÉÉÉʺÉiÉ FÉäjÉ àÉå =tÉàÉÉå BÉEÉÒ ºÉÆJªÉÉÉÊxÉàxÉÉÊãÉÉÊJÉiÉ ÉÊ É´É®hÉÉÒ 2 àÉå n¶ÉÉǪÉÉÒ MÉ<Ç cè * 27 ãÉÉJÉ +ÉxÉÖàÉÉÉÊxÉiÉ=tÉàÉÉå BÉEÉÒ ºÉÆJªÉÉ BÉEä ºÉÉlÉ {ÉÉζSÉàÉ ¤ÉÆMÉÉãÉ xÉä ¶ÉÉÒÉÇ ºlÉÉxÉ |ÉÉ{iÉÉÊBÉEªÉÉ * <ºÉBÉEä ¤ÉÉn 23, 16, 15, 12 +ÉÉè® 10 ãÉÉJÉ =tÉàÉÉå BÉEäºÉÉlÉ µÉEàɶÉ& =kÉ® |Énä¶É, +ÉÉÆwÉ |Énä¶É, iÉÉÊàÉãÉxÉÉbÖ, àÉcÉ®É]Å +ÉÉè®BÉExÉÉÇ]BÉE cè *
ÉÊ É´É®hÉÉÒ-2 : =tÉàÉ BÉEä FÉäjÉ A´ÉÆ |ÉBÉEÉ® BÉEä +ÉxÉÖºÉÉ® ÉÊ ÉÉÊ£ÉxxÉ ®ÉVªÉÉå/ºÉÆPÉ ¶ÉÉÉʺÉiÉ FÉäjÉÉå àÉå =tÉàÉÉå BÉEÉÒ +ÉxÉÖàÉÉÉÊxÉiÉ ºÉÆJªÉÉ
=tÉàÉÉå BÉEÉÒ ºÉÆJªÉÉ (ºÉèBÉE½É àÉå)
®ÉVªÉ/ºÉÆPÉ FÉäjÉ =tÉàÉ BÉEÉ |ÉBÉEÉ®¶ÉÉÉʺÉiÉ FÉäjÉ
OÉÉàÉÉÒhÉ ¶Éc®ÉÒ ºÉƪÉÖBÉDiÉ +ÉÉäAAàÉ<Ç AxÉbÉÒAàÉ<Ç bÉÒAàÉ<Ç ºÉàɺiÉ
(1) (2) (3) (4) (5) (6) (7) (8)
+ÉÉÆwÉ |Énä¶É 12029 4035 16064 14367 1264 434 16064
+É°ôhÉÉSÉãÉ |Énä¶É 2 2 4 2 2 0 4
+ɺÉàÉ 2404 380 2784 2474 282 28 2784
ÉʤÉcÉ® 6835 1251 8086 7630 396 60 8086
MÉÉä´ÉÉ 184 65 249 190 48 11 249
MÉÖVÉ®ÉiÉ 2461 2962 5423 4027 890 506 5423
cÉÊ®ªÉÉhÉÉ 1007 926 1933 1475 369 89 1933
ÉÊcàÉÉSÉãÉ |Énä¶É 907 75 981 875 85 22 981
VÉààÉÚ +ÉÉè® BÉE¶àÉÉÒ® 1395 686 2081 1906 145 31 2081
BÉExÉÉÇ]BÉE 6864 3479 10343 8951 890 502 10343
BÉEä®ãÉ 4208 883 5091 3858 987 246 5091
àÉvªÉ |Énä¶É 5289 2124 7413 6852 416 145 7413
àÉcÉ®É]Å 6681 5708 12389 9728 1705 955 12389
àÉÉÊhÉ{ÉÖ® 348 191 539 513 20 6 539
àÉäPÉÉãÉªÉ 262 19 280 243 32 6 280
ÉÊàÉVÉÉä®àÉ 35 28 63 52 10 1 63
xÉÉMÉÉãÉéb 33 24 57 48 9 1 57
=½ÉÒºÉÉ 9196 639 9834 9493 273 69 9834
{ÉÆVÉÉ¤É 1866 1540 3406 2567 641 198 3406
®ÉVɺlÉÉxÉ 3912 2323 6236 5635 463 138 6236
tkjh@&

fg- & 6 losZ{k.k
ÉʺÉÉÎBÉDBÉEàÉ 12 4 16 12 4 0 16
iÉÉÊàÉãÉxÉÉbÖ 8459 6822 15281 12394 2063 824 15281
ÉÊjÉ{ÉÖ®É 310 45 355 313 39 3 355
=kÉ® |Énä¶É 16313 6588 22901 19747 2301 853 22901
{ÉÉζSÉàÉ ¤ÉÆMÉÉãÉ 21237 6474 27710 24851 2136 723 27710
+ÉÆ.+ÉÉè® ÉÊxÉ.uÉÒ{ɺÉàÉÚc 20 8 28 19 7 2 28
SÉhbÉÒMÉfà 7 53 60 29 18 13 60
nÉ.+ÉÉè® xÉ.c´ÉäãÉÉÒ 11 2 13 9 3 1 13
nàÉxÉ A´ÉÆ ÉÊnªÉÖ 7 3 10 6 2 2 10
ÉÊnããÉÉÒ 104 2200 2304 681 1116 507 2304
ãÉFÉuÉÒ{É 0 1 2 1 0 0 2
{ÉÉìÉÎhbSÉä®ÉÒ 28 100 128 77 41 10 128
ZÉÉ®JÉÆb 4047 449 4496 4274 195 28 4496
UkÉÉÒºÉMÉfà 1877 579 2456 2280 138 38 2456
=kÉ®ÉÆSÉãÉ 995 229 1224 1077 128 19 1224
ºÉàɺiÉ-£ÉÉ®iÉ 119346 50895 170241 146654 17117 6470 170241
=tÉàÉÉå BÉEÉÒ ºÉÆJªÉÉ (ºÉèBÉE½É àÉå)
®ÉVªÉ/ºÉÆPÉ FÉäjÉ =tÉàÉ BÉEÉ |ÉBÉEÉ®¶ÉÉÉʺÉiÉ FÉäjÉ
OÉÉàÉÉÒhÉ ¶Éc®ÉÒ ºÉƪÉÖBÉDiÉ +ÉÉäAAàÉ<Ç AxÉbÉÒAàÉ<Ç bÉÒAàÉ<Ç ºÉàɺiÉ
(1) (2) (3) (4) (5) (6) (7) (8)
JÉ. ®ÉäVÉMÉÉ® A´ÉÆ {ÉÉÊ®ãÉÉΤvɪÉÉÆ
2.3 ÉÊ ÉÉÊ£ÉxxÉ =tÉÉäMÉÉå àÉå BÉEÉàÉMÉÉ®Éå BÉEÉÒ +ÉxÉÖàÉÉÉÊxÉiÉ ºÉÆJªÉÉ :ÉÊ É´É®hÉ 3 =tÉàÉÉå BÉEä FÉäjÉ A´ÉÆ |ÉBÉEÉ® BÉEä +ÉxÉÖºÉÉ® |ÉiªÉäBÉE =tÉÉäMÉàÉå BÉEÉàÉMÉÉ®Éå BÉEÉÒ +ÉxÉÖàÉÉÉÊxÉiÉ FÉäjÉ A´ÉÆ |ÉBÉEÉ® BÉEä +ÉxÉÖºÉÉ® |ÉiªÉäBÉE=tÉÉäMÉ àÉå BÉEÉàÉMÉÉ®Éå BÉEÉÒ +ÉxÉÖàÉÉÉÊxÉiÉ ºÉÆJªÉÉ n¶ÉÉÇiÉÉ cè * +ÉÉÊJÉãÉ
£ÉÉ®iÉ ºiÉ® {É®, BÉEÉàÉMÉÉ®Éå BÉEÉÒ ºÉÆJªÉÉ ãÉMÉ£ÉMÉ 370.81 ãÉÉJÉ+ÉxÉÖàÉÉÉÊxÉiÉ BÉEÉÒ MÉ<Ç * <xÉàÉå ºÉä, 239.86 ãÉÉJÉ (+ÉlÉÉÇiÉ 64.68±),OÉÉàÉÉÒhÉ FÉäjÉÉå àÉå ÉκlÉiÉ =tÉàÉÉå àÉå lÉä +ÉÉè® 13.95 ãÉÉJÉ ¶Éc®ÉÒFÉäjÉÉå àÉå lÉä * ÉÊ ÉÉÊ£ÉxxÉ =tÉàÉÉå àÉå ãÉMÉä BÉEÉàÉMÉÉ®Éå BÉEÉ +ÉÆ¶É µÉEàɶÉ&+ÉÉäAAàÉ<Ç àÉå 67.59±, AxÉbÉÒAàÉ<Ç àÉå 15.00± iÉlÉÉ bÉÒAàÉ<Ç àÉå17.41± lÉÉ *

losZ{k.k fg- & 7
ÉÊ É´É®hÉÉÒ-3 : =tÉàÉÉå BÉEä FÉäjÉ A´ÉÆ |ÉBÉEÉ® BÉEä +ÉxÉÖºÉÉ® ÉÊ ÉÉÊ£ÉxxÉ =tÉÉäMÉÉå àÉå BÉEÉàÉMÉÉ®Éå BÉEÉÒ +ÉxÉÖàÉÉÉÊxÉiÉ ºÉÆJªÉÉ
BÉEÉàÉMÉÉ®Éå BÉEÉÒ +ÉxÉÖàÉÉÉÊxÉiÉ ºÉÆJªÉÉ(ºÉèBÉE½É àÉå)
AxÉ+ÉÉ<ǺÉÉÒ FÉäjÉ =tÉàÉ BÉEÉ |ÉBÉEÉ®
1998 OÉÉàÉÉÒhÉ ¶Éc®ÉÒ ºÉƪÉÖBÉDiÉ +ÉÉäAAàÉ<Ç AxÉbÉÒAàÉ<Ç bÉÒAàÉ<Ç ºÉàɺiÉ
(1) (2) (3) (4) (5) (6) (7) (8)
01405 48 84 132 77 25 30 132
15 51711 16709 68420 48680 10567 9173 68420
16 27417 6671 34088 31100 574 2414 34088
17 38729 23084 61813 41270 7520 13023 61813
18 23053 22677 45730 30876 10023 4831 45730
19 1338 2653 3991 2162 831 998 3991
20 44788 7429 52217 46607 3780 1830 52217
21 610 1908 2519 1359 430 730 2519
22 573 4228 4801 1030 2274 1497 4801
23 154 66 220 50 120 50 220
24 3040 2639 5679 2775 432 2471 5679
25 917 2417 3334 784 1016 1534 3334
26 25639 4864 30503 16129 2041 12332 30503
27 404 918 1322 307 476 539 1322
28 6757 9101 15858 7429 5353 3076 15858
29 1546 3374 4920 1673 1642 1606 4920
30 - 10 10 - 6 4 10
31 508 2032 2540 480 620 1441 2540
32 32 380 412 30 85 298 412
33 56 261 317 87 107 124 317
34 109 963 1072 90 349 633 1072
35 134 505 639 108 215 317 639
36 12180 17723 29903 17304 7064 5535 29903
37 114 254 369 207 67 95 369
ºÉàɺiÉ 239857 130951 370808 250612 55616 64579 370808
OÉÉàÉÉÒhÉ A´ÉÆ ¶Éc®ÉÒ nÉäxÉÉå FÉäjÉÉå BÉEÉä ÉÊàÉãÉÉBÉE®, BÉEÉàÉMÉÉ®Éå BÉEÉÒ +ÉxÉÖàÉÉÉÊxÉiɺÉÆJªÉÉ ÞJÉÉtÉ =i{ÉÉn iÉlÉÉ {ÉäªÉ {ÉnÉlÉÇ BÉEÉ ÉÊ ÉÉÊxÉàÉÉÇhÉ(AxÉ+ÉÉ<ǺÉÉÒBÉEÉäb 15) Þ BÉEÉÒ gÉähÉÉÒ àÉå ºÉ´ÉÉÇÉÊvÉBÉE {ÉÉ<Ç MÉ<Ç * <ºÉBÉEä ¤ÉÉn ªÉcºÉÆJªÉÉ {ÉExÉÉÔSÉ® iÉlÉÉ º]ÅÉì A´ÉÆ {ãÉäÉË]MÉ àÉè]äÉÊ®ªÉãÉ BÉEÉÒ ´ÉºiÉÖ+ÉÉäÆ BÉEÉÉÊ ÉÉÊxÉàÉÉÇhÉ (AxÉ+ÉÉ<ǺÉÉÒ BÉEÉäb 20) Þ, {ÉcxÉxÉä BÉEä {ÉÉÊ®vÉÉxÉ BÉEÉ ÉÊ ÉÉÊxÉàÉÉÇhÉiÉlÉÉ {ÉE® BÉEÉÒ bÅäÉ˺ÉMÉ iÉlÉÉ ®ÆMÉÉ<Ç(AxÉ+ÉÉ<ǺÉÉÒ BÉEÉäb 18) Þ +ÉÉè®ÞiÉƤÉÉBÉÚE =i{ÉÉnÉå BÉEÉ ÉÊ ÉÉÊxÉàÉÉÇhÉ (AxÉ+ÉÉ<ǺÉÉÒ BÉEÉäb 16) Þ BÉEÉä UÉä½BÉE®Þ ɺjÉ ÉÊ ÉÉÊxÉàÉÉhÉ(AxÉ+ÉÉ<ǺÉÉÒ BÉEÉäb 17) Þ, ÞãÉBÉE½ÉÒ ÉÊ ÉÉÊxÉàÉÉÇhÉ iÉlÉÉãÉBÉE½ÉÒ +ÉÉè® BÉEÉìBÉEÇ BÉEä =i{ÉÉnÉå BÉEÉ ÉÊ ÉÉÊxÉàÉÉÇhÉ gÉähÉÉÒ àÉå lÉÉÒ *
={É®ÉäBÉDiÉ {ÉÉÆSÉ =tÉÉäMÉÉå cäiÉÖ ªÉc |ÉÉÊiɶÉiÉ +ÉÆ¶É µÉEàɶÉ& 18.45,16.67JÉ 14.08, 12.33 iÉlÉÉ 9.19 lÉÉ * BÉEÉàÉMÉÉ®Éå BÉEÉÒ BÉÖEãɺÉÆJªÉÉ BÉEÉ 70.73± <xÉ {ÉÉÆSÉ =tÉÉäMÉÉå àÉå cÉÒ cè *
2.4 ÉÊ´ÉÉÊ£ÉxxÉ ®ÉVªÉÉå/ºÉÆPÉ ¶ÉɺÉÉÒ FÉäjÉÉå àÉå BÉEÉàÉMÉÉ®Éå BÉEÉÒ+ÉxÉÖàÉÉÉÊxÉiÉ ºÉÆJªÉÉ : ÉÊxÉàxÉÉÊãÉÉÊJÉiÉ ÉÊ É´É®hÉ 4 =tÉàÉÉå BÉEä FÉäjÉA´ÉÆ |ÉBÉEÉ® BÉEä +ÉxÉÖºÉÉ® ÉÊ ÉÉÊ£ÉxxÉ ®ÉVªÉÉå/ºÉÆPɶÉɺÉÉÒ FÉäjÉÉå àÉå BÉEÉàÉMÉÉ®ÉåBÉEÉÒ +ÉxÉÖàÉÉÉÊxÉiÉ ºÉÆJªÉÉ n¶ÉÉÇiÉÉ cè *

fg- & 8 losZ{k.k
ÉÊ É´É®hÉÉÒ-4 : =tÉàÉÉå BÉEä FÉäjÉ A´ÉÆ |ÉBÉEÉ® BÉEä +ÉxÉÖºÉÉ® ÉÊ ÉÉÊ£ÉxxÉ ®ÉVªÉÉå/ºÉÆPÉ ¶ÉɺÉÉÒ FÉäjÉÉå àÉå BÉEÉàÉMÉÉ®Éå BÉEÉÒ +ÉxÉÖàÉÉÉÊxÉiÉ ºÉÆJªÉÉ
BÉEÉàÉMÉÉ®Éå BÉEÉÒ ºÉÆJªÉÉ (ºÉèBÉE½É àÉå)
®ÉVªÉ/ºÉÆPÉ ¶ÉÉÉʺÉiÉ FÉäjÉ =tÉàÉ BÉEÉ |ÉBÉEÉ®FÉäjÉ
OÉÉàÉÉÒhÉ ¶Éc®ÉÒ ºÉƪÉÖBÉDiÉ +ÉÉäAAàÉ<Ç AxÉbÉÒAàÉ<Ç bÉÒAàÉ<Ç ºÉàɺiÉ
(1) (2) (3) (4) (5) (6) (7) (8)
+ÉÉÆwÉ |Énä¶É 23846 9146 32992 24975 4024 3994 32992+É°ôhÉÉSÉãÉ |Énä¶É 5 6 12 3 6 2 12+ÉɺÉÉàÉ 4104 884 4988 3925 811 252 4988ÉʤÉcÉ® 12356 2637 14993 13073 1264 656 14993MÉÉä´ÉÉ 433 170 603 356 156 91 603
MÉÖVÉ®ÉiÉ 5627 9254 14881 6464 3133 5283 14881cÉÊ®ªÉÉhÉÉ 1782 2422 4204 2184 1095 924 4204ÉÊcàÉÉSÉãÉ |Énä¶É 1374 175 1548 1096 247 206 1548VÉààÉÚ +ÉÉè® BÉE¶àÉÉÒ® 3050 1676 4726 3967 423 336 4726BÉExÉÉÇ]BÉE 12743 7576 20318 12858 2898 4562 20318
BÉEä®ãÉ 8483 2226 10709 5125 3138 2447 10709àÉvªÉ |Énä¶É 9739 4707 14446 11660 1369 1418 14446àÉcÉ®É]Å 12411 17312 29723 15228 5728 8768 29723àÉÉÊhÉ{ÉÖ® 476 313 789 669 70 49 789àÉäPÉÉãÉªÉ 498 54 552 395 103 54 552
ÉÊàÉVÉÉä®àÉ 54 64 118 74 32 12 118xÉÉMÉÉãÉéb 52 48 101 68 25 7 101=½ÉÒºÉÉ 20618 1374 21993 20600 779 614 21993{ÉÆVÉÉ¤É 3327 4120 7447 3534 1984 1929 7447®ÉVɺlÉÉxÉ 6539 4925 11464 8745 1498 1220 11464
ÉʺÉÉÎBÉDBÉEàÉ 18 12 30 14 12 4 30iÉÉÊàÉãÉxÉÉbÖ 16715 17719 34435 19174 7013 8248 34435ÉÊjÉ{ÉÖ®É 621 105 726 584 113 29 726=kÉ® |Énä¶É 36826 17210 54036 35957 7280 10799 54036{ÉÉζSÉàÉ ¤ÉÆMÉÉãÉ 44161 14521 58681 44628 6856 7198 58681
+É.+ÉÉè® ÉÊxÉ.uÉÒ{ɺÉàÉÚc 44 27 71 31 23 17 71SÉhbÉÒMÉfà 15 214 229 40 55 134 229nÉ.+ÉÉè® xÉ.c´ÉäãÉÉÒ 23 4 28 13 8 7 28nàÉxÉ +ÉÉè® ÉÊnªÉÖ 29 7 36 8 9 20 36ÉÊnããÉÉÒ 241 8977 9218 1019 3948 4251 9218
ãÉFÉuÉÒ{É 0 3 3 1 1 1 3{ÉÉìÉÎhbSÉä®ÉÒ 102 304 407 121 175 110 407ZÉÉ®JÉÆb 8307 877 9185 8332 527 326 9185UkÉÉÒºÉMÉfà 3568 1353 4921 4081 442 399 4921=kÉ®ÉÆSÉãÉ 1667 529 2196 1611 373 212 2196
ºÉàɺiÉ-£ÉÉ®iÉ 239857 130951 370808 250612 55616 64579 370808

losZ{k.k fg- & 9
MÉ. {ÉÉÊ®ºÉÆ{ÉÉÊkɪÉÉÆ iÉlÉÉ =vÉÉ®ÉÒ
2.5 |ÉÉÊiÉ =tÉàÉ {ÉÉÊ®ºÉÆ{ÉÉÊkɪÉÉå BÉEÉ BÉE+ÉxÉÖàÉÉÉÊxÉiÉ ¤ÉÉVÉÉ® àÉÚãªÉ:ÉÊ É´É®hÉ 5 =tÉàÉÉå BÉEä BÉEɪÉÇBÉEãÉÉ{É iÉlÉÉ |ÉBÉEÉ® (+ÉÉäAAàÉ<Ç, AxÉbÉÒAàÉ<Ç,bÉÒAàÉ<Ç) BÉEä +ÉxÉÖºÉÉ® OÉÉàÉÉÒhÉ, ¶Éc®ÉÒ iÉlÉÉ ºÉƪÉÖBÉDiÉ FÉäjÉÉå cäiÉÖ{ÉßlÉBÉE °ô{É ºÉä |ÉÉÊiÉ =tÉàÉ {ÉÉÊ®ºÉÆ{ÉÉÊkɪÉÉå BÉEÉ +ÉxÉÖàÉÉÉÊxÉiÉ ¤ÉÉVÉÉ®àÉÚãªÉ (°ô.’ 00 àÉå) n¶ÉÉÇiÉÉ cè * +ÉÉÊJÉãÉ £ÉÉ®iÉ ºiÉ® {É®, |ÉÉÊiÉ=tÉàÉ {ÉÉÊ®ºÉÆ{ÉÉÊkɪÉÉå BÉEÉ ¤ÉÉVÉÉ® àÉÚãÉªÉ 60500 °ô. +ÉxÉÖàÉÉÉÊxÉiÉ
ÉÊBÉEªÉÉ MɪÉÉ * ¶Éc®ÉÒ FÉäjÉÉå BÉEÉÒ iÉÖãÉxÉÉ àÉå OÉÉàÉÉÒhÉ FÉäjÉÉå àÉå |ÉÉÊiÉ=tÉàÉ {ÉÉÊ®ºÉÆ{ÉÉÊkɪÉÉå BÉEÉ ¤ÉÉVÉÉ® àÉÚ£ªÉ ãÉMÉ£ÉMÉ 20± lÉÉ * OÉÉàÉÉÒhÉFÉäjÉÉå àÉå +ÉÉäAAàÉ<Ç, AxÉbÉÒAàÉ<Ç iÉlÉÉ bÉÒAàÉ<Ç cäiÉÖ |ÉÉÊiÉ =tÉàÉ{ÉÉÊ®ºÉÆ{ÉÉÊkɪÉÉå BÉEÉ +ÉxÉÖàÉÉÉÊxÉiÉ ¤ÉÉVÉÉ® àÉÚãªÉ µÉEàɶÉ& °ô{ɪÉä 17600,88100 iÉlÉÉ 320700 lÉÉ * ¶Éc®ÉÒ FÉäjÉÉå àÉå ªÉcÉÒ +ÉÉäAAàÉ<Ç,AxÉbÉÒAàÉ<Ç iÉlÉÉ bÉÒAàÉ<Ç cäiÉÖ µÉEàɶÉ& °ô{ɪÉä 49200, 237300iÉlÉÉ 663600 lÉÉ *
ÉÊ É´É®hÉÉÒ-5 : ÉÊ ÉÉÊ£ÉxxÉ =tÉÉäMÉÉå àÉå |ÉÉÊiÉ =tÉàÉ {ÉÉÊ®ºÉÆ{ÉÉÊkɪÉÉå BÉEÉ +ÉxÉÖàÉÉÉÊxÉiÉ ¤ÉÉVÉÉ® àÉÚãªÉ
AxÉ+ÉÉ<ǺÉÉÒ |ÉÉÊiÉ =tÉàÉ {ÉÉÊ®ºÉÆ{ÉÉÊkɪÉÉå BÉEÉ +ÉxÉÖàÉÉÉÊxÉiÉ ¤ÉÉVÉÉ® àÉÚãªÉ (ºÉÉè °ô{ɪÉä àÉå)
BÉEÉäb OÉÉàÉÉÒhÉ ¶Éc®ÉÒ ºÉƪÉÖBÉDiÉ
+ÉÉäAAàÉ<Ç AxÉbÉÒAàÉ<Ç bÉÒAàÉ<Ç ºÉàɺiÉ +ÉÉäAAàÉ<Ç AxÉbÉÒAàÉ<Ç bÉÒAàÉ<Ç ºÉàɺiÉ +ÉÉäAAàÉ<Ç AxÉbÉÒAàÉ<Ç bÉÒAàÉ<Ç ºÉàɺiÉ(2) (3) (4) (5) (6) (7) (8) (9) (10) (11) (12) (13)
01405 393 750 17158 962 457 1375 9040 702 436 1221 13601 78715 322 1096 2129 435 681 2149 6012 1368 386 1573 3606 63716 66 440 820 78 119 593 2413 129 77 468 927 8917 173 550 2304 250 428 1972 5309 1268 237 1332 4295 55618 212 587 1314 242 442 1665 5126 875 294 1283 4736 498
19 181 831 1589 214 706 1663 3839 1339 378 1555 3703 75420 84 839 4092 114 303 2174 7244 979 106 1543 6239 22021 66 4041 16345 500 340 3808 7877 1901 240 3816 8486 148822 1901 2078 2845 2005 1316 3599 9678 3647 1457 3432 9280 339223 21 2123 2231 1217 836 2927 5185 2526 187 2366 3095 1559
24 120 1541 3212 566 191 2650 11224 1152 157 2374 6075 86725 172 3092 5717 1334 636 3879 9485 3813 406 3724 8581 291926 157 768 5658 651 336 2227 7304 1566 181 1365 6031 80027 313 775 6486 984 704 2632 15869 4076 484 2397 13381 293828 175 1107 5040 340 905 2805 6545 2482 366 2378 6365 1246
29 239 2098 6462 524 1654 4247 10570 4847 612 3948 10214 273430 - - - - - 2685 10604 4684 - 2685 10604 468431 461 1539 4181 815 1263 2574 6587 3628 802 2391 6413 267132 302 390 5021 1251 908 4829 11399 7361 674 4443 10979 645833 1123 761 4234 1280 847 2808 9742 3226 910 2501 9246 2883
34 382 2273 9934 2204 2087 8249 9574 7909 1255 7881 9600 698335 353 388 1513 427 1447 3449 11083 5377 911 2603 10434 385236 222 692 1542 286 706 2064 4966 1265 453 1771 4118 81237 314 545 3896 347 868 2715 5198 1904 574 2669 5145 1242
ºÉàɺiÉ 176 881 3207 276 492 2373 6636 1375 254 1824 5328 605
2.6 ÉÊxÉàxÉÉÊãÉÉÊJÉiÉ ÉÊ É´É®hÉ 6 ®ÉVªÉ´ÉÉ®/ºÉÆPɶÉÉÉʺÉiÉ |Énä¶É´ÉÉ®|ÉÉÊiÉ =tÉàÉ ºÉÆ{ÉÉÊkÉ BÉEÉ +ÉxÉÖàÉÉÉÊxÉiÉ ¤ÉÉVÉÉ® £ÉÉ´É (°ô.00 àÉå) iÉlÉÉOÉÉàÉÉÒhÉ, ¶Éc®ÉÒ A´ÉÆ ºÉƪÉÖBÉEiÉ FÉäjÉÉå àÉå =tÉàÉÉå(+ÉÉäAAàÉ<Ç,AxÉbÉÒAàÉ<Ç,bÉÒAàÉ<Ç) BÉEÉ |ÉBÉEÉ® n¶ÉÉÇiÉÉ cè * BÉÖEJªÉ ®ÉVªÉÉå àÉå |ÉÉÊiÉ=tÉàÉ ºÉÆ{ÉÉÊkÉ BÉEÉ +ÉxÉÖàÉÉÉÊxÉiÉ ¤ÉÉVÉÉ® £ÉÉ´É ºÉ¤ÉºÉä +ÉÉÊvÉBÉE cÉÊ®ªÉÉhÉÉ
iÉlÉÉ =ºÉBÉEä ¤ÉÉn {ÉÆVÉɤÉ, MÉÖVÉ®ÉiÉ, àÉcÉ®É]Å A´ÉÆ iÉÉÊàÉãÉxÉÉbÖ àÉå®cÉ * àÉÖJªÉ ®ÉVªÉÉå àÉå |ÉÉÊiÉ =tÉàÉ ºÉÆ{ÉÉÊkÉ BÉEÉ +ÉxÉÖàÉÉÉÊxÉiÉ ¤ÉÉVÉÉ®£ÉÉ´É ºÉ¤ÉºÉä BÉEàÉ =½ÉÒºÉÉ(+ÉÉÊJÉãÉ £ÉÉ®iÉ +ÉÉèºÉiÉ BÉEÉ ãÉMÉ£ÉMÉ 20±)àÉå ®cÉ *

fg- & 10 losZ{k.k
ÉÊ É´É®hÉÉÒ-6 : ÉÊ ÉÉÊ£ÉxxÉ ®ÉVªÉÉå/ºÉÆPÉ ¶ÉÉÉʺÉiÉ |Énä¶ÉÉå àÉå |ÉÉÊiÉ =tÉàÉ ºÉÆ{ÉÉÊkÉ BÉEÉ +ÉxÉÖàÉÉÉÊxÉiÉ ¤ÉÉVÉÉ® £ÉÉ´É
®ÉVªÉ/ºÉÆPÉ =tÉàÉÉå BÉEÉÒ ºÉÆJªÉÉ (ºÉèBÉE½É àÉå)¶ÉÉÉʺÉiÉ FÉäjÉ
OÉÉàÉÉÒhÉ ¶Éc®ÉÒ ºÉƪÉÖBÉDiÉ
+ÉÉäAAàÉ<Ç AxÉbÉÒAàÉ<Ç bÉÒAàÉ<Ç ºÉàɺiÉ +ÉÉäAAàÉ<Ç AxÉbÉÒAàÉ<Ç bÉÒAàÉ<Ç ºÉàɺiÉ +ÉÉäAAàÉ<Ç AxÉbÉÒAàÉ<Ç bÉÒAàÉ<Ç ºÉàɺiÉ
(1) (2) (3) (4) (5) (6) (7) (8) (9) (10) (11) (12) (13)
+ÉÉÆwÉ |Énä¶É 163 761 1827 228 363 1426 3984 695 207 1095 2744 346+É°ôhÉÉSÉãÉ |Énä¶É 237 466 3722 383 593 2250 1316 1609 332 1603 2109 911+ɺÉàÉ 104 442 2588 139 247 772 2324 507 118 598 2456 190ÉʤÉcÉ® 166 555 2291 187 345 1196 3114 539 190 872 2673 242MÉÉä ÉÉ 375 1896 9326 833 515 3141 6108 1840 405 2361 7333 1096
MÉÖVÉ®ÉiÉ 267 1386 2644 445 807 2805 6052 1993 509 2636 5145 1291cÉÊ®ªÉÉhÉÉ 522 1850 9912 772 1248 3410 11321 2708 807 3001 11113 1700ÉÊcàÉÉSÉãÉ |Énä¶É 275 2130 11212 608 1119 3152 10346 2314 321 2408 11028 738VÉààÉÚ +ÉÉè® BÉE¶àÉÉÒ® 320 1403 7066 421 519 2876 7431 1004 381 2264 7297 613BÉExÉÉÇ]BÉE 164 583 1053 231 353 1910 7414 934 224 1301 3331 467
BÉEä®ãÉ 232 1150 4849 591 375 2083 5966 1262 253 1374 5157 708àÉvªÉ |Énä¶É 154 895 1308 181 433 1880 5607 858 224 1632 3889 375àÉcÉ®É]Å 258 1175 4965 430 707 3204 7342 2211 422 2813 6895 1250àÉÉÊhÉ{ÉÖ® 244 548 868 252 379 1036 1928 464 289 928 1551 327àÉäPÉÉãÉªÉ 117 919 2712 228 312 1182 3760 1027 124 985 3055 281
ÉÊàÉVÉÉä®àÉ 294 384 2350 302 640 2603 13274 1648 423 2017 13174 897xÉÉMÉÉãÉéb 359 1253 14777 488 342 1067 1897 576 353 1110 4881 525=½ÉÒºÉÉ 74 774 1338 93 205 1529 3510 541 81 1052 2119 122{ÉÆVÉÉ¤É 291 1478 20811 698 997 3730 10119 2832 540 3102 11563 1663®ÉVɺlÉÉxÉ 358 1341 2719 417 643 2278 6449 1115 454 1995 5374 677
ÉʺÉÉÎBÉDBÉEàÉ 269 1376 17261 945 423 1900 8436 1706 289 1686 30853 1137iÉÉÊàÉãÉxÉÉbÖ 189 1005 3734 368 402 2193 6843 1288 272 1824 5784 779ÉÊjÉ{ÉÖ®É 116 750 1033 165 286 890 6579 751 130 814 3827 239=kÉ® |Énä¶É 192 788 3731 330 438 1509 4337 879 253 1200 4004 488{ÉÉζSÉàÉ ¤ÉÆMÉÉãÉ 106 453 1908 148 213 996 3448 560 127 765 2755 245
+ÉÆ.+ÉÉè® 405 1459 5362 810 750 2444 4547 2215 451 2022 4923 1194ÉÊxÉ.uÉÒ{ɺÉàÉÚcSÉhbÉÒMÉfà 954 3882 4581 2191 515 12146 48804 15281 576 11019 47351 13765nÉ.+ÉÉè® xÉ.c´ÉäãÉÉÒ 183 883 8572 840 618 2036 3235 1205 236 1126 7970 891nàÉxÉ A´ÉÆ ÉÊnªÉÖ 299 1480 8306 2785 538 1607 1383 734 406 1509 7897 2125
ÉÊnããÉÉÒ 941 1668 5407 1550 2122 4557 8658 4794 2026 4449 8611 4648ãÉFÉuÉÒ{É 298 - - 298 267 1529 11958 1003 271 1529 11958 933{ÉÉìÉÎhbSÉä®ÉÒ 243 2224 8394 1893 666 1879 12673 1786 563 1923 10782 1809ZÉÉ®JÉÆb 215 482 2711 235 281 780 1685 388 221 594 2413 251UkÉÉÒºÉMÉfà 138 611 644 155 249 1877 4472 657 161 1394 2979 274=kÉ®ÉÆSÉãÉ 256 1073 4297 349 575 1864 7587 1215 300 1507 5653 511
ºÉàɺiÉ-£ÉÉ®iÉ 176 881 3207 276 492 2373 6636 1375 254 1824 5328 605
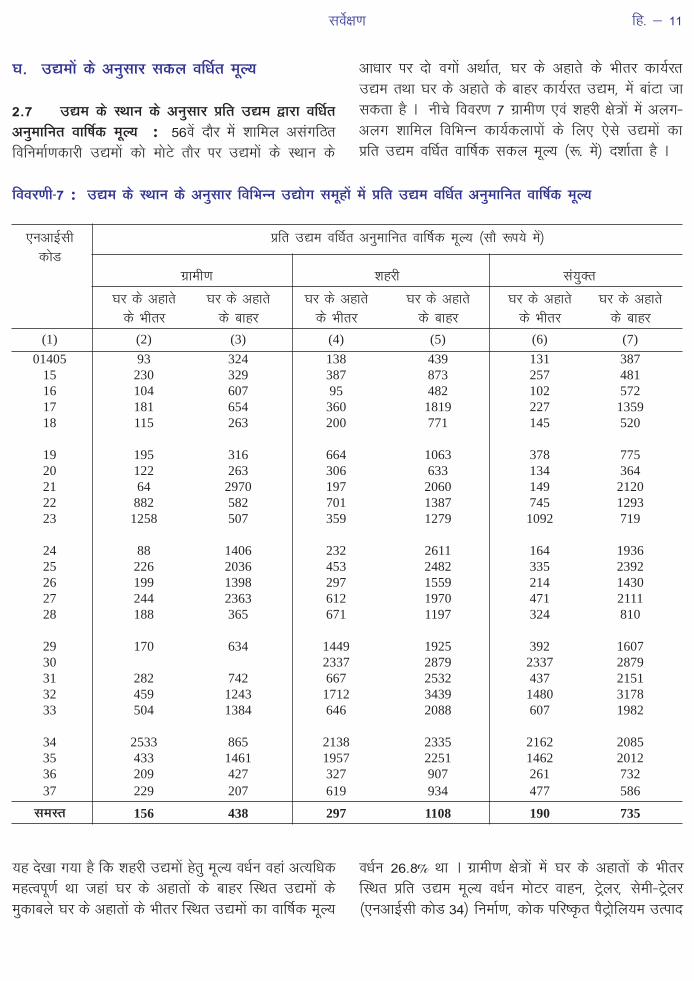
losZ{k.k fg- & 11
PÉ. =tÉàÉÉå BÉEä +ÉxÉÖºÉÉ® ºÉBÉEãÉ ´ÉÉÌvÉiÉ àÉÚãªÉ
2.7 =tÉàÉ BÉEä ºlÉÉxÉ BÉEä +ÉxÉÖºÉÉ® |ÉÉÊiÉ =tÉàÉ uÉ®É ´ÉÉÌvÉiÉ+ÉxÉÖàÉÉÉÊxÉiÉ ´ÉÉÉÌÉBÉE àÉÚãªÉ : 56´Éå nÉè® àÉå ¶ÉÉÉÊàÉãÉ +ɺÉÆMÉÉÊ~iÉÉÊ ÉÉÊxÉàÉÉÇhÉBÉEÉ®ÉÒ =tÉàÉÉå BÉEÉä àÉÉä]ä iÉÉè® {É® =tÉàÉÉå BÉEä ºlÉÉxÉ BÉEä
+ÉÉvÉÉ® {É® nÉä ´ÉMÉÉå +ÉlÉÉÇiÉ, PÉ® BÉEä +ÉcÉiÉä BÉEä £ÉÉÒiÉ® BÉEɪÉÇ®iÉ=tÉàÉ iÉlÉÉ PÉ® BÉEä +ÉcÉiÉä BÉEä ¤ÉÉc® BÉEɪÉÇ®iÉ =tÉàÉ, àÉå ¤ÉÉÆ]É VÉɺÉBÉEiÉÉ cè * xÉÉÒSÉä ÉÊ É´É®hÉ 7 OÉÉàÉÉÒhÉ A´ÉÆ ¶Éc®ÉÒ FÉäjÉÉå àÉå +ÉãÉMÉ-+ÉãÉMÉ ¶ÉÉÉÊàÉãÉ ÉÊ ÉÉÊ£ÉxxÉ BÉEɪÉÇBÉEãÉÉ{ÉÉå BÉEä ÉÊãÉA AäºÉä =tÉàÉÉå BÉEÉ|ÉÉÊiÉ =tÉàÉ ´ÉÉÌvÉiÉ ´ÉÉÉÌÉBÉE ºÉBÉEãÉ àÉÚãªÉ (°ô. àÉå) n¶ÉÉÇiÉÉ cè *
ÉÊ É´É®hÉÉÒ-7 : =tÉàÉ BÉEä ºlÉÉxÉ BÉEä +ÉxÉÖºÉÉ® ÉÊ ÉÉÊ£ÉxxÉ =tÉÉäMÉ ºÉàÉÚcÉå àÉå |ÉÉÊiÉ =tÉàÉ ´ÉÉÌvÉiÉ +ÉxÉÖàÉÉÉÊxÉiÉ ´ÉÉÉÌÉBÉE àÉÚãªÉ
AxÉ+ÉÉ<ǺÉÉÒ |ÉÉÊiÉ =tÉàÉ ´ÉÉÌvÉiÉ +ÉxÉÖàÉÉÉÊxÉiÉ ´ÉÉÉÌÉBÉE àÉÚãªÉ (ºÉÉè °ô{ɪÉä àÉå)BÉEÉäb
OÉÉàÉÉÒhÉ ¶Éc®ÉÒ ºÉƪÉÖBÉDiÉ
PÉ® BÉEä +ÉcÉiÉä PÉ® BÉEä +ÉcÉiÉä PÉ® BÉEä +ÉcÉiÉä PÉ® BÉEä +ÉcÉiÉä PÉ® BÉEä +ÉcÉiÉä PÉ® BÉEä +ÉcÉiÉäBÉEä £ÉÉÒiÉ® BÉEä ¤ÉÉc® BÉEä £ÉÉÒiÉ® BÉEä ¤ÉÉc® BÉEä £ÉÉÒiÉ® BÉEä ¤ÉÉc®
(1) (2) (3) (4) (5) (6) (7)
01405 93 324 138 439 131 38715 230 329 387 873 257 48116 104 607 95 482 102 57217 181 654 360 1819 227 135918 115 263 200 771 145 520
19 195 316 664 1063 378 77520 122 263 306 633 134 36421 64 2970 197 2060 149 212022 882 582 701 1387 745 129323 1258 507 359 1279 1092 719
24 88 1406 232 2611 164 193625 226 2036 453 2482 335 239226 199 1398 297 1559 214 143027 244 2363 612 1970 471 211128 188 365 671 1197 324 810
29 170 634 1449 1925 392 160730 2337 2879 2337 287931 282 742 667 2532 437 215132 459 1243 1712 3439 1480 317833 504 1384 646 2088 607 1982
34 2533 865 2138 2335 2162 208535 433 1461 1957 2251 1462 201236 209 427 327 907 261 73237 229 207 619 934 477 586
ºÉàɺiÉ 156 438 297 1108 190 735
ªÉc näJÉÉ MɪÉÉ cè ÉÊBÉE ¶Éc®ÉÒ =tÉàÉÉå cäiÉÖ àÉÚãªÉ ÉvÉÇxÉ ÉcÉÆ +ÉiªÉÉÊvÉBÉEàÉci´É{ÉÚhÉÇ lÉÉ VÉcÉÆ PÉ® BÉEä +ÉcÉiÉÉå BÉEä ¤ÉÉc® ÉκlÉiÉ =tÉàÉÉå BÉEäàÉÖBÉEɤÉãÉä PÉ® BÉEä +ÉcÉiÉÉå BÉEä £ÉÉÒiÉ® ÉκlÉiÉ =tÉàÉÉå BÉEÉ ÉÉÉÌÉBÉE àÉÚãªÉ
´ÉvÉÇxÉ 26.8± lÉÉ * OÉÉàÉÉÒhÉ FÉäjÉÉå àÉå PÉ® BÉEä +ÉcÉiÉÉå BÉEä £ÉÉÒiÉ®ÉκlÉiÉ |ÉÉÊiÉ =tÉàÉ àÉÚãªÉ ´ÉvÉÇxÉ àÉÉä]® ´ÉÉcxÉ, ]ÅäãÉ®, ºÉäàÉÉÒ-]ÅäãÉ®(AxÉ+ÉÉ<ǺÉÉÒ BÉEÉäb 34) ÉÊxÉàÉÉÇhÉ, BÉEÉäBÉE {ÉÉÊ®BÉßEiÉ {Éè]ÅÉäÉÊãɪÉàÉ =i{ÉÉn

fg- & 12 losZ{k.k
A´ÉÆ xªÉÚÉÎBÉDãɪɮ <ÇÆvÉxÉ (AxÉ+ÉÉ<ǺÉÉÒ BÉEÉäb 23), ÉÊxÉàÉÉÇhÉ iÉlÉÉ |ÉBÉEɶÉxÉ,àÉÖphÉ iÉlÉÉ ÉÊ®BÉEÉbæb àÉÉÒÉÊbªÉÉ (AxÉ+ÉÉ<ǺÉÉÒ BÉEÉäb 22) {ÉÖxÉ&=i{ÉÉnxÉ´ÉMÉÉç àÉå +ÉÉÊvÉBÉE lÉÉ VɤÉÉÊBÉE PÉ® BÉEä +ÉcÉiÉä BÉEä ¤ÉÉc® ÉκlÉiÉ OÉÉàÉÉÒhÉ=tÉàÉÉå àÉå µÉEàɶÉ& BÉEÉMÉVÉ A´ÉÆ BÉEÉMÉVÉ =i{ÉÉn (AxÉ+ÉÉ<ǺÉÉÒ BÉEÉäb21) ÉÊxÉàÉÉÇhÉ, àÉÚãÉ vÉÉiÉÖ (AxÉ+ÉÉ<ǺÉÉÒ BÉEÉäb 27) ÉÊxÉàÉÉÇhÉ iÉlÉÉ ®¤É½A´ÉÆ {ãÉÉÉκ]BÉE =i{ÉÉn (AxÉ+ÉÉ<ǺÉÉÒ BÉEÉäb 25) ÉÊxÉàÉÉÇhÉ àÉå =SSÉ´ÉÉÉÌÉBÉE àÉÚãªÉ ºÉÆ ÉvÉÇxÉ ®cÉ *
2.8 ÉÊ É´É®hÉ 8 ÉÊ ÉÉÊ£ÉxxÉ ®ÉVªÉÉå/ºÉÆPÉ ¶ÉÉÉʺÉiÉ |Énä¶ÉÉå BÉEä =tÉàÉÉå
BÉEä ºlÉÉxÉ BÉEä +ÉxÉÖºÉÉ® |ÉÉÊiÉ =tÉàÉ ´ÉÉÌvÉiÉ ´ÉÉÉÌÉBÉE àÉÚãªÉ (°ô.àÉå)OÉÉàÉÉÒhÉ A´ÉÆ ¶Éc®ÉÒ FÉäjÉÉå àÉå +ÉãÉMÉ-+ÉãÉMÉ n¶ÉÉÇiÉÉ cè * ºÉàɺiÉ®ÉVªÉÉå/ºÉÆPÉ ¶ÉÉÉʺÉiÉ |Énä¶ÉÉå BÉEÉ vªÉÉxÉ ®JÉxÉä {É® PÉ® BÉEä +ÉcÉiÉä BÉEä£ÉÉÒiÉ® ÉκlÉiÉ =tÉàÉÉå BÉEÉ ´ÉÉÉÌÉBÉE àÉÚãªÉ ´ÉvÉÇxÉ PÉ® BÉEä +ÉcÉiÉä BÉEä¤ÉÉc® ÉκlÉiÉ =tÉàÉÉå ºÉä BÉEàÉ ®cÉ * ºÉàɺiÉ OÉÉàÉÉÒhÉ A´ÉÆ ¶Éc®ÉÒ=tÉàÉÉå BÉEÉä vªÉÉxÉ àÉå ®JÉiÉä cÖA àÉÖJªÉ ®ÉVªÉÉå àÉå <xÉ nÉä |ÉBÉEÉ®BÉEä =tÉàÉÉå BÉEä ¤ÉÉÒSÉ àÉÚãªÉ ´ÉvÉÇxÉ BÉEÉ ºÉ¤ÉºÉä +ÉÉÊvÉBÉE +ÉÆiÉ®µÉEàɶÉ& àÉcÉ®É]Å, iÉÉÊàÉãÉxÉÉbÖ, BÉEä®ãÉ, MÉÖVÉ®ÉiÉ A´ÉÆ {ÉÉζSÉàÉ ¤ÉÆMÉÉãÉàÉå ®cÉ*
ÉÊ É´É®hÉÉÒ-8 : ÉÊ ÉÉÊ£ÉxxÉ ®ÉVªÉÉå àÉå |ÉÉÊiÉ =tÉàÉ ´ÉÉÌvÉiÉ +ÉxÉÖàÉÉÉÊxÉiÉ ´ÉÉÉÌÉBÉE àÉÚãªÉ
®ÉVªÉ/ºÉÆPÉ |ÉÉÊiÉ =tÉàÉ ´ÉÉÌvÉiÉ +ÉxÉÖàÉÉÉÊxÉiÉ ´ÉÉÉÌÉBÉE àÉÚãªÉ (ºÉÉè °ô{ɪÉä àÉå)¶ÉÉÉʺÉiÉ |Énä¶É
OÉÉàÉÉÒhÉ ¶Éc®ÉÒ ºÉƪÉÖBÉDiÉ
PÉ® BÉEä +ÉcÉiÉä PÉ® BÉEä +ÉcÉiÉä PÉ® BÉEä +ÉcÉiÉä PÉ® BÉEä +ÉcÉiÉä PÉ® BÉEä +ÉcÉiÉä PÉ® BÉEä +ÉcÉiÉäBÉEä £ÉÉÒiÉ® BÉEä ¤ÉÉc® BÉEä £ÉÉÒiÉ® BÉEä ¤ÉÉc® BÉEä £ÉÉÒiÉ® BÉEä ¤ÉÉc®
(1) (2) (3) (4) (5) (6) (7)
+ÉÉÆwÉ |Énä¶É 134 402 224 721 152 534
+É°ôhÉÉSÉãÉ |Énä¶É 224 959 1520 2256 487 1695
+ɺÉàÉ 190 389 433 669 209 459
ÉʤÉcÉ® 198 293 278 545 208 343
MÉÉä´ÉÉ 283 477 587 1294 385 632
MÉÖVÉ®ÉiÉ 215 682 356 1454 271 1208
cÉÊ®ªÉÉhÉÉ 220 446 358 1050 267 790ÉÊcàÉÉSÉãÉ |Énä¶É 116 420 395 1078 126 490VÉààÉÚ +ÉÉè® BÉE¶àÉÉÒ® 386 688 326 982 369 838
BÉExÉÉÇ]BÉE 148 413 213 824 166 638
BÉEä®ãÉ 157 647 255 1292 172 780
àÉvªÉ |Énä¶É 104 236 206 754 131 413
àÉcÉ®É]Å 190 526 339 1618 244 1204
àÉÉÊhÉ{ÉÖ® 148 215 204 679 166 500
àÉäPÉÉãÉªÉ 217 771 307 1447 219 890
ÉÊàÉVÉÉä®àÉ 208 396 485 1539 311 974xÉÉMÉÉãÉéb 175 371 282 814 217 572=½ÉÒºÉÉ 95 151 205 463 100 189
{ÉÆVÉÉ¤É 156 744 580 1332 308 1077
®ÉVɺlÉÉxÉ 240 420 266 937 249 655
tkjh@&

losZ{k.k fg- & 13
ÉʺÉÉÎBÉDBÉEàÉ 179 1612 887 910 312 1417
iÉÉÊàÉãÉxÉÉbÖ 147 616 258 1076 188 907
ÉÊjÉ{ÉÖ®É 168 230 635 781 202 338
=kÉ® |Énä¶É 131 425 315 747 179 533{ÉÉζSÉàÉ ¤ÉÆMÉÉãÉ 166 653 247 909 181 775
+ÉÆ.+ÉÉè® ÉÊxÉ.uÉÒ{ɺÉàÉÚc 123 990 370 1588 159 1222
SÉhbÉÒMÉfà 249 1379 314 4037 306 3745
nÉ.+ÉÉè® xÉ.c´ÉäãÉÉÒ 184 812 455 977 224 834
nàÉxÉ A´ÉÆ ÉÊnªÉÖ 153 4083 486 586 316 3374
ÉÊnããÉÉÒ 369 945 1109 2041 1092 1981
ãÉFÉuÉÒ{É 178 - 155 1691 159 1691
{ÉÉìÉÎhbSÉä®ÉÒ 184 2901 367 714 313 1069
ZÉÉ®JÉÆb 175 287 257 508 180 342
UkÉÉÒºÉMÉfà 121 210 157 592 128 346
=kÉ®ÉÆSÉãÉ 127 291 273 621 149 364
ºÉàɺiÉ-£ÉÉ®iÉ 156 438 297 1108 190 735
®ÉVªÉ/ºÉÆPÉ |ÉÉÊiÉ =tÉàÉ ´ÉÉÌvÉiÉ +ÉxÉÖàÉÉÉÊxÉiÉ ´ÉÉÉÌÉBÉE àÉÚãªÉ (ºÉÉè °ô{ɪÉä àÉå)¶ÉÉÉʺÉiÉ |Énä¶É
OÉÉàÉÉÒhÉ ¶Éc®ÉÒ ºÉƪÉÖBÉDiÉ
PÉ® BÉEä +ÉcÉiÉä PÉ® BÉEä +ÉcÉiÉä PÉ® BÉEä +ÉcÉiÉä PÉ® BÉEä +ÉcÉiÉä PÉ® BÉEä +ÉcÉiÉä PÉ® BÉEä +ÉcÉiÉäBÉEä £ÉÉÒiÉ® BÉEä ¤ÉÉc® BÉEä £ÉÉÒiÉ® BÉEä ¤ÉÉc® BÉEä £ÉÉÒiÉ® BÉEä ¤ÉÉc®
(1) (2) (3) (4) (5) (6) (7)
b. ºÉàÉªÉ BÉEä ºÉÉlÉ {ÉÉÊ®´ÉiÉÇxÉ
56´Éå nÉè® ºÉä {ÉcãÉä, 51´Éå nÉè® (VÉÖãÉÉ<Ç-1994-VÉÚxÉ®, 1995) iÉlÉÉ55´Éå nÉè® (VÉÖãÉÉ<Ç,1999-VÉÚxÉ,2000) àÉå ÉÊ ÉÉÊxÉàÉÉÇhÉ =tÉàÉÉå ºÉƤÉÆvÉÉҺɴÉæFÉhÉ ÉÊBÉEªÉä MɪÉä lÉä * {ÉÚ ÉÇ BÉEä =xÉ ºÉ´ÉæFÉhÉÉå BÉEä BÉE´É®äVÉ 56´ÉånÉè® ºÉä ~ÉÒBÉE ºÉä àÉäãÉ xÉcÉÓ JÉÉiÉä * ®É.|É.ºÉ´Éæ.ºÉÆ. BÉEä nÉäxÉÉå 55´ÉånÉè® iÉlÉÉ 56´Éå nÉè® àÉå AxÉ+ÉÉ<ǺÉÉÒ 1998 ´ÉMÉÉÔBÉßEiÉ BÉEÉ |ɪÉÉäMÉÉÊBÉEªÉÉ MɪÉÉ cè VɤÉÉÊBÉE 51´Éå nÉè® àÉå AxÉ+ÉÉ<ǺÉÉÒ 1987 BÉEÉ |ɪÉÉäMÉÉÊBÉEªÉÉ cè * 55´Éå nÉè® àÉå AxÉ+ÉÉ<ǺÉÉÒ 1998 BÉEä bÉÒ, A{ÉE, VÉÉÒ,ASÉ, VÉä, +ÉÉ<Ç, BÉEä, AàÉ, AxÉ, +ÉÉä ºÉÉ®hÉÉÒªÉxÉ gÉäÉÊhɪÉÉå àÉå nÉä |ÉBÉEÉ®BÉEä =tÉàÉÉå +ÉlÉÉÇiÉ +ÉÉäA<Ç iÉlÉÉ |ÉÉÊiÉ~ÉxÉ BÉEä ºÉ´ÉæFÉhÉ ÉÊBÉEªÉä MɪÉäÉËBÉEiÉÖ 56´Éå nÉè® àÉå |ÉÉÊiÉ~ÉxÉÉå BÉEÉä +ÉÉMÉä AxÉbÉÒAàÉ<Ç iÉlÉÉ bÉÒAàÉ<ÇàÉå ÉÊ É£ÉÉVÉxÉ BÉE® ºÉÉ®hÉÉÒªÉxÉ gÉähÉÉÒ bÉÒ {É® vªÉÉxÉ BÉEäÉÎxpiÉ ÉÊBÉEªÉÉMɪÉÉ *
56´Éå nÉè® ºÉ´ÉæFÉhÉ BÉEÉ BÉE´É®äVÉ cÉãÉÉÆÉÊBÉE 51´Éå nÉè® BÉEä BÉE´É®äVÉ ºÉä
BÉÖEU cn iÉBÉE BÉEàÉ cè * 51´Éå nÉè® àÉå ÉÊxÉàxÉÉÊãÉÉÊJÉiÉ BÉEɪÉÇBÉEãÉÉ{ÉÉÊBÉEªÉä MɪÉä ÉËBÉEiÉÖ 56´Éå nÉè® àÉå xÉcÉÓ : i) BÉEÆ{ªÉÚ]® A´ÉÆ BÉEÆ{ªÉÚ]®+ÉÉvÉÉÉÊ®iÉ |ÉhÉÉÉÊãɪÉÉä BÉEÉÒ àÉ®ààÉiÉ A´ÉÆ ®JÉ®JÉÉ´É(AxÉ+ÉÉ<ǺÉÉÒ 1987BÉEÉÒ BÉEÉäb 3941), ii ) BÉEÆ{ªÉÚ]® A´ÉÆ BÉEÆ{ªÉÚ]® +ÉÉvÉÉÉÊ®iÉ |ÉhÉÉÉÊãɪÉÉåBÉEä +ÉãÉÉ´ÉÉ BÉEɪÉÉÇãɪÉ, BÉEÆ{ªÉÚÉË]MÉ iÉlÉ ãÉäJÉÉÆBÉExÉ àɶÉÉÒxÉ®ÉÒ BÉEÉÒàÉ®ààÉiÉ (AxÉ+ÉÉ<ǺÉÉÒ 1987, BÉEÉäb 3942), iii ) £ÉÉ®ÉÒ àÉÉä]® ÉÉcxÉÉåBÉEÉÒ àÉ®ààÉiÉ (AxÉ+ÉÉ<ǺÉÉÒ 1987 BÉEÉäb 398), iv) PÉ®äãÉÚ <ãÉèÉÎBÉD]ÅBÉEãÉ={ÉBÉE®hÉÉå BÉEÉÒ àÉ®ààÉiÉ (AxÉ+ÉÉ<ǺÉÉÒ BÉEÉäb 1987 BÉEÉäb 971),v) ]ÉÒ ÉÉÒ, ´ÉÉÒºÉÉÒ+ÉÉ®, ®äÉÊbªÉÉä, ]ÅÉÆÉÊVɺ]®, ]ä{ÉÉÊ®BÉEÉbÇ® iÉlÉÉ +ÉxªÉÉÊ ÉtÉÖiÉ ={ÉBÉE®hÉÉå BÉEÉÒ àÉ®ààÉiÉ(AxÉ+ÉÉ<ǺÉÉÒ 1987 BÉEÉäb 972),vi) PɽÉÒ, nÉÒ ÉÉ® PɽÉÒ A´ÉÆ +ÉÉ£ÉÚÉhÉ BÉEÉÒ àÉ®ààÉiÉ (AxÉ+ÉÉ<ǺÉÉÒ1987 BÉEÉäb 973), vii ) ]ÅBÉE, ãÉÉì®ÉÒ A´ÉÆ +ÉxªÉ £ÉÉ®ÉÒ ´ÉÉcxÉÉå BÉEÉäUÉä½BÉE® àÉÉä]® ÉÉcxÉ A´ÉÆ àÉÉä]® ºÉÉ<ÇÉÊBÉEãÉ BÉEÉÒ àÉ®ààÉiÉ (AxÉ+ÉÉ<ǺÉÉÒ1987 BÉEÉäb 974), (viii ) ºÉÉ<ÇÉÊBÉEãÉ A´ÉÆ ÉÊ®BÉD¶ÉÉ BÉEÉÒ àÉ®ààÉiÉ(AxÉ+ÉÉ<ǺÉÉÒ 1987 BÉEÉäb 975), ix) BÉEcÉÓ +ÉxªÉjÉ ´ÉMÉÉÔBÉßEiÉ xÉcÉÓÉÊBÉEªÉä MɪÉä =tÉàÉÉå BÉEÉÒ àÉ®ààÉiÉ (AxÉ+ÉÉ<ǺÉÉÒ 1987 BÉEÉäb 979) *

fg- & 14 losZ{k.k
={É®ÉäBÉDiÉ ´ÉÉÌhÉiÉ AxÉ+ÉÉ<ǺÉÉÒ 1987 BÉEä àÉ®ààÉiÉ ºÉƤÉÆvÉÉÒ ºÉä ÉÉ+ÉÉäÆ BÉEÉäAxÉ+ÉÉ<ǺÉÉÒ 1998 àÉå ÉÊ ÉÉÊ£ÉxxÉ MÉè®-ÉÊxÉàÉÉÇhÉ =tÉÉäMÉ ºÉàÉÚcÉå +ÉlÉÉÇiÉ72501, 72502, 50200, 52602, 52603, 52604, 50404,52605 A´ÉÆ 52609 BÉEä +ÉÆiÉMÉÇiÉ ÉMÉÉÔBÉßEiÉ ÉÊBÉEªÉÉ MɪÉÉ cè * cÉãÉÉÆÉÊBÉEBÉEÉì]xÉ ÉÊàÉÉËxÉMÉ, ºÉ{ÉEÉ<Ç A´ÉÆ ¤ÉäÉËãÉMÉ BÉEɪÉÇBÉEãÉÉ{É(AxÉ+ÉÉ<ǺÉÉÒ 1998BÉEÉäb 01405) BÉEÉä 56´Éå nÉè® àÉå AAºÉ+ÉÉ<Ç BÉEä BÉE´É®äVÉ BÉEä ºÉÉlɤɮɤɮÉÒ ®JÉxÉä BÉEä ÉÊãÉA BÉE´É® ÉÊBÉEªÉÉ MɪÉÉ lÉÉ *
<ºÉBÉEä +ÉÉÊiÉÉÊ®BÉDiÉ 55´Éå nÉè® ºÉä |ÉÉ{iÉ ÉÊ ÉÉÊxÉàÉÉÇhÉ <BÉEÉ<ªÉÉå BÉEä+ÉxÉÖàÉÉxÉÉå àÉå 50´Éå nÉè® BÉEÉÒ +É{ÉäFÉÉ =tÉàÉÉå BÉEä BÉEàÉ xÉàÉÚxÉÉå BÉEÉ|ɪÉÉäMÉ ÉÊBÉEªÉÉ MɪÉÉ * <ºÉÉÊãÉA 56´Éå nÉè® BÉEÉÒ +É{ÉäFÉÉ +ÉÉÊvÉBÉE|ÉÉÊiÉn¶ÉÇ ÉÊ£ÉxxÉiÉÉ BÉEä +ÉvÉÉÒxÉ cé * <ºÉä <xÉ nÉäxÉÉå nÉè®Éå (55´Éå A´ÉÆ56´Éå) BÉEä ¤ÉÉÒSÉ +ÉxÉÖàÉÉxÉÉå BÉEÉÒ iÉÖãÉxÉÉ BÉE®xÉä cäiÉÖ vªÉÉxÉ àÉå ®JÉÉVÉÉA*
ÉÊ É´É®hÉ 9,10 A´ÉÆ 11 iÉÉÒxÉ nÉè®Éå +ÉlÉÉÇiÉ ®É.|É.ºÉ´Éæ. 51´Éå, 55´ÉåiÉlÉÉ 56´Éå BÉEä iÉÖãÉxÉÉiàÉBÉE +ÉvªÉªÉxÉ n¶ÉÉÈiÉä cé * <xÉ ÉÊ É´É®hÉÉå BÉEÉÒÉÊ®{ÉÉäÉÍ]MÉ àÉå 51´Éå iÉlÉÉ 50´Éå nÉè® àÉå BÉE´É® ÉÊBÉEªÉä MɪÉä ºÉàÉÉxÉ
BÉEɪÉÇBÉEãÉÉ{ÉÉå {É® ÉÊ ÉSÉÉ® ÉÊBÉEªÉÉ MɪÉÉ cè * +ÉlÉÉÇiÉ 51´Éå nÉè® àÉå BÉE´É®BÉEɪÉÇBÉEãÉÉ{ÉÉå ÉËBÉEiÉÖ 56´Éå nÉè® àÉå UÉä½ ÉÊnªÉä MɪÉä BÉEɪÉÇBÉEãÉÉ{ÉÉå BÉEÉÒiÉÖãÉxÉÉ BÉEä ÉÊãÉA ÉÊ ÉSÉÉ® xÉcÉÓ ÉÊBÉEªÉÉ MɪÉÉ cè * ®É.|É.ºÉ´Éæ. 51´ÉåiÉlÉÉ 55´Éå nÉè® àÉå °ô{ɪÉä àÉÚãªÉ àÉå ÉÊ®{ÉÉä]Ç ÉÊBÉEªÉä MɪÉä +ÉÉÆBÉE½Éå BÉEÉä+ÉãÉMÉ ºÉä BÉE) OÉÉàÉÉÒhÉ FÉäjÉÉå àÉå BÉßEÉÊÉ àÉVÉnÚ®Éå BÉEä ÉÊãÉA JÉ) ¶Éc®ÉÒFÉäjÉÉå àÉå MÉè®-gÉÉÊàÉBÉE BÉEàÉÇSÉÉÉÊ®ªÉÉå BÉEä ÉÊãÉA ={É£ÉÉäBÉDiÉÉ àÉÚãªÉ ºÉÚSÉBÉEÉÆBÉEÉåºÉä ºÉàÉÆÉÊVÉiÉ BÉE® ÉÊnªÉÉ MɪÉÉ iÉÉÉÊBÉE ´Éä 56´Éå nÉè® BÉEä iÉnxÉÖ°ô{ÉÉÒ|ÉSÉÉÊãÉiÉ àÉÚãªÉÉå BÉEä iÉÖãÉxÉÉÒªÉ cÉä VÉÉAÆ *
2.9 ÉÊ´É´É®hÉ 9 ÉÊ´ÉÉÊ£ÉxxÉ nÉè®Éå cäiÉÖ =tÉàÉÉå BÉEä |ÉBÉEÉ® BÉEä+ÉxÉÖºÉÉ® =tÉàÉÉå BÉEÉÒ +ÉxÉÖàÉÉÉÊxÉiÉ ºÉÆJªÉÉ cäiÉÖ iÉÖãÉxÉÉÒªÉ +ÉÉÆBÉE½ä n¶ÉÉÇiÉÉcè * 56´Éå nÉè® cäiÉÖ +ÉÉÆBÉE½å +ÉÉÊJÉãÉ £ÉÉ®iÉ ºiÉ® {É® ºÉ£ÉÉÒ =tÉàÉÉåBÉEÉä ABÉE ºÉÉlÉ ãÉä®xÉä {É® 51´Éå nÉè® BÉEä +ÉÉÆBÉE½Éå BÉEÉ 135.53± lÉÉ*55´Éå nÉè® àÉå +ÉxÉÉè{ÉSÉÉÉÊ®BÉE ÉÊ ÉÉÊxÉàÉÉÇhÉ =tÉàÉÉå BÉEÉÒ +ÉxÉÖàÉÉÉÊxÉiÉ ºÉÆ.142.69 ãÉÉJÉ lÉÉÒ VɤÉÉÊBÉE 56´Éå nÉè® àÉå +ɺÉÆMÉÉÊ~iÉ ÉÊ ÉÉÊxÉàÉÉÇhÉ=tÉàÉÉå BÉEÉÒ +ÉxÉÖàÉÉÉÊxÉiÉ ºÉÆJªÉSÉÉ 170.24 ãÉÉJÉ lÉÉÒ * bÉÒAàÉ<Ç56´Éå nÉè® àÉå +ÉxÉÖàÉÉÉÊxÉiÉ (12±) BÉEÉ +ÉxÉÖ{ÉÉiÉ £ÉÉÒ 51´Éå nÉè® BÉEÉÒiÉÖãÉxÉÉ àÉå 8± +ÉÉÊvÉBÉE lÉÉ *
ÉÊ É´É®hÉÉÒ-9 : 51´Éå, 55´Éå iÉlÉÉ 56´Éå nÉè®Éå àÉå ÉÊ ÉÉÊ£ÉxxÉ =tÉàÉ |ÉBÉEÉ®Éå àÉå =tÉàÉÉå BÉEÉÒ ºÉÆJªÉÉ àÉå {ÉÉÊ®´ÉiÉÇxÉ
+ÉxÉÖàÉÉÉÊxÉiÉ =tÉàÉÉå BÉEÉÒ ºÉÆ.(ºÉèBÉE½É àÉå)
®É.|É.ºÉ´Éæ.ºÉÆ. OÉÉàÉÉÒhÉ ¶Éc®ÉÒ ºÉƪÉÖBÉDiÉ
nÉè® +ÉÉäAAàÉ<Ç AxÉbÉÒAàÉ<Ç ºÉ£ÉÉÒ +ÉÉäAAàÉ<Ç AxÉbÉÒAàÉ<Ç ºÉ£ÉÉÒ +ÉÉäAAàÉ<Ç AxÉbÉÒAàÉ<Ç ºÉ£ÉÉÒ+bÉÒAàÉ<Ç +bÉÒAàÉ<Ç +bÉÒAàÉ<Ç
(1) (2) (3) (4) (5) (6) (7) (8) (9) (10)
56 ÉÉÆ 110582 8764 119346 36072 14824 50895 146654 23587 170241
55 ÉÉÆ 90050 6090 96140 33460 13100 46560 123510 19180 142700
51 ÉÉÆ 86410 8910 95320 20110 10180 30290 106520 19090 125610
2.10 ÉÊ É´É®hÉ 10 ªÉc n¶ÉÉÇiÉÉ cè ÉÊBÉE 56´Éå nÉè® àÉå BÉEÉàÉMÉÉ®ÉåBÉEÉÒ +ÉxÉÖàÉÉÉÊxÉiÉ ºÉÆ.55´Éå nÉè® àÉå BÉEÉàÉMÉÉ®Éå BÉEÉÒ +ÉxÉÖàÉÉÉÊxÉiÉ ºÉÆJªÉɺÉä +ÉÉÊvÉBÉE cè * 56´Éå nÉè® àÉå ºÉ£ÉÉÒ =tÉàÉÉå BÉEÉä ÉÊàÉãÉÉBÉE® BÉEÉàÉMÉÉ®Éå
BÉEÉÒ ºÉÆJªÉÉ 51´Éå nÉè® BÉEä BÉEÉàÉMÉÉ®Éå BÉEÉÒ ºÉÆJªÉÉ BÉEÉ 123.62±lÉÉÒ*

losZ{k.k fg- & 15
ÉÊ É´É®hÉÉÒ-10 : 51´Éå, 55´Éå iÉlÉÉ 56´Éå nÉè®Éå àÉå ÉÊ ÉÉÊ£ÉxxÉ =tÉàÉ |ÉBÉEÉ®Éå àÉå BÉEÉàÉMÉÉ®Éå BÉEÉÒ +ÉxÉÖàÉÉÉÊxÉiÉ ºÉÆJªÉÉ àÉå {ÉÉÊ®´ÉiÉÇxÉ
BÉEÉàÉMÉÉ®Éå BÉEÉÒ +ÉxÉÖàÉÉÉÊxÉiÉ ºÉÆ.(ºÉèBÉE½É àÉå)
®É.|É.ºÉ´Éæ.ºÉÆ. OÉÉàÉÉÒhÉ ¶Éc®ÉÒ ºÉƪÉÖBÉDiÉ
nÉè® +ÉÉäAAàÉ<Ç AxÉbÉÒAàÉ<Ç ºÉ£ÉÉÒ +ÉÉäAAàÉ<Ç AxÉbÉÒAàÉ<Ç ºÉ£ÉÉÒ +ÉÉäAAàÉ<Ç AxÉbÉÒAàÉ<Ç ºÉ£ÉÉÒ+bÉÒAàÉ<Ç +bÉÒAàÉ<Ç +bÉÒAàÉ<Ç
(1) (2) (3) (4) (5) (6) (7) (8) (9) (10)
56 ÉÉÆ 191472 48386 239857 59141 71809 130951 250612 120195 370808
55 ÉÉÆ 148667 28253 176920 55684 64006 119690 204351 92259 296610
51 ÉÉÆ 167160 40910 208070 38440 53450 91890 205610 94360 299970
2.11 ÉÊ É´É®hÉ 11 |ÉSÉÉÊãÉiÉ àÉÚãªÉÉå {É® 56´Éå nÉè® BÉEä ºÉÆMÉiÉ iÉÉÒxÉnÉè®Éå BÉEä ÉÊãÉA ºÉBÉEãÉ ´ÉÉÌvÉiÉ àÉÚãªÉ BÉEÉä n¶ÉÉÇiÉÉ cè * ¶Éc®ÉÒ A´ÉÆOÉÉàÉÉÒhÉ nÉäxÉÉå FÉäjÉÉå BÉEÉä ÉÊàÉãÉÉBÉE® ºÉ£ÉÉÒ =tÉàÉÉå BÉEä ÉÊãÉA VÉÉÒ ÉÉÒA56´Éå nÉè® BÉEÉÒ iÉÖãÉxÉÉ àÉå 55´Éå iÉlÉÉ 51´Éå nÉè® BÉEä ÉÊãÉA µÉEàɶÉ&
88± iÉlÉÉ 68± lÉÉ * <ºÉBÉEÉ iÉÉi{ɪÉÇ ªÉc cè ÉÊBÉE <xÉ +É´ÉÉÊvɪÉÉåàÉå +ÉlÉÇBªÉ´ÉºlÉÉ àÉå BÉEÉ{ÉEÉÒ ´ÉßÉÊr cÖ<Ç lÉÉÒ iÉlÉÉ £ÉÉÊ ÉªÉ àÉå +ÉSUÉÒ£ÉÚÉÊàÉBÉEÉ ÉÊxÉ£ÉÉ ºÉBÉEiÉÉÒ lÉÉÒ *
ÉÊ É´É®hÉÉÒ-11 : 51´Éå, 55´Éå iÉlÉÉ 56´Éå nÉè®Éå àÉå ÉÊ ÉÉÊ£ÉxxÉ =tÉàÉ |ÉBÉEÉ®Éå cäiÉÖ +ÉxÉÖàÉÉÉÊxÉiÉ ´ÉÉÉÌÉBÉE ºÉBÉEãÉ ´ÉÉÌvÉiÉ àÉÚãªÉ(ãÉÉJÉ °ô{ɪÉä àÉå)àÉå {ÉÉÊ®´ÉiÉÇxÉ
+ÉxÉÖàÉÉÉÊxÉiÉ ´ÉÉÉÌÉBÉE ºÉBÉEãÉ ´ÉÉÌvÉiÉ àÉÚãªÉ(ãÉÉJÉ °ô{ɪÉä àÉå)
®É.|É.ºÉ´Éæ.ºÉÆ. OÉÉàÉÉÒhÉ ¶Éc®ÉÒ ºÉƪÉÖBÉDiÉ
nÉè® +ÉÉäAAàÉ<Ç AxÉbÉÒAàÉ<Ç ºÉ£ÉÉÒ +ÉÉäAAàÉ<Ç AxÉbÉÒAàÉ<Ç ºÉ£ÉÉÒ +ÉÉäAAàÉ<Ç AxÉbÉÒAàÉ<Ç ºÉ£ÉÉÒ+bÉÒAàÉ<Ç +bÉÒAàÉ<Ç +bÉÒAàÉ<Ç
(1) (2) (3) (4) (5) (6) (7) (8) (9) (10)
56 ÉÉÆ 16817 9855 26672 8632 24889 33521 25449 34744 60193
55 ÉÉÆ 13816 6649 20466 9054 23523 32578 22870 30172 53044
51 ÉÉÆ 10543 6541 17084 5749 18113 23862 16292 24654 40946

BROAD CONTENTS OF THE LAST THREE ISSUES OF ‘SARVEKSHANA’
(A) 86th ISSUE
Part-I : Technical Papers
1. Magnitude of the Women Work Force in India : An Appraisal of the NSS Estimates and Methods(Paul Jacob)
Part II : Summary and Major Findings of Surveys
2. An Integrated Summary of NSS Fifty-Fifth Round (July 1999 – June 2000) Consumer ExpenditureSurvey Results
(B) 87th ISSUE
Part-I : Summary and Major Findings of Surveys
An Integrated Summary of Employment and Unemployment Survey Results, NSS Fifty-Fifth Round(July 1999-June 2000)(Rattan Chand and G.C. Manna)
(C) 88th ISSUE
Part-I : Technical Papers
1. Report on Cross-Validatioin Study of Estimates of Private Consumpotion Expenditure Availablefrom Household Survey and Ndatioinal Accounts(Expert Group on Non-Sampling errors)
Part-II : Summary and Major Findings of Surveys
2. An Integrated Summary of NSS Fifty-Fifth Round (July 1999-June 2000) Survey Results on InformalSector Employment in India(Asis Roy and Salil Mukhopadhyay)