- 1 - Boston University February 2012 Credibility Marketing.
Upload
brennen-campenCategory
view
215download
1
SARTA: How to do Marketing Research for Your Business Plan.
February 2012

SARTA Leadership Series - Marketing Research 2
TMTG propaganda
VOC(Voice of
Customer)
Expert Research Client Defined
Qualitative
Quantitative
Segmentation Analysis
Customer Satisfactionand LoyaltyCustomer and
Product Requirements
Go To Market Planning
TechnologyAssessment
Product Concept Testing
Pricing
Opportunity Analysis
Post LaunchAcceptance
Technology Sourcing Product CreationLaunch
Preparation Product MonitoringPre-Launch Post-Launch
Healthcare IT
Device and
Diagnostic
Pharma and
Biotech
Medical Imaging
February 15th 2012

SARTA Leadership Series - Marketing Research 3
TMTG Clients (partial list)
February 15th 2012

SARTA Leadership Series - Marketing Research 4
Global coverage
February 15th 2012

SARTA Leadership Series - Marketing Research 5
Agenda
A. Marketing 101: more than a brochure factory!
B. Why bother: validate your marketing plan?
C. Market vs. marketing research
D. How to do this
February 15th 2012

SARTA Leadership Series - Marketing Research 6
MARKET ‘ING
CUSTOMER SELLING
$
A. Marketing 101
February 15th 2012
SARTA Leadership Series - Marketing Research 7
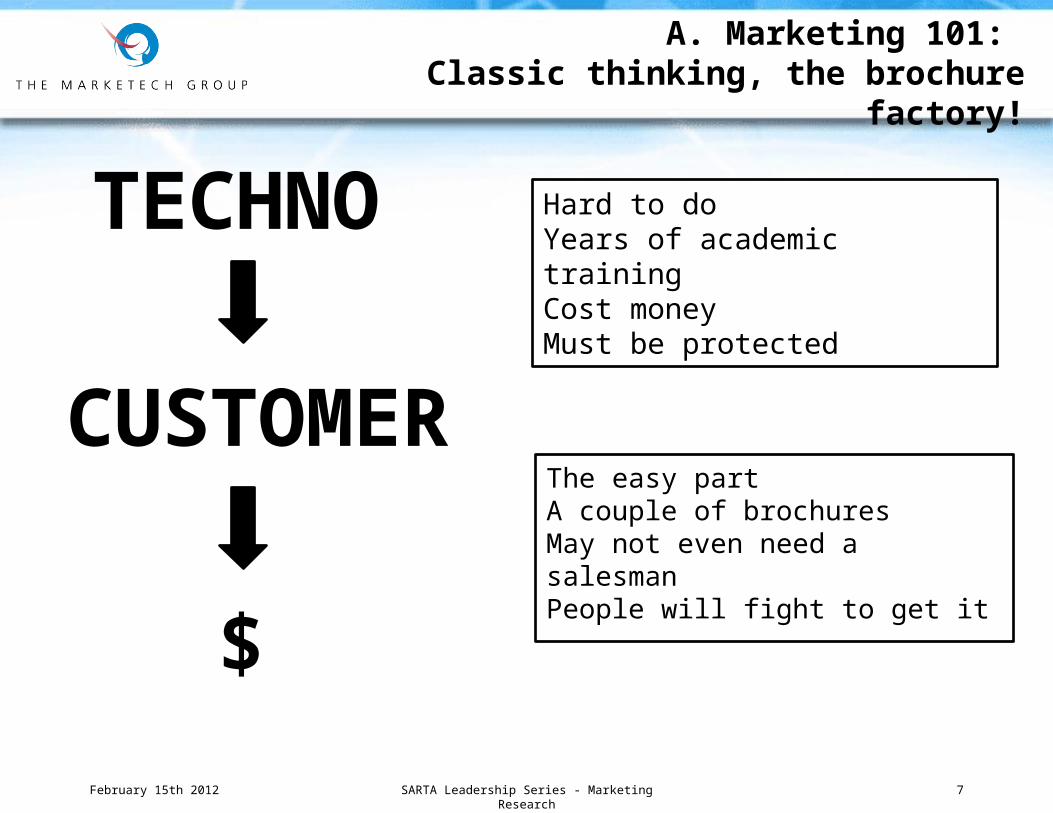
TECHNO
CUSTOMER
$
Hard to doYears of academic trainingCost money Must be protected
The easy partA couple of brochuresMay not even need a salesmanPeople will fight to get it
A. Marketing 101: Classic thinking, the brochure factory!
February 15th 2012

SARTA Leadership Series - Marketing Research 8
CUSTOMER NEED
PRODUCT
DEMAND
Do not tell me you know everything about the customer
“problem” you are trying to solve
Do you have it?
“solution” you bring
This is really what you are after
A. Marketing 101: Correct thought process
February 15th 2012

SARTA Leadership Series - Marketing Research 9
MARKETING
CUSTOMER NEED
PRODUCT
DEMAND
Technology & Service to fulfill an unmet need or rather address a need better.
Right time, right place, right price.
A. Marketing 101:How do we go from product to demand?
February 15th 2012

SARTA Leadership Series - Marketing Research 10
We're doing it backwards: you should always start with a customer problem and find a technical solution to solve the problem– Often we start with technology and then we look
for a problem– That's okay, just don't forget the problem! Without
it, you will never get paid– There are lots of reasons to start a company, but if
you don't get paid, your company will die
A. Marketing 101:Sometimes we go the wrong way
February 15th 2012

SARTA Leadership Series - Marketing Research 11
A. Marketing 101:So you need to VALIDATE THE market
Market
Customer
Competition
Size
Speed
Who is the customer?
Units vs. $?
Who is the enemy?How bad will they
want this?
February 15th 2012

SARTA Leadership Series - Marketing Research 12
STEP 1: to figure out the magnitude of the problem – How many potential customers have it?– How much do they care about the problem?
(does the problem cost them lots of money, horrible disfiguration, or terrible distress?)
Now you have a market
Target
Addressable
TAM
A. Marketing 101:Size and speed …
February 15th 2012
SARTA Leadership Series - Marketing Research 13
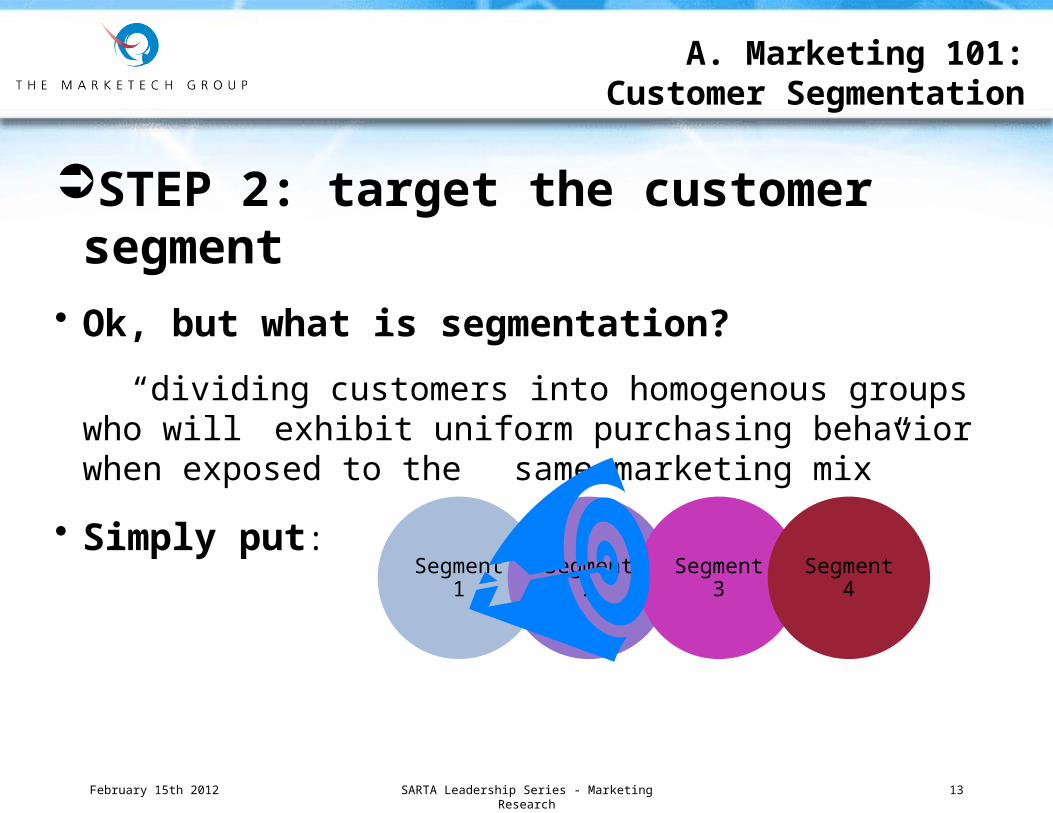
STEP 2: target the customer segment
• Ok, but what is segmentation?
“dividing customers into homogenous groups who will exhibit uniform purchasing behavior when exposed to
the same marketing mix”
• Simply put:
Segment 1 Segment 2 Segment 3 Segment 4
A. Marketing 101:Customer Segmentation
February 15th 2012

SARTA Leadership Series - Marketing Research 14
Technology products follow a predictable adoption cycleby customer type—these types often determine segments
InnovatorsEarly
AdoptersLate
MajorityLaggards
Enthusiasts Visionaries SkepticsConservatives
Time
EarlyMajority
Pragmatists
A. Marketing 101:Customer Adoption Cycle
February 15th 2012

SARTA Leadership Series - Marketing Research 15
It does not allow work that way – so prioritize well.
InnovatorsEarly
AdoptersLate
MajorityLaggards
Enthusiasts Visionaries SkepticsConservatives
Time
EarlyMajority
Pragmatists
$$ $ $$
$$
$
Sometime like this
February 15th 2012

SARTA Leadership Series - Marketing Research 16
TALK TO THE
CUSTOMER (S)ASSESS NEED /
INTEREST IN PRODUCTLook for their reaction and classify them by Psychographics Motivational drivers Purchase behavior / decision making
PRIORITIZE SEGMENTS• Be able to explain why a particular segment will
be attacked first: use rationale like size, affinity for new solutions, or intensity of market need
• What are you going to do next?
TARGET AND POSITION
• Develop your marketing plan to each segment• Adjust your offering• Determine the right price
A. Marketing 101:Positioning
February 15th 2012

SARTA Leadership Series - Marketing Research 17
STEP 3: define your marketing mix
• Message• Push / pull
• Benefits• Value prop
• Channel• Margin vs.
speed
• Model• Sensitivity
/ decision
Price Place
Promo
Product
A. Marketing 101:Marketing mix
February 15th 2012

SARTA Leadership Series - Marketing Research 18
All this is nice ….
But why bother?
February 15th 2012

SARTA Leadership Series - Marketing Research 19
• Market size: VCs focus on it right away, so be honest.– If you can multiply price by the # of potential customers, you can
validate your assumptions about market size– It doesn't matter if you are wrong but if you don't pick a number, we
are going to make our own assumptions
• Price vs. demand: “most contentious” with VC
Make sure you drop the anchor and pick a price– Cost plus, Competitive, EVC (Economic Value to Customer)
Make sure you can be profitable and yet create demand
Get paid now– paid pilot projects validate your market well
B. Why bother: credibility for your investors
February 15th 2012

SARTA Leadership Series - Marketing Research 20
• Product positioning: what is the value proposition?
Consider the different types of new product– Brand new, complement, line extension, brand extension
Define core benefits which make the product a "must buy"
Predict speed to market, product life cycle, and customer adoption patterns
Yes there is competition – Where is your product / service fit ? Which box do you fit in, which
category?
B. Why bother: define your marketing plan
February 15th 2012
SARTA Leadership Series - Marketing Research 21
B. Why bother: define your marketing plan
• Promo: Message, Medium, Budget
Consider the different methods and mockup material– PR, Ad, Sales Incentives (promo), Personal selling– Awareness is generated by your promotional plan
February 15th 2012

SARTA Leadership Series - Marketing Research 22
• Channel: “go to market” is also looked at
Don't recreate the wheel– Don't build out your own channel capabilities if someone else's will
be more effective
Don't be naive– Managing channels effectively is one of the hardest things to do
and can be very costly. – If your assumptions about building out an indirect channel are too
aggressive, you are going to look like an amateur
Remember the customer!– How do they want the product to be made available? – Availability is created by your channel plan
B. Why bother: define your marketing plan
February 15th 2012

SARTA Leadership Series - Marketing Research 23
Market vs. Marketing Research
February 15th 2012

SARTA Leadership Series - Marketing Research 24
• Market research = secondary research– This is a market analysis (size, structure, etc.)– Data is already out there
Examples?
• Marketing research = primary research– This is a VOICE of customer analysis (preference,
perception) – The data do not exist: you need to collect that data– It is hard to do it right (unbiased)
Examples?
C. Market vs. Marketing Research
February 15th 2012

SARTA Leadership Series - Marketing Research 25
• The role of research as a decision making tool– Be an investor, not a gambler
• But you need to be smart about this investment (time and money)
– Follow a rigorous process just like you do it for engineering– Key Steps:
1. Define a problem and scope (why spending $?)2. Design carefully (garbage-in/garbage-out)3. Collect data (scientifically)4. Interpret (define actions)5. Act on findings (leverage your investment)
C. Market vs. Marketing Research
February 15th 2012
SARTA Leadership Series - Marketing Research 26
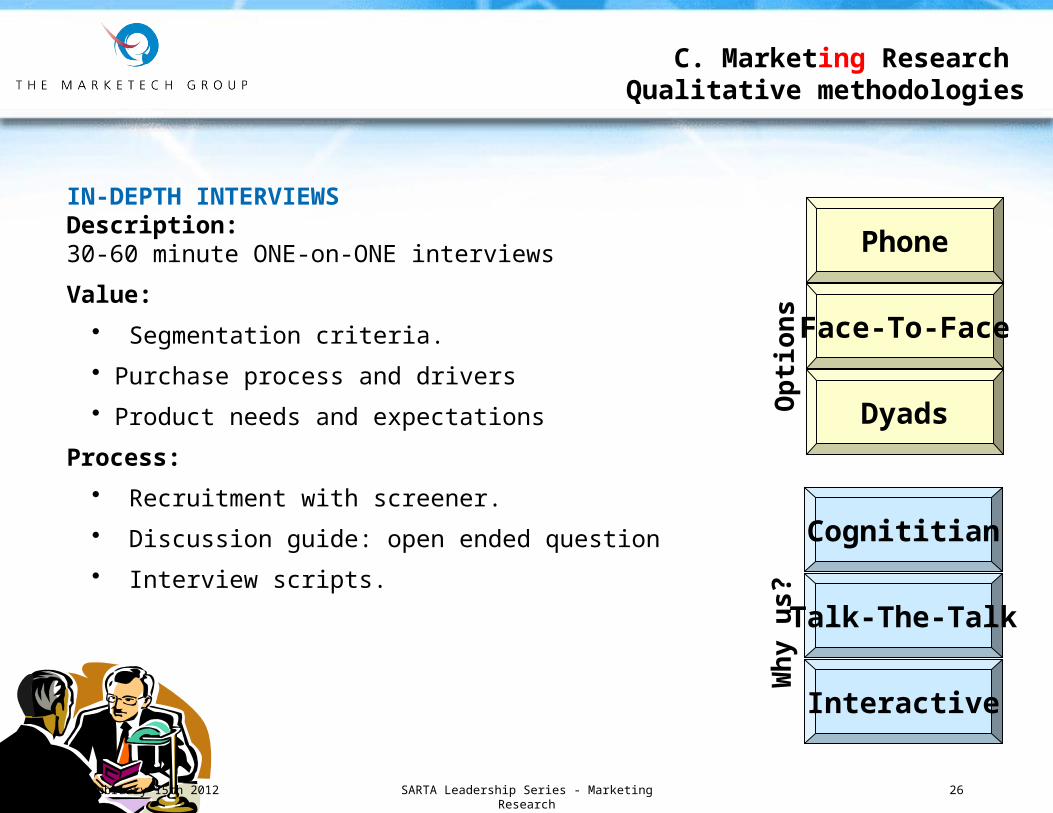
C. Marketing Research Qualitative methodologies
IN-DEPTH INTERVIEWSDescription: 30-60 minute ONE-on-ONE interviews
Value:
• Segmentation criteria.
• Purchase process and drivers
• Product needs and expectations
Process:
• Recruitment with screener.
• Discussion guide: open ended question
• Interview scripts.
Cognititian
Talk-The-Talk
Interactive
Why
us?
Phone
Face-To-Face
Dyads
Opt
ions
February 15th 2012

SARTA Leadership Series - Marketing Research 27
C. Marketing Research Qualitative methodologies
OBSERVATIONAL FIELD WORKDescription:Customer visit analysis.
Value:• Contextual knowledge • Workflow and organizational behavior• Understand product use.
Process:• Customer site selection• Field observation. • .Interview and summaries Non-Intrusive
Deep
Focused
Why
us?
Observation
Cross-Review
Forum
Opt
ions
February 15th 2012
SARTA Leadership Series - Marketing Research 28
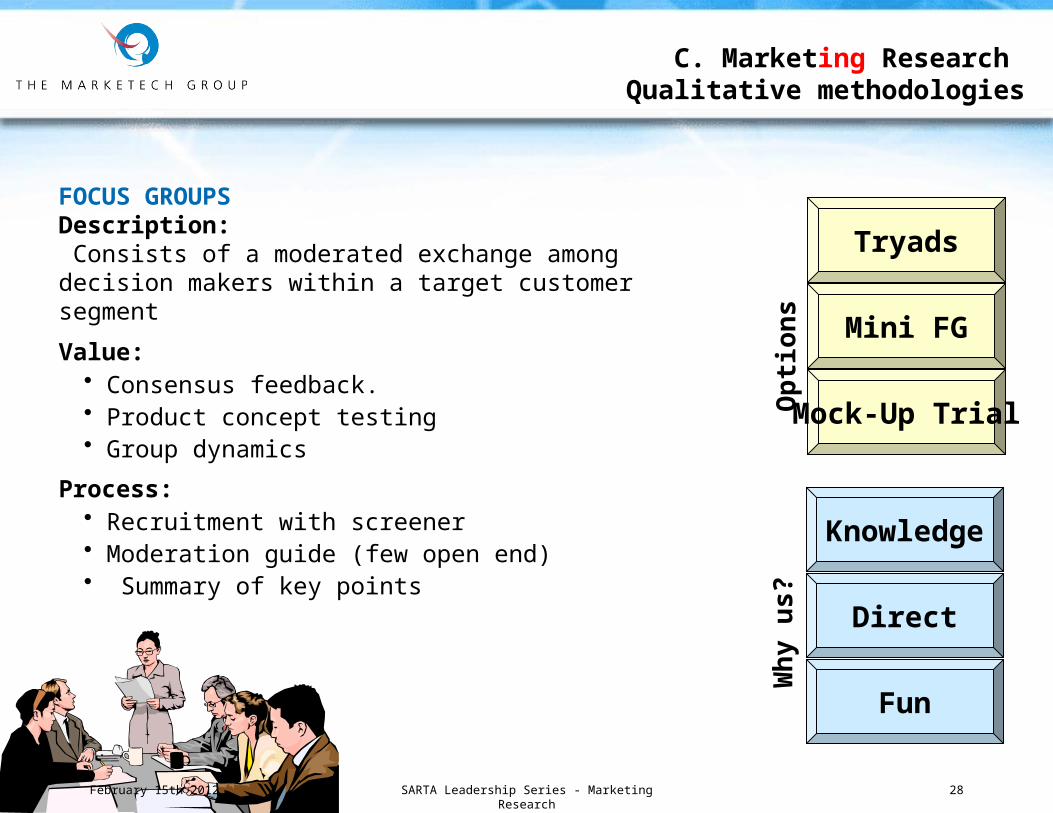
C. Marketing Research Qualitative methodologies
FOCUS GROUPS Description: Consists of a moderated exchange among decision makers within a target customer segment
Value:• Consensus feedback. • Product concept testing• Group dynamics
Process:• Recruitment with screener• Moderation guide (few open end)• Summary of key points
Knowledge
Direct
Fun
Why
us?
Tryads
Mini FG
Mock-Up Trial
Opt
ions
February 15th 2012
SARTA Leadership Series - Marketing Research 29
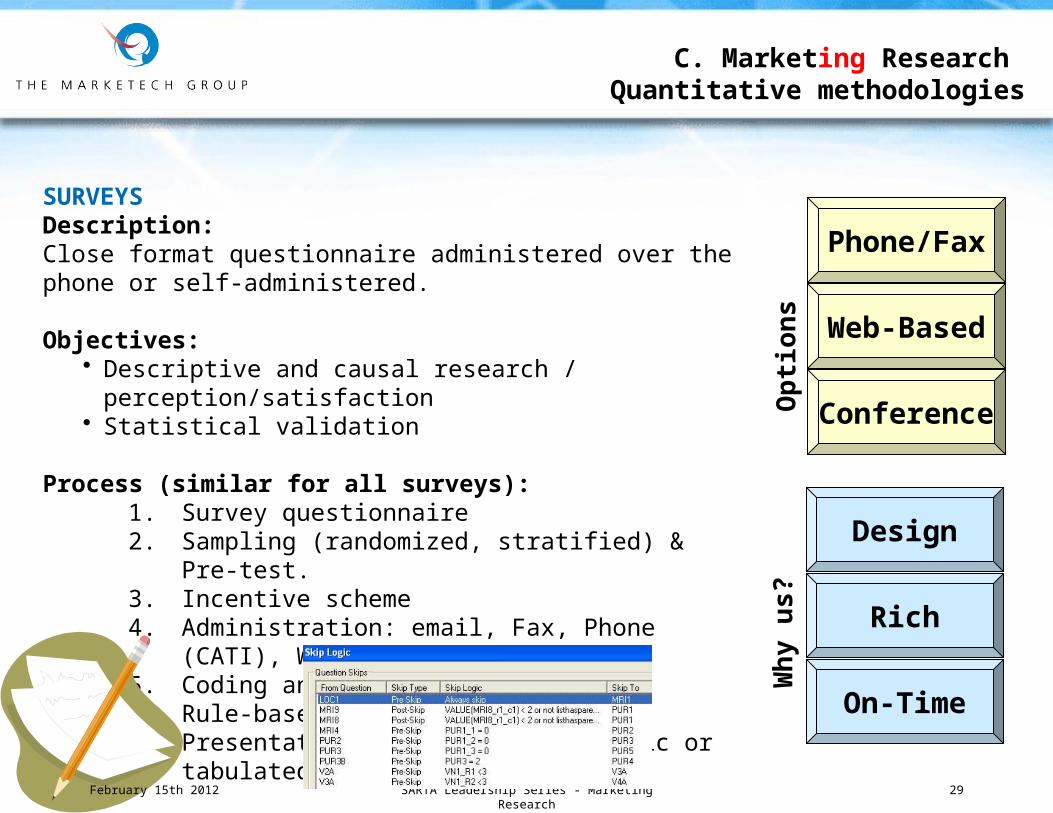
C. Marketing Research Quantitative methodologies
SURVEYSDescription:Close format questionnaire administered over the phone or self-administered.
Objectives:• Descriptive and causal research / perception/satisfaction• Statistical validation
Process (similar for all surveys):1. Survey questionnaire2. Sampling (randomized, stratified) & Pre-test. 3. Incentive scheme4. Administration: email, Fax, Phone (CATI), Web-Based. 5. Coding and editing6. Rule-based data entry and QA. 7. Presentation of results in graphic or tabulated format
Design
Rich
On-Time
Why
us?
Phone/Fax
Web-Based
Conference
Opt
ions
February 15th 2012

February 15th 2012 SARTA Leadership Series - Marketing Research 30
Vendor Perception Map(Ratings based on the combined top tw o highest scores)
0
10
20
30
40
50
Best long-term magnet upgradeability program
Reliable and dependable service
Brand appeals to referring physicians
Represents excellent investment (best value)
Technology innovator
Dedicated, accessible clinical application support teams
Excellent spatial resolutionBest solution for reducing motion artifacts
Fastest patient throughput for my studies
Best coil design and/or handling
Reliable abdominal imaging
Technologists master scanners produce high quality
imaging
Reduce patient anxiety
GE Philips Siemens ToshibaV1 V2 V3 V4
C. Marketing Research Quantitative methodologies: perceptual
maps

February 15th 2012 SARTA Leadership Series - Marketing Research 31
Vendor 1
Vendor 3
Vendor 4
Vendor 2
Best long-term magnet
upgradeability programReliable and dependable service
Brand appeals to referrin
g physicians
Best value
Technology innovator
Dedicated accessible support teams
Excellent spatial resolutionReliable abdominal imaging
Fastest patient throughput
Best coil design and/or handling
Techs master scanners & produce high quality image
Reduce patient anxiety
C. Marketing Research Quantitative methodologies: brand perception
February 15th 2012 SARTA Leadership Series - Marketing Research 32
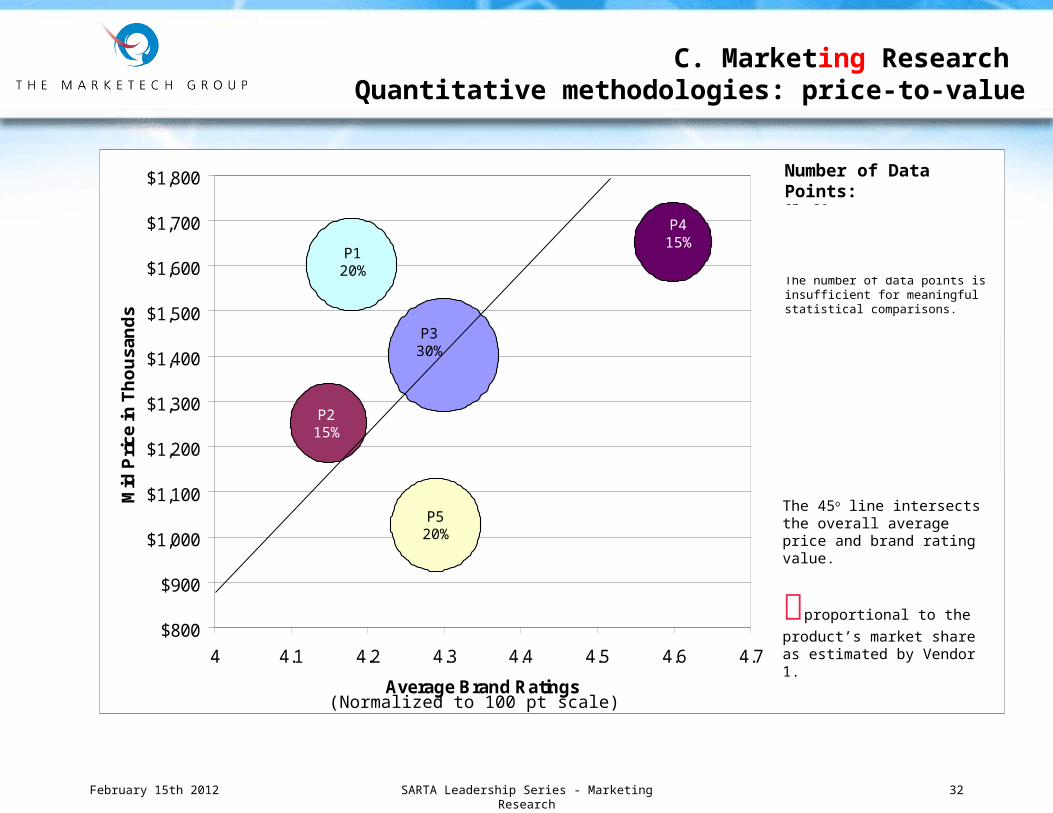
(Normalized to 100 pt scale)
$800
$900
$1,000
$1,100
$1,200
$1,300
$1,400
$1,500
$1,600
$1,700
$1,800
4 4.1 4.2 4.3 4.4 4.5 4.6 4.7
Average Brand Ratings
Mid
Pri
ce in
Th
ou
san
ds
GE Signa Excite HD 1.5T
Philips Achieva 1.5T
Siemens Symphony 1.5T
Siemens Espree 1.5T
Siemens Avanto 1.5T
The 45o line intersects the overall average price and brand rating value.
proportional to the
product’s market share as estimated by Vendor 1.
Number of Data Points:GE: 36Philips: 7Siemens Symphony: 35Siemens Espree: 9Siemens Avanto: 13The number of data points is insufficient for meaningful statistical comparisons.
(Normalized to 100 pt scale)
P415%
P520%
P120%
P330%
P215%
C. Marketing Research Quantitative methodologies: price-to-value

SARTA Leadership Series - Marketing Research 33
C. Marketing Research Quantitative methodologies
CONJOINT/ TRADE-OFF ANALYSESDescription:Objective estimation of the value buyers place on the attributes or features which define products and services.
Value• Predictive rather than descriptive results.• Demand curves, substitution effects, and cannibalization• Quantification of product attribute value trade-offs• Price sensitivity testing
Process:1. Definition of relevant product/service attributes/features 2. Selection of conjoint methodology3. Experimental design to calculate main effects and key interactions 4. Utility / part-worth estimate per respondent5. Simulation mode to predict the impact of changes in product or price
Integration
Expertise
Consultative
Why
us?
Choice-Based
Adaptive
Full-Profile
Opt
ions
February 15th 2012
A DERIVED MEASUREMENT OF YOUR CUSTOMER PREFERENCE SHARE

SARTA Leadership Series - Marketing Research 34
C. Marketing Research Quantitative methodologies: survey screenshot
February 15th 2012
SARTA Leadership Series - Marketing Research
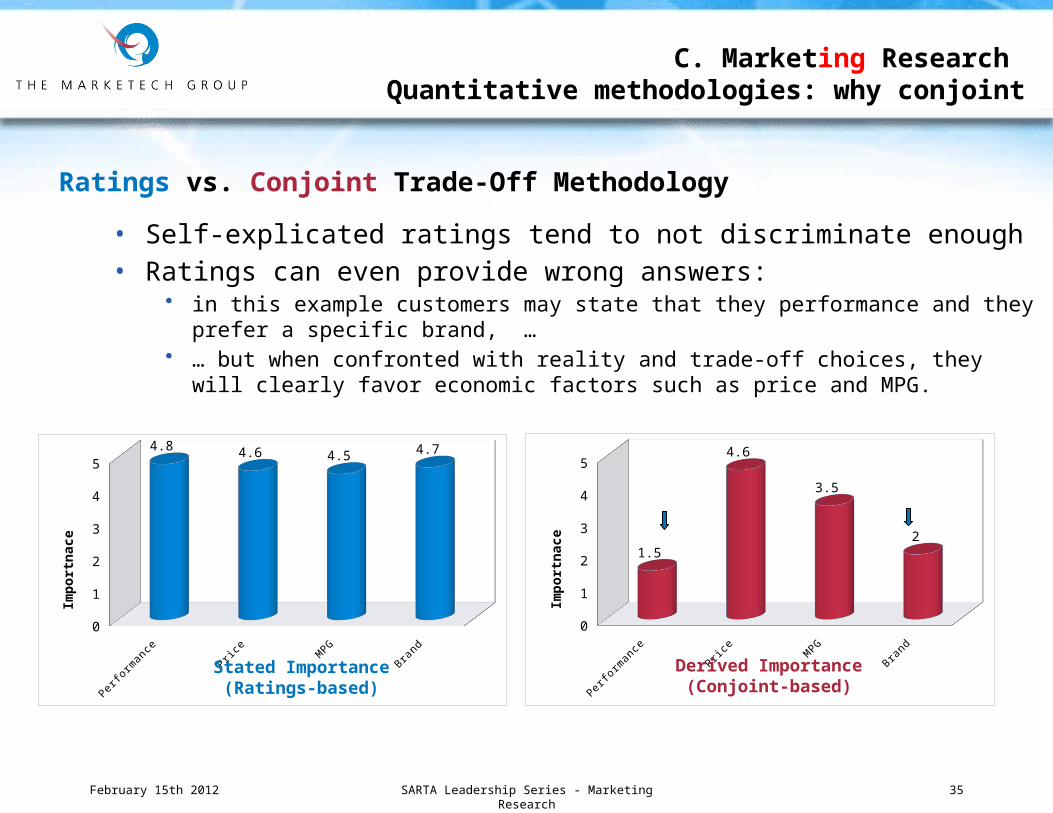
C. Marketing Research Quantitative methodologies: why conjoint
35
Ratings vs. Conjoint Trade-Off Methodology
• Self-explicated ratings tend to not discriminate enough• Ratings can even provide wrong answers:
• in this example customers may state that they performance and they prefer a specific brand, …
• … but when confronted with reality and trade-off choices, they will clearly favor economic factors such as price and MPG.
Perfor
man
cePr
ice
MPG
Brand
00.5
11.5
22.5
33.5
44.5
54.8 4.6 4.5 4.7
Import
nace
Stated Importance(Ratings-based) Pe
rfor
man
cePr
ice
MPG
Brand
00.5
11.5
22.5
33.5
44.5
5
1.5
4.6
3.5
2Im
port
nace
Derived Importance(Conjoint-based)
February 15th 2012

SARTA Leadership Series - Marketing Research 36
C. Marketing Research Quantitative methodologies
MODELING / SIMULATION Description:A family of methodologies for simulating real-world market behaviors in order to predict expected outcomes.
Value:• Decision-support• Forecast and prediction• Pricing
Data Access
Health Economics
Partnerships
Why
us?
Decision Trees
Markov Models
Monte CarloSimulation
Opt
ions
February 15th 2012

SARTA Leadership Series - Marketing Research 37
D. How to do this
1. Sizing the market• TAM = from secondary data• Unmet need = from voice of customer
2. Customer segmentation• Behavior = from VOC
3. Value prop• Competitive benchmarking• SWOT
4. Pricing vs. adoption• Elasticity • Modeling
February 15th 2012

SARTA Leadership Series - Marketing Research 38
D. How to do this:Sizing the market
• Secondary analysis• Market reports• Web• Gvt data• Associations / trade
groups
• Count the units first
February 15th 2012
TAM
Units x count
Addressable 1
Addressable 1
First YEAR
Segment specific
Adoption curve
$
Annual Market Size (DEVICE + Consumables) $276,128,711 $ASPAnnual Market Size of DEVICE $27,624,046 $1,875
Annual Market Size of Consumables $248,504,665 $10.32*Includes Universa l
Consumables
Forecasted Growth (3 yrs; 12% CAGR) 2011 2013 2014Total Annual Market Size for DEVICE and Consumables 276,128,711 $346,375,855 $387,940,958
Annual Market Size Opportunity Annual Sales % brand Sales $27,624,046 10%Branded Consumables Sales $246,095,759 89%Universal Consumables Sales $2,408,906 1%
Market size by Public / Private Segments Total # of Beds % of Market Market ValuePublic Hospital Market 372,811 74% $204,568,177Private Hospital Market 130,414 26% $71,560,534
DEVICE Market Size Total Install Base $ASP Annual RevenuesVolumetric DEVICE 338,855 $1,875 $25,414,122Syringe DEVICE 29,466 $1,875 $2,209,924TOTALS 368,321 $27,624,046Total Annual Market Size for DEVICE $27,624,046
Consumables Market Size Annual Units Sold Annual Revenues % of RevenueBranded Medication Consumables Use per Year 19,512,138 $221,486,183 80%Branded Nutritional Consumables Use per Year 2,168,015 $24,609,576 9%Universal Consumables (Medication + Nutritional) 2,408,906 $2,408,906 1%Total Annual Market Size for Consumables s 24,089,060 $248,504,665
brand Market Opportunity
Consumables Market Opportunity
Total Market Opportunity
DEVICE and Consumables Market Size in BrazilSeptember 2011
Market Size by Market Segment
10%
89%
1%
Annual Revenue by Product Line
brand Sales
Branded Consumables Sales
Universal Consumables Sales
$200,000,000
$220,000,000
$240,000,000
$260,000,000
$280,000,000
$300,000,000
$320,000,000
$340,000,000
$360,000,000
$380,000,000
$400,000,000
2011 2012 2013 2014
Forecasted Annual Annual Market Size

SARTA Leadership Series - Marketing Research 39
D. How to do this:Need Assessment & Customer segmentation
• ASK the customer
February 15th 2012
SEGMENTATION
Segment 1
Segment 2
Segment 3
Customer
Custom
er
Customer
untargeted, suboptimal sales potential
cost effective, time efficient, standardized
set of segments with identified requirements
YOUR CUSTOMER
MARKETING RESEARCH
THE RESULT
Customer
Custom
er
Customer
Customer
Price is Key Service
is Valued
Product Quality

SARTA Leadership Series - Marketing Research 40
D. How to do this:Value proposition and positioning
• SWOT • Competitive table
February 15th 2012
YOU Comp 1 Comp 2 Comp 3
Feature 1 Feature 2 Feature 3 Feature 4 Feature 5 Feature 6 Feature 7 Feature 8
S: we are the best
O: world is ours
W: not bold enough
T: uneducated customers
Customer research will help correct any potential myopia

SARTA Leadership Series - Marketing Research 41
D. How to do this:Pricing vs. adoption
• Price sensitivity • Preference model
February 15th 2012
Market simulators
Price vs. adoption

SARTA Leadership Series - Marketing Research 42
1. Market sizing– TAM– Addressable
Okay, let's try it…
February 15th 2012

SARTA Leadership Series - Marketing Research 43
2. Value proposition and customer segmentation Let us define the top 10 questions we would ask a potential
customer of the following product
– Motivation: if you collect good information, you can learn valuable information to refine your business model
– You probably won't learn everything with one or two customers, you need to decide how much data validity you need (directional vs. accurate)
Okay, let's try it…
February 15th 2012

SARTA Leadership Series - Marketing Research 44
3. Competitive positioning– From customer data– From intelligence
Okay, let's try it…
February 15th 2012

SARTA Leadership Series - Marketing Research 45
4. Price vs. demand (adoption)– You would need to decide if you want to spend
money in a large scale survey
Okay, let's try it…
February 15th 2012

SARTA Leadership Series - Marketing Research 46
Remember:
• Be open minded • Accept study findings• Interpret what this means• Implement • Measure again
February 15th 2012

Contact Us
February 15th 2012 SARTA Leadership Series - Marketing Research 47
www.themarketechgroup.com
USA502 Mace Blvd, Suite 15Davis, CA 95618 United StatesPhone: (+1) 530-792-8400Fax: (+1) 530-792-8447
EUROPE / FRANCE3, rue Emile Péhant44 000 Nantes FrancePhone: +33 (0)2 72 01 00 80Fax: +33 (0)2 40 48 29 40
BRASILRua Girassol 756-82Sao Paulo, SP Brasil
05433-001Phone: +55 (11) 8799-0507