SART Phase IV Reaches B & C Project
127
SART Phase IV Reaches B & C Project Air Quality and Greenhouse Gas Assessment Redlands, California Prepared For: COUNTY OF SAN BERNARDINO DEPARTMENT OF PUBLIC WORKS 825 EAST THIRD STREET SAN BERNARDINO, CA 92415 July 2018
Transcript of SART Phase IV Reaches B & C Project

SART Phase IV Reaches B & C Project
Air Quality and Greenhouse Gas Assessment
Redlands, California
Prepared For:
COUNTY OF SAN BERNARDINO DEPARTMENT OF PUBLIC WORKS
825 EAST THIRD STREET SAN BERNARDINO, CA 92415
July 2018

Air Quality and Greenhouse Gas Assessment – SART Phase IV Reaches B & C Project
ECORP Consulting Inc. SART Phase IV Reaches B & C Project i July 2018
2018-114
CONTENTS
1.0 Introduction ........................................................................................................................................................................... 1
1.1 Project Description and Location.................................................................................................................. 1
2.0 Air Quality ............................................................................................................................................................................... 3
2.1 Air Quality Setting ............................................................................................................................................... 3
2.2 Regulatory Framework ...................................................................................................................................... 7
2.3 Air Quality Emissions Impact Assessment .............................................................................................. 10
3.0 Greenhouse Gas Emissions ........................................................................................................................................... 25
3.1 Greenhouse Gas Setting ................................................................................................................................ 25
3.2 Regulatory Framework ................................................................................................................................... 27
3.3 Greenhouse Gas Emissions Impact Assessment .................................................................................. 30
4.0 References ........................................................................................................................................................................... 36
LIST OF TABLES
Table 2-1. Criteria Air Pollutants- Summary of Common Sources and Effects ............................................................ 5
Table 2-2. Summary of Ambient Air Quality Data ................................................................................................................... 6
Table 2-3. Attainment Status of Criteria Pollutants in the San Bernardino County Portion of South Coast Air Basin ................................................................................................................................................................................................... 7
Table 2-4. SCAQMD Regional Significance Thresholds – Pounds per Day ................................................................ 11
Table 2-5. Local Significance Thresholds (Construction / Operations) ........................................................................ 11
Table 2-6. Construction-Related Emissions (Regional Significance Analysis) ........................................................... 13
Table 2-7. Construction-Related Emissions (EPA Conformity Determination Analysis) ........................................ 14
Table 2-8. Equipment-Specific Grading Rates ....................................................................................................................... 15
Table 2-9. Construction-Related Emissions (Localized Significance Analysis) .......................................................... 17
Table 3-1. Greenhouse Gases ....................................................................................................................................................... 26
Table 3-2. Construction-Related Greenhouse Gas Emissions .......................................................................................... 34
ATTACHMENTS
Attachment A – CalEEMod Output File

Air Quality and Greenhouse Gas Assessment – SART Phase IV Reaches B & C Project
ECORP Consulting Inc. SART Phase IV Reaches B & C Project 1 July 2018
2018-114
1.0 INTRODUCTION
This report documents the results of an assessment of both air quality and greenhouse gas emissions (GHG) completed for the SART Phase IV Reaches B & C Project (Project), which includes the construction of a 3.2-mile-long section of the Santa Ana River Trail (SART) in Redlands. This assessment was prepared using methodologies and assumptions recommended in the rules and regulations of the South Coast Air Quality Management District (SCAQMD), the Greenhouse Gas Emissions Reduction Plan of the County of San Bernardino, and the Climate Action Plan of the City of Redlands. Regional and local existing conditions are presented, along with pertinent emissions standards and regulations. The purpose of this assessment is to estimate Project-generated criteria air pollutants and GHG emissions attributable to the Project and to determine the level of impact the Project would have on the environment.
1.1 Project Description and Location
The County of San Bernardino Regional Parks Department (Regional Parks), with the assistance of the County of San Bernardino Department of Public Works (Department of Public Works), proposes to construct an approximately 3.2-mile-long section of the SART on the southern bank of the Santa Ana River and local streets within the City of Redlands. The SART is a regional recreational trail. Segments of the trail within San Bernardino County have been constructed in various sections (phases) with projects named sequentially. This analysis pertains to the Phase IV Reaches B & C section of the SART. The trail would begin on the west side of Orange Street in the City of Redlands and terminate at Opal Avenue near the Redlands city limits.
East of Orange Street, the conceptual trail alignment overlaps a local trail known as the “Bluffs Trail.” At River Bend Drive, the alignment takes off from the river bluff and transitions on to the local city streets in Redlands. The trail travels south on River Bend Drive, east on Pioneer Avenue, and north back to the river bluff on Judson Street (east side of the street). From Judson Street, the trail continues easterly on the river bluff on the north side of the Redlands Municipal Airport property until it reaches Opal Avenue.
The trail segments on the river bluffs would consist of a 10-foot wide asphalt/concrete trail with 2-foot graded shoulder consisting of decomposed granite on each side of the asphalt/concrete trail. On the public right-of-way, the existing road surface would be widened where possible and/or standard bicycle lane stripping would be used to mark the alignment on the existing road surfaces. Under existing conditions, portions of Pioneer Avenue do not have curb and gutter. Where possible, ultimate curb and gutter would be constructed as part of the Project.
In general, construction activities associated with development of the trail would include excavation and grading; construction of embankments and/or retaining walls; construction of storm drains, headwalls, and slope protection; construction of asphalt concrete dike, curb and gutter; installation of fencing, railing, access gates, trail delineators, and signage; painting of pavement striping and pavement markings; and construction of appurtenant features. The subject segment of the SART includes one bridge over Orange Street in the City of Redlands. Additionally, a drop down arch culvert (approximately 3 feet) may be used to span a potentially jurisdictional channel north of the airport.

Air Quality and Greenhouse Gas Assessment – SART Phase IV Reaches B & C Project
ECORP Consulting Inc. SART Phase IV Reaches B & C Project 2 July 2018
2018-114
Four preliminary staging areas have been identified. Equipment staging and borrow/disposal during Project construction may potentially occur at: (1) a vacant lot on the east side of Orange Street in the immediate vicinity of the proposed bridge construction area; (2) on disturbed vacant lands on the north side of Riverview Drive; (3) on the disturbed lands within the Judson Street right-of-way; and, (4) on disturbed lands near the trail terminus at Opal Avenue.

Air Quality and Greenhouse Gas Assessment – SART Phase IV Reaches B & C Project
ECORP Consulting Inc. SART Phase IV Reaches B & C Project 3 July 2018
2018-114
2.0 AIR QUALITY
2.1 Air Quality Setting
Air quality in a region is determined by its topography, meteorology, and existing air pollutant sources. These factors are discussed below, along with the current regulatory structure that applies to the South Coast Air Basin (SoCAB), which encompasses the Project site, pursuant to the regulatory authority of the South Coast Air Quality Management District (SCAQMD).
Ambient air quality is commonly characterized by climate conditions, the meteorological influences on air quality, and the quantity and type of pollutants released. The air basin is subject to a combination of topographical and climatic factors that reduce the potential for high levels of regional and local air pollutants. The following section describes the pertinent characteristics of the air basin and provides an overview of the physical conditions affecting pollutant dispersion in the Project area.
South Coast Air Basin
The California Air Resources Board (CARB) divides the state into air basins that share similar meteorological and topographical features. Redlands lies in the SoCAB, which includes the non-desert portions of Los Angeles, Riverside, and San Bernardino counties and all of Orange County. The air basin is on a coastal plain with connecting broad valleys and low hills and is bounded by the Pacific Ocean on the southwest, with high mountains forming the remainder of the perimeter (SCAQMD 1993).
Temperature and Precipitation
The air basin is part of a semi-permanent high-pressure zone in the eastern Pacific. As a result, the climate is mild, tempered by cool sea breezes. This usually mild weather pattern is interrupted infrequently by periods of extremely hot weather, winter storms, and Santa Ana winds. The annual average temperature varies little throughout the 6,645-square-mile SoCAB, ranging from the low 60s to the high 80s, measured in degrees Fahrenheit (°F). With a more pronounced oceanic influence, coastal areas show less variability in annual minimum and maximum temperatures than inland areas (SCAQMD 1993).
In contrast to a very steady pattern of temperature, rainfall is seasonally and annually highly variable. Almost all annual rains fall between November and April. Summer rainfall is normally restricted to widely scattered thundershowers near the coast, with slightly heavier shower activity in the east and over the mountains.
Humidity
Although the SoCAB has a semiarid climate, the air near the earth’s surface is typically moist because of the presence of a shallow marine layer. Except for infrequent periods when dry, continental air is brought into the SoCAB by offshore winds, the “ocean effect” is dominant. Periods of heavy fog, especially along the coast, are frequent, and low clouds, often referred to as high fog, are a characteristic climatic feature. Annual average humidity is 70 percent at the coast and 57 percent in the eastern portions of the SoCAB (SCAQMD 1993).

Air Quality and Greenhouse Gas Assessment – SART Phase IV Reaches B & C Project
ECORP Consulting Inc. SART Phase IV Reaches B & C Project 4 July 2018
2018-114
Wind
Wind patterns across the south coastal region are characterized by westerly or southwesterly onshore winds during the day and by easterly or northeasterly breezes at night. Wind speed is higher during the dry summer months than during the rainy winter.
Between periods of wind, air stagnation may occur in both the morning and evening hours. Air stagnation is one of the critical determinants of air quality conditions on any given day. During the winter and fall, surface high-pressure systems over the SoCAB, combined with other meteorological conditions, can result in very strong, downslope Santa Ana winds. These winds normally continue a few days before predominant meteorological conditions are reestablished.
The mountain ranges to the east affect the diffusion of pollutants by inhibiting the eastward transport of pollutants. Air quality in the SoCAB generally ranges from fair to poor and is similar to air quality in most of coastal Southern California. The entire region experiences heavy concentrations of air pollutants during prolonged periods of stable atmospheric conditions (SCAQMD 1993).
Inversions
In conjunction with the two characteristic wind patterns that affect the rate and orientation of horizontal pollutant transport, two similarly distinct types of temperature inversions control the vertical depth through which pollutants are mixed. These inversions are the marine/subsidence inversion and the radiation inversion. The height of the base of the inversion at any given time is known as the “mixing height.” The combination of winds and inversions is a critical determinant leading to highly degraded air quality in the summer and generally good air quality in the winter in the region (SCAQMD 1993).
Criteria Air Pollutants
Criteria air pollutants are defined as those pollutants for which the federal and state governments have established air quality standards for outdoor or ambient concentrations to protect public health with a determined margin of safety. Ozone (O3), course particulate matter (PM10), and fine particulate matter (PM2.5) are generally considered to be regional pollutants because they or their precursors affect air quality on a regional scale. Pollutants such as carbon monoxide (CO), nitrogen dioxide (NO2), and sulfur dioxide (SO2) are considered to be local pollutants because they tend to accumulate in the air locally. PM is also considered a local pollutant. Health effects commonly associated with criteria pollutants are summarized in Table 2-1.

Air Quality and Greenhouse Gas Assessment – SART Phase IV Reaches B & C Project
ECORP Consulting Inc. SART Phase IV Reaches B & C Project 5 July 2018
2018-114
Table 2-1. Criteria Air Pollutants- Summary of Common Sources and Effects
Pollutant Major Man-Made Sources Human Health & Welfare Effects
CO An odorless, colorless gas formed when carbon in fuel is not burned completely; a component of motor vehicle exhaust.
Reduces the ability of blood to deliver oxygen to vital tissues, effecting the cardiovascular and nervous system. Impairs vision, causes dizziness, and can lead to unconsciousness or death.
NO2
A reddish-brown gas formed during fuel combustion for motor vehicles, energy utilities and industrial sources.
Respiratory irritant; aggravates lung and heart problems. Precursor to ozone and acid rain. Causes brown discoloration of the atmosphere.
O3
Formed by a chemical reaction between reactive organic gases (ROGs) and nitrous oxides (NOx) in the presence of sunlight. Common sources of these precursor pollutants include motor vehicle exhaust, industrial emissions, solvents, paints and landfills.
Irritates and causes inflammation of the mucous membranes and lung airways; causes wheezing, coughing and pain when inhaling deeply; decreases lung capacity; aggravates lung and heart problems. Damages plants; reduces crop yield.
PM10 & PM2.5
Power plants, steel mills, chemical plants, unpaved roads and parking lots, wood-burning stoves and fireplaces, automobiles and others.
Increased respiratory symptoms, such as irritation of the airways, coughing, or difficulty breathing; aggravated asthma; development of chronic bronchitis; irregular heartbeat; nonfatal heart attacks; and premature death in people with heart or lung disease. Impairs visibility (haze).
SO2
A colorless, nonflammable gas formed when fuel containing sulfur is burned. Examples are refineries, cement manufacturing, and locomotives.
Respiratory irritant. Aggravates lung and heart problems. Can damage crops and natural vegetation. Impairs visibility.
Source: CAPCOA 2011
Toxic Air Contaminants
In addition to the criteria pollutants discussed above, toxic air contaminants (TACs) are another group of pollutants of concern. TACs are considered either carcinogenic or noncarcinogenic based on the nature of the health effects associated with exposure to the pollutant. For regulatory purposes, carcinogenic TACs are assumed to have no safe threshold below which health impacts would not occur, and cancer risk is expressed as excess cancer cases per one million exposed individuals. Noncarcinogenic TACs differ in that there is generally assumed to be a safe level of exposure below which no negative health impact is believed to occur. These levels are determined on a pollutant-by-pollutant basis.
There are many different types of TACs, with varying degrees of toxicity. Sources of TACs include industrial processes such as petroleum refining and chrome plating operations, commercial operations such as gasoline stations and dry cleaners, and motor vehicle exhaust. Public exposure to TACs can result from emissions from normal operations, as well as from accidental releases of hazardous materials during upset conditions. The health effects of TACs include cancer, birth defects, neurological damage, and death.
According to the California Air Resources Board’s (CARB) California Almanac of Emissions and Air Quality (2005), the majority of the estimated health risk from TACs can be attributed to relatively few compounds,

Air Quality and Greenhouse Gas Assessment – SART Phase IV Reaches B & C Project
ECORP Consulting Inc. SART Phase IV Reaches B & C Project 6 July 2018
2018-114
the most important being PM from diesel-fueled engines (diesel PM). Diesel PM has been identified as a human carcinogen and contains hundreds of different gaseous and particulate components, many of which are toxic. Diesel particles are so small that they penetrate deep into the lungs. Studies show that diesel PM concentrations are much higher near heavily traveled highways and intersections. Off-road construction equipment and heavy-duty trucks are considered major sources of diesel-related emissions.
Ambient Air Quality
Ambient air quality at the Project site can be inferred from ambient air quality measurements conducted at nearby air quality monitoring stations. CARB maintains over 60 monitoring stations throughout California. The Rubidoux - Mission Boulevard (5888 Mission Boulevard, Riverside CA 92509) air quality monitoring station, located approximately 16 miles southwest of the development site, is the closest station to the site. The Rubidoux - Mission Boulevard monitoring station monitors ambient concentrations of O3, PM2.5, PM10. Ambient emission concentrations will vary due to localized variations in emission sources and climate and should be considered “generally” representative of ambient concentrations in the development area.
Table 2-2 summarizes the published data concerning O3, PM2.5, PM10 since 2015 from the Rubidoux - Mission Boulevard monitoring station for each year that the monitoring data is provided.
Table 2-2. Summary of Ambient Air Quality Data
Pollutant Standards 2015 2016 2017
O3
Max 1-hour concentration (ppm) 0.132 0.142 0.145
Max 8-hour concentration (ppm) (state/federal) 0.106 / 0.105 0.105 / 0.104 0.119 / 0.118
Number of days above state 1-hour standard 31 33 47
Number of days above 8-hour standard (state/federal) 59 / 55 71 / 69 82 / 81
PM10
Max 24-hour concentration (µg/m3) (state/federal) 107.4 / 69.0 170.5 / 84.0 137.6 / 92.0
Number of days above 24-hour standard (state/federal) 92.2 / 0 * / 0 102.5 / 0
PM2.5
Max 24-hour concentration (µg/m3) (state/federal) 61.1 / 54.7 60.8 / 51.5 50.3 / 50.3
Number of days above federal 24-hour standard 10.3 5.1 7.2
Source: CARB 2018 μg/m3 = micrograms per cubic meter; ppm = parts per million * = Insufficient data available
The attainment status for the SoCAB is included in Table 2-3. Areas that meet ambient air quality standards are classified as attainment areas, while areas that do not meet these standards are classified as

Air Quality and Greenhouse Gas Assessment – SART Phase IV Reaches B & C Project
ECORP Consulting Inc. SART Phase IV Reaches B & C Project 7 July 2018
2018-114
nonattainment areas. Areas for which there is insufficient data available are designated unclassified. The region is designated as a nonattainment area for the federal ozone and PM2.5 standards, and is also a nonattainment area for the state standards for state ozone, PM10, and PM2.5 standards (CARB 2017a).
Table 2-3. Attainment Status of Criteria Pollutants in the San Bernardino County Portion of South Coast Air Basin
Pollutant State Designation Federal Designation
O3 Nonattainment Nonattainment
PM10 Nonattainment Attainment
PM2.5 Nonattainment Nonattainment
CO Attainment Unclassified/Attainment
NO2 Attainment Unclassified/Attainment
SO2 Attainment Attainment
Source: CARB 2017a
2.2 Regulatory Framework
Federal
Clean Air Act
The Clean Air Act (CAA) of 1970 and the CAA Amendments of 1971 required the US Environmental Protection Agency (EPA) to establish the National Ambient Air Quality Standards (NAAQS), with states retaining the option to adopt more stringent standards or to include other specific pollutants. On April 2, 2007, the Supreme Court found that carbon dioxide is an air pollutant covered by the CAA; however, no NAAQS have been established for carbon dioxide.
These standards are the levels of air quality considered safe, with an adequate margin of safety, to protect the public health and welfare. They are designed to protect those “sensitive receptors” most susceptible to further respiratory distress such as asthmatics, the elderly, very young children, people already weakened by other disease or illness, and persons engaged in strenuous work or exercise. Healthy adults can tolerate occasional exposure to air pollutant concentrations considerably above these minimum standards before adverse effects are observed.
The EPA has classified air basins (or portions thereof) as being in attainment, nonattainment, or unclassified for each criteria air pollutant, based on whether or not the NAAQS have been achieved. If an area is designated unclassified, it is because inadequate air quality data were available as a basis for a nonattainment or attainment designation. Table 2-3 lists the federal attainment status of the SoCAB for the criteria pollutants.

Air Quality and Greenhouse Gas Assessment – SART Phase IV Reaches B & C Project
ECORP Consulting Inc. SART Phase IV Reaches B & C Project 8 July 2018
2018-114
State
California Clean Air Act
The California Clean Air Act (CCAA) allows states to adopt ambient air quality standards and other regulations provided that they are at least as stringent as federal standards. CARB, a part of the California Environmental Protection Agency, is responsible for the coordination and administration of both federal and state air pollution control programs within California, including setting the California ambient air quality standards. CARB also conducts research, compiles emission inventories, develops suggested control measures, and provides oversight of local programs. CARB establishes emissions standards for motor vehicles sold in California, consumer products (such as hairspray, aerosol paints, and barbecue lighter fluid), and various types of commercial equipment. It also sets fuel specifications to further reduce vehicular emissions. CARB also has primary responsibility for the development of California’s State Implementation Plan (SIP), for which it works closely with the federal government and the local air districts.
California State Implementation Plan
The federal Clean Air Act (and its subsequent amendments) requires each state to prepare an air quality control plan referred to as the SIP. The SIP is a living document that is periodically modified to reflect the latest emissions inventories, plans, and rules and regulations of air basins as reported by the agencies with jurisdiction over them. The CAA Amendments dictate that states containing areas violating the national ambient air quality standards revise their SIPs to include extra control measures to reduce air pollution. The SIP includes strategies and control measures to attain the NAAQS by deadlines established by the Clean Air Act. The EPA has the responsibility to review all State Implementation Plans to determine if they conform to the requirements of the CAA.
State law makes CARB the lead agency for all purposes related to the SIP. Local air districts and other agencies prepare SIP elements and submit them to CARB for review and approval. CARB then forwards SIP revisions to the EPA for approval and publication in the Federal Register. The “2016 Air Quality Management Plan” (2016 AQMP) is the SIP for the SoCAB. The 2016 AQMP is a regional blueprint for achieving air quality standards and healthful air in the SoCAB and those portions of the Salton Sea Air Basin (SSAB) that are under SCAQMD’s jurisdiction. The 2016 AQMP represents a new approach, focusing on available, proven, and cost-effective alternatives to traditional strategies, while seeking to achieve multiple goals in partnership with other entities promoting reductions in greenhouse gases and toxic risk, as well as efficiencies in energy use, transportation, and goods movement. The most effective way to reduce air pollution impacts is to reduce emissions from mobile sources. The AQMP relies on a regional and multi-level partnership of governmental agencies at the federal, state, regional, and local level. These agencies (EPA, CARB, local governments, Southern California Association of Governments [SCAG] and the SCAQMD) are the primary agencies that implement the AQMP programs. The 2016 AQMP incorporates the latest scientific and technical information and planning assumptions, including SCAG’s latest Regional Transportation Plan/Sustainable Communities Strategy (RTP/SCS), updated emission inventory methodologies for various source categories, and SCAG's latest growth forecasts. The 2016 AQMP includes integrated strategies and measures to meet the NAAQS.

Air Quality and Greenhouse Gas Assessment – SART Phase IV Reaches B & C Project
ECORP Consulting Inc. SART Phase IV Reaches B & C Project 9 July 2018
2018-114
Local
South Coast Air Quality Management District
The SCAQMD is the air pollution control agency for Orange County and the urban portions of Los Angeles, Riverside, and San Bernardino Counties. The agency’s primary responsibility is ensuring that the federal and state ambient air quality standards are attained and maintained in the SoCAB. The SCAQMD is also responsible for adopting and enforcing rules and regulations concerning air pollutant sources, issuing permits for stationary sources of air pollutants, inspecting stationary sources of air pollutants, responding to citizen complaints, monitoring ambient air quality and meteorological conditions, awarding grants to reduce motor vehicle emissions, and conducting public education campaigns, as well as many other activities. All projects are subject to SCAQMD rules and regulations in effect at the time of construction.
The following is a list of noteworthy SCAQMD rules that are required of construction activities associated with the proposed Project:
Rule 402 (Nuisance) – This rule prohibits the discharge from any source whatsoever such quantities of air contaminants or other material which cause injury, detriment, nuisance, or annoyance to any considerable number of persons or to the public, or which endanger the comfort, repose, health, or safety of any such persons or the public, or which cause, or have a natural tendency to cause, injury or damage to business or property. This rule does not apply to odors emanating from agricultural operations necessary for the growing of crops or the raising of fowl or animals.
Rule 403 (Fugitive Dust) – This rule requires fugitive dust sources to implement best available control measures for all sources, and all forms of visible particulate matter are prohibited from crossing any property line. This rule is intended to reduce PM10 emissions from any transportation, handling, construction, or storage activity that has the potential to generate fugitive dust. PM10 suppression techniques are summarized below.
a) Portions of a construction site to remain inactive longer than a period of three months will be seeded and watered until grass cover is grown or otherwise stabilized.
b) All on-site roads will be paved as soon as feasible or watered periodically or chemically stabilized.
c) All material transported off-site will be either sufficiently watered or securely covered to prevent excessive amounts of dust.
d) The area disturbed by clearing, grading, earthmoving, or excavation operations will be minimized at all times.
e) Where vehicles leave a construction site and enter adjacent public streets, the streets will be swept daily or washed down at the end of the work day to remove soil tracked onto the paved surface.
Air Quality and Greenhouse Gas Assessment – SART Phase IV Reaches B & C Project
ECORP Consulting Inc. SART Phase IV Reaches B & C Project 10 July 2018
2018-114
Rule 1113 (Architectural Coatings) – This rule requires manufacturers, distributors, and end-users of architectural and industrial maintenance coatings to reduce reactive organic gas (ROG) emissions from the use of these coatings, primarily by placing limits on the ROG content of various coating categories.
2.3 Air Quality Emissions Impact Assessment
Thresholds of Significance
The impact analysis provided below is based on the following California Environmental Quality Act (CEQA) Guidelines Appendix G thresholds of significance. The Project would result in a significant impact to air quality if it would:
1) Violate any air quality standard or contribute substantially to an existing or projected air quality violation.
2) Conflict with or obstruct implementation of any applicable air quality plan.
3) Expose sensitive receptors to substantial pollutant concentrations.
4) Create objectionable odors affecting a substantial number of people.
5) Result in a cumulatively considerable net increase of any criteria pollutant for which the Project region is nonattainment under an applicable federal or state ambient air quality standard (including releasing emissions which exceed quantitative thresholds for ozone precursors).
SCAQMD Thresholds
The significance criteria established by the applicable air quality management or air pollution control district (SCAQMD) may be relied upon to make the above determinations. According to the SCAQMD, an air quality impact is considered significant if the proposed Project would violate any ambient air quality standard, contribute substantially to an existing or projected air quality violation, or expose sensitive receptors to substantial pollutant concentrations. The SCAQMD has established thresholds of significance for air quality for construction and operational activities of land use development projects such as that proposed, as shown in Table 2-4.

Air Quality and Greenhouse Gas Assessment – SART Phase IV Reaches B & C Project
ECORP Consulting Inc. SART Phase IV Reaches B & C Project 11 July 2018
2018-114
Table 2-4. SCAQMD Regional Significance Thresholds – Pounds per Day
Air Pollutant Construction Activities Operations
Reactive Organic Gas 75 55
Carbon Monoxide 550 550
Nitrogen Oxide 100 55
Sulfur Oxide 150 150
Coarse Particulate Matter 150 150
Fine Particulate Matter 55 55
Source: SCAQMD 1993 (PM2.5 threshold adopted June 1, 2007)
Localized Significance Thresholds
In response to the SCAQMD Governing Boards' Environmental Justice Enhancement Initiative (I-4) the SCAQMD developed localized significance thresholds (LSTs) for emissions of NO2, CO, PM10, and PM2.5
generated at new development sites (off-site mobile source emissions are not included in the LST analysis). LSTs represent the maximum emissions that can be generated at a project site without expecting to cause or substantially contribute to an exceedance of the most stringent national or state ambient air quality standards. LSTs are based on the ambient concentrations of that pollutant within the Project source receptor area (SRA), as demarcated by the SCAQMD, and the distance to the nearest sensitive receptor. LST analysis for construction is applicable for all projects that disturb 5 acres or less on a single day. Redlands is located within SCAQMD SRA 35 (East San Bernardino Valley). Table 2-5 shows the LSTs for a 1-acre, 2-acre, and 5-acre project site in SRA 35 with sensitive receptors located within 25 meters of the Project site.
Table 2-5. Local Significance Thresholds (Construction / Operations)
Project Size
Pollutant (pounds per day)
NOX
Construction/ Operations
CO
Construction/ Operations
PM10
Construction/ Operations
PM2.5
Construction/ Operations
1 Acre 118 / 118 775 / 775 4 / 1 4 / 1
2 Acres 170 / 170 1,174 / 1,174 7 / 2 5 / 2
5 Acres 270 / 270 2,075 / 2,075 14 / 4 9 / 3 Source: SCAQMD 2009
Methodology
Air quality impacts were assessed in accordance with methodologies recommended by CARB and the SCAQMD. Where criteria air pollutant quantification was required, emissions were modeled using the California Emissions Estimator Model (CalEEMod), version 2016.3.2. CalEEMod is a statewide land use

Air Quality and Greenhouse Gas Assessment – SART Phase IV Reaches B & C Project
ECORP Consulting Inc. SART Phase IV Reaches B & C Project 12 July 2018
2018-114
emissions computer model designed to quantify potential criteria pollutant emissions associated with both construction and operations from a variety of land use projects. Project construction-generated air pollutant emissions were primarily calculated using CalEEMod model defaults for San Bernardino County. However, the specific construction equipment anticipated to be used has been provided by the County Public Works Department and accounted for in the emissions model predictions. Operational air pollutant emissions were based on the Project site plans.
Impact Analysis
PROJECT CONSTRUCTION-GENERATED CRITERIA AIR QUALITY EMISSIONS Regional Construction Significance Analysis
Construction-generated emissions are temporary and short term but have the potential to represent a significant air quality impact. Three basic sources of short-term emissions will be generated through construction of the proposed Project: operation of the construction vehicles (i.e., excavators, trenchers, dump trucks), the creation of fugitive dust during clearing and grading, and the use of asphalt or other oil-based substances during paving activities. Construction activities such as excavation and grading operations, construction vehicle traffic, and wind blowing over exposed soils would generate exhaust emissions and fugitive particulate matter emissions that affect local air quality at various times during construction. Effects would be variable depending on the weather, soil conditions, the amount of activity taking place, and the nature of dust control efforts. The dry climate of the area during the summer months creates a high potential for dust generation. Construction activities would be subject to SCAQMD Rule 403, which requires taking reasonable precautions to prevent the emissions of fugitive dust, such as using water or chemicals, where possible, for control of dust during the clearing of land and other construction activities. Construction-generated emissions associated the proposed Project were calculated using the CARB-approved CalEEMod computer program, which is designed to model emissions for land use development projects, based on typical construction requirements. See Attachment A for more information regarding the construction assumptions, including construction equipment and duration, used in this analysis. Predicted maximum daily construction-generated emissions for the proposed Project are summarized in Table 2-6. Construction-generated emissions are short term and of temporary duration, lasting only as long as construction activities occur, but would be considered a significant air quality impact if the volume of pollutants generated exceeds the SCAQMD’s thresholds of significance.

Air Quality and Greenhouse Gas Assessment – SART Phase IV Reaches B & C Project
ECORP Consulting Inc. SART Phase IV Reaches B & C Project 13 July 2018
2018-114
Table 2-6. Construction-Related Emissions (Regional Significance Analysis)
Construction Year Maximum Pollutants (pounds per day)
ROG NOX CO SO2 PM10 PM2.5
2020 18.05 97.90 108.01 0.26 11.87 6.00
SCAQMD Regional Significance Threshold 75 100 550 150 150 55
Exceed SCAQMD Threshold? No No No No No No
Source: CalEEMod version 2016.3.2. Refer to Attachment A for Model Data Outputs. Notes: Emission reduction/credits for construction emissions are applied based on the required implementation of SCAQMD Rule 403. The
specific Rule 403 measures applied in CalEEMod include the following: properly maintain mobile and other construction equipment; water exposed surfaces three times daily; cover stock piles with tarps; water all haul roads twice daily; and limit speeds on unpaved roads to 15 miles per hour. Reductions percentages from the SCAQMD CEQA Handbook (Tables XI-A through XI-E) were applied. Emission projections account for the import of 300 cubic yards of soil during site preparation and grading activities.
As shown in Table 2-6, emissions generated during construction would not exceed the SCAQMD’s regional thresholds of significance. This would be considered a less than significant impact.
EPA Conformity Determination Analysis
General Conformity ensures that the actions taken by federal agencies do not interfere with a state’s plans to attain and maintain national standards for air quality.
Established under the Clean Air Act (section 176(c)(4)), the General Conformity rule plays an important role in helping states improve air quality in those areas that do not meet the National Ambient Air Quality Standards (NAAQS). Under the General Conformity rule, federal agencies must work with state and local governments in a nonattainment or maintenance area to ensure that federal actions conform to the air quality plans established in the applicable state or tribal implementation plan. The overall purpose of the General Conformity rule is to ensure that:
federal activities do not cause or contribute to new violations of NAAQS;
actions do not worsen existing violations of the NAAQS; and
attainment of the NAAQS is not delayed.
Predicted annual construction-generated emissions for the proposed Project are summarized in Table 2-7. Construction-generated emissions are short term and of temporary duration, lasting only as long as construction activities occur, but would be considered a significant air quality impact if the volume of pollutants generated exceeds the Conformity Determination thresholds.
Air Quality and Greenhouse Gas Assessment – SART Phase IV Reaches B & C Project
ECORP Consulting Inc. SART Phase IV Reaches B & C Project 14 July 2018
2018-114
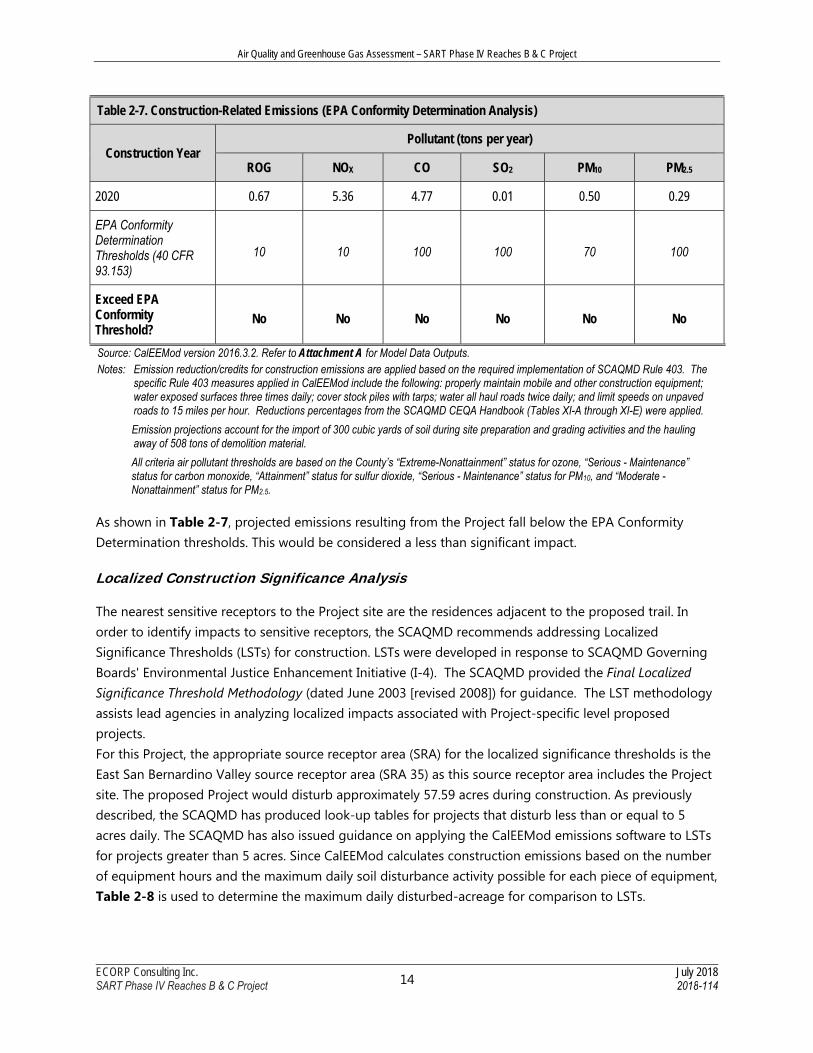
Table 2-7. Construction-Related Emissions (EPA Conformity Determination Analysis)
Construction Year Pollutant (tons per year)
ROG NOX CO SO2 PM10 PM2.5
2020 0.67 5.36 4.77 0.01 0.50 0.29
EPA Conformity Determination Thresholds (40 CFR 93.153)
10 10 100 100 70 100
Exceed EPA Conformity Threshold?
No No No No No No
Source: CalEEMod version 2016.3.2. Refer to Attachment A for Model Data Outputs. Notes: Emission reduction/credits for construction emissions are applied based on the required implementation of SCAQMD Rule 403. The
specific Rule 403 measures applied in CalEEMod include the following: properly maintain mobile and other construction equipment; water exposed surfaces three times daily; cover stock piles with tarps; water all haul roads twice daily; and limit speeds on unpaved roads to 15 miles per hour. Reductions percentages from the SCAQMD CEQA Handbook (Tables XI-A through XI-E) were applied.
Emission projections account for the import of 300 cubic yards of soil during site preparation and grading activities and the hauling away of 508 tons of demolition material.
All criteria air pollutant thresholds are based on the County’s “Extreme-Nonattainment” status for ozone, “Serious - Maintenance” status for carbon monoxide, “Attainment” status for sulfur dioxide, “Serious - Maintenance” status for PM10, and “Moderate - Nonattainment” status for PM2.5.
As shown in Table 2-7, projected emissions resulting from the Project fall below the EPA Conformity Determination thresholds. This would be considered a less than significant impact.
Localized Construction Significance Analysis
The nearest sensitive receptors to the Project site are the residences adjacent to the proposed trail. In order to identify impacts to sensitive receptors, the SCAQMD recommends addressing Localized Significance Thresholds (LSTs) for construction. LSTs were developed in response to SCAQMD Governing Boards' Environmental Justice Enhancement Initiative (I-4). The SCAQMD provided the Final Localized Significance Threshold Methodology (dated June 2003 [revised 2008]) for guidance. The LST methodology assists lead agencies in analyzing localized impacts associated with Project-specific level proposed projects. For this Project, the appropriate source receptor area (SRA) for the localized significance thresholds is the East San Bernardino Valley source receptor area (SRA 35) as this source receptor area includes the Project site. The proposed Project would disturb approximately 57.59 acres during construction. As previously described, the SCAQMD has produced look-up tables for projects that disturb less than or equal to 5 acres daily. The SCAQMD has also issued guidance on applying the CalEEMod emissions software to LSTs for projects greater than 5 acres. Since CalEEMod calculates construction emissions based on the number of equipment hours and the maximum daily soil disturbance activity possible for each piece of equipment, Table 2-8 is used to determine the maximum daily disturbed-acreage for comparison to LSTs.

Air Quality and Greenhouse Gas Assessment – SART Phase IV Reaches B & C Project
ECORP Consulting Inc. SART Phase IV Reaches B & C Project 15 July 2018
2018-114
Table 2-8. Equipment-Specific Grading Rates
Construction
Phase
Equipment Type Acres
Graded/Disturbed per 8-Hour Day
Equipment Quantity
Operating Hours per Day
Acres Graded per
Day
Demolition
Crawler Tractors 0.5 0 8 0
Graders 0.5 1 8 0.5
Rubber Tired Dozers 0.5 1 8 0.5
Scrapers 1.0 0 8 0
Total 1
Site Preparation
Crawler Tractors 0.5 0 8 0
Graders 0.5 2 8 1
Rubber Tired Dozers 0.5 1 8 0.5
Scrapers 1.0 0 8 0
Total
1.5
Grading
Crawler Tractors 0.5 2 8 1
Graders 0.5 2 8 1
Rubber Tired Dozers 0.5 0 8 0
Scrapers 1.0 2 8 2
Total 4
Construction
Crawler Tractors 0.5 2 8 1
Graders 0.5 2 8 1
Rubber Tired Dozers 0.5 0 8 0
Scrapers 1.0 2 8 2
Total 4
Paving
Crawler Tractors 0.5 0 8 0
Graders 0.5 1 8 0.5
Rubber Tired Dozers 0.5 0 8 0
Scrapers 1.0 2 8 2
Total
2.5
Painting Crawler Tractors 0.5 0 8 0
Air Quality and Greenhouse Gas Assessment – SART Phase IV Reaches B & C Project
ECORP Consulting Inc. SART Phase IV Reaches B & C Project 16 July 2018
2018-114
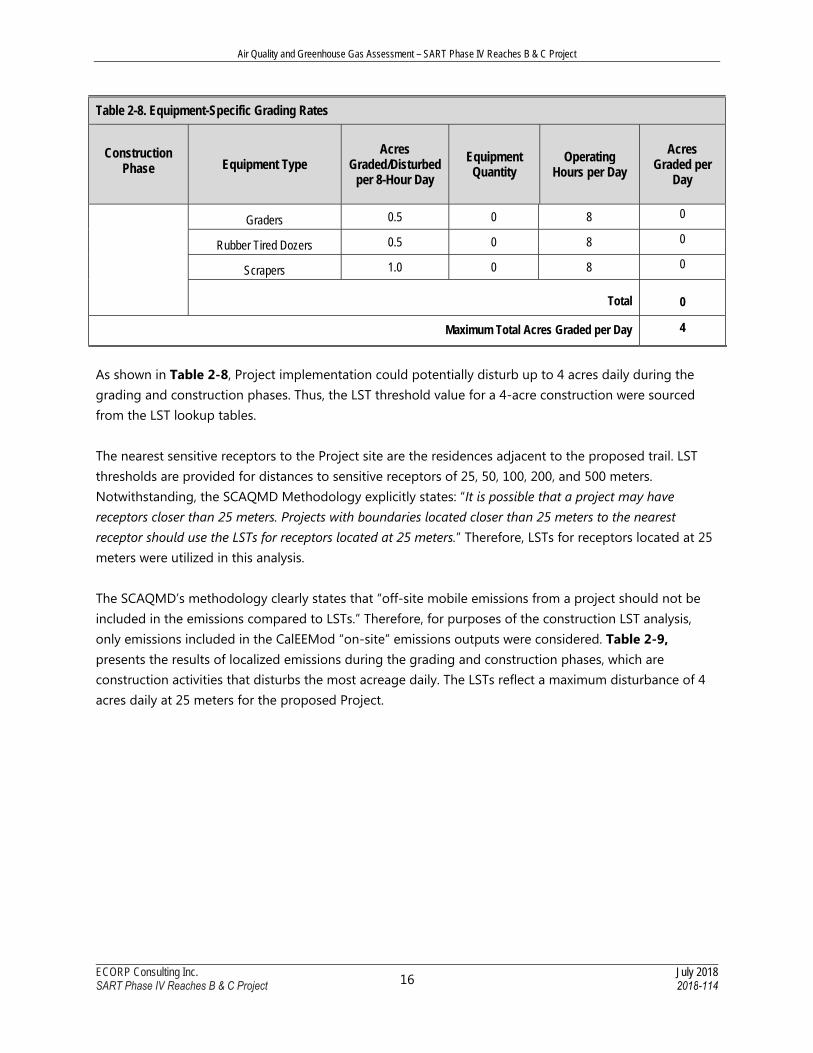
Table 2-8. Equipment-Specific Grading Rates
Construction
Phase
Equipment Type Acres
Graded/Disturbed per 8-Hour Day
Equipment Quantity
Operating Hours per Day
Acres Graded per
Day
Graders 0.5 0 8 0
Rubber Tired Dozers 0.5 0 8 0
Scrapers 1.0 0 8 0
Total 0
Maximum Total Acres Graded per Day 4
As shown in Table 2-8, Project implementation could potentially disturb up to 4 acres daily during the grading and construction phases. Thus, the LST threshold value for a 4-acre construction were sourced from the LST lookup tables. The nearest sensitive receptors to the Project site are the residences adjacent to the proposed trail. LST thresholds are provided for distances to sensitive receptors of 25, 50, 100, 200, and 500 meters. Notwithstanding, the SCAQMD Methodology explicitly states: “It is possible that a project may have receptors closer than 25 meters. Projects with boundaries located closer than 25 meters to the nearest receptor should use the LSTs for receptors located at 25 meters.” Therefore, LSTs for receptors located at 25 meters were utilized in this analysis. The SCAQMD’s methodology clearly states that “off-site mobile emissions from a project should not be included in the emissions compared to LSTs.” Therefore, for purposes of the construction LST analysis, only emissions included in the CalEEMod “on-site” emissions outputs were considered. Table 2-9, presents the results of localized emissions during the grading and construction phases, which are construction activities that disturbs the most acreage daily. The LSTs reflect a maximum disturbance of 4 acres daily at 25 meters for the proposed Project.

Air Quality and Greenhouse Gas Assessment – SART Phase IV Reaches B & C Project
ECORP Consulting Inc. SART Phase IV Reaches B & C Project 17 July 2018
2018-114
Table 2-9. Construction-Related Emissions (Localized Significance Analysis)
Activity Pollutant (pounds per day)
NOX CO PM10 PM2.5
Grading 80.46 50.72 4.97 3.29
Construction 94.73 65.52 4.12 3.82
SCAQMD Localized Significance Threshold 236.67 1,774.67 11.67 7.67
Exceed SCAQMD Threshold? No No No No
Source: CalEEMod version 2016.3.2. Refer to Attachment A for Model Data Outputs. Notes: Emission reduction/credits for construction emissions are applied based on the required implementation of SCAQMD Rule 403. The
specific Rule 403 measures applied in CalEEMod include the following: properly maintain mobile and other construction equipment; water exposed surfaces three times daily; cover stock piles with tarps; water all haul roads twice daily; and limit speeds on unpaved roads to 15 miles per hour. Reductions percentages from the SCAQMD CEQA Handbook (Tables XI-A through XI-E) were applied.
Emission projections account for the import of 300 cubic yards of soil during site preparation and grading activities.
Table 2-9 shows that the emissions of these pollutants on the peak day of construction would not result in significant concentrations of pollutants at nearby sensitive receptors. Therefore, significant impacts would not occur concerning LSTs during construction activities.
PROJECT OPERATIONS CRITERIA AIR QUALITY EMISSIONS Regional Operational Significance Analysis
The proposed Project involves the construction of an approximately 3.2-mile-long section of the SART. The proposed Project will not include the provision of new permanent stationary or mobile sources of emissions, and therefore, by its very nature, will not generate quantifiable air quality emissions from Project operations. The Project does not propose any buildings and therefore no permanent source or stationary source emissions. Once the Project is completed, there will be no resultant increase in automobile trips to the area because the recreational trail will not require daily visits. While it is anticipated that the Project would require intermittent maintenance to be conducted by County public works staff, such maintenance would be minimal requiring a negligible amount of traffic trips on an annual basis. Impacts in this regard would be less than significant.
EPA Conformity Determination Analysis
As described, the proposed Project will not include the provision of new permanent stationary or mobile sources of emissions, and therefore, by its very nature, will not generate quantifiable air quality emissions from Project operations and would not exceed EPA Conformity Determination Thresholds.

Air Quality and Greenhouse Gas Assessment – SART Phase IV Reaches B & C Project
ECORP Consulting Inc. SART Phase IV Reaches B & C Project 18 July 2018
2018-114
Localized Operational Significance Analysis According to the SCAQMD localized significance threshold methodology, LSTs would apply to the operational phase of a proposed project if the project includes stationary sources or attracts mobile sources that may spend long periods queuing and idling at the site (e.g., warehouse or transfer facilities). The proposed Project includes the construction of a 3.2-mile-long section of the SART. Therefore, in the case of the proposed Project, the operational phase LST protocol is not applied.
CONFLICT WITH THE 2016 AIR QUALITY MANAGEMENT PLAN
As part of its enforcement responsibilities, the EPA requires each state with nonattainment areas to prepare and submit a State Implementation Plan that demonstrates the means to attain the federal standards. The SIP must integrate federal, state, and local plan components and regulations to identify specific measures to reduce pollution in nonattainment areas, using a combination of performance standards and market-based programs. Similarly, under state law, the California Clean Air Act requires an air quality attainment plan to be prepared for areas designated as nonattainment with regard to the federal and state ambient air quality standards. Air quality attainment plans outline emissions limits and control measures to achieve and maintain these standards by the earliest practical date.
As previously mentioned, the Project site is located within the SoCAB, which is under the jurisdiction of the SCAQMD. The SCAQMD is required, pursuant to the federal Clean Air Act, to reduce emissions of criteria pollutants for which the SoCAB is in nonattainment. In order to reduce such emissions, the SCAQMD drafted the 2016 Air Quality Management Plan. The 2016 AQMP establishes a program of rules and regulations directed at reducing air pollutant emissions and achieving state (California) and national air quality standards. The 2016 AQMP is a regional and multi-agency effort including the SCAQMD, the California Air Resources Board (CARB), the Southern California Association of Governments (SCAG), and the US Environmental Protection Agency (EPA). The plan’s pollutant control strategies are based on the latest scientific and technical information and planning assumptions, including SCAG’s 2016 Regional Transportation Plan/Sustainable Communities Strategy, updated emission inventory methodologies for various source categories, and SCAG’s latest growth forecasts. (SCAG’s latest growth forecasts were defined in consultation with local governments and with reference to local general plans.) The Project is subject to the SCAQMD’s Air Quality Management Plan.
According to the SCAQMD, in order to determine consistency with SCAQMD’s air quality planning two main criteria must be addressed.
Criterion 1:
With respect to the first criterion, SCAQMD methodologies require that an air quality analysis for a project include forecasts of project emissions in relation to contributing to air quality violations and delay of attainment.
a) Would the project result in an increase in the frequency or severity of existing air quality violations or cause or contribute to new air quality violations?

Air Quality and Greenhouse Gas Assessment – SART Phase IV Reaches B & C Project
ECORP Consulting Inc. SART Phase IV Reaches B & C Project 19 July 2018
2018-114
As shown in Tables 2-6 and 2-9, the proposed Project would result in emissions that would be below the SCAQMD regional and localized thresholds during construction. Furthermore, as previously described the Project would not generate quantifiable criteria emissions from Project operations. Therefore, the proposed Project would not result in an increase in the frequency or severity of existing air quality violations and would not have the potential to cause or affect a violation of the ambient air quality standards.
b) Would the project delay timely attainment of air quality standards or the interim emissions reductions specified in the AQMP?
As shown in Table 2-6, the Project will not exceed the applicable SCAQMD regional thresholds for construction. Additionally, the Project will not generate quantifiable criteria emissions from Project operations. Since the Project would result in less than significant regional emission impacts, it would not delay the timely attainment of air quality standards or AQMP emissions reductions.
Criterion 2:
With respect to the second criterion for determining consistency with SCAQMD and SCAG air quality policies, it is important to recognize that air quality planning within the SoCAB focuses on attainment of ambient air quality standards at the earliest feasible date. Projections for achieving air quality goals are based on assumptions regarding population, housing, and growth trends. Thus, the SCAQMD’s second criterion for determining Project consistency focuses on whether or not the proposed Project exceeds the assumptions utilized in preparing the forecasts presented its air quality planning documents. Determining whether or not a project exceeds the assumptions reflected in the 2016 AQMP involves the evaluation of the three criteria outlined below. The following discussion provides an analysis of each of these criteria.
a) Would the project be consistent with the population, housing, and employment growth projections utilized in the preparation of the 2016 AQMP?
A project is consistent with regional air quality planning efforts in part if it is consistent with the population, housing, and employment assumptions that were used in the development of the SCAQMD air quality plans. Generally, three sources of data form the basis for the projections of air pollutant emissions in Redlands, which encompasses the Project site: Redlands General Plan, SCAG’s Growth Management Chapter of the Regional Comprehensive Plan and Guide (RCPG), and SCAG’s 2016 Regional Transportation Plan/Sustainable Communities Strategy (RTP/SCS). The RTP/SCS also provides socioeconomic forecast projections of regional population growth.
The proposed Project does not include development of new housing or employment centers, and would not induce population or employment growth. Therefore, the Project would not affect local plans for population growth. Therefore, the proposed Project would be considered consistent with the population, housing, and employment growth projections utilized in the preparation of the AQMP.
b) Would the project implement all feasible air quality mitigation measures?
In order to further reduce emissions, the Project would be required to comply with emission reduction measures promulgated by the SCAQMD, such as SCAQMD Rules 402, 403, and 1113. SCAQMD Rule 402 prohibits the discharge from any source whatsoever such quantities of air contaminants or other material

Air Quality and Greenhouse Gas Assessment – SART Phase IV Reaches B & C Project
ECORP Consulting Inc. SART Phase IV Reaches B & C Project 20 July 2018
2018-114
which cause injury, detriment, nuisance, or annoyance to any considerable number of persons or to the public, or which endanger the comfort, repose, health, or safety of any such persons or the public, or which cause, or have a natural tendency to cause, injury or damage to business or property. SCAQMD Rule 403 requires fugitive dust sources to implement Best Available Control Measures for all sources, and all forms of visible particulate matter are prohibited from crossing any property line. SCAQMD Rule 403 is intended to reduce PM10 emissions from any transportation, handling, construction, or storage activity that has the potential to generate fugitive dust. SCAQMD 1113 requires manufacturers, distributors, and end-users of architectural and industrial maintenance coatings to reduce ROG emissions from the use of these coatings, primarily by placing limits on the ROG content of various coating categories. As such, the proposed Project meets this consistency criterion.
c) Would the project be consistent with the land use planning strategies set forth by SCAQMD air quality planning efforts?
The AQMP contains air pollutant reduction strategies based on SCAG’s latest growth forecasts, and SCAG’s growth forecasts were defined in consultation with local governments and with reference to local general plans. The proposed Project is consistent with the land use designation and development density presented in the City of Redlands General Plan and therefore would not exceed the population or job growth projections used by the SCAQMD to develop the AQMP.
In conclusion, the determination of AQMP consistency is primarily concerned with the long-term influence of a project on air quality. The proposed Project would not result in a long-term impact on the region’s ability to meet State and Federal air quality standards as it is not projected to exceed SCAQMD regional thresholds. As a result, this impact is less than significant.
EXPOSURE OF SENSITIVE RECEPTORS TO TOXIC AIR CONTAMINANTS
Sensitive receptors are defined as facilities or land uses that include members of the population that are particularly sensitive to the effects of air pollutants, such as children, the elderly, and people with illnesses. Examples of these sensitive receptors are residences, schools, hospitals, and daycare centers. CARB has identified the following groups of individuals as the most likely to be affected by air pollution: the elderly over 65, children under 14, athletes, and persons with cardiovascular and chronic respiratory diseases such as asthma, emphysema, and bronchitis.
Construction-Generated Air Contaminants
Construction-related activities would result in temporary, short-term Project-generated emissions of diesel particulate matter (DPM) from the exhaust of off-road, heavy-duty diesel equipment for site preparation (e.g., clearing, grading); soil hauling truck traffic; paving; application of architectural coatings; and other miscellaneous activities. For construction activity, DPM is the primary TAC of concern. Particulate exhaust emissions from diesel-fueled engines (i.e., DPM) were identified as a TAC by the CARB in 1998. The potential cancer risk from the inhalation of DPM, as discussed below, outweighs the potential for all other health impacts (i.e., non-cancer chronic risk, short-term acute risk) and health impacts from other TACs. Accordingly, DPM is the focus of this discussion.
Air Quality and Greenhouse Gas Assessment – SART Phase IV Reaches B & C Project
ECORP Consulting Inc. SART Phase IV Reaches B & C Project 21 July 2018
2018-114
Based on the emission modeling conducted the maximum construction-related emissions of exhaust PM2.5, considered a surrogate for DPM, would be 3.88 pounds per day (see Attachment A) during construction activity (PM2.5 is considered a surrogate for DPM because more than 90 percent of DPM is less than 1 microgram in diameter and therefore is a subset of particulate matter under 2.5 microns in diameter (i.e., PM2.5), according to CARB. Most PM2.5 derives from combustion, such as use of gasoline and diesel fuels by motor vehicles.) Furthermore, even during the most intense month of construction, emissions of DPM would be generated from different locations on the Project site, rather than a single location, because different types of construction activities (e.g., site preparation, grading, paving) would not occur at the same place at the same time.
The dose to which receptors are exposed is the primary factor used to determine health risk (i.e., potential exposure to TAC emission levels that exceed applicable standards). Dose is a function of the concentration of a substance or substances in the environment and the duration of exposure to the substance. Dose is positively correlated with time, meaning that a longer exposure period would result in a higher exposure level for any exposed receptor. Thus, the risks estimated for an exposed individual are higher if a fixed exposure occurs over a longer period of time. According to the Office of Environmental Health Hazard Assessment (OEHHA), health risk assessments, which determine the exposure of sensitive receptors to TAC emissions, should be based on a 70-, 30-, or 9-year exposure period; however, such assessments should be limited to the period/duration of activities associated with the proposed Project. Consequently, an important consideration is the fact that construction of the proposed Project is anticipated to last less than a year. Therefore, considering the relatively low mass of DPM emissions that would be generated during even the most intense season of construction, the relatively short duration of construction activities (less than a year) required to develop the site, and the highly dispersive properties of DPM, construction-related TAC emissions would not expose sensitive receptors to substantial amounts of air toxics.
Operational Air Contaminants
The proposed Project involves the construction of an approximately 3.2-mile-long section of the SART. The proposed Project will not include the provision of new permanent stationary or mobile sources of emissions, and therefore, by its very nature, will not generate quantifiable air toxic emissions from Project operations. Naturally Occurring Asbestos
Another potential air quality issue associated with construction-related activities is the airborne entrainment of asbestos due to the disturbance of naturally-occurring asbestos-containing soils. The proposed Project is not located within an area designated by the State of California as likely to contain naturally-occurring asbestos (DOC 2000). As a result, construction-related activities would not be anticipated to result in increased exposure of sensitive land uses to asbestos.

Air Quality and Greenhouse Gas Assessment – SART Phase IV Reaches B & C Project
ECORP Consulting Inc. SART Phase IV Reaches B & C Project 22 July 2018
2018-114
Carbon Monoxide Hot Spots It has long been recognized that CO exceedances are caused by vehicular emissions, primarily when idling at intersections. Concentrations of CO are a direct function of the number of vehicles, length of delay, and traffic flow conditions. Under certain meteorological conditions, CO concentrations close to congested intersections that experience high levels of traffic and elevated background concentrations may reach unhealthy levels, affecting nearby sensitive receptors. Given the high traffic volume potential, areas of high CO concentrations, or “hot spots,” are typically associated with intersections that are projected to operate at unacceptable levels of service during the peak commute hours. However, transport of this criteria pollutant is extremely limited, and CO disperses rapidly with distance from the source under normal meteorological conditions. Furthermore, vehicle emissions standards have become increasingly more stringent in the last 20 years. Currently, the CO standard in California is a maximum of 3.4 grams per mile for passenger cars (requirements for certain vehicles are more stringent). With the turnover of older vehicles, introduction of cleaner fuels, and implementation of control technology on industrial facilities, CO concentrations in the Project vicinity have steadily declined. Accordingly, with the steadily decreasing CO emissions from vehicles, even very busy intersections do not result in exceedances of the CO standard. The analysis prepared for CO attainment in the SCAQMD 1992 Federal Attainment Plan for Carbon Monoxide (1992 CO Plan) in Los Angeles County can be used to demonstrate the potential for CO exceedances. The SCAQMD CO hot spot analysis was conducted for four busy intersections in Los Angeles County during the peak morning and afternoon time periods. The intersections evaluated included Long Beach Boulevard and Imperial Highway (Lynwood), Wilshire Boulevard and Veteran Avenue (Westwood), Sunset Boulevard and Highland Avenue (Hollywood), and La Cienega Boulevard and Century Boulevard (Inglewood). The busiest intersection evaluated was at Wilshire Boulevard and Veteran Avenue, which has a traffic volume of approximately 100,000 vehicles per day. The Los Angeles County Metropolitan Transportation Authority evaluated the level of service in the vicinity of the Wilshire Boulevard/Veteran Avenue intersection and found it to be level of service (LOS) E at peak morning traffic and LOS F at peak afternoon traffic (LOS E and F are the two least efficient traffic LOS ratings). Even with the inefficient LOS and volume of traffic, the CO analysis concluded that there was no violation of CO standards (SCAQMD 1992). The Project is not anticipated to generate any trips. Because the proposed Project would not increase traffic volumes at any intersection to more than 100,000 vehicles per day, there is no likelihood of the Project traffic exceeding CO values.
ODORS Typically, odors are regarded as an annoyance rather than a health hazard. However, manifestations of a person’s reaction to foul odors can range from psychological (e.g., irritation, anger, or anxiety) to physiological (e.g., circulatory and respiratory effects, nausea, vomiting, and headache).
With respect to odors, the human nose is the sole sensing device. The ability to detect odors varies considerably among the population and overall is quite subjective. Some individuals have the ability to

Air Quality and Greenhouse Gas Assessment – SART Phase IV Reaches B & C Project
ECORP Consulting Inc. SART Phase IV Reaches B & C Project 23 July 2018
2018-114
smell minute quantities of specific substances; others may not have the same sensitivity but may have sensitivities to odors of other substances. In addition, people may have different reactions to the same odor; in fact, an odor that is offensive to one person (e.g., from a fast-food restaurant) may be perfectly acceptable to another. It is also important to note that an unfamiliar odor is more easily detected and is more likely to cause complaints than a familiar one. This is because of the phenomenon known as odor fatigue, in which a person can become desensitized to almost any odor and recognition only occurs with an alteration in the intensity.
Quality and intensity are two properties present in any odor. The quality of an odor indicates the nature of the smell experience. For instance, if a person describes an odor as flowery or sweet, then the person is describing the quality of the odor. Intensity refers to the strength of the odor. For example, a person may use the word “strong” to describe the intensity of an odor. Odor intensity depends on the odorant concentration in the air. When an odorous sample is progressively diluted, the odorant concentration decreases. As this occurs, the odor intensity weakens and eventually becomes so low that the detection or recognition of the odor is quite difficult. At some point during dilution, the concentration of the odorant reaches a detection threshold. An odorant concentration below the detection threshold means that the concentration in the air is not detectable by the average human.
Construction During construction, the proposed Project presents the potential for generation of objectionable odors in the form of diesel exhaust in the immediate vicinity of the site. However, these emissions are short-term in nature and will rapidly dissipate and be diluted by the atmosphere downwind of the emission sources. Additionally, odors would be localized and generally confined to the construction area. Therefore, under CEQA, construction odors would result in a less than significant impact related to odor emissions.
Operations The SCAQMD CEQA Air Quality Handbook (1993) identifies certain land uses as sources of odors. These land uses include agriculture (farming and livestock), wastewater treatment plants, food processing plants, chemical plants, composting facilities, refineries, landfills, dairies, and fiberglass molding. The proposed Project would not include any of the land uses that have been identified by the SCAQMD as odor sources. Therefore, there would be no operational odor impacts from the proposed Project.
CUMULATIVE AIR QUALITY IMPACTS The cumulative setting for air quality includes San Bernardino County portion of the SoCAB. The San Bernardino County portion of SoCAB is designated as a nonattainment area for state standards of ozone, PM10, and PM2.5. The region is also designated as a nonattainment area for federal standards of ozone and PM2.5 (CARB 2017a). Cumulative growth in population, vehicle use, and industrial activity could inhibit efforts to improve regional air quality and attain the ambient air quality standards. Thus, the setting for this cumulative analysis consists of the San Bernardino County portion of SoCAB and associated growth and development anticipated in the region.

Air Quality and Greenhouse Gas Assessment – SART Phase IV Reaches B & C Project
ECORP Consulting Inc. SART Phase IV Reaches B & C Project 24 July 2018
2018-114
The SCAQMD’s approach to assessing cumulative impacts is based on the AQMP forecasts of attainment of ambient air quality standards in accordance with the requirements of the federal and California Clean Air Acts. As discussed earlier, the proposed Project is consistent with the 2016 AQMP, which is intended to bring the SoCAB into attainment for all criteria pollutants. In addition, the SCAQMD recommends that any given project’s potential contribution to cumulative impacts be assessed using the same significance criteria as for project-specific impacts. Therefore, individual projects that do not generate operational or construction emissions that exceed the SCAQMD’s daily thresholds for project-specific impacts would also not cause a cumulatively considerable increase in emissions for those pollutants for which the air basin is in nonattainment and therefore would not be considered to have a significant, adverse air quality impact. Alternatively, individual Project-related construction and operational emissions that exceed SCAQMD thresholds for project-specific impacts would be considered cumulatively considerable. As previously noted, the Project would not exceed the applicable SCAQMD regional thresholds. As such, the Project will not result in a cumulatively significant impact.

Air Quality and Greenhouse Gas Assessment – SART Phase IV Reaches B & C Project
ECORP Consulting Inc. SART Phase IV Reaches B & C Project 25 July 2018
2018-114
3.0 GREENHOUSE GAS EMISSIONS
3.1 Greenhouse Gas Setting
Certain gases in the earth’s atmosphere, classified as GHGs, play a critical role in determining the earth’s surface temperature. Solar radiation enters the earth’s atmosphere from space. A portion of the radiation is absorbed by the earth’s surface and a smaller portion of this radiation is reflected back toward space. This absorbed radiation is then emitted from the earth as low-frequency infrared radiation. The frequencies at which bodies emit radiation are proportional to temperature. Because the earth has a much lower temperature than the sun, it emits lower-frequency radiation. Most solar radiation passes through GHGs; however, infrared radiation is absorbed by these gases. As a result, radiation that otherwise would have escaped back into space is instead “trapped,” resulting in a warming of the atmosphere. This phenomenon, known as the greenhouse effect, is responsible for maintaining a habitable climate on earth. Without the greenhouse effect, the earth would not be able to support life as we know it.
Prominent GHGs contributing to the greenhouse effect are carbon dioxide (CO2), methane (CH4), and nitrous oxide (N2O). Fluorinated gases also make up a small fraction of the GHGs that contribute to climate change. Fluorinated gases include chlorofluorocarbons, hydrofluorocarbons, perfluorocarbons, sulfur hexafluoride, and nitrogen trifluoride; however, it is noted that these gases are not associated with typical land use development. Human-caused emissions of these GHGs in excess of natural ambient concentrations are believed to be responsible for intensifying the greenhouse effect and leading to a trend of unnatural warming of the earth’s climate, known as global climate change or global warming. It is “extremely likely” that more than half of the observed increase in global average surface temperature from 1951 to 2010 was caused by the anthropogenic increase in GHG concentrations and other anthropogenic factors together (IPCC 2014).
Table 3-1 describes the primary GHGs attributed to global climate change, including their physical properties, primary sources, and contributions to the greenhouse effect.
Each GHG differs in its ability to absorb heat in the atmosphere based on the lifetime, or persistence, of the gas molecule in the atmosphere. CH4 traps over 25 times more heat per molecule than CO2, and N2O absorbs 298 times more heat per molecule than CO2 (IPCC 2014). Often, estimates of GHG emissions are presented in carbon dioxide equivalents (CO2e), which weight each gas by its global warming potential (GWP). Expressing GHG emissions in CO2e takes the contribution of all GHG emissions to the greenhouse effect and converts them to a single unit equivalent to the effect that would occur if only CO2 were being emitted.
Climate change is a global problem. GHGs are global pollutants, unlike criteria air pollutants and toxic air contaminants, which are pollutants of regional and local concern. Whereas pollutants with localized air quality effects have relatively short atmospheric lifetimes (about one day), GHGs have long atmospheric lifetimes (one to several thousand years). GHGs persist in the atmosphere for long enough time periods to be dispersed around the globe. Although the exact lifetime of any particular GHG molecule is dependent on multiple variables and cannot be pinpointed, it is understood that more CO2 is emitted into the atmosphere than is sequestered by ocean uptake, vegetation, or other forms. Of the total annual human-caused CO2 emissions, approximately 55 percent is sequestered through ocean and land uptakes every

Air Quality and Greenhouse Gas Assessment – SART Phase IV Reaches B & C Project
ECORP Consulting Inc. SART Phase IV Reaches B & C Project 26 July 2018
2018-114
year, averaged over the last 50 years, whereas the remaining 45 percent of human-caused CO2 emissions remains stored in the atmosphere (IPCC 2013).
Table 3-1. Greenhouse Gases
Greenhouse Gas Description
CO2
Carbon dioxide is a colorless, odorless gas. CO2 is emitted in a number of ways, both naturally and through human activities. The largest source of CO2 emissions globally is the combustion of fossil fuels such as coal, oil, and gas in power plants, automobiles, industrial facilities, and other sources. A number of specialized industrial production processes and product uses such as mineral production, metal production, and the use of petroleum-based products can also lead to CO2 emissions. The atmospheric lifetime of CO2 is variable because it is so readily exchanged in the atmosphere.1
CH4
Methane is a colorless, odorless gas and is the major component of natural gas, about 87 percent by volume. It is also formed and released to the atmosphere by biological processes occurring in anaerobic environments. Methane is emitted from a variety of both human-related and natural sources. Human-related sources include fossil fuel production, animal husbandry (intestinal fermentation in livestock and manure management), rice cultivation, biomass burning, and waste management. These activities release significant quantities of CH4 to the atmosphere. Natural sources of CH4 include wetlands, gas hydrates, permafrost, termites, oceans, freshwater bodies, non-wetland soils, and other sources such as wildfires. The atmospheric lifetime of CH4 is about12 years.2
N2O
Nitrous oxide is a clear, colorless gas with a slightly sweet odor. Nitrous oxide is produced by both natural and human-related sources. Primary human-related sources of N2O are agricultural soil management, animal manure management, sewage treatment, mobile and stationary combustion of fossil fuels, adipic acid production, and nitric acid production. N2O is also produced naturally from a wide variety of biological sources in soil and water, particularly microbial action in wet tropical forests. The atmospheric lifetime of N2O is approximately 120 years.3
Sources: 1 EPA 2016a, 2 EPA 2016b, 3 EPA 2016c
The quantity of GHGs that it takes to ultimately result in climate change is not precisely known; suffice it to say the quantity is enormous, and no single project alone would measurably contribute to a noticeable incremental change in the global average temperature or to global, local, or microclimates. From the standpoint of CEQA, GHG impacts to global climate change are inherently cumulative.
Sources of Greenhouse Gas Emissions
In June 2017, CARB released the 2017 edition of the California GHG inventory covering calendar year 2015 emissions. In 2015, California emitted 440.4 million gross metric tons of CO2e including from imported electricity. Combustion of fossil fuel in the transportation sector was the single largest source of California’s GHG emissions in 2015, accounting for approximately 37 percent of total GHG emissions in the state. This sector was followed by the industrial sector (21 percent) and the electric power sector (including both in-state and out-of-state sources) (19 percent) (CARB 2017b).
Emissions of CO2 are by-products of fossil fuel combustion. CH4, a highly potent GHG, primarily results from off-gassing (the release of chemicals from nonmetallic substances under ambient or greater pressure conditions) and is largely associated with agricultural practices and landfills. N2O is also largely attributable to agricultural practices and soil management. Carbon dioxide sinks, or reservoirs, include vegetation and the ocean, which absorb CO2 through sequestration and dissolution (CO2 dissolving into the water), respectively, two of the most common processes for removing carbon dioxide from the atmosphere.

Air Quality and Greenhouse Gas Assessment – SART Phase IV Reaches B & C Project
ECORP Consulting Inc. SART Phase IV Reaches B & C Project 27 July 2018
2018-114
3.2 Regulatory Framework
State
Executive Order S-3-05
Executive Order (EO) S-3-05, signed by Governor Arnold Schwarzenegger in 2005, proclaims that California is vulnerable to the impacts of climate change. It declares that increased temperatures could reduce the Sierra Nevada snowpack, further exacerbate California’s air quality problems, and potentially cause a rise in sea levels. To combat those concerns, the executive order established total GHG emission targets for the state. Specifically, emissions are to be reduced to the 2000 level by 2010, the 1990 level by 2020, and to 80 percent below the 1990 level by 2050.
While dated, this executive order remains relevant because a more recent California Appellate Court decision, Cleveland National Forest Foundation v. San Diego Association of Governments (November 24, 2014) 231 Cal.App.4th 1056, examined whether it should be viewed as having the equivalent force of a legislative mandate for specific emissions reductions. While the California Supreme Court ruled that the San Diego Association of Governments did not abuse its discretion by declining “to adopt the 2050 goal as a measure of significance in light of the fact that the Executive Order does not specify any plan or implementation measures to achieve its goal, the decision also recognized that the goal of a 40 percent reduction in 1990 GHG levels by 2030 is “widely acknowledged” as a “necessary interim target to ensure that California meets its longer-range goal of reducing greenhouse gas emissions 80 percent below 1990 levels by the year 2050.
Assembly Bill 32, the California Global Warming Solutions Act of 2006
In September 2006, Governor Schwarzenegger signed the California Global Warming Solutions Act of 2006, Assembly Bill (AB) 32. AB 32 establishes regulatory, reporting, and market mechanisms to achieve quantifiable reductions in GHG emissions and a cap on statewide GHG emissions. AB 32 requires that statewide GHG emissions be reduced to 1990 levels by 2020. AB 32 also requires that these reductions “…shall remain in effect unless otherwise amended or repealed. (b) It is the intent of the Legislature that the statewide greenhouse gas emissions limit continue in existence and be used to maintain and continue reductions in emissions of greenhouse gases beyond 2020. (c) The [Air Resources Board] shall make recommendations to the Governor and the Legislature on how to continue reductions of greenhouse gas emissions beyond 2020.” [California Health and Safety Code, Division 25.5, Part 3, Section 38551]
Assembly Bill 32 Climate Change Scoping Plan and Updates
In December 2008, CARB adopted its Climate Change Scoping Plan, which contains the main strategies California will implement to achieve reduction of approximately 118 million metric tons of CO2e emissions, or approximately 21.7 percent from the State’s projected 2020 emission level of 545 million metric tons of CO2e under a business-as-usual scenario (this is a reduction of 47 million metric tons of CO2e, or almost 10 percent, from 2008 emissions). In May 2014, CARB released and subsequently adopted the First Update to the Climate Change Scoping Plan to identify the next steps in reaching AB 32 goals and evaluate progress that has been made between 2000 and 2012. According to the update, California is on track to meet the near-term 2020 GHG limit and is well positioned to maintain and continue reductions beyond
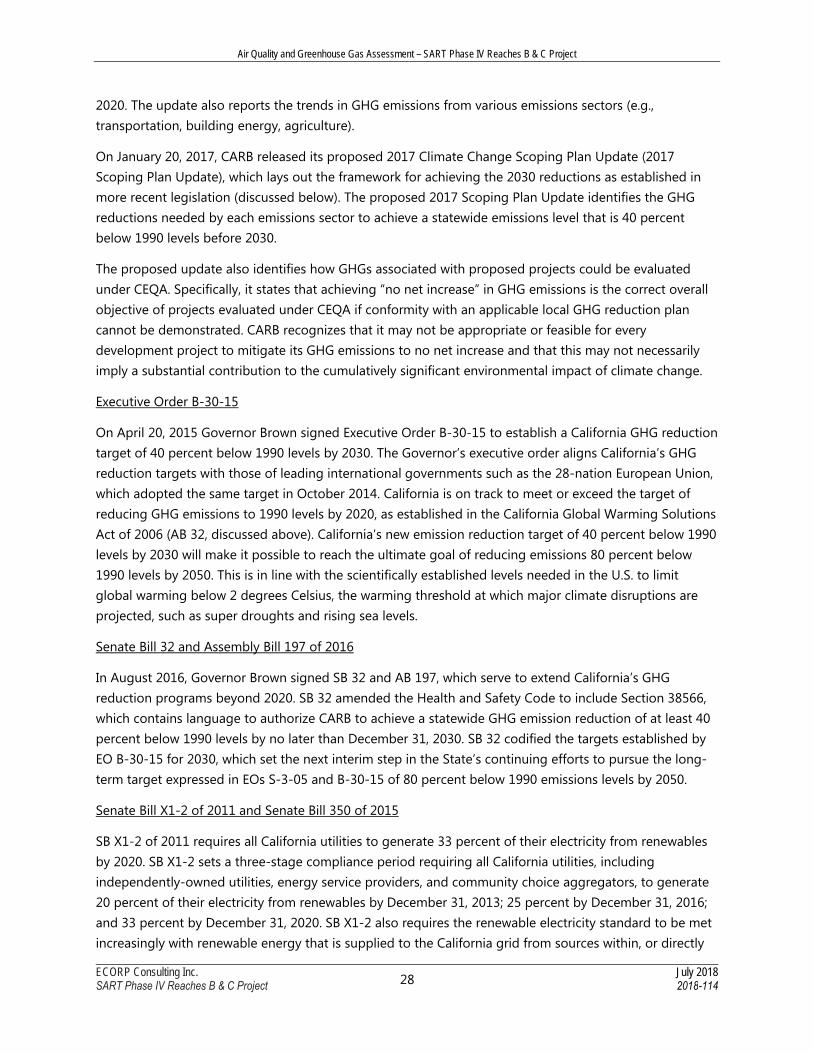
Air Quality and Greenhouse Gas Assessment – SART Phase IV Reaches B & C Project
ECORP Consulting Inc. SART Phase IV Reaches B & C Project 28 July 2018
2018-114
2020. The update also reports the trends in GHG emissions from various emissions sectors (e.g., transportation, building energy, agriculture).
On January 20, 2017, CARB released its proposed 2017 Climate Change Scoping Plan Update (2017 Scoping Plan Update), which lays out the framework for achieving the 2030 reductions as established in more recent legislation (discussed below). The proposed 2017 Scoping Plan Update identifies the GHG reductions needed by each emissions sector to achieve a statewide emissions level that is 40 percent below 1990 levels before 2030.
The proposed update also identifies how GHGs associated with proposed projects could be evaluated under CEQA. Specifically, it states that achieving “no net increase” in GHG emissions is the correct overall objective of projects evaluated under CEQA if conformity with an applicable local GHG reduction plan cannot be demonstrated. CARB recognizes that it may not be appropriate or feasible for every development project to mitigate its GHG emissions to no net increase and that this may not necessarily imply a substantial contribution to the cumulatively significant environmental impact of climate change.
Executive Order B-30-15
On April 20, 2015 Governor Brown signed Executive Order B-30-15 to establish a California GHG reduction target of 40 percent below 1990 levels by 2030. The Governor’s executive order aligns California’s GHG reduction targets with those of leading international governments such as the 28-nation European Union, which adopted the same target in October 2014. California is on track to meet or exceed the target of reducing GHG emissions to 1990 levels by 2020, as established in the California Global Warming Solutions Act of 2006 (AB 32, discussed above). California’s new emission reduction target of 40 percent below 1990 levels by 2030 will make it possible to reach the ultimate goal of reducing emissions 80 percent below 1990 levels by 2050. This is in line with the scientifically established levels needed in the U.S. to limit global warming below 2 degrees Celsius, the warming threshold at which major climate disruptions are projected, such as super droughts and rising sea levels.
Senate Bill 32 and Assembly Bill 197 of 2016
In August 2016, Governor Brown signed SB 32 and AB 197, which serve to extend California’s GHG reduction programs beyond 2020. SB 32 amended the Health and Safety Code to include Section 38566, which contains language to authorize CARB to achieve a statewide GHG emission reduction of at least 40 percent below 1990 levels by no later than December 31, 2030. SB 32 codified the targets established by EO B-30-15 for 2030, which set the next interim step in the State’s continuing efforts to pursue the long-term target expressed in EOs S-3-05 and B-30-15 of 80 percent below 1990 emissions levels by 2050.
Senate Bill X1-2 of 2011 and Senate Bill 350 of 2015
SB X1-2 of 2011 requires all California utilities to generate 33 percent of their electricity from renewables by 2020. SB X1-2 sets a three-stage compliance period requiring all California utilities, including independently-owned utilities, energy service providers, and community choice aggregators, to generate 20 percent of their electricity from renewables by December 31, 2013; 25 percent by December 31, 2016; and 33 percent by December 31, 2020. SB X1-2 also requires the renewable electricity standard to be met increasingly with renewable energy that is supplied to the California grid from sources within, or directly

Air Quality and Greenhouse Gas Assessment – SART Phase IV Reaches B & C Project
ECORP Consulting Inc. SART Phase IV Reaches B & C Project 29 July 2018
2018-114
proximate to, California. SB X1-2 mandates that renewables from these sources make up at least 50 percent of the total renewable energy for the 2011-2013 compliance period, at least 65 percent for the 2014-2016 compliance period, and at least 75 percent for 2016 and beyond. In October 2015, SB 350 was signed by Governor Brown, which requires retail sellers and publicly-owned utilities to procure 50 percent of their electricity from renewable resources by 2030.
Local
South Coast Air Quality Management District
To provide guidance to local lead agencies on determining significance for GHG emissions in CEQA documents, SCAQMD staff is convening an ongoing GHG CEQA Significance Threshold Working Group. Members of the working group include government agencies implementing CEQA and representatives from various stakeholder groups that provide input to SCAQMD staff on developing the significance thresholds. On October 8, 2008, the SCAQMD released the Draft AQMD Staff CEQA GHG Significance Thresholds. These thresholds have not been finalized and continue to be developed through the working group.
On September 28, 2010, SCAQMD Working Group Meeting #15 provided further guidance, including an interim screening level numeric “bright-line” threshold of 3,000 metric tons of CO2e annually and an efficiency-based threshold of 4.8 metric tons of CO2e per service population (defined as the people that work, study, live, patronize and/or congregate on the Project site) per year in 2020 and 3.0 metric tons of CO2e per service population per year in 2035. The SCAQMD has not announced when staff is expecting to present a finalized version of these thresholds to the governing board. The SCAQMD has also adopted Rules 2700, 2701, and 2702 that address GHG reductions; however, these rules are currently applicable only to boilers and process heaters, forestry, and manure management projects.
Southern California Association of Governments
On April 7, 2016, the Southern California Association of Governments (SCAG) Regional Council adopted the 2016-2040 Regional Transportation Plan/ Sustainable Communities Strategy (2016 RTP/SCS). The 2016 RTP/SCS charts a course for closely integrating land use and transportation – so that the region can grow smartly and sustainably. It was prepared through a collaborative, continuous, and comprehensive process with input from local governments, county transportation commissions, tribal governments, non-profit organizations, businesses and local stakeholders within the counties of Imperial, Los Angeles, Orange, Riverside, San Bernardino, and Ventura. The 2016 RTP/SCS is a long-range visioning plan that balances future mobility and housing needs with economic, environmental and public health goals. The SCAG region strives toward sustainability through integrated land use and transportation planning. The SCAG region must achieve specific federal air quality standards and is required by state law to lower regional GHG emissions.
County of San Bernardino Greenhouse Gas Emissions Reduction Plan
In September 2011, the County of San Bernardino adopted the San Bernardino GHG Reduction Plan (GHG Plan) based on the premise that the County and the community it represents are uniquely capable of addressing emissions associated with sources under the County’s jurisdiction and that the County’s

Air Quality and Greenhouse Gas Assessment – SART Phase IV Reaches B & C Project
ECORP Consulting Inc. SART Phase IV Reaches B & C Project 30 July 2018
2018-114
emission reduction efforts should coordinate with the state strategies of reducing emissions in order to reduce emissions in an efficient and cost-effective manner. This GHG Plan presents a comprehensive set of actions to reduce the County’s internal and external GHG emissions to 15 percent below current levels by 2020, consistent with the AB 32 Scoping Plan. The GHG Plan identifies GHG emissions reduction goals, objectives, and strategies categorized in six sectors: Building Energy (addressing energy efficiency and alternative energy in buildings and renewable energy generation facilities), Transportation and Land Use, Solid Waste/Landfills, Stationary Sources, Agriculture and Resource Conservation, and Water Conservation. For each sector, reduction strategies have been developed to achieve the County’s 2020 emissions reduction target.
The March 2015 update of the GHG Emissions Development Review Process updates the language the performance standard bringing it up to date with current code, and improves upon the menu of options within the screening tables proportioning point values to more accurately account for expected GHG reductions and revised the descriptions of the energy efficiency related options to better describe the physical improvements that would be made in choosing that option.
City of Redlands Climate Action Plan
The State of California requires all cities that create a new general plan or update their general plan document to consider its impacts on GHG emissions. In order to do so, cities typically complete a Climate Action Plan (CAP). The CAP must achieve the emission reduction goals outlined by the Global Warming Solutions Act of 2006 (AB 32), which as previously described requires that statewide GHG emissions be reduced to 1990 levels by 2020. The City of Redlands adopted a CAP in March 2011 and the measures identified in Redland’s CAP will meet the State’s AB 32 GHG emission reduction mandate. The Plan identifies opportunities for achieving economic growth based on energy efficiency, expanded use of renewable energy and other clean technologies, and other sustainable practices. Goals and policies applicable to the Project include the following:
Goal LU3: Encourage non-motorized transportation.
Policy LU3.2: In accordance with the General Plan, develop a city-wide comprehensive Non-Motorized Transportation Plan. Among its elements, the plan should consider bike lanes with “sharrows” for appropriate locations.
Policy LU3.3: Complete Santa Ana River Trail [SART] including connections to Redlands Citrus Valley High School, Mentone Senior Center/Library, and employment areas in northeast Redlands.
3.3 Greenhouse Gas Emissions Impact Assessment
Thresholds of Significance
The impact analysis provided below is based on the following California Environmental Quality Act (CEQA) Guidelines Appendix G thresholds of significance. The Project would result in a significant impact to GHG emissions if it would:

Air Quality and Greenhouse Gas Assessment – SART Phase IV Reaches B & C Project
ECORP Consulting Inc. SART Phase IV Reaches B & C Project 31 July 2018
2018-114
1) Generate GHG emissions, either directly or indirectly, that may have a significant impact on the environment.
2) Conflict with any applicable plan, policy, or regulation of an agency adopted for the purpose of reducing the emissions of greenhouse gases.
Project GHG Thresholds
As noted earlier, AB 32 is a legal mandate requiring that statewide GHG emissions be reduced to 1990 levels by 2020. In adopting AB 32, the legislature determined the necessary GHG reductions for the state to make in order to sufficiently offset its contribution to the cumulative climate change problem. AB 32 is a legally mandated requirement for the reduction of GHGs. As such, compliance with AB 32 is the current adopted basis upon which an agency can base its significance threshold for evaluating a project’s GHG impacts. However, it is acknowledged that the recently signed legislation of SB 32 has established in GHG emission reduction targets for years beyond 2020.
While statewide goals for GHG reductions in the years beyond 2020 have been recently codified into state law with the passage of SB 32, at the time of writing this document, no specific policies or emissions reduction mechanisms have been established. Therefore, while Project design can contribute to reducing potential GHG emissions from the proposed Project, achievement of future GHG efficiency standards is also dependent on regulatory controls applied to all sectors of the California economy. Thus, the ability of this Project—and all land use development—to achieve GHG reduction goals beyond 2020 is partially out of the control of the Project.
For the purposes of this evaluation, the Project is evaluated for consistency with the County of San Bernardino GHG Emissions Reduction Plan, previously described. The CAP is consistent with AB 32 and sets the County on a path to achieve a more substantial long-term reduction in the post-2020 period. The Project is also evaluated for consistency with the City of Redlands CAP, described above.
In addition to the assessment of Project consistency with these applicable GHG reduction plans, the proposed Project will also be compared to the SCAQMD interim screening level numeric bright-line threshold of 3,000 metric tons of CO2e annually. If it is determined that the proposed Project is estimated to exceed this screening threshold, it will then be compared to the SCAQMD-recommended efficiency-based threshold of 4.8 metric tons of CO2e per service population (Project employees + patrons + residents) per year in 2020, and 3.0 metric tons of CO2e per service population per year in 2035. These thresholds were developed as part of the SCAQMD GHG CEQA Significance Threshold Working Group. The working group was formed to assist the SCAQMD’s efforts to develop a GHG significance threshold and is composed of a wide variety of stakeholders including the state Office of Planning and Research (OPR), CARB, the Attorney General’s Office, a variety of city and county planning departments in the SoCAB, various utilities such as sanitation and power companies throughout the basin, industry groups, and environmental and professional organizations. The numeric bright line and efficiency-based thresholds were developed to be consistent with CEQA requirements for developing significance thresholds, are supported by substantial evidence, and provide guidance to CEQA practitioners and lead agencies with regard to determining whether GHG emissions from a proposed project are significant.

Air Quality and Greenhouse Gas Assessment – SART Phase IV Reaches B & C Project
ECORP Consulting Inc. SART Phase IV Reaches B & C Project 32 July 2018
2018-114
Methodology
GHG impacts were assessed in accordance with methodologies recommended by the County of San Bernardino, the City of Redlands, CARB and the SCAQMD. Where quantification was required, GHG emissions were modeled using the California Emissions Estimator Model (CalEEMod), version 2016.3.2. CalEEMod is a statewide land use emissions computer model designed to quantify potential GHG emissions associated with both construction and operations from a variety of land use projects. Project construction-generated air pollutant emissions were primarily calculated using CalEEMod model defaults for San Bernardino County. However, the specific construction equipment anticipated to be used has been provided by the County Public Works Department and accounted for in the emissions model predictions. Operational air pollutant emissions were based on the Project site plans.
Impact Analysis
CONFLICT WITH ANY APPLICABLE PLAN, POLICY, OR REGULATION OF AN AGENCY
ADOPTED FOR THE PURPOSE OF REDUCING THE EMISSIONS OF GREENHOUSE GASES
City of Redlands Climate Action Plan
The Redlands Community Sustainability Plan (2011) is a strategic planning document that identifies sources of GHG emissions within the City’s boundaries, presents current and future emissions estimates, identifies a GHG reduction target for future years, and presents strategic programs, policies, and projects to reduce emissions from the energy, transportation, land use, water use, and waste sectors. The GHG-reduction strategies in the CAP build on inventory results and key opportunities prioritized by City staff and members of the public. The CAP strategies consist of strategies that identify the steps the City will take to support reductions in GHG emissions. The City will achieve these reductions in GHG emissions through a mix of voluntary programs and new strategic standards. All standards presented in the CAP respond to the needs of development, avoiding unnecessary regulation, streamlining new development, and achieving more efficient use of resources.
Construction of the proposed Project would last approximately six months and construction-related GHG emissions would cease upon completion. The proposed Project would not include the provision of new permanent stationary or mobile sources of emissions, and therefore, by its very nature, would not generate quantifiable GHG emissions from Project operations. Thus, the Project is consistent with the GHG inventory and forecast in the Redlands CAP since it would not contribute to the generation of GHG emissions beyond that considered in the CAP. Furthermore, the trail would promote the use of alternative transportation, including walking and cycling, which would, in turn, reduce GHG emissions due to the reduced reliance on automobiles, a primary source of GHG emissions. More importantly, the Project directly implements CAP Goal LU3 and Policy LU3.3, which seeks to encourage non-motorized transportation and specifically complete the SART.
The Project is consistent with the City’s CAP as it would not conflict with the CAP GHG inventory or forecast and serves to directly implement CAP Goals and Policies. No Impact would occur.

Air Quality and Greenhouse Gas Assessment – SART Phase IV Reaches B & C Project
ECORP Consulting Inc. SART Phase IV Reaches B & C Project 33 July 2018
2018-114
County of San Bernardino Greenhouse Gas Emissions Reduction Plan
The County of San Bernardino GHG Reduction Plan establishes a GHG emissions reduction target for the year 2020 that is 15 percent below year 2007 emission levels. The GHG Plan is consistent with AB 32 and sets the County on a path to achieve a more substantial long-term reduction in the post-2020 period. Achieving this level of emissions would ensure that the contribution to GHG emissions from activities covered by the GHG Reduction Plan would not be cumulatively considerable. As described in Chapter 4.0 of the GHG Plan, all new development under the jurisdiction of the County is required to quantify a project’s GHG emissions and adopt feasible mitigation to reduce project emissions below a level of significance.
The County GHG Reduction Plan identifies a review standard of 3,000 metric tons of CO2e per year to identify and mitigate project emissions. Projects estimated to generated less than 3,000 metric tons of CO2e per year are considered less than significant. For projects exceeding 3,000 metric tons of CO2e per year, the developer may use the GHG Reduction Plan Screening Tables in the GHG Reduction Plan as a tool to assist with calculating GHG reduction measures and the determination of a significance finding. Projects that garner 100 or more points on the Screening Tables are considered less than significant. (The point system was devised to ensure project compliance with the reduction measures in the GHG Plan such that the GHG emissions from new development, when considered together with those from existing development, would allow the County to meet its year 2020 target and support longer-term reductions in GHG emissions beyond year 2020.)
As shown in Table 3-2, below, the total amount of proposed GHG emissions would total 33 metric tons of CO2e per year, which does not exceed the County’s 3,000 metric tons of CO2e per year screening threshold. Therefore, the Project does not conflict with the San Bernardino Greenhouse Gas Emissions Reduction Plan. No impact would occur.
CONTRIBUTION OF GREENHOUSE GAS EMISSIONS In addition to the assessment of Project consistency with applicable GHG reduction plans, the proposed Project is also compared to the SCAQMD interim screening level numeric bright-line threshold of 3,000 metric tons of CO2e annually. If it is determined that the proposed Project is estimated to exceed this screening threshold, it will then be compared to the SCAQMD-recommended efficiency-based threshold of 4.8 metric tons of CO2e per service population (Project employees + patrons + residents) per year in 2020, and 3.0 metric tons of CO2e per service population per year in 2035. Construction
Construction-related activities that would generate GHGs include worker commute trips, haul trucks carrying supplies and materials to and from the Project site, and off-road construction equipment (e.g., dozers, loaders, excavators). Projected GHG emissions from construction have been quantified and amortized over the life of the Project (amortized over 30 years pursuant to SCAQMD guidance). Table 3-2 illustrates the specific construction-generated GHG emissions that would result from construction of the Project.

Air Quality and Greenhouse Gas Assessment – SART Phase IV Reaches B & C Project
ECORP Consulting Inc. SART Phase IV Reaches B & C Project 34 July 2018
2018-114
Table 3-2. Construction-Related Greenhouse Gas Emissions
Emissions Source CO2e (Metric Tons/ Year)
Year 2020 999
Construction Amortized over 30 Years 33
County of San Bernardino GHG Reduction Plan & SCAQMD Screening Threshold
3,000
Exceed Thresholds? No
Source: CalEEMod version 2016.3.2. Refer to Attachment A for Model Data Outputs. Note: Emission projections account for the import of 300 cubic yards of soil during site preparation and grading activities and the hauling
away of 508 tons of demolition material.
As shown in Table 3-2, Project construction would result in the generation of approximately 999 metric tons of CO2e over the course of construction. Amortized construction emissions equate to 33 CO2e per year. Neither value would exceed the SCAQMD’s interim screening level numeric bright-line threshold of 3,000 metric tons of CO2e annually. (Project emissions also do not exceed the County’s San Bernardino Greenhouse Gas Emissions Reduction Plan screening threshold of 3,000 CO2e per year). Therefore, the impact is less than significant.
Operations
In terms of operational GHG emissions, the proposed Project involves the construction of an approximately 3.2-mile-long section of the SART. The proposed Project will not include the provision of new permanent stationary or mobile sources of emissions, and therefore, by its very nature, will not generate quantifiable GHG emissions from Project operations. The Project does not propose any buildings and therefore no permanent source or stationary source emissions. Once the Project is completed, there will be no resultant increase in automobile trips to the area because the recreational trail will not require daily visits. While it is anticipated that the Project would require intermittent maintenance to be conducted by County public works staff, such maintenance would be minimal requiring a negligible amount of traffic trips on an annual basis. Therefore, there is no operational impact.
CUMULATIVE GHG IMPACTS Climate change is a global problem. And GHGs are global pollutants, unlike criteria air pollutants and toxic air contaminants, which are pollutants of regional and local concern. Whereas pollutants with localized air quality effects have relatively short atmospheric lifetimes (about 1 day), GHGs have much longer atmospheric lifetimes of 1 year to several thousand years that allow them to be dispersed around the globe. It is generally the case that an individual project of this size and nature is of insufficient magnitude by itself to influence climate change or result in a substantial contribution to the global GHG inventory. GHG impacts are recognized as exclusively cumulative impacts; there are no non-cumulative GHG emission impacts from a climate change perspective. The additive effect of Project-related GHGs would not result in

Air Quality and Greenhouse Gas Assessment – SART Phase IV Reaches B & C Project
ECORP Consulting Inc. SART Phase IV Reaches B & C Project 35 July 2018
2018-114
a reasonably foreseeable cumulatively considerable contribution to global climate change. In addition, the proposed Project as well as other cumulative related projects would also be subject to all applicable regulatory requirements, which would further reduce GHG emissions. As previously discussed, the proposed Project would not conflict with the County’s GHG Reduction Plan nor the City’s CAP. Additionally, Project emissions would not exceed SCAQMD significance thresholds. Therefore, the Project’s cumulative contribution of GHG emissions would be less than significant.
Air Quality and Greenhouse Gas Assessment – SART Phase IV Reaches B & C Project
ECORP Consulting Inc. SART Phase IV Reaches B & C Project 36 July 2018
2018-114
4.0 REFERENCES
CAPCOA (California Air Pollution Control Officers Association). 2011. Health Effects. http://www.capcoa.org/health-effects/.
CARB (California Air Resources Board). 2005. Air Quality and Land Use Handbook
———. 2008. Climate Change Scoping Plan Appendices (Appendix F).
———. 2017a. State and Federal Area Designation Maps. http://www.arb.ca.gov/desig/adm/adm.htm.
———. 2017b. California Greenhouse Gas Emission Inventory 2017 Edition. https://www.arb.ca.gov/cc/inventory/data/data.htm.
———. 2018. Air Quality Data Statistics. http://www.arb.ca.gov/adam/index.html.
California Department of Conservation (DOC). 2000. A General Location Guide for Ultramafic Rocks in California - Areas More Likely to Contain Naturally Occurring Asbestos.
EPA (US Environmental Protection Agency). 2016a. Climate Change – Greenhouse Gas Emissions: Carbon Dioxide. http://www.epa.gov/climatechange/emissions/co2.html.
———. 2016b. Methane. https://www3.epa.gov/climatechange/ghgemissions/gases/ch4.html.
———. 2016c. Nitrous Oxide. https://www3.epa.gov/climatechange/ghgemissions/gases/n2o.html.
IPCC (Intergovernmental Panel on Climate Change). 2013. Carbon and Other Biogeochemical Cycles. In: Climate Change 2013: The Physical Science Basis. Contribution of Working Group I to the Fifth Assessment Report of the Intergovernmental Panel on Climate Change. http://www.climatechange2013.org/ images/report/WG1AR5_ALL_FINAL.pdf.
———. 2014. Climate Change 2014 Synthesis Report: Approved Summary for Policymakers. http://www.ipcc.ch/.
Redlands, City of, 2011. Redlands Community Sustainability Plan. http://www.ca-ilg.org/post/city-redlands-climate-action-plan.
San Bernardino, County of. 2011. Greenhouse Gas Emissions Reduction Plan. http://cms.sbcounty.gov/lus/Planning/Environmental.aspx.
SCAQMD (South Coast Air Quality Management District). 1992. 1992 Federal Attainment Plan for Carbon Monoxide.
———. 1993. CEQA Air Quality Handbook.
———. 2008. Final Localized Significance Threshold Methodology (dated June 2003 [revised 2008]).
———. 2009. Localized Significance Threshold Appendix C – Mass Rate LST Look-Up Tables. Revised October 21, 2009. http://www.aqmd.gov/ceqa/handbook/LST/LST.html.

ATTACHMENT A
CalEEMod Output Files

1.1 Land Usage
Land Uses Size Metric Lot Acreage Floor Surface Area Population
Other Non-Asphalt Surfaces 57.59 Acre 57.59 2,508,620.40 0
1.2 Other Project Characteristics
Urbanization
Climate Zone
Urban
10
Wind Speed (m/s) Precipitation Freq (Days)2.4 28
1.3 User Entered Comments & Non-Default Data
1.0 Project Characteristics
Utility Company Southern California Edison
2020Operational Year
CO2 Intensity (lb/MWhr)
702.44 0.029CH4 Intensity (lb/MWhr)
0.006N2O Intensity (lb/MWhr)
SART Phase IV, Reaches B & CRiverside-South Coast County, Annual
CalEEMod Version: CalEEMod.2016.3.2 Date: 7/18/2018 9:36 AMPage 1 of 32
SART Phase IV, Reaches B & C - Riverside-South Coast County, Annual

Project Characteristics -
Land Use -
Construction Phase - Assumed 6 months of construction per Project Applicant.
Off-road Equipment - Construction equipment per Project Applicant.
Off-road Equipment - Construction equipment per Project Applicant.
Off-road Equipment - Construction equipment per Project Applicant.
Off-road Equipment - Construction equipment per Project Applicant.
Off-road Equipment - Construction equipment per Project Applicant.
Off-road Equipment - Construction equipment per Project Applicant.
Grading -
Demolition - Assumed 0.8 miles x 5 feet width of asphault demo.
Consumer Products -
Construction Off-road Equipment Mitigation - Per SCAQMD Rule 403. Reductions per SCAQMD CEQA Handbook.
Architectural Coating - Adjusted painting square footage to reflect 3.2 miles of striping.
Trips and VMT - Building construction vendor trips accounted for in construction equipment list.
Table Name Column Name Default Value New Value
tblArchitecturalCoating ConstArea_Parking 150,517.00 16,896.00
tblConstDustMitigation CleanPavedRoadPercentReduction 0 40
tblConstDustMitigation WaterUnpavedRoadVehicleSpeed 0 15
tblConstructionPhase NumDays 75.00 5.00
tblConstructionPhase NumDays 1,110.00 60.00
tblConstructionPhase NumDays 70.00 7.00
tblConstructionPhase NumDays 110.00 15.00
tblConstructionPhase NumDays 75.00 50.00
tblConstructionPhase NumDays 40.00 7.00
tblConstructionPhase PhaseEndDate 12/2/2025 10/19/2020
CalEEMod Version: CalEEMod.2016.3.2 Date: 7/18/2018 9:36 AMPage 2 of 32
SART Phase IV, Reaches B & C - Riverside-South Coast County, Annual

tblConstructionPhase PhaseEndDate 5/6/2025 8/3/2020
tblConstructionPhase PhaseEndDate 7/7/2020 4/9/2020
tblConstructionPhase PhaseEndDate 2/2/2021 5/11/2020
tblConstructionPhase PhaseEndDate 8/19/2025 10/12/2020
tblConstructionPhase PhaseEndDate 9/1/2020 4/20/2020
tblConstructionPhase PhaseStartDate 8/20/2025 10/13/2020
tblConstructionPhase PhaseStartDate 2/3/2021 5/12/2020
tblConstructionPhase PhaseStartDate 9/2/2020 4/21/2020
tblConstructionPhase PhaseStartDate 5/7/2025 8/4/2020
tblConstructionPhase PhaseStartDate 7/8/2020 4/10/2020
tblGrading MaterialImported 0.00 150.00
tblGrading MaterialImported 0.00 150.00
tblOffRoadEquipment OffRoadEquipmentUnitAmount 1.00 0.00
tblOffRoadEquipment OffRoadEquipmentUnitAmount 3.00 0.00
tblOffRoadEquipment OffRoadEquipmentUnitAmount 3.00 0.00
tblOffRoadEquipment OffRoadEquipmentUnitAmount 1.00 0.00
tblOffRoadEquipment OffRoadEquipmentUnitAmount 1.00 2.00
tblOffRoadEquipment OffRoadEquipmentUnitAmount 2.00 1.00
tblOffRoadEquipment OffRoadEquipmentUnitAmount 2.00 1.00
tblOffRoadEquipment OffRoadEquipmentUnitAmount 2.00 3.00
tblOffRoadEquipment OffRoadEquipmentUnitAmount 2.00 1.00
tblOffRoadEquipment OffRoadEquipmentUnitAmount 1.00 0.00
tblOffRoadEquipment OffRoadEquipmentUnitAmount 3.00 1.00
tblOffRoadEquipment OffRoadEquipmentUnitAmount 3.00 2.00
tblOffRoadEquipment OffRoadEquipmentUnitAmount 4.00 2.00
tblOffRoadEquipment OffRoadEquipmentUnitAmount 1.00 0.00
tblTripsAndVMT VendorTripNumber 411.00 0.00
CalEEMod Version: CalEEMod.2016.3.2 Date: 7/18/2018 9:36 AMPage 3 of 32
SART Phase IV, Reaches B & C - Riverside-South Coast County, Annual

2.0 Emissions Summary
2.1 Overall Construction
ROG NOx CO SO2 Fugitive PM10
Exhaust PM10
PM10 Total
Fugitive PM2.5
Exhaust PM2.5
PM2.5 Total Bio- CO2 NBio- CO2 Total CO2 CH4 N2O CO2e
Year tons/yr MT/yr
2020 0.6711 5.3634 4.7742 0.0112 0.4341 0.2291 0.6632 0.1153 0.2119 0.3272 0.0000 993.1007 993.1007 0.2172 0.0000 998.5304
Maximum 0.6711 5.3634 4.7742 0.0112 0.4341 0.2291 0.6632 0.1153 0.2119 0.3272 0.0000 993.1007 993.1007 0.2172 0.0000 998.5304
Unmitigated Construction
ROG NOx CO SO2 Fugitive PM10
Exhaust PM10
PM10 Total
Fugitive PM2.5
Exhaust PM2.5
PM2.5 Total Bio- CO2 NBio- CO2 Total CO2 CH4 N2O CO2e
Year tons/yr MT/yr
2020 0.6711 5.3634 4.7742 0.0112 0.2672 0.2291 0.4963 0.0736 0.2119 0.2855 0.0000 993.0999 993.0999 0.2172 0.0000 998.5296
Maximum 0.6711 5.3634 4.7742 0.0112 0.2672 0.2291 0.4963 0.0736 0.2119 0.2855 0.0000 993.0999 993.0999 0.2172 0.0000 998.5296
Mitigated Construction
CalEEMod Version: CalEEMod.2016.3.2 Date: 7/18/2018 9:36 AMPage 4 of 32
SART Phase IV, Reaches B & C - Riverside-South Coast County, Annual

2.2 Overall Operational
ROG NOx CO SO2 Fugitive PM10
Exhaust PM10
PM10 Total
Fugitive PM2.5
Exhaust PM2.5
PM2.5 Total Bio- CO2 NBio- CO2 Total CO2 CH4 N2O CO2e
Category tons/yr MT/yr
Area 0.1971 1.0000e-005
7.4000e-004
0.0000 0.0000 0.0000 0.0000 0.0000 0.0000 1.4300e-003
1.4300e-003
0.0000 0.0000 1.5300e-003
Energy 0.0000 0.0000 0.0000 0.0000 0.0000 0.0000 0.0000 0.0000 0.0000 0.0000 0.0000 0.0000 0.0000 0.0000
Mobile 0.0000 0.0000 0.0000 0.0000 0.0000 0.0000 0.0000 0.0000 0.0000 0.0000 0.0000 0.0000 0.0000 0.0000 0.0000 0.0000
Waste 0.0000 0.0000 0.0000 0.0000 0.0000 0.0000 0.0000 0.0000 0.0000 0.0000
Water 0.0000 0.0000 0.0000 0.0000 0.0000 0.0000 0.0000 0.0000 0.0000 0.0000
Total 0.1971 1.0000e-005
7.4000e-004
0.0000 0.0000 0.0000 0.0000 0.0000 0.0000 0.0000 0.0000 1.4300e-003
1.4300e-003
0.0000 0.0000 1.5300e-003
Unmitigated Operational
ROG NOx CO SO2 Fugitive PM10
Exhaust PM10
PM10 Total
Fugitive PM2.5
Exhaust PM2.5
PM2.5 Total
Bio- CO2 NBio-CO2 Total CO2 CH4 N20 CO2e
Percent Reduction
0.00 0.00 0.00 0.00 38.46 0.00 25.17 36.20 0.00 12.75 0.00 0.00 0.00 0.00 0.00 0.00
Quarter Start Date End Date Maximum Unmitigated ROG + NOX (tons/quarter) Maximum Mitigated ROG + NOX (tons/quarter)
1 4-1-2020 6-30-2020 3.0094 3.0094
2 7-1-2020 9-30-2020 2.6906 2.6906
Highest 3.0094 3.0094
CalEEMod Version: CalEEMod.2016.3.2 Date: 7/18/2018 9:36 AMPage 5 of 32
SART Phase IV, Reaches B & C - Riverside-South Coast County, Annual

2.2 Overall Operational
ROG NOx CO SO2 Fugitive PM10
Exhaust PM10
PM10 Total
Fugitive PM2.5
Exhaust PM2.5
PM2.5 Total Bio- CO2 NBio- CO2 Total CO2 CH4 N2O CO2e
Category tons/yr MT/yr
Area 0.1971 1.0000e-005
7.4000e-004
0.0000 0.0000 0.0000 0.0000 0.0000 0.0000 1.4300e-003
1.4300e-003
0.0000 0.0000 1.5300e-003
Energy 0.0000 0.0000 0.0000 0.0000 0.0000 0.0000 0.0000 0.0000 0.0000 0.0000 0.0000 0.0000 0.0000 0.0000
Mobile 0.0000 0.0000 0.0000 0.0000 0.0000 0.0000 0.0000 0.0000 0.0000 0.0000 0.0000 0.0000 0.0000 0.0000 0.0000 0.0000
Waste 0.0000 0.0000 0.0000 0.0000 0.0000 0.0000 0.0000 0.0000 0.0000 0.0000
Water 0.0000 0.0000 0.0000 0.0000 0.0000 0.0000 0.0000 0.0000 0.0000 0.0000
Total 0.1971 1.0000e-005
7.4000e-004
0.0000 0.0000 0.0000 0.0000 0.0000 0.0000 0.0000 0.0000 1.4300e-003
1.4300e-003
0.0000 0.0000 1.5300e-003
Mitigated Operational
3.0 Construction Detail
Construction Phase
ROG NOx CO SO2 Fugitive PM10
Exhaust PM10
PM10 Total
Fugitive PM2.5
Exhaust PM2.5
PM2.5 Total
Bio- CO2 NBio-CO2 Total CO2 CH4 N20 CO2e
Percent Reduction
0.00 0.00 0.00 0.00 0.00 0.00 0.00 0.00 0.00 0.00 0.00 0.00 0.00 0.00 0.00 0.00
CalEEMod Version: CalEEMod.2016.3.2 Date: 7/18/2018 9:36 AMPage 6 of 32
SART Phase IV, Reaches B & C - Riverside-South Coast County, Annual

Phase Number
Phase Name Phase Type Start Date End Date Num Days Week
Num Days Phase Description
1 Demolition Demolition 4/1/2020 4/9/2020 5 7
2 Site Preparation Site Preparation 4/10/2020 4/20/2020 5 7
3 Grading Grading 4/21/2020 5/11/2020 5 15
4 Building Construction Building Construction 5/12/2020 8/3/2020 5 60
5 Paving Paving 8/4/2020 10/12/2020 5 50
6 Architectural Coating Architectural Coating 10/13/2020 10/19/2020 5 5
OffRoad Equipment
Phase Name Offroad Equipment Type Amount Usage Hours Horse Power Load Factor
Demolition Concrete/Industrial Saws 1 8.00 81 0.73
Demolition Excavators 0 8.00 158 0.38
Demolition Graders 1 7.00 187 0.41
Demolition Off-Highway Trucks 2 7.00 402 0.38
Demolition Rubber Tired Dozers 1 8.00 247 0.40
Demolition Rubber Tired Loaders 1 7.00 203 0.36
Demolition Signal Boards 3 7.00 6 0.82
Demolition Skid Steer Loaders 1 7.00 65 0.37
Demolition Tractors/Loaders/Backhoes 2 7.00 97 0.37
Site Preparation Concrete/Industrial Saws 1 7.00 81 0.73
Residential Indoor: 0; Residential Outdoor: 0; Non-Residential Indoor: 0; Non-Residential Outdoor: 0; Striped Parking Area: 16,896 (Architectural Coating – sqft)
Acres of Grading (Site Preparation Phase): 6.13
Acres of Grading (Grading Phase): 58.13
Acres of Paving: 57.59
CalEEMod Version: CalEEMod.2016.3.2 Date: 7/18/2018 9:36 AMPage 7 of 32
SART Phase IV, Reaches B & C - Riverside-South Coast County, Annual
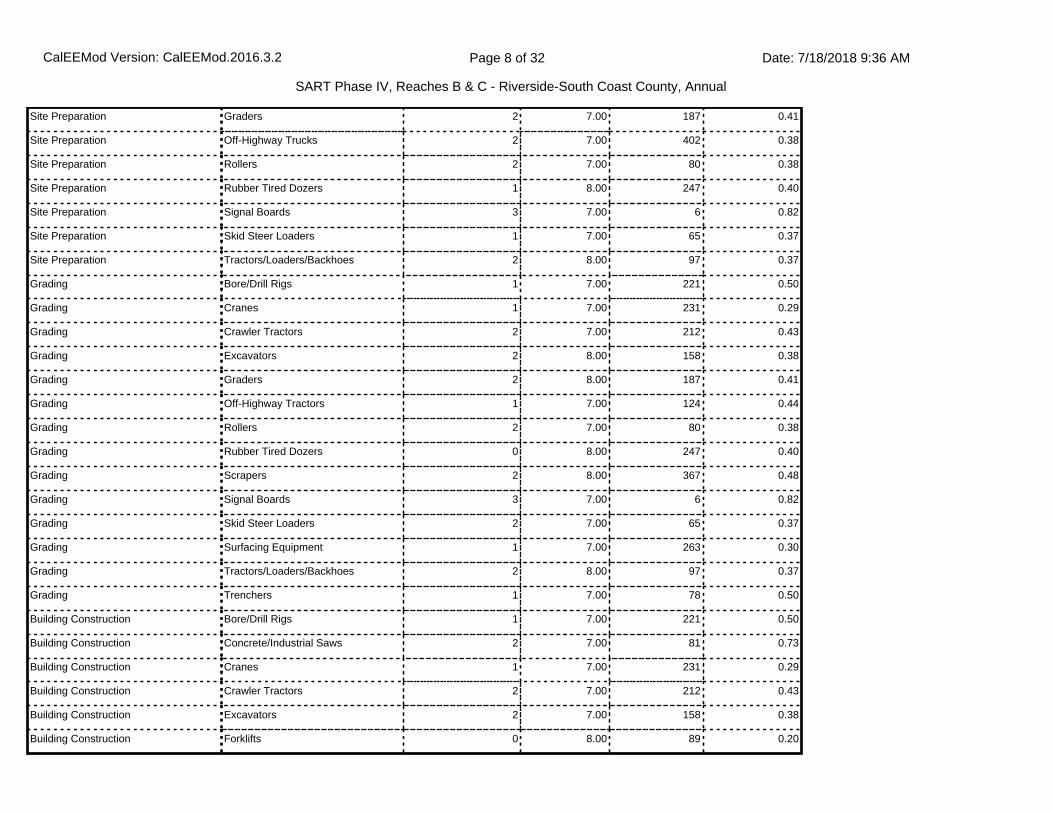
Site Preparation Graders 2 7.00 187 0.41
Site Preparation Off-Highway Trucks 2 7.00 402 0.38
Site Preparation Rollers 2 7.00 80 0.38
Site Preparation Rubber Tired Dozers 1 8.00 247 0.40
Site Preparation Signal Boards 3 7.00 6 0.82
Site Preparation Skid Steer Loaders 1 7.00 65 0.37
Site Preparation Tractors/Loaders/Backhoes 2 8.00 97 0.37
Grading Bore/Drill Rigs 1 7.00 221 0.50
Grading Cranes 1 7.00 231 0.29
Grading Crawler Tractors 2 7.00 212 0.43
Grading Excavators 2 8.00 158 0.38
Grading Graders 2 8.00 187 0.41
Grading Off-Highway Tractors 1 7.00 124 0.44
Grading Rollers 2 7.00 80 0.38
Grading Rubber Tired Dozers 0 8.00 247 0.40
Grading Scrapers 2 8.00 367 0.48
Grading Signal Boards 3 7.00 6 0.82
Grading Skid Steer Loaders 2 7.00 65 0.37
Grading Surfacing Equipment 1 7.00 263 0.30
Grading Tractors/Loaders/Backhoes 2 8.00 97 0.37
Grading Trenchers 1 7.00 78 0.50
Building Construction Bore/Drill Rigs 1 7.00 221 0.50
Building Construction Concrete/Industrial Saws 2 7.00 81 0.73
Building Construction Cranes 1 7.00 231 0.29
Building Construction Crawler Tractors 2 7.00 212 0.43
Building Construction Excavators 2 7.00 158 0.38
Building Construction Forklifts 0 8.00 89 0.20
CalEEMod Version: CalEEMod.2016.3.2 Date: 7/18/2018 9:36 AMPage 8 of 32
SART Phase IV, Reaches B & C - Riverside-South Coast County, Annual

Building Construction Generator Sets 0 8.00 84 0.74
Building Construction Graders 2 7.00 187 0.41
Building Construction Off-Highway Tractors 1 7.00 124 0.44
Building Construction Off-Highway Trucks 1 7.00 402 0.38
Building Construction Other Construction Equipment 1 7.00 172 0.42
Building Construction Pavers 1 7.00 130 0.42
Building Construction Paving Equipment 1 7.00 132 0.36
Building Construction Rollers 1 7.00 80 0.38
Building Construction Rough Terrain Forklifts 1 7.00 100 0.40
Building Construction Scrapers 2 7.00 367 0.48
Building Construction Signal Boards 3 7.00 6 0.82
Building Construction Skid Steer Loaders 2 7.00 65 0.37
Building Construction Surfacing Equipment 1 7.00 263 0.30
Building Construction Tractors/Loaders/Backhoes 2 7.00 97 0.37
Building Construction Trenchers 1 7.00 78 0.50
Building Construction Welders 0 8.00 46 0.45
Paving Graders 1 7.00 187 0.41
Paving Off-Highway Tractors 1 7.00 124 0.44
Paving Off-Highway Trucks 2 7.00 402 0.38
Paving Pavers 1 8.00 130 0.42
Paving Paving Equipment 1 8.00 132 0.36
Paving Rollers 3 8.00 80 0.38
Paving Scrapers 2 7.00 367 0.48
Paving Signal Boards 3 7.00 6 0.82
Paving Skid Steer Loaders 1 7.00 65 0.37
Paving Surfacing Equipment 1 7.00 263 0.30
Paving Tractors/Loaders/Backhoes 2 7.00 97 0.37
CalEEMod Version: CalEEMod.2016.3.2 Date: 7/18/2018 9:36 AMPage 9 of 32
SART Phase IV, Reaches B & C - Riverside-South Coast County, Annual

3.1 Mitigation Measures Construction
Use Soil Stabilizer
Replace Ground Cover
Water Exposed Area
Reduce Vehicle Speed on Unpaved Roads
Clean Paved Roads
Architectural Coating Air Compressors 0 6.00 78 0.48
Architectural Coating Off-Highway Trucks 2 7.00 402 0.38
Architectural Coating Signal Boards 3 7.00 6 0.82
Trips and VMT
Phase Name Offroad Equipment Count
Worker Trip Number
Vendor Trip Number
Hauling Trip Number
Worker Trip Length
Vendor Trip Length
Hauling Trip Length
Worker Vehicle Class
Vendor Vehicle Class
Hauling Vehicle Class
Demolition 12 30.00 0.00 50.00 14.70 6.90 20.00 LD_Mix HDT_Mix HHDT
Site Preparation 14 35.00 0.00 19.00 14.70 6.90 20.00 LD_Mix HDT_Mix HHDT
Grading 22 55.00 0.00 19.00 14.70 6.90 20.00 LD_Mix HDT_Mix HHDT
Building Construction 28 1,054.00 0.00 0.00 14.70 6.90 20.00 LD_Mix HDT_Mix HHDT
Paving 18 45.00 0.00 0.00 14.70 6.90 20.00 LD_Mix HDT_Mix HHDT
Architectural Coating 5 211.00 0.00 0.00 14.70 6.90 20.00 LD_Mix HDT_Mix HHDT
CalEEMod Version: CalEEMod.2016.3.2 Date: 7/18/2018 9:36 AMPage 10 of 32
SART Phase IV, Reaches B & C - Riverside-South Coast County, Annual

3.2 Demolition - 2020
ROG NOx CO SO2 Fugitive PM10
Exhaust PM10
PM10 Total
Fugitive PM2.5
Exhaust PM2.5
PM2.5 Total Bio- CO2 NBio- CO2 Total CO2 CH4 N2O CO2e
Category tons/yr MT/yr
Fugitive Dust 5.4700e-003
0.0000 5.4700e-003
8.3000e-004
0.0000 8.3000e-004
0.0000 0.0000 0.0000 0.0000 0.0000 0.0000
Off-Road 0.0140 0.1423 0.0823 2.0000e-004
6.2000e-003
6.2000e-003
5.7700e-003
5.7700e-003
0.0000 17.7187 17.7187 5.1500e-003
0.0000 17.8475
Total 0.0140 0.1423 0.0823 2.0000e-004
5.4700e-003
6.2000e-003
0.0117 8.3000e-004
5.7700e-003
6.6000e-003
0.0000 17.7187 17.7187 5.1500e-003
0.0000 17.8475
Unmitigated Construction On-Site
ROG NOx CO SO2 Fugitive PM10
Exhaust PM10
PM10 Total
Fugitive PM2.5
Exhaust PM2.5
PM2.5 Total Bio- CO2 NBio- CO2 Total CO2 CH4 N2O CO2e
Category tons/yr MT/yr
Hauling 1.3000e-004
6.0600e-003
7.8000e-004
2.0000e-005
4.3000e-004
2.0000e-005
4.5000e-004
1.2000e-004
2.0000e-005
1.4000e-004
0.0000 1.8127 1.8127 1.1000e-004
0.0000 1.8156
Vendor 0.0000 0.0000 0.0000 0.0000 0.0000 0.0000 0.0000 0.0000 0.0000 0.0000 0.0000 0.0000 0.0000 0.0000 0.0000 0.0000
Worker 4.8000e-004
3.4000e-004
3.6100e-003
1.0000e-005
1.1500e-003
1.0000e-005
1.1600e-003
3.1000e-004
1.0000e-005
3.1000e-004
0.0000 0.9656 0.9656 2.0000e-005
0.0000 0.9662
Total 6.1000e-004
6.4000e-003
4.3900e-003
3.0000e-005
1.5800e-003
3.0000e-005
1.6100e-003
4.3000e-004
3.0000e-005
4.5000e-004
0.0000 2.7783 2.7783 1.3000e-004
0.0000 2.7818
Unmitigated Construction Off-Site
CalEEMod Version: CalEEMod.2016.3.2 Date: 7/18/2018 9:36 AMPage 11 of 32
SART Phase IV, Reaches B & C - Riverside-South Coast County, Annual
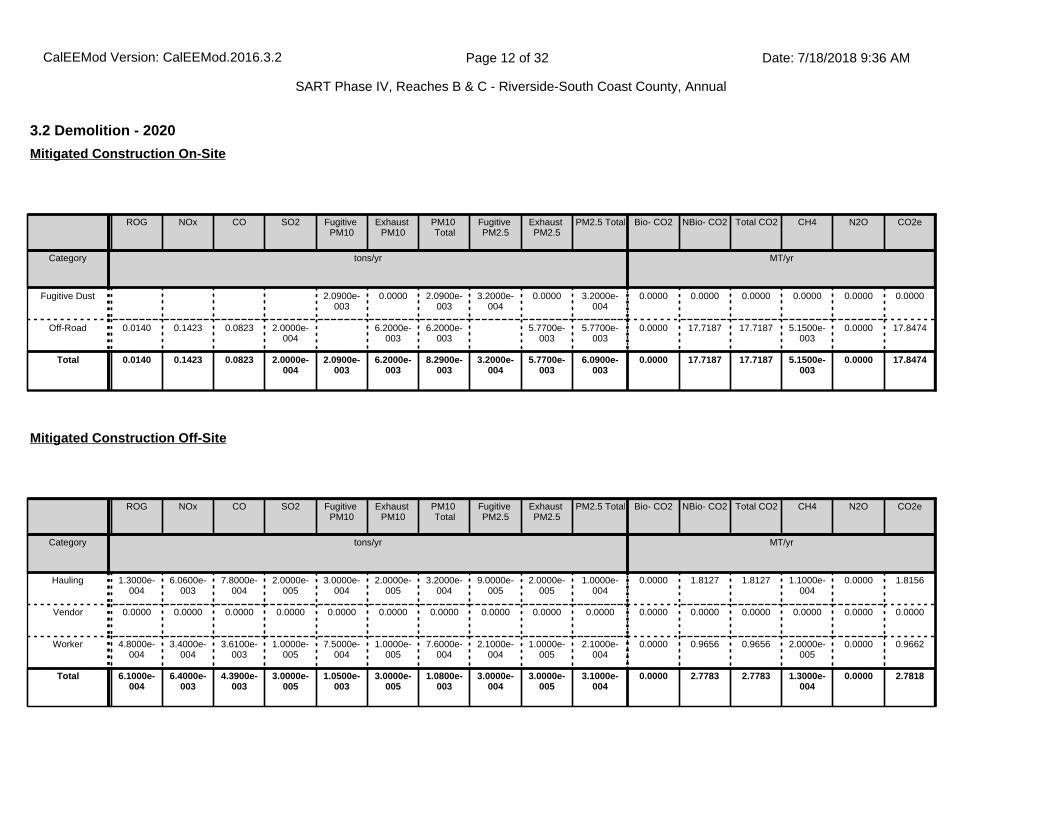
3.2 Demolition - 2020
ROG NOx CO SO2 Fugitive PM10
Exhaust PM10
PM10 Total
Fugitive PM2.5
Exhaust PM2.5
PM2.5 Total Bio- CO2 NBio- CO2 Total CO2 CH4 N2O CO2e
Category tons/yr MT/yr
Fugitive Dust 2.0900e-003
0.0000 2.0900e-003
3.2000e-004
0.0000 3.2000e-004
0.0000 0.0000 0.0000 0.0000 0.0000 0.0000
Off-Road 0.0140 0.1423 0.0823 2.0000e-004
6.2000e-003
6.2000e-003
5.7700e-003
5.7700e-003
0.0000 17.7187 17.7187 5.1500e-003
0.0000 17.8474
Total 0.0140 0.1423 0.0823 2.0000e-004
2.0900e-003
6.2000e-003
8.2900e-003
3.2000e-004
5.7700e-003
6.0900e-003
0.0000 17.7187 17.7187 5.1500e-003
0.0000 17.8474
Mitigated Construction On-Site
ROG NOx CO SO2 Fugitive PM10
Exhaust PM10
PM10 Total
Fugitive PM2.5
Exhaust PM2.5
PM2.5 Total Bio- CO2 NBio- CO2 Total CO2 CH4 N2O CO2e
Category tons/yr MT/yr
Hauling 1.3000e-004
6.0600e-003
7.8000e-004
2.0000e-005
3.0000e-004
2.0000e-005
3.2000e-004
9.0000e-005
2.0000e-005
1.0000e-004
0.0000 1.8127 1.8127 1.1000e-004
0.0000 1.8156
Vendor 0.0000 0.0000 0.0000 0.0000 0.0000 0.0000 0.0000 0.0000 0.0000 0.0000 0.0000 0.0000 0.0000 0.0000 0.0000 0.0000
Worker 4.8000e-004
3.4000e-004
3.6100e-003
1.0000e-005
7.5000e-004
1.0000e-005
7.6000e-004
2.1000e-004
1.0000e-005
2.1000e-004
0.0000 0.9656 0.9656 2.0000e-005
0.0000 0.9662
Total 6.1000e-004
6.4000e-003
4.3900e-003
3.0000e-005
1.0500e-003
3.0000e-005
1.0800e-003
3.0000e-004
3.0000e-005
3.1000e-004
0.0000 2.7783 2.7783 1.3000e-004
0.0000 2.7818
Mitigated Construction Off-Site
CalEEMod Version: CalEEMod.2016.3.2 Date: 7/18/2018 9:36 AMPage 12 of 32
SART Phase IV, Reaches B & C - Riverside-South Coast County, Annual

3.3 Site Preparation - 2020
ROG NOx CO SO2 Fugitive PM10
Exhaust PM10
PM10 Total
Fugitive PM2.5
Exhaust PM2.5
PM2.5 Total Bio- CO2 NBio- CO2 Total CO2 CH4 N2O CO2e
Category tons/yr MT/yr
Fugitive Dust 0.0243 0.0000 0.0243 0.0119 0.0000 0.0119 0.0000 0.0000 0.0000 0.0000 0.0000 0.0000
Off-Road 0.0156 0.1613 0.0948 2.2000e-004
7.2100e-003
7.2100e-003
6.6900e-003
6.6900e-003
0.0000 19.2383 19.2383 5.7000e-003
0.0000 19.3809
Total 0.0156 0.1613 0.0948 2.2000e-004
0.0243 7.2100e-003
0.0316 0.0119 6.6900e-003
0.0186 0.0000 19.2383 19.2383 5.7000e-003
0.0000 19.3809
Unmitigated Construction On-Site
ROG NOx CO SO2 Fugitive PM10
Exhaust PM10
PM10 Total
Fugitive PM2.5
Exhaust PM2.5
PM2.5 Total Bio- CO2 NBio- CO2 Total CO2 CH4 N2O CO2e
Category tons/yr MT/yr
Hauling 5.0000e-005
2.3000e-003
3.0000e-004
1.0000e-005
1.6000e-004
1.0000e-005
1.7000e-004
4.0000e-005
1.0000e-005
5.0000e-005
0.0000 0.6888 0.6888 4.0000e-005
0.0000 0.6899
Vendor 0.0000 0.0000 0.0000 0.0000 0.0000 0.0000 0.0000 0.0000 0.0000 0.0000 0.0000 0.0000 0.0000 0.0000 0.0000 0.0000
Worker 5.6000e-004
3.9000e-004
4.2100e-003
1.0000e-005
1.3500e-003
1.0000e-005
1.3500e-003
3.6000e-004
1.0000e-005
3.7000e-004
0.0000 1.1265 1.1265 3.0000e-005
0.0000 1.1272
Total 6.1000e-004
2.6900e-003
4.5100e-003
2.0000e-005
1.5100e-003
2.0000e-005
1.5200e-003
4.0000e-004
2.0000e-005
4.2000e-004
0.0000 1.8153 1.8153 7.0000e-005
0.0000 1.8171
Unmitigated Construction Off-Site
CalEEMod Version: CalEEMod.2016.3.2 Date: 7/18/2018 9:36 AMPage 13 of 32
SART Phase IV, Reaches B & C - Riverside-South Coast County, Annual

3.3 Site Preparation - 2020
ROG NOx CO SO2 Fugitive PM10
Exhaust PM10
PM10 Total
Fugitive PM2.5
Exhaust PM2.5
PM2.5 Total Bio- CO2 NBio- CO2 Total CO2 CH4 N2O CO2e
Category tons/yr MT/yr
Fugitive Dust 9.3100e-003
0.0000 9.3100e-003
4.5700e-003
0.0000 4.5700e-003
0.0000 0.0000 0.0000 0.0000 0.0000 0.0000
Off-Road 0.0156 0.1613 0.0948 2.2000e-004
7.2100e-003
7.2100e-003
6.6900e-003
6.6900e-003
0.0000 19.2383 19.2383 5.7000e-003
0.0000 19.3808
Total 0.0156 0.1613 0.0948 2.2000e-004
9.3100e-003
7.2100e-003
0.0165 4.5700e-003
6.6900e-003
0.0113 0.0000 19.2383 19.2383 5.7000e-003
0.0000 19.3808
Mitigated Construction On-Site
ROG NOx CO SO2 Fugitive PM10
Exhaust PM10
PM10 Total
Fugitive PM2.5
Exhaust PM2.5
PM2.5 Total Bio- CO2 NBio- CO2 Total CO2 CH4 N2O CO2e
Category tons/yr MT/yr
Hauling 5.0000e-005
2.3000e-003
3.0000e-004
1.0000e-005
1.1000e-004
1.0000e-005
1.2000e-004
3.0000e-005
1.0000e-005
4.0000e-005
0.0000 0.6888 0.6888 4.0000e-005
0.0000 0.6899
Vendor 0.0000 0.0000 0.0000 0.0000 0.0000 0.0000 0.0000 0.0000 0.0000 0.0000 0.0000 0.0000 0.0000 0.0000 0.0000 0.0000
Worker 5.6000e-004
3.9000e-004
4.2100e-003
1.0000e-005
8.8000e-004
1.0000e-005
8.9000e-004
2.4000e-004
1.0000e-005
2.5000e-004
0.0000 1.1265 1.1265 3.0000e-005
0.0000 1.1272
Total 6.1000e-004
2.6900e-003
4.5100e-003
2.0000e-005
9.9000e-004
2.0000e-005
1.0100e-003
2.7000e-004
2.0000e-005
2.9000e-004
0.0000 1.8153 1.8153 7.0000e-005
0.0000 1.8171
Mitigated Construction Off-Site
CalEEMod Version: CalEEMod.2016.3.2 Date: 7/18/2018 9:36 AMPage 14 of 32
SART Phase IV, Reaches B & C - Riverside-South Coast County, Annual

3.4 Grading - 2020
ROG NOx CO SO2 Fugitive PM10
Exhaust PM10
PM10 Total
Fugitive PM2.5
Exhaust PM2.5
PM2.5 Total Bio- CO2 NBio- CO2 Total CO2 CH4 N2O CO2e
Category tons/yr MT/yr
Fugitive Dust 0.0308 0.0000 0.0308 3.3300e-003
0.0000 3.3300e-003
0.0000 0.0000 0.0000 0.0000 0.0000 0.0000
Off-Road 0.0520 0.6035 0.3804 8.3000e-004
0.0255 0.0255 0.0234 0.0234 0.0000 72.2554 72.2554 0.0232 0.0000 72.8348
Total 0.0520 0.6035 0.3804 8.3000e-004
0.0308 0.0255 0.0563 3.3300e-003
0.0234 0.0268 0.0000 72.2554 72.2554 0.0232 0.0000 72.8348
Unmitigated Construction On-Site
ROG NOx CO SO2 Fugitive PM10
Exhaust PM10
PM10 Total
Fugitive PM2.5
Exhaust PM2.5
PM2.5 Total Bio- CO2 NBio- CO2 Total CO2 CH4 N2O CO2e
Category tons/yr MT/yr
Hauling 5.0000e-005
2.3000e-003
3.0000e-004
1.0000e-005
1.6000e-004
1.0000e-005
1.7000e-004
4.0000e-005
1.0000e-005
5.0000e-005
0.0000 0.6888 0.6888 4.0000e-005
0.0000 0.6899
Vendor 0.0000 0.0000 0.0000 0.0000 0.0000 0.0000 0.0000 0.0000 0.0000 0.0000 0.0000 0.0000 0.0000 0.0000 0.0000 0.0000
Worker 1.9000e-003
1.3300e-003
0.0142 4.0000e-005
4.5300e-003
3.0000e-005
4.5600e-003
1.2000e-003
3.0000e-005
1.2300e-003
0.0000 3.7933 3.7933 9.0000e-005
0.0000 3.7957
Total 1.9500e-003
3.6300e-003
0.0145 5.0000e-005
4.6900e-003
4.0000e-005
4.7300e-003
1.2400e-003
4.0000e-005
1.2800e-003
0.0000 4.4822 4.4822 1.3000e-004
0.0000 4.4856
Unmitigated Construction Off-Site
CalEEMod Version: CalEEMod.2016.3.2 Date: 7/18/2018 9:36 AMPage 15 of 32
SART Phase IV, Reaches B & C - Riverside-South Coast County, Annual
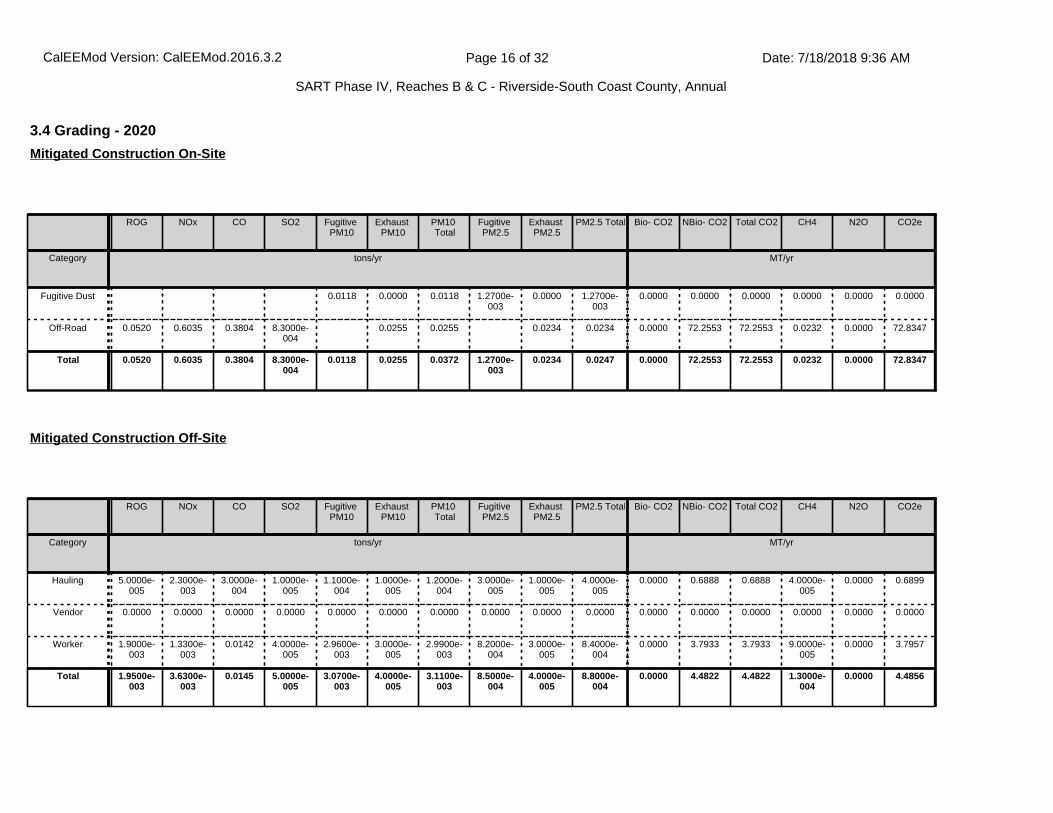
3.4 Grading - 2020
ROG NOx CO SO2 Fugitive PM10
Exhaust PM10
PM10 Total
Fugitive PM2.5
Exhaust PM2.5
PM2.5 Total Bio- CO2 NBio- CO2 Total CO2 CH4 N2O CO2e
Category tons/yr MT/yr
Fugitive Dust 0.0118 0.0000 0.0118 1.2700e-003
0.0000 1.2700e-003
0.0000 0.0000 0.0000 0.0000 0.0000 0.0000
Off-Road 0.0520 0.6035 0.3804 8.3000e-004
0.0255 0.0255 0.0234 0.0234 0.0000 72.2553 72.2553 0.0232 0.0000 72.8347
Total 0.0520 0.6035 0.3804 8.3000e-004
0.0118 0.0255 0.0372 1.2700e-003
0.0234 0.0247 0.0000 72.2553 72.2553 0.0232 0.0000 72.8347
Mitigated Construction On-Site
ROG NOx CO SO2 Fugitive PM10
Exhaust PM10
PM10 Total
Fugitive PM2.5
Exhaust PM2.5
PM2.5 Total Bio- CO2 NBio- CO2 Total CO2 CH4 N2O CO2e
Category tons/yr MT/yr
Hauling 5.0000e-005
2.3000e-003
3.0000e-004
1.0000e-005
1.1000e-004
1.0000e-005
1.2000e-004
3.0000e-005
1.0000e-005
4.0000e-005
0.0000 0.6888 0.6888 4.0000e-005
0.0000 0.6899
Vendor 0.0000 0.0000 0.0000 0.0000 0.0000 0.0000 0.0000 0.0000 0.0000 0.0000 0.0000 0.0000 0.0000 0.0000 0.0000 0.0000
Worker 1.9000e-003
1.3300e-003
0.0142 4.0000e-005
2.9600e-003
3.0000e-005
2.9900e-003
8.2000e-004
3.0000e-005
8.4000e-004
0.0000 3.7933 3.7933 9.0000e-005
0.0000 3.7957
Total 1.9500e-003
3.6300e-003
0.0145 5.0000e-005
3.0700e-003
4.0000e-005
3.1100e-003
8.5000e-004
4.0000e-005
8.8000e-004
0.0000 4.4822 4.4822 1.3000e-004
0.0000 4.4856
Mitigated Construction Off-Site
CalEEMod Version: CalEEMod.2016.3.2 Date: 7/18/2018 9:36 AMPage 16 of 32
SART Phase IV, Reaches B & C - Riverside-South Coast County, Annual

3.5 Building Construction - 2020
ROG NOx CO SO2 Fugitive PM10
Exhaust PM10
PM10 Total
Fugitive PM2.5
Exhaust PM2.5
PM2.5 Total Bio- CO2 NBio- CO2 Total CO2 CH4 N2O CO2e
Category tons/yr MT/yr
Off-Road 0.2561 2.8418 1.9655 4.1700e-003
0.1235 0.1235 0.1145 0.1145 0.0000 364.2859 364.2859 0.1097 0.0000 367.0284
Total 0.2561 2.8418 1.9655 4.1700e-003
0.1235 0.1235 0.1145 0.1145 0.0000 364.2859 364.2859 0.1097 0.0000 367.0284
Unmitigated Construction On-Site
ROG NOx CO SO2 Fugitive PM10
Exhaust PM10
PM10 Total
Fugitive PM2.5
Exhaust PM2.5
PM2.5 Total Bio- CO2 NBio- CO2 Total CO2 CH4 N2O CO2e
Category tons/yr MT/yr
Hauling 0.0000 0.0000 0.0000 0.0000 0.0000 0.0000 0.0000 0.0000 0.0000 0.0000 0.0000 0.0000 0.0000 0.0000 0.0000 0.0000
Vendor 0.0000 0.0000 0.0000 0.0000 0.0000 0.0000 0.0000 0.0000 0.0000 0.0000 0.0000 0.0000 0.0000 0.0000 0.0000 0.0000
Worker 0.1453 0.1018 1.0873 3.2200e-003
0.3475 2.1400e-003
0.3497 0.0923 1.9700e-003
0.0943 0.0000 290.7751 290.7751 7.2800e-003
0.0000 290.9572
Total 0.1453 0.1018 1.0873 3.2200e-003
0.3475 2.1400e-003
0.3497 0.0923 1.9700e-003
0.0943 0.0000 290.7751 290.7751 7.2800e-003
0.0000 290.9572
Unmitigated Construction Off-Site
CalEEMod Version: CalEEMod.2016.3.2 Date: 7/18/2018 9:36 AMPage 17 of 32
SART Phase IV, Reaches B & C - Riverside-South Coast County, Annual
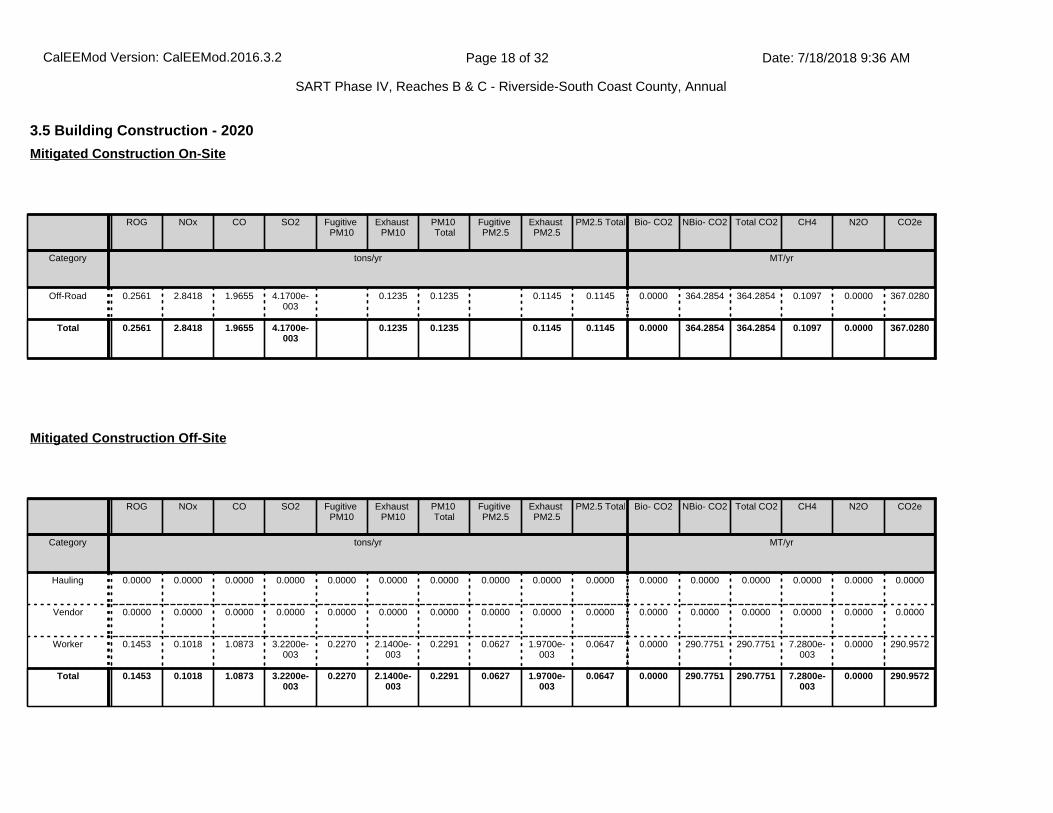
3.5 Building Construction - 2020
ROG NOx CO SO2 Fugitive PM10
Exhaust PM10
PM10 Total
Fugitive PM2.5
Exhaust PM2.5
PM2.5 Total Bio- CO2 NBio- CO2 Total CO2 CH4 N2O CO2e
Category tons/yr MT/yr
Off-Road 0.2561 2.8418 1.9655 4.1700e-003
0.1235 0.1235 0.1145 0.1145 0.0000 364.2854 364.2854 0.1097 0.0000 367.0280
Total 0.2561 2.8418 1.9655 4.1700e-003
0.1235 0.1235 0.1145 0.1145 0.0000 364.2854 364.2854 0.1097 0.0000 367.0280
Mitigated Construction On-Site
ROG NOx CO SO2 Fugitive PM10
Exhaust PM10
PM10 Total
Fugitive PM2.5
Exhaust PM2.5
PM2.5 Total Bio- CO2 NBio- CO2 Total CO2 CH4 N2O CO2e
Category tons/yr MT/yr
Hauling 0.0000 0.0000 0.0000 0.0000 0.0000 0.0000 0.0000 0.0000 0.0000 0.0000 0.0000 0.0000 0.0000 0.0000 0.0000 0.0000
Vendor 0.0000 0.0000 0.0000 0.0000 0.0000 0.0000 0.0000 0.0000 0.0000 0.0000 0.0000 0.0000 0.0000 0.0000 0.0000 0.0000
Worker 0.1453 0.1018 1.0873 3.2200e-003
0.2270 2.1400e-003
0.2291 0.0627 1.9700e-003
0.0647 0.0000 290.7751 290.7751 7.2800e-003
0.0000 290.9572
Total 0.1453 0.1018 1.0873 3.2200e-003
0.2270 2.1400e-003
0.2291 0.0627 1.9700e-003
0.0647 0.0000 290.7751 290.7751 7.2800e-003
0.0000 290.9572
Mitigated Construction Off-Site
CalEEMod Version: CalEEMod.2016.3.2 Date: 7/18/2018 9:36 AMPage 18 of 32
SART Phase IV, Reaches B & C - Riverside-South Coast County, Annual

3.6 Paving - 2020
ROG NOx CO SO2 Fugitive PM10
Exhaust PM10
PM10 Total
Fugitive PM2.5
Exhaust PM2.5
PM2.5 Total Bio- CO2 NBio- CO2 Total CO2 CH4 N2O CO2e
Category tons/yr MT/yr
Off-Road 0.1350 1.4647 1.0652 2.2800e-003
0.0633 0.0633 0.0583 0.0583 0.0000 199.1870 199.1870 0.0638 0.0000 200.7814
Paving 0.0000 0.0000 0.0000 0.0000 0.0000 0.0000 0.0000 0.0000 0.0000 0.0000 0.0000
Total 0.1350 1.4647 1.0652 2.2800e-003
0.0633 0.0633 0.0583 0.0583 0.0000 199.1870 199.1870 0.0638 0.0000 200.7814
Unmitigated Construction On-Site
ROG NOx CO SO2 Fugitive PM10
Exhaust PM10
PM10 Total
Fugitive PM2.5
Exhaust PM2.5
PM2.5 Total Bio- CO2 NBio- CO2 Total CO2 CH4 N2O CO2e
Category tons/yr MT/yr
Hauling 0.0000 0.0000 0.0000 0.0000 0.0000 0.0000 0.0000 0.0000 0.0000 0.0000 0.0000 0.0000 0.0000 0.0000 0.0000 0.0000
Vendor 0.0000 0.0000 0.0000 0.0000 0.0000 0.0000 0.0000 0.0000 0.0000 0.0000 0.0000 0.0000 0.0000 0.0000 0.0000 0.0000
Worker 5.1700e-003
3.6200e-003
0.0387 1.1000e-004
0.0124 8.0000e-005
0.0124 3.2800e-003
7.0000e-005
3.3500e-003
0.0000 10.3454 10.3454 2.6000e-004
0.0000 10.3519
Total 5.1700e-003
3.6200e-003
0.0387 1.1000e-004
0.0124 8.0000e-005
0.0124 3.2800e-003
7.0000e-005
3.3500e-003
0.0000 10.3454 10.3454 2.6000e-004
0.0000 10.3519
Unmitigated Construction Off-Site
CalEEMod Version: CalEEMod.2016.3.2 Date: 7/18/2018 9:36 AMPage 19 of 32
SART Phase IV, Reaches B & C - Riverside-South Coast County, Annual

3.6 Paving - 2020
ROG NOx CO SO2 Fugitive PM10
Exhaust PM10
PM10 Total
Fugitive PM2.5
Exhaust PM2.5
PM2.5 Total Bio- CO2 NBio- CO2 Total CO2 CH4 N2O CO2e
Category tons/yr MT/yr
Off-Road 0.1350 1.4647 1.0652 2.2800e-003
0.0633 0.0633 0.0583 0.0583 0.0000 199.1867 199.1867 0.0638 0.0000 200.7811
Paving 0.0000 0.0000 0.0000 0.0000 0.0000 0.0000 0.0000 0.0000 0.0000 0.0000 0.0000
Total 0.1350 1.4647 1.0652 2.2800e-003
0.0633 0.0633 0.0583 0.0583 0.0000 199.1867 199.1867 0.0638 0.0000 200.7811
Mitigated Construction On-Site
ROG NOx CO SO2 Fugitive PM10
Exhaust PM10
PM10 Total
Fugitive PM2.5
Exhaust PM2.5
PM2.5 Total Bio- CO2 NBio- CO2 Total CO2 CH4 N2O CO2e
Category tons/yr MT/yr
Hauling 0.0000 0.0000 0.0000 0.0000 0.0000 0.0000 0.0000 0.0000 0.0000 0.0000 0.0000 0.0000 0.0000 0.0000 0.0000 0.0000
Vendor 0.0000 0.0000 0.0000 0.0000 0.0000 0.0000 0.0000 0.0000 0.0000 0.0000 0.0000 0.0000 0.0000 0.0000 0.0000 0.0000
Worker 5.1700e-003
3.6200e-003
0.0387 1.1000e-004
8.0800e-003
8.0000e-005
8.1500e-003
2.2300e-003
7.0000e-005
2.3000e-003
0.0000 10.3454 10.3454 2.6000e-004
0.0000 10.3519
Total 5.1700e-003
3.6200e-003
0.0387 1.1000e-004
8.0800e-003
8.0000e-005
8.1500e-003
2.2300e-003
7.0000e-005
2.3000e-003
0.0000 10.3454 10.3454 2.6000e-004
0.0000 10.3519
Mitigated Construction Off-Site
CalEEMod Version: CalEEMod.2016.3.2 Date: 7/18/2018 9:36 AMPage 20 of 32
SART Phase IV, Reaches B & C - Riverside-South Coast County, Annual

3.7 Architectural Coating - 2020
ROG NOx CO SO2 Fugitive PM10
Exhaust PM10
PM10 Total
Fugitive PM2.5
Exhaust PM2.5
PM2.5 Total Bio- CO2 NBio- CO2 Total CO2 CH4 N2O CO2e
Category tons/yr MT/yr
Archit. Coating 0.0392 0.0000 0.0000 0.0000 0.0000 0.0000 0.0000 0.0000 0.0000 0.0000 0.0000
Off-Road 3.2800e-003
0.0300 0.0186 6.0000e-005
1.1000e-003
1.1000e-003
1.0200e-003
1.0200e-003
0.0000 5.3684 5.3684 1.6700e-003
0.0000 5.4101
Total 0.0424 0.0300 0.0186 6.0000e-005
1.1000e-003
1.1000e-003
1.0200e-003
1.0200e-003
0.0000 5.3684 5.3684 1.6700e-003
0.0000 5.4101
Unmitigated Construction On-Site
ROG NOx CO SO2 Fugitive PM10
Exhaust PM10
PM10 Total
Fugitive PM2.5
Exhaust PM2.5
PM2.5 Total Bio- CO2 NBio- CO2 Total CO2 CH4 N2O CO2e
Category tons/yr MT/yr
Hauling 0.0000 0.0000 0.0000 0.0000 0.0000 0.0000 0.0000 0.0000 0.0000 0.0000 0.0000 0.0000 0.0000 0.0000 0.0000 0.0000
Vendor 0.0000 0.0000 0.0000 0.0000 0.0000 0.0000 0.0000 0.0000 0.0000 0.0000 0.0000 0.0000 0.0000 0.0000 0.0000 0.0000
Worker 2.4200e-003
1.7000e-003
0.0181 5.0000e-005
5.8000e-003
4.0000e-005
5.8300e-003
1.5400e-003
3.0000e-005
1.5700e-003
0.0000 4.8509 4.8509 1.2000e-004
0.0000 4.8539
Total 2.4200e-003
1.7000e-003
0.0181 5.0000e-005
5.8000e-003
4.0000e-005
5.8300e-003
1.5400e-003
3.0000e-005
1.5700e-003
0.0000 4.8509 4.8509 1.2000e-004
0.0000 4.8539
Unmitigated Construction Off-Site
CalEEMod Version: CalEEMod.2016.3.2 Date: 7/18/2018 9:36 AMPage 21 of 32
SART Phase IV, Reaches B & C - Riverside-South Coast County, Annual

4.0 Operational Detail - Mobile
3.7 Architectural Coating - 2020
ROG NOx CO SO2 Fugitive PM10
Exhaust PM10
PM10 Total
Fugitive PM2.5
Exhaust PM2.5
PM2.5 Total Bio- CO2 NBio- CO2 Total CO2 CH4 N2O CO2e
Category tons/yr MT/yr
Archit. Coating 0.0392 0.0000 0.0000 0.0000 0.0000 0.0000 0.0000 0.0000 0.0000 0.0000 0.0000
Off-Road 3.2800e-003
0.0300 0.0186 6.0000e-005
1.1000e-003
1.1000e-003
1.0200e-003
1.0200e-003
0.0000 5.3683 5.3683 1.6700e-003
0.0000 5.4101
Total 0.0424 0.0300 0.0186 6.0000e-005
1.1000e-003
1.1000e-003
1.0200e-003
1.0200e-003
0.0000 5.3683 5.3683 1.6700e-003
0.0000 5.4101
Mitigated Construction On-Site
ROG NOx CO SO2 Fugitive PM10
Exhaust PM10
PM10 Total
Fugitive PM2.5
Exhaust PM2.5
PM2.5 Total Bio- CO2 NBio- CO2 Total CO2 CH4 N2O CO2e
Category tons/yr MT/yr
Hauling 0.0000 0.0000 0.0000 0.0000 0.0000 0.0000 0.0000 0.0000 0.0000 0.0000 0.0000 0.0000 0.0000 0.0000 0.0000 0.0000
Vendor 0.0000 0.0000 0.0000 0.0000 0.0000 0.0000 0.0000 0.0000 0.0000 0.0000 0.0000 0.0000 0.0000 0.0000 0.0000 0.0000
Worker 2.4200e-003
1.7000e-003
0.0181 5.0000e-005
3.7900e-003
4.0000e-005
3.8200e-003
1.0500e-003
3.0000e-005
1.0800e-003
0.0000 4.8509 4.8509 1.2000e-004
0.0000 4.8539
Total 2.4200e-003
1.7000e-003
0.0181 5.0000e-005
3.7900e-003
4.0000e-005
3.8200e-003
1.0500e-003
3.0000e-005
1.0800e-003
0.0000 4.8509 4.8509 1.2000e-004
0.0000 4.8539
Mitigated Construction Off-Site
CalEEMod Version: CalEEMod.2016.3.2 Date: 7/18/2018 9:36 AMPage 22 of 32
SART Phase IV, Reaches B & C - Riverside-South Coast County, Annual

ROG NOx CO SO2 Fugitive PM10
Exhaust PM10
PM10 Total
Fugitive PM2.5
Exhaust PM2.5
PM2.5 Total Bio- CO2 NBio- CO2 Total CO2 CH4 N2O CO2e
Category tons/yr MT/yr
Mitigated 0.0000 0.0000 0.0000 0.0000 0.0000 0.0000 0.0000 0.0000 0.0000 0.0000 0.0000 0.0000 0.0000 0.0000 0.0000 0.0000
Unmitigated 0.0000 0.0000 0.0000 0.0000 0.0000 0.0000 0.0000 0.0000 0.0000 0.0000 0.0000 0.0000 0.0000 0.0000 0.0000 0.0000
4.1 Mitigation Measures Mobile
4.2 Trip Summary Information
4.3 Trip Type Information
Average Daily Trip Rate Unmitigated Mitigated
Land Use Weekday Saturday Sunday Annual VMT Annual VMT
Other Non-Asphalt Surfaces 0.00 0.00 0.00
Total 0.00 0.00 0.00
Miles Trip % Trip Purpose %
Land Use H-W or C-W H-S or C-C H-O or C-NW H-W or C-W H-S or C-C H-O or C-NW Primary Diverted Pass-by
Other Non-Asphalt Surfaces 16.60 8.40 6.90 0.00 0.00 0.00 0 0 0
4.4 Fleet Mix
Land Use LDA LDT1 LDT2 MDV LHD1 LHD2 MHD HHD OBUS UBUS MCY SBUS MH
Other Non-Asphalt Surfaces 0.538064 0.038449 0.184390 0.122109 0.017402 0.005339 0.017250 0.067711 0.001365 0.001213 0.004629 0.000959 0.001120
CalEEMod Version: CalEEMod.2016.3.2 Date: 7/18/2018 9:36 AMPage 23 of 32
SART Phase IV, Reaches B & C - Riverside-South Coast County, Annual

5.0 Energy Detail
ROG NOx CO SO2 Fugitive PM10
Exhaust PM10
PM10 Total
Fugitive PM2.5
Exhaust PM2.5
PM2.5 Total
Bio- CO2 NBio- CO2 Total CO2 CH4 N2O CO2e
Category tons/yr MT/yr
Electricity Mitigated
0.0000 0.0000 0.0000 0.0000 0.0000 0.0000 0.0000 0.0000 0.0000 0.0000
Electricity Unmitigated
0.0000 0.0000 0.0000 0.0000 0.0000 0.0000 0.0000 0.0000 0.0000 0.0000
NaturalGas Mitigated
0.0000 0.0000 0.0000 0.0000 0.0000 0.0000 0.0000 0.0000 0.0000 0.0000 0.0000 0.0000 0.0000 0.0000
NaturalGas Unmitigated
0.0000 0.0000 0.0000 0.0000 0.0000 0.0000 0.0000 0.0000 0.0000 0.0000 0.0000 0.0000 0.0000 0.0000
5.1 Mitigation Measures Energy
Historical Energy Use: N
CalEEMod Version: CalEEMod.2016.3.2 Date: 7/18/2018 9:36 AMPage 24 of 32
SART Phase IV, Reaches B & C - Riverside-South Coast County, Annual
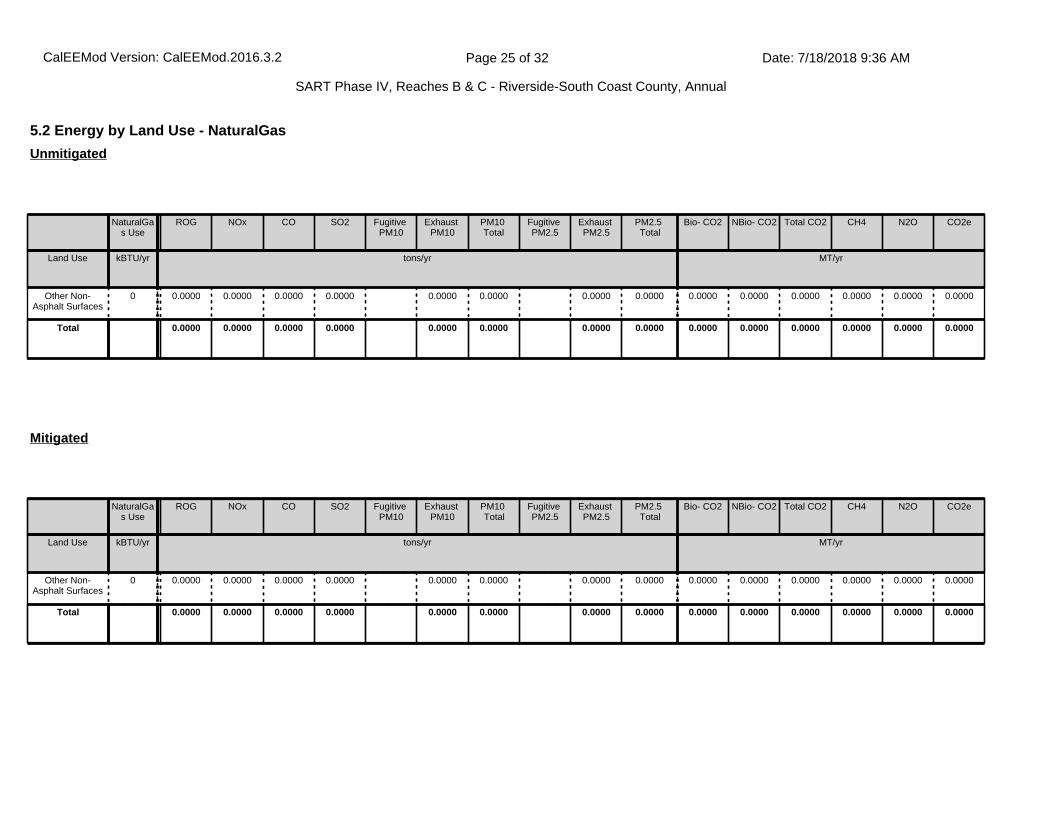
5.2 Energy by Land Use - NaturalGas
NaturalGas Use
ROG NOx CO SO2 Fugitive PM10
Exhaust PM10
PM10 Total
Fugitive PM2.5
Exhaust PM2.5
PM2.5 Total
Bio- CO2 NBio- CO2 Total CO2 CH4 N2O CO2e
Land Use kBTU/yr tons/yr MT/yr
Other Non-Asphalt Surfaces
0 0.0000 0.0000 0.0000 0.0000 0.0000 0.0000 0.0000 0.0000 0.0000 0.0000 0.0000 0.0000 0.0000 0.0000
Total 0.0000 0.0000 0.0000 0.0000 0.0000 0.0000 0.0000 0.0000 0.0000 0.0000 0.0000 0.0000 0.0000 0.0000
Unmitigated
NaturalGas Use
ROG NOx CO SO2 Fugitive PM10
Exhaust PM10
PM10 Total
Fugitive PM2.5
Exhaust PM2.5
PM2.5 Total
Bio- CO2 NBio- CO2 Total CO2 CH4 N2O CO2e
Land Use kBTU/yr tons/yr MT/yr
Other Non-Asphalt Surfaces
0 0.0000 0.0000 0.0000 0.0000 0.0000 0.0000 0.0000 0.0000 0.0000 0.0000 0.0000 0.0000 0.0000 0.0000
Total 0.0000 0.0000 0.0000 0.0000 0.0000 0.0000 0.0000 0.0000 0.0000 0.0000 0.0000 0.0000 0.0000 0.0000
Mitigated
CalEEMod Version: CalEEMod.2016.3.2 Date: 7/18/2018 9:36 AMPage 25 of 32
SART Phase IV, Reaches B & C - Riverside-South Coast County, Annual

6.1 Mitigation Measures Area
6.0 Area Detail
5.3 Energy by Land Use - Electricity
Electricity Use
Total CO2 CH4 N2O CO2e
Land Use kWh/yr MT/yr
Other Non-Asphalt Surfaces
0 0.0000 0.0000 0.0000 0.0000
Total 0.0000 0.0000 0.0000 0.0000
Unmitigated
Electricity Use
Total CO2 CH4 N2O CO2e
Land Use kWh/yr MT/yr
Other Non-Asphalt Surfaces
0 0.0000 0.0000 0.0000 0.0000
Total 0.0000 0.0000 0.0000 0.0000
Mitigated
CalEEMod Version: CalEEMod.2016.3.2 Date: 7/18/2018 9:36 AMPage 26 of 32
SART Phase IV, Reaches B & C - Riverside-South Coast County, Annual

ROG NOx CO SO2 Fugitive PM10
Exhaust PM10
PM10 Total
Fugitive PM2.5
Exhaust PM2.5
PM2.5 Total
Bio- CO2 NBio- CO2 Total CO2 CH4 N2O CO2e
Category tons/yr MT/yr
Mitigated 0.1971 1.0000e-005
7.4000e-004
0.0000 0.0000 0.0000 0.0000 0.0000 0.0000 1.4300e-003
1.4300e-003
0.0000 0.0000 1.5300e-003
Unmitigated 0.1971 1.0000e-005
7.4000e-004
0.0000 0.0000 0.0000 0.0000 0.0000 0.0000 1.4300e-003
1.4300e-003
0.0000 0.0000 1.5300e-003
6.2 Area by SubCategory
ROG NOx CO SO2 Fugitive PM10
Exhaust PM10
PM10 Total
Fugitive PM2.5
Exhaust PM2.5
PM2.5 Total
Bio- CO2 NBio- CO2 Total CO2 CH4 N2O CO2e
SubCategory tons/yr MT/yr
Architectural Coating
0.0349 0.0000 0.0000 0.0000 0.0000 0.0000 0.0000 0.0000 0.0000 0.0000 0.0000
Consumer Products
0.1622 0.0000 0.0000 0.0000 0.0000 0.0000 0.0000 0.0000 0.0000 0.0000 0.0000
Landscaping 7.0000e-005
1.0000e-005
7.4000e-004
0.0000 0.0000 0.0000 0.0000 0.0000 0.0000 1.4300e-003
1.4300e-003
0.0000 0.0000 1.5300e-003
Total 0.1971 1.0000e-005
7.4000e-004
0.0000 0.0000 0.0000 0.0000 0.0000 0.0000 1.4300e-003
1.4300e-003
0.0000 0.0000 1.5300e-003
Unmitigated
CalEEMod Version: CalEEMod.2016.3.2 Date: 7/18/2018 9:36 AMPage 27 of 32
SART Phase IV, Reaches B & C - Riverside-South Coast County, Annual

7.1 Mitigation Measures Water
7.0 Water Detail
6.2 Area by SubCategory
ROG NOx CO SO2 Fugitive PM10
Exhaust PM10
PM10 Total
Fugitive PM2.5
Exhaust PM2.5
PM2.5 Total
Bio- CO2 NBio- CO2 Total CO2 CH4 N2O CO2e
SubCategory tons/yr MT/yr
Architectural Coating
0.0349 0.0000 0.0000 0.0000 0.0000 0.0000 0.0000 0.0000 0.0000 0.0000 0.0000
Consumer Products
0.1622 0.0000 0.0000 0.0000 0.0000 0.0000 0.0000 0.0000 0.0000 0.0000 0.0000
Landscaping 7.0000e-005
1.0000e-005
7.4000e-004
0.0000 0.0000 0.0000 0.0000 0.0000 0.0000 1.4300e-003
1.4300e-003
0.0000 0.0000 1.5300e-003
Total 0.1971 1.0000e-005
7.4000e-004
0.0000 0.0000 0.0000 0.0000 0.0000 0.0000 1.4300e-003
1.4300e-003
0.0000 0.0000 1.5300e-003
Mitigated
CalEEMod Version: CalEEMod.2016.3.2 Date: 7/18/2018 9:36 AMPage 28 of 32
SART Phase IV, Reaches B & C - Riverside-South Coast County, Annual
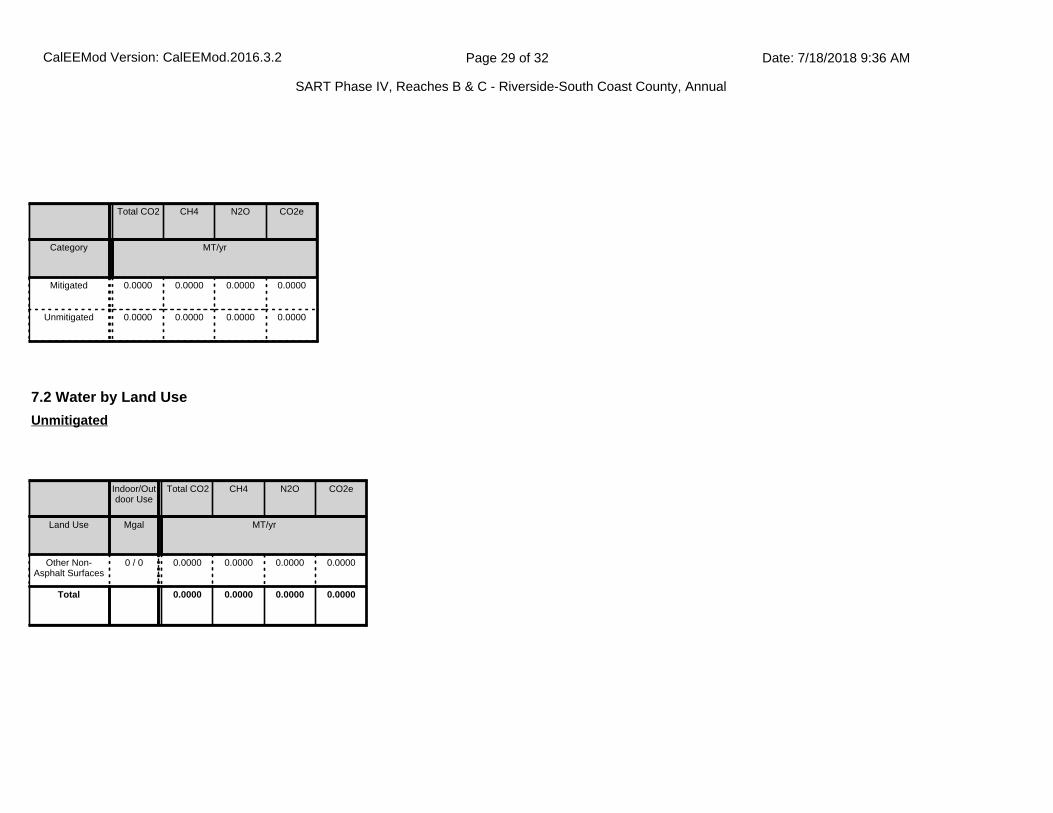
Total CO2 CH4 N2O CO2e
Category MT/yr
Mitigated 0.0000 0.0000 0.0000 0.0000
Unmitigated 0.0000 0.0000 0.0000 0.0000
7.2 Water by Land Use
Indoor/Outdoor Use
Total CO2 CH4 N2O CO2e
Land Use Mgal MT/yr
Other Non-Asphalt Surfaces
0 / 0 0.0000 0.0000 0.0000 0.0000
Total 0.0000 0.0000 0.0000 0.0000
Unmitigated
CalEEMod Version: CalEEMod.2016.3.2 Date: 7/18/2018 9:36 AMPage 29 of 32
SART Phase IV, Reaches B & C - Riverside-South Coast County, Annual

8.1 Mitigation Measures Waste
7.2 Water by Land Use
Indoor/Outdoor Use
Total CO2 CH4 N2O CO2e
Land Use Mgal MT/yr
Other Non-Asphalt Surfaces
0 / 0 0.0000 0.0000 0.0000 0.0000
Total 0.0000 0.0000 0.0000 0.0000
Mitigated
8.0 Waste Detail
Total CO2 CH4 N2O CO2e
MT/yr
Mitigated 0.0000 0.0000 0.0000 0.0000
Unmitigated 0.0000 0.0000 0.0000 0.0000
Category/Year
CalEEMod Version: CalEEMod.2016.3.2 Date: 7/18/2018 9:36 AMPage 30 of 32
SART Phase IV, Reaches B & C - Riverside-South Coast County, Annual
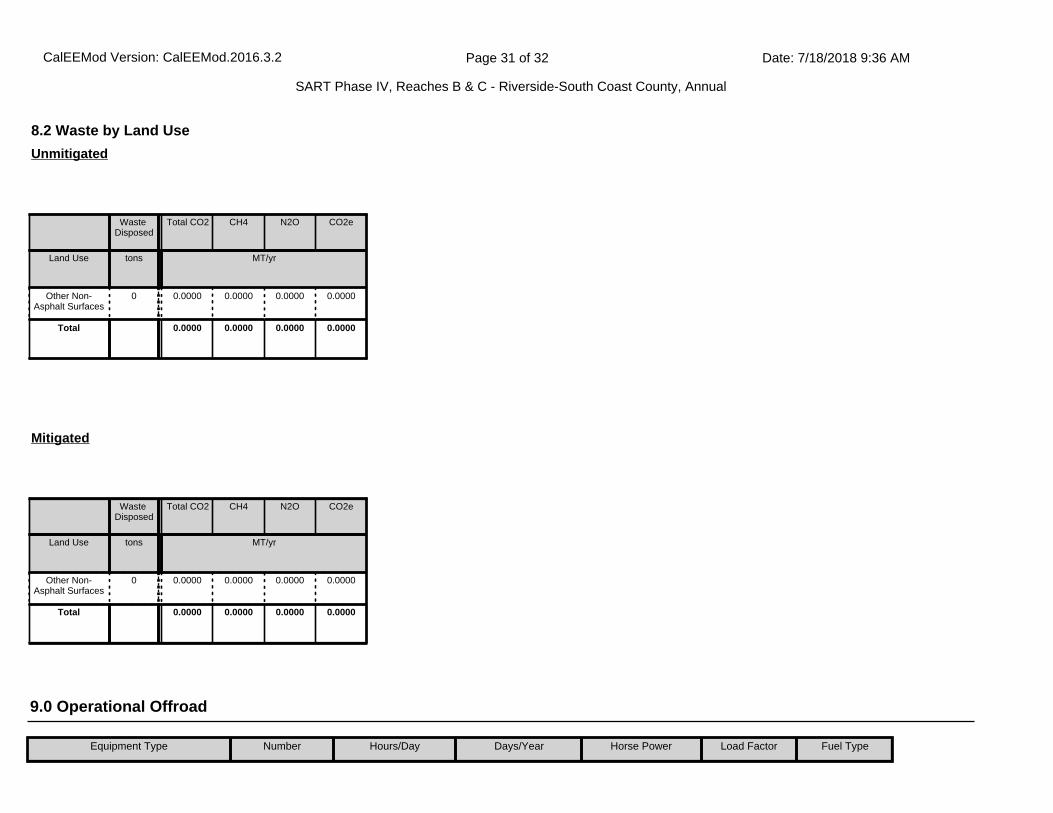
8.2 Waste by Land Use
Waste Disposed
Total CO2 CH4 N2O CO2e
Land Use tons MT/yr
Other Non-Asphalt Surfaces
0 0.0000 0.0000 0.0000 0.0000
Total 0.0000 0.0000 0.0000 0.0000
Unmitigated
Waste Disposed
Total CO2 CH4 N2O CO2e
Land Use tons MT/yr
Other Non-Asphalt Surfaces
0 0.0000 0.0000 0.0000 0.0000
Total 0.0000 0.0000 0.0000 0.0000
Mitigated
9.0 Operational Offroad
Equipment Type Number Hours/Day Days/Year Horse Power Load Factor Fuel Type
CalEEMod Version: CalEEMod.2016.3.2 Date: 7/18/2018 9:36 AMPage 31 of 32
SART Phase IV, Reaches B & C - Riverside-South Coast County, Annual

11.0 Vegetation
10.0 Stationary Equipment
Fire Pumps and Emergency Generators
Equipment Type Number Hours/Day Hours/Year Horse Power Load Factor Fuel Type
Boilers
Equipment Type Number Heat Input/Day Heat Input/Year Boiler Rating Fuel Type
User Defined Equipment
Equipment Type Number
CalEEMod Version: CalEEMod.2016.3.2 Date: 7/18/2018 9:36 AMPage 32 of 32
SART Phase IV, Reaches B & C - Riverside-South Coast County, Annual

1.1 Land Usage
Land Uses Size Metric Lot Acreage Floor Surface Area Population
Other Non-Asphalt Surfaces 57.59 Acre 57.59 2,508,620.40 0
1.2 Other Project Characteristics
Urbanization
Climate Zone
Urban
10
Wind Speed (m/s) Precipitation Freq (Days)2.4 28
1.3 User Entered Comments & Non-Default Data
1.0 Project Characteristics
Utility Company Southern California Edison
2020Operational Year
CO2 Intensity (lb/MWhr)
702.44 0.029CH4 Intensity (lb/MWhr)
0.006N2O Intensity (lb/MWhr)
SART Phase IV, Reaches B & CRiverside-South Coast County, Summer
CalEEMod Version: CalEEMod.2016.3.2 Date: 7/18/2018 9:31 AMPage 1 of 28
SART Phase IV, Reaches B & C - Riverside-South Coast County, Summer

Project Characteristics -
Land Use -
Construction Phase - Assumed 6 months of construction per Project Applicant.
Off-road Equipment - Construction equipment per Project Applicant.
Off-road Equipment - Construction equipment per Project Applicant.
Off-road Equipment - Construction equipment per Project Applicant.
Off-road Equipment - Construction equipment per Project Applicant.
Off-road Equipment - Construction equipment per Project Applicant.
Off-road Equipment - Construction equipment per Project Applicant.
Grading -
Demolition - Assumed 0.8 miles x 5 feet width of asphault demo.
Consumer Products -
Construction Off-road Equipment Mitigation - Per SCAQMD Rule 403. Reductions per SCAQMD CEQA Handbook.
Architectural Coating - Adjusted painting square footage to reflect 3.2 miles of striping.
Trips and VMT - Building construction vendor trips accounted for in construction equipment list.
Table Name Column Name Default Value New Value
tblArchitecturalCoating ConstArea_Parking 150,517.00 16,896.00
tblConstDustMitigation CleanPavedRoadPercentReduction 0 40
tblConstDustMitigation WaterUnpavedRoadVehicleSpeed 0 15
tblConstructionPhase NumDays 75.00 5.00
tblConstructionPhase NumDays 1,110.00 60.00
tblConstructionPhase NumDays 70.00 7.00
tblConstructionPhase NumDays 110.00 15.00
tblConstructionPhase NumDays 75.00 50.00
tblConstructionPhase NumDays 40.00 7.00
tblConstructionPhase PhaseEndDate 12/2/2025 10/19/2020
CalEEMod Version: CalEEMod.2016.3.2 Date: 7/18/2018 9:31 AMPage 2 of 28
SART Phase IV, Reaches B & C - Riverside-South Coast County, Summer

tblConstructionPhase PhaseEndDate 5/6/2025 8/3/2020
tblConstructionPhase PhaseEndDate 7/7/2020 4/9/2020
tblConstructionPhase PhaseEndDate 2/2/2021 5/11/2020
tblConstructionPhase PhaseEndDate 8/19/2025 10/12/2020
tblConstructionPhase PhaseEndDate 9/1/2020 4/20/2020
tblConstructionPhase PhaseStartDate 8/20/2025 10/13/2020
tblConstructionPhase PhaseStartDate 2/3/2021 5/12/2020
tblConstructionPhase PhaseStartDate 9/2/2020 4/21/2020
tblConstructionPhase PhaseStartDate 5/7/2025 8/4/2020
tblConstructionPhase PhaseStartDate 7/8/2020 4/10/2020
tblGrading MaterialImported 0.00 150.00
tblGrading MaterialImported 0.00 150.00
tblOffRoadEquipment OffRoadEquipmentUnitAmount 1.00 0.00
tblOffRoadEquipment OffRoadEquipmentUnitAmount 3.00 0.00
tblOffRoadEquipment OffRoadEquipmentUnitAmount 3.00 0.00
tblOffRoadEquipment OffRoadEquipmentUnitAmount 1.00 0.00
tblOffRoadEquipment OffRoadEquipmentUnitAmount 1.00 2.00
tblOffRoadEquipment OffRoadEquipmentUnitAmount 2.00 1.00
tblOffRoadEquipment OffRoadEquipmentUnitAmount 2.00 1.00
tblOffRoadEquipment OffRoadEquipmentUnitAmount 2.00 3.00
tblOffRoadEquipment OffRoadEquipmentUnitAmount 2.00 1.00
tblOffRoadEquipment OffRoadEquipmentUnitAmount 1.00 0.00
tblOffRoadEquipment OffRoadEquipmentUnitAmount 3.00 1.00
tblOffRoadEquipment OffRoadEquipmentUnitAmount 3.00 2.00
tblOffRoadEquipment OffRoadEquipmentUnitAmount 4.00 2.00
tblOffRoadEquipment OffRoadEquipmentUnitAmount 1.00 0.00
tblTripsAndVMT VendorTripNumber 411.00 0.00
CalEEMod Version: CalEEMod.2016.3.2 Date: 7/18/2018 9:31 AMPage 3 of 28
SART Phase IV, Reaches B & C - Riverside-South Coast County, Summer
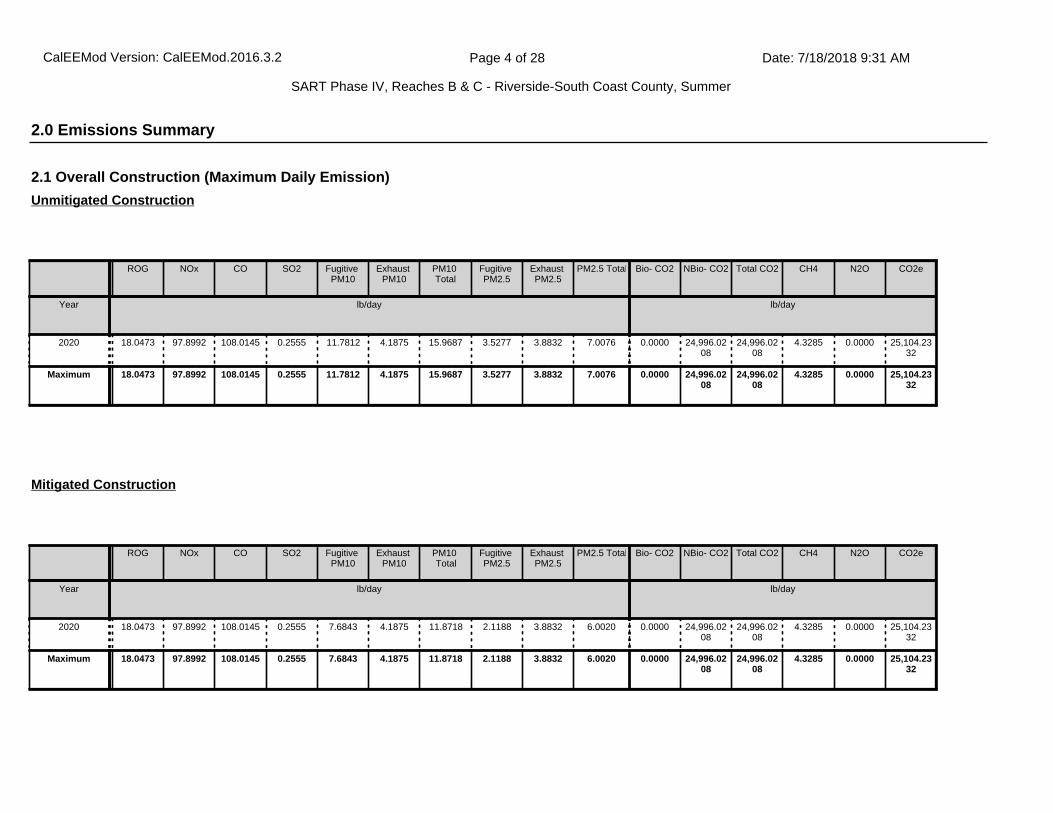
2.0 Emissions Summary
2.1 Overall Construction (Maximum Daily Emission)
ROG NOx CO SO2 Fugitive PM10
Exhaust PM10
PM10 Total
Fugitive PM2.5
Exhaust PM2.5
PM2.5 Total Bio- CO2 NBio- CO2 Total CO2 CH4 N2O CO2e
Year lb/day lb/day
2020 18.0473 97.8992 108.0145 0.2555 11.7812 4.1875 15.9687 3.5277 3.8832 7.0076 0.0000 24,996.0208
24,996.0208
4.3285 0.0000 25,104.2332
Maximum 18.0473 97.8992 108.0145 0.2555 11.7812 4.1875 15.9687 3.5277 3.8832 7.0076 0.0000 24,996.0208
24,996.0208
4.3285 0.0000 25,104.2332
Unmitigated Construction
ROG NOx CO SO2 Fugitive PM10
Exhaust PM10
PM10 Total
Fugitive PM2.5
Exhaust PM2.5
PM2.5 Total Bio- CO2 NBio- CO2 Total CO2 CH4 N2O CO2e
Year lb/day lb/day
2020 18.0473 97.8992 108.0145 0.2555 7.6843 4.1875 11.8718 2.1188 3.8832 6.0020 0.0000 24,996.0208
24,996.0208
4.3285 0.0000 25,104.2332
Maximum 18.0473 97.8992 108.0145 0.2555 7.6843 4.1875 11.8718 2.1188 3.8832 6.0020 0.0000 24,996.0208
24,996.0208
4.3285 0.0000 25,104.2332
Mitigated Construction
CalEEMod Version: CalEEMod.2016.3.2 Date: 7/18/2018 9:31 AMPage 4 of 28
SART Phase IV, Reaches B & C - Riverside-South Coast County, Summer

ROG NOx CO SO2 Fugitive PM10
Exhaust PM10
PM10 Total
Fugitive PM2.5
Exhaust PM2.5
PM2.5 Total
Bio- CO2 NBio-CO2 Total CO2 CH4 N20 CO2e
Percent Reduction
0.00 0.00 0.00 0.00 34.77 0.00 25.66 39.94 0.00 14.35 0.00 0.00 0.00 0.00 0.00 0.00
CalEEMod Version: CalEEMod.2016.3.2 Date: 7/18/2018 9:31 AMPage 5 of 28
SART Phase IV, Reaches B & C - Riverside-South Coast County, Summer

2.2 Overall Operational
ROG NOx CO SO2 Fugitive PM10
Exhaust PM10
PM10 Total
Fugitive PM2.5
Exhaust PM2.5
PM2.5 Total Bio- CO2 NBio- CO2 Total CO2 CH4 N2O CO2e
Category lb/day lb/day
Area 1.0803 5.0000e-005
5.9200e-003
0.0000 2.0000e-005
2.0000e-005
2.0000e-005
2.0000e-005
0.0126 0.0126 3.0000e-005
0.0135
Energy 0.0000 0.0000 0.0000 0.0000 0.0000 0.0000 0.0000 0.0000 0.0000 0.0000 0.0000 0.0000 0.0000
Mobile 0.0000 0.0000 0.0000 0.0000 0.0000 0.0000 0.0000 0.0000 0.0000 0.0000 0.0000 0.0000 0.0000 0.0000
Total 1.0803 5.0000e-005
5.9200e-003
0.0000 0.0000 2.0000e-005
2.0000e-005
0.0000 2.0000e-005
2.0000e-005
0.0126 0.0126 3.0000e-005
0.0000 0.0135
Unmitigated Operational
ROG NOx CO SO2 Fugitive PM10
Exhaust PM10
PM10 Total
Fugitive PM2.5
Exhaust PM2.5
PM2.5 Total Bio- CO2 NBio- CO2 Total CO2 CH4 N2O CO2e
Category lb/day lb/day
Area 1.0803 5.0000e-005
5.9200e-003
0.0000 2.0000e-005
2.0000e-005
2.0000e-005
2.0000e-005
0.0126 0.0126 3.0000e-005
0.0135
Energy 0.0000 0.0000 0.0000 0.0000 0.0000 0.0000 0.0000 0.0000 0.0000 0.0000 0.0000 0.0000 0.0000
Mobile 0.0000 0.0000 0.0000 0.0000 0.0000 0.0000 0.0000 0.0000 0.0000 0.0000 0.0000 0.0000 0.0000 0.0000
Total 1.0803 5.0000e-005
5.9200e-003
0.0000 0.0000 2.0000e-005
2.0000e-005
0.0000 2.0000e-005
2.0000e-005
0.0126 0.0126 3.0000e-005
0.0000 0.0135
Mitigated Operational
CalEEMod Version: CalEEMod.2016.3.2 Date: 7/18/2018 9:31 AMPage 6 of 28
SART Phase IV, Reaches B & C - Riverside-South Coast County, Summer

3.0 Construction Detail
Construction Phase
Phase Number
Phase Name Phase Type Start Date End Date Num Days Week
Num Days Phase Description
1 Demolition Demolition 4/1/2020 4/9/2020 5 7
2 Site Preparation Site Preparation 4/10/2020 4/20/2020 5 7
3 Grading Grading 4/21/2020 5/11/2020 5 15
4 Building Construction Building Construction 5/12/2020 8/3/2020 5 60
5 Paving Paving 8/4/2020 10/12/2020 5 50
6 Architectural Coating Architectural Coating 10/13/2020 10/19/2020 5 5
OffRoad Equipment
Phase Name Offroad Equipment Type Amount Usage Hours Horse Power Load Factor
Demolition Concrete/Industrial Saws 1 8.00 81 0.73
Demolition Excavators 0 8.00 158 0.38
Demolition Graders 1 7.00 187 0.41
Demolition Off-Highway Trucks 2 7.00 402 0.38
ROG NOx CO SO2 Fugitive PM10
Exhaust PM10
PM10 Total
Fugitive PM2.5
Exhaust PM2.5
PM2.5 Total
Bio- CO2 NBio-CO2 Total CO2 CH4 N20 CO2e
Percent Reduction
0.00 0.00 0.00 0.00 0.00 0.00 0.00 0.00 0.00 0.00 0.00 0.00 0.00 0.00 0.00 0.00
Residential Indoor: 0; Residential Outdoor: 0; Non-Residential Indoor: 0; Non-Residential Outdoor: 0; Striped Parking Area: 16,896 (Architectural Coating – sqft)
Acres of Grading (Site Preparation Phase): 6.13
Acres of Grading (Grading Phase): 58.13
Acres of Paving: 57.59
CalEEMod Version: CalEEMod.2016.3.2 Date: 7/18/2018 9:31 AMPage 7 of 28
SART Phase IV, Reaches B & C - Riverside-South Coast County, Summer

Demolition Rubber Tired Dozers 1 8.00 247 0.40
Demolition Rubber Tired Loaders 1 7.00 203 0.36
Demolition Signal Boards 3 7.00 6 0.82
Demolition Skid Steer Loaders 1 7.00 65 0.37
Demolition Tractors/Loaders/Backhoes 2 7.00 97 0.37
Site Preparation Concrete/Industrial Saws 1 7.00 81 0.73
Site Preparation Graders 2 7.00 187 0.41
Site Preparation Off-Highway Trucks 2 7.00 402 0.38
Site Preparation Rollers 2 7.00 80 0.38
Site Preparation Rubber Tired Dozers 1 8.00 247 0.40
Site Preparation Signal Boards 3 7.00 6 0.82
Site Preparation Skid Steer Loaders 1 7.00 65 0.37
Site Preparation Tractors/Loaders/Backhoes 2 8.00 97 0.37
Grading Bore/Drill Rigs 1 7.00 221 0.50
Grading Cranes 1 7.00 231 0.29
Grading Crawler Tractors 2 7.00 212 0.43
Grading Excavators 2 8.00 158 0.38
Grading Graders 2 8.00 187 0.41
Grading Off-Highway Tractors 1 7.00 124 0.44
Grading Rollers 2 7.00 80 0.38
Grading Rubber Tired Dozers 0 8.00 247 0.40
Grading Scrapers 2 8.00 367 0.48
Grading Signal Boards 3 7.00 6 0.82
Grading Skid Steer Loaders 2 7.00 65 0.37
Grading Surfacing Equipment 1 7.00 263 0.30
Grading Tractors/Loaders/Backhoes 2 8.00 97 0.37
Grading Trenchers 1 7.00 78 0.50
CalEEMod Version: CalEEMod.2016.3.2 Date: 7/18/2018 9:31 AMPage 8 of 28
SART Phase IV, Reaches B & C - Riverside-South Coast County, Summer

Building Construction Bore/Drill Rigs 1 7.00 221 0.50
Building Construction Concrete/Industrial Saws 2 7.00 81 0.73
Building Construction Cranes 1 7.00 231 0.29
Building Construction Crawler Tractors 2 7.00 212 0.43
Building Construction Excavators 2 7.00 158 0.38
Building Construction Forklifts 0 8.00 89 0.20
Building Construction Generator Sets 0 8.00 84 0.74
Building Construction Graders 2 7.00 187 0.41
Building Construction Off-Highway Tractors 1 7.00 124 0.44
Building Construction Off-Highway Trucks 1 7.00 402 0.38
Building Construction Other Construction Equipment 1 7.00 172 0.42
Building Construction Pavers 1 7.00 130 0.42
Building Construction Paving Equipment 1 7.00 132 0.36
Building Construction Rollers 1 7.00 80 0.38
Building Construction Rough Terrain Forklifts 1 7.00 100 0.40
Building Construction Scrapers 2 7.00 367 0.48
Building Construction Signal Boards 3 7.00 6 0.82
Building Construction Skid Steer Loaders 2 7.00 65 0.37
Building Construction Surfacing Equipment 1 7.00 263 0.30
Building Construction Tractors/Loaders/Backhoes 2 7.00 97 0.37
Building Construction Trenchers 1 7.00 78 0.50
Building Construction Welders 0 8.00 46 0.45
Paving Graders 1 7.00 187 0.41
Paving Off-Highway Tractors 1 7.00 124 0.44
Paving Off-Highway Trucks 2 7.00 402 0.38
Paving Pavers 1 8.00 130 0.42
Paving Paving Equipment 1 8.00 132 0.36
CalEEMod Version: CalEEMod.2016.3.2 Date: 7/18/2018 9:31 AMPage 9 of 28
SART Phase IV, Reaches B & C - Riverside-South Coast County, Summer

3.1 Mitigation Measures Construction
Use Soil Stabilizer
Replace Ground Cover
Water Exposed Area
Reduce Vehicle Speed on Unpaved Roads
Clean Paved Roads
Paving Rollers 3 8.00 80 0.38
Paving Scrapers 2 7.00 367 0.48
Paving Signal Boards 3 7.00 6 0.82
Paving Skid Steer Loaders 1 7.00 65 0.37
Paving Surfacing Equipment 1 7.00 263 0.30
Paving Tractors/Loaders/Backhoes 2 7.00 97 0.37
Architectural Coating Air Compressors 0 6.00 78 0.48
Architectural Coating Off-Highway Trucks 2 7.00 402 0.38
Architectural Coating Signal Boards 3 7.00 6 0.82
Trips and VMT
Phase Name Offroad Equipment Count
Worker Trip Number
Vendor Trip Number
Hauling Trip Number
Worker Trip Length
Vendor Trip Length
Hauling Trip Length
Worker Vehicle Class
Vendor Vehicle Class
Hauling Vehicle Class
Demolition 12 30.00 0.00 50.00 14.70 6.90 20.00 LD_Mix HDT_Mix HHDT
Site Preparation 14 35.00 0.00 19.00 14.70 6.90 20.00 LD_Mix HDT_Mix HHDT
Grading 22 55.00 0.00 19.00 14.70 6.90 20.00 LD_Mix HDT_Mix HHDT
Building Construction 28 1,054.00 0.00 0.00 14.70 6.90 20.00 LD_Mix HDT_Mix HHDT
Paving 18 45.00 0.00 0.00 14.70 6.90 20.00 LD_Mix HDT_Mix HHDT
Architectural Coating 5 211.00 0.00 0.00 14.70 6.90 20.00 LD_Mix HDT_Mix HHDT
CalEEMod Version: CalEEMod.2016.3.2 Date: 7/18/2018 9:31 AMPage 10 of 28
SART Phase IV, Reaches B & C - Riverside-South Coast County, Summer

3.2 Demolition - 2020
ROG NOx CO SO2 Fugitive PM10
Exhaust PM10
PM10 Total
Fugitive PM2.5
Exhaust PM2.5
PM2.5 Total Bio- CO2 NBio- CO2 Total CO2 CH4 N2O CO2e
Category lb/day lb/day
Fugitive Dust 1.5625 0.0000 1.5625 0.2366 0.0000 0.2366 0.0000 0.0000
Off-Road 3.9889 40.6459 23.5004 0.0582 1.7712 1.7712 1.6483 1.6483 5,580.4300
5,580.4300
1.6223 5,620.9865
Total 3.9889 40.6459 23.5004 0.0582 1.5625 1.7712 3.3337 0.2366 1.6483 1.8848 5,580.4300
5,580.4300
1.6223 5,620.9865
Unmitigated Construction On-Site
ROG NOx CO SO2 Fugitive PM10
Exhaust PM10
PM10 Total
Fugitive PM2.5
Exhaust PM2.5
PM2.5 Total Bio- CO2 NBio- CO2 Total CO2 CH4 N2O CO2e
Category lb/day lb/day
Hauling 0.0367 1.6913 0.2087 5.4400e-003
0.1250 5.3900e-003
0.1303 0.0343 5.1600e-003
0.0394 576.9766 576.9766 0.0344 577.8362
Vendor 0.0000 0.0000 0.0000 0.0000 0.0000 0.0000 0.0000 0.0000 0.0000 0.0000 0.0000 0.0000 0.0000 0.0000
Worker 0.1527 0.0903 1.2096 3.3200e-003
0.3353 2.0300e-003
0.3374 0.0889 1.8700e-003
0.0908 330.4784 330.4784 8.4700e-003
330.6901
Total 0.1894 1.7816 1.4183 8.7600e-003
0.4603 7.4200e-003
0.4677 0.1232 7.0300e-003
0.1302 907.4550 907.4550 0.0429 908.5264
Unmitigated Construction Off-Site
CalEEMod Version: CalEEMod.2016.3.2 Date: 7/18/2018 9:31 AMPage 11 of 28
SART Phase IV, Reaches B & C - Riverside-South Coast County, Summer

3.2 Demolition - 2020
ROG NOx CO SO2 Fugitive PM10
Exhaust PM10
PM10 Total
Fugitive PM2.5
Exhaust PM2.5
PM2.5 Total Bio- CO2 NBio- CO2 Total CO2 CH4 N2O CO2e
Category lb/day lb/day
Fugitive Dust 0.5977 0.0000 0.5977 0.0905 0.0000 0.0905 0.0000 0.0000
Off-Road 3.9889 40.6459 23.5004 0.0582 1.7712 1.7712 1.6483 1.6483 0.0000 5,580.4300
5,580.4300
1.6223 5,620.9865
Total 3.9889 40.6459 23.5004 0.0582 0.5977 1.7712 2.3688 0.0905 1.6483 1.7387 0.0000 5,580.4300
5,580.4300
1.6223 5,620.9865
Mitigated Construction On-Site
ROG NOx CO SO2 Fugitive PM10
Exhaust PM10
PM10 Total
Fugitive PM2.5
Exhaust PM2.5
PM2.5 Total Bio- CO2 NBio- CO2 Total CO2 CH4 N2O CO2e
Category lb/day lb/day
Hauling 0.0367 1.6913 0.2087 5.4400e-003
0.0872 5.3900e-003
0.0926 0.0250 5.1600e-003
0.0301 576.9766 576.9766 0.0344 577.8362
Vendor 0.0000 0.0000 0.0000 0.0000 0.0000 0.0000 0.0000 0.0000 0.0000 0.0000 0.0000 0.0000 0.0000 0.0000
Worker 0.1527 0.0903 1.2096 3.3200e-003
0.2187 2.0300e-003
0.2208 0.0603 1.8700e-003
0.0622 330.4784 330.4784 8.4700e-003
330.6901
Total 0.1894 1.7816 1.4183 8.7600e-003
0.3059 7.4200e-003
0.3133 0.0853 7.0300e-003
0.0923 907.4550 907.4550 0.0429 908.5264
Mitigated Construction Off-Site
CalEEMod Version: CalEEMod.2016.3.2 Date: 7/18/2018 9:31 AMPage 12 of 28
SART Phase IV, Reaches B & C - Riverside-South Coast County, Summer

3.3 Site Preparation - 2020
ROG NOx CO SO2 Fugitive PM10
Exhaust PM10
PM10 Total
Fugitive PM2.5
Exhaust PM2.5
PM2.5 Total Bio- CO2 NBio- CO2 Total CO2 CH4 N2O CO2e
Category lb/day lb/day
Fugitive Dust 6.9535 0.0000 6.9535 3.4109 0.0000 3.4109 0.0000 0.0000
Off-Road 4.4423 46.0784 27.0796 0.0632 2.0607 2.0607 1.9127 1.9127 6,059.0192
6,059.0192
1.7963 6,103.9270
Total 4.4423 46.0784 27.0796 0.0632 6.9535 2.0607 9.0142 3.4109 1.9127 5.3236 6,059.0192
6,059.0192
1.7963 6,103.9270
Unmitigated Construction On-Site
ROG NOx CO SO2 Fugitive PM10
Exhaust PM10
PM10 Total
Fugitive PM2.5
Exhaust PM2.5
PM2.5 Total Bio- CO2 NBio- CO2 Total CO2 CH4 N2O CO2e
Category lb/day lb/day
Hauling 0.0140 0.6427 0.0793 2.0700e-003
0.0475 2.0500e-003
0.0495 0.0130 1.9600e-003
0.0150 219.2511 219.2511 0.0131 219.5778
Vendor 0.0000 0.0000 0.0000 0.0000 0.0000 0.0000 0.0000 0.0000 0.0000 0.0000 0.0000 0.0000 0.0000 0.0000
Worker 0.1781 0.1053 1.4113 3.8700e-003
0.3912 2.3700e-003
0.3936 0.1038 2.1800e-003
0.1059 385.5581 385.5581 9.8800e-003
385.8052
Total 0.1921 0.7480 1.4906 5.9400e-003
0.4387 4.4200e-003
0.4431 0.1168 4.1400e-003
0.1209 604.8092 604.8092 0.0230 605.3829
Unmitigated Construction Off-Site
CalEEMod Version: CalEEMod.2016.3.2 Date: 7/18/2018 9:31 AMPage 13 of 28
SART Phase IV, Reaches B & C - Riverside-South Coast County, Summer

3.3 Site Preparation - 2020
ROG NOx CO SO2 Fugitive PM10
Exhaust PM10
PM10 Total
Fugitive PM2.5
Exhaust PM2.5
PM2.5 Total Bio- CO2 NBio- CO2 Total CO2 CH4 N2O CO2e
Category lb/day lb/day
Fugitive Dust 2.6597 0.0000 2.6597 1.3047 0.0000 1.3047 0.0000 0.0000
Off-Road 4.4423 46.0784 27.0796 0.0632 2.0607 2.0607 1.9127 1.9127 0.0000 6,059.0192
6,059.0192
1.7963 6,103.9270
Total 4.4423 46.0784 27.0796 0.0632 2.6597 2.0607 4.7204 1.3047 1.9127 3.2173 0.0000 6,059.0192
6,059.0192
1.7963 6,103.9270
Mitigated Construction On-Site
ROG NOx CO SO2 Fugitive PM10
Exhaust PM10
PM10 Total
Fugitive PM2.5
Exhaust PM2.5
PM2.5 Total Bio- CO2 NBio- CO2 Total CO2 CH4 N2O CO2e
Category lb/day lb/day
Hauling 0.0140 0.6427 0.0793 2.0700e-003
0.0331 2.0500e-003
0.0352 9.4900e-003
1.9600e-003
0.0115 219.2511 219.2511 0.0131 219.5778
Vendor 0.0000 0.0000 0.0000 0.0000 0.0000 0.0000 0.0000 0.0000 0.0000 0.0000 0.0000 0.0000 0.0000 0.0000
Worker 0.1781 0.1053 1.4113 3.8700e-003
0.2552 2.3700e-003
0.2575 0.0704 2.1800e-003
0.0725 385.5581 385.5581 9.8800e-003
385.8052
Total 0.1921 0.7480 1.4906 5.9400e-003
0.2883 4.4200e-003
0.2927 0.0799 4.1400e-003
0.0840 604.8092 604.8092 0.0230 605.3829
Mitigated Construction Off-Site
CalEEMod Version: CalEEMod.2016.3.2 Date: 7/18/2018 9:31 AMPage 14 of 28
SART Phase IV, Reaches B & C - Riverside-South Coast County, Summer

3.4 Grading - 2020
ROG NOx CO SO2 Fugitive PM10
Exhaust PM10
PM10 Total
Fugitive PM2.5
Exhaust PM2.5
PM2.5 Total Bio- CO2 NBio- CO2 Total CO2 CH4 N2O CO2e
Category lb/day lb/day
Fugitive Dust 4.1111 0.0000 4.1111 0.4440 0.0000 0.4440 0.0000 0.0000
Off-Road 6.9263 80.4614 50.7220 0.1101 3.3931 3.3931 3.1246 3.1246 10,619.7210
10,619.7210
3.4062 10,704.8762
Total 6.9263 80.4614 50.7220 0.1101 4.1111 3.3931 7.5042 0.4440 3.1246 3.5685 10,619.7210
10,619.7210
3.4062 10,704.8762
Unmitigated Construction On-Site
ROG NOx CO SO2 Fugitive PM10
Exhaust PM10
PM10 Total
Fugitive PM2.5
Exhaust PM2.5
PM2.5 Total Bio- CO2 NBio- CO2 Total CO2 CH4 N2O CO2e
Category lb/day lb/day
Hauling 6.5100e-003
0.2999 0.0370 9.6000e-004
0.0222 9.6000e-004
0.0231 6.0700e-003
9.1000e-004
6.9900e-003
102.3172 102.3172 6.1000e-003
102.4696
Vendor 0.0000 0.0000 0.0000 0.0000 0.0000 0.0000 0.0000 0.0000 0.0000 0.0000 0.0000 0.0000 0.0000 0.0000
Worker 0.2799 0.1655 2.2177 6.0800e-003
0.6148 3.7200e-003
0.6185 0.1630 3.4300e-003
0.1665 605.8770 605.8770 0.0155 606.2653
Total 0.2864 0.4655 2.2547 7.0400e-003
0.6369 4.6800e-003
0.6416 0.1691 4.3400e-003
0.1735 708.1942 708.1942 0.0216 708.7349
Unmitigated Construction Off-Site
CalEEMod Version: CalEEMod.2016.3.2 Date: 7/18/2018 9:31 AMPage 15 of 28
SART Phase IV, Reaches B & C - Riverside-South Coast County, Summer

3.4 Grading - 2020
ROG NOx CO SO2 Fugitive PM10
Exhaust PM10
PM10 Total
Fugitive PM2.5
Exhaust PM2.5
PM2.5 Total Bio- CO2 NBio- CO2 Total CO2 CH4 N2O CO2e
Category lb/day lb/day
Fugitive Dust 1.5725 0.0000 1.5725 0.1698 0.0000 0.1698 0.0000 0.0000
Off-Road 6.9263 80.4614 50.7220 0.1101 3.3931 3.3931 3.1246 3.1246 0.0000 10,619.7210
10,619.7210
3.4062 10,704.8762
Total 6.9263 80.4614 50.7220 0.1101 1.5725 3.3931 4.9656 0.1698 3.1246 3.2944 0.0000 10,619.7210
10,619.7210
3.4062 10,704.8762
Mitigated Construction On-Site
ROG NOx CO SO2 Fugitive PM10
Exhaust PM10
PM10 Total
Fugitive PM2.5
Exhaust PM2.5
PM2.5 Total Bio- CO2 NBio- CO2 Total CO2 CH4 N2O CO2e
Category lb/day lb/day
Hauling 6.5100e-003
0.2999 0.0370 9.6000e-004
0.0155 9.6000e-004
0.0164 4.4300e-003
9.1000e-004
5.3400e-003
102.3172 102.3172 6.1000e-003
102.4696
Vendor 0.0000 0.0000 0.0000 0.0000 0.0000 0.0000 0.0000 0.0000 0.0000 0.0000 0.0000 0.0000 0.0000 0.0000
Worker 0.2799 0.1655 2.2177 6.0800e-003
0.4010 3.7200e-003
0.4047 0.1106 3.4300e-003
0.1140 605.8770 605.8770 0.0155 606.2653
Total 0.2864 0.4655 2.2547 7.0400e-003
0.4164 4.6800e-003
0.4211 0.1150 4.3400e-003
0.1193 708.1942 708.1942 0.0216 708.7349
Mitigated Construction Off-Site
CalEEMod Version: CalEEMod.2016.3.2 Date: 7/18/2018 9:31 AMPage 16 of 28
SART Phase IV, Reaches B & C - Riverside-South Coast County, Summer

3.5 Building Construction - 2020
ROG NOx CO SO2 Fugitive PM10
Exhaust PM10
PM10 Total
Fugitive PM2.5
Exhaust PM2.5
PM2.5 Total Bio- CO2 NBio- CO2 Total CO2 CH4 N2O CO2e
Category lb/day lb/day
Off-Road 8.5359 94.7272 65.5156 0.1389 4.1161 4.1161 3.8175 3.8175 13,385.2144
13,385.2144
4.0309 13,485.9865
Total 8.5359 94.7272 65.5156 0.1389 4.1161 4.1161 3.8175 3.8175 13,385.2144
13,385.2144
4.0309 13,485.9865
Unmitigated Construction On-Site
ROG NOx CO SO2 Fugitive PM10
Exhaust PM10
PM10 Total
Fugitive PM2.5
Exhaust PM2.5
PM2.5 Total Bio- CO2 NBio- CO2 Total CO2 CH4 N2O CO2e
Category lb/day lb/day
Hauling 0.0000 0.0000 0.0000 0.0000 0.0000 0.0000 0.0000 0.0000 0.0000 0.0000 0.0000 0.0000 0.0000 0.0000
Vendor 0.0000 0.0000 0.0000 0.0000 0.0000 0.0000 0.0000 0.0000 0.0000 0.0000 0.0000 0.0000 0.0000 0.0000
Worker 5.3636 3.1721 42.4989 0.1166 11.7812 0.0713 11.8526 3.1244 0.0657 3.1901 11,610.8064
11,610.8064
0.2976 11,618.2468
Total 5.3636 3.1721 42.4989 0.1166 11.7812 0.0713 11.8526 3.1244 0.0657 3.1901 11,610.8064
11,610.8064
0.2976 11,618.2468
Unmitigated Construction Off-Site
CalEEMod Version: CalEEMod.2016.3.2 Date: 7/18/2018 9:31 AMPage 17 of 28
SART Phase IV, Reaches B & C - Riverside-South Coast County, Summer

3.5 Building Construction - 2020
ROG NOx CO SO2 Fugitive PM10
Exhaust PM10
PM10 Total
Fugitive PM2.5
Exhaust PM2.5
PM2.5 Total Bio- CO2 NBio- CO2 Total CO2 CH4 N2O CO2e
Category lb/day lb/day
Off-Road 8.5359 94.7272 65.5156 0.1389 4.1161 4.1161 3.8175 3.8175 0.0000 13,385.2143
13,385.2143
4.0309 13,485.9864
Total 8.5359 94.7272 65.5156 0.1389 4.1161 4.1161 3.8175 3.8175 0.0000 13,385.2143
13,385.2143
4.0309 13,485.9864
Mitigated Construction On-Site
ROG NOx CO SO2 Fugitive PM10
Exhaust PM10
PM10 Total
Fugitive PM2.5
Exhaust PM2.5
PM2.5 Total Bio- CO2 NBio- CO2 Total CO2 CH4 N2O CO2e
Category lb/day lb/day
Hauling 0.0000 0.0000 0.0000 0.0000 0.0000 0.0000 0.0000 0.0000 0.0000 0.0000 0.0000 0.0000 0.0000 0.0000
Vendor 0.0000 0.0000 0.0000 0.0000 0.0000 0.0000 0.0000 0.0000 0.0000 0.0000 0.0000 0.0000 0.0000 0.0000
Worker 5.3636 3.1721 42.4989 0.1166 7.6843 0.0713 7.7557 2.1188 0.0657 2.1845 11,610.8064
11,610.8064
0.2976 11,618.2468
Total 5.3636 3.1721 42.4989 0.1166 7.6843 0.0713 7.7557 2.1188 0.0657 2.1845 11,610.8064
11,610.8064
0.2976 11,618.2468
Mitigated Construction Off-Site
CalEEMod Version: CalEEMod.2016.3.2 Date: 7/18/2018 9:31 AMPage 18 of 28
SART Phase IV, Reaches B & C - Riverside-South Coast County, Summer

3.6 Paving - 2020
ROG NOx CO SO2 Fugitive PM10
Exhaust PM10
PM10 Total
Fugitive PM2.5
Exhaust PM2.5
PM2.5 Total Bio- CO2 NBio- CO2 Total CO2 CH4 N2O CO2e
Category lb/day lb/day
Off-Road 5.4014 58.5889 42.6080 0.0912 2.5333 2.5333 2.3336 2.3336 8,782.6417
8,782.6417
2.8121 8,852.9432
Paving 0.0000 0.0000 0.0000 0.0000 0.0000 0.0000 0.0000
Total 5.4014 58.5889 42.6080 0.0912 2.5333 2.5333 2.3336 2.3336 8,782.6417
8,782.6417
2.8121 8,852.9432
Unmitigated Construction On-Site
ROG NOx CO SO2 Fugitive PM10
Exhaust PM10
PM10 Total
Fugitive PM2.5
Exhaust PM2.5
PM2.5 Total Bio- CO2 NBio- CO2 Total CO2 CH4 N2O CO2e
Category lb/day lb/day
Hauling 0.0000 0.0000 0.0000 0.0000 0.0000 0.0000 0.0000 0.0000 0.0000 0.0000 0.0000 0.0000 0.0000 0.0000
Vendor 0.0000 0.0000 0.0000 0.0000 0.0000 0.0000 0.0000 0.0000 0.0000 0.0000 0.0000 0.0000 0.0000 0.0000
Worker 0.2290 0.1354 1.8145 4.9800e-003
0.5030 3.0500e-003
0.5060 0.1334 2.8000e-003
0.1362 495.7175 495.7175 0.0127 496.0352
Total 0.2290 0.1354 1.8145 4.9800e-003
0.5030 3.0500e-003
0.5060 0.1334 2.8000e-003
0.1362 495.7175 495.7175 0.0127 496.0352
Unmitigated Construction Off-Site
CalEEMod Version: CalEEMod.2016.3.2 Date: 7/18/2018 9:31 AMPage 19 of 28
SART Phase IV, Reaches B & C - Riverside-South Coast County, Summer

3.6 Paving - 2020
ROG NOx CO SO2 Fugitive PM10
Exhaust PM10
PM10 Total
Fugitive PM2.5
Exhaust PM2.5
PM2.5 Total Bio- CO2 NBio- CO2 Total CO2 CH4 N2O CO2e
Category lb/day lb/day
Off-Road 5.4014 58.5889 42.6080 0.0912 2.5333 2.5333 2.3336 2.3336 0.0000 8,782.6417
8,782.6417
2.8121 8,852.9431
Paving 0.0000 0.0000 0.0000 0.0000 0.0000 0.0000 0.0000
Total 5.4014 58.5889 42.6080 0.0912 2.5333 2.5333 2.3336 2.3336 0.0000 8,782.6417
8,782.6417
2.8121 8,852.9431
Mitigated Construction On-Site
ROG NOx CO SO2 Fugitive PM10
Exhaust PM10
PM10 Total
Fugitive PM2.5
Exhaust PM2.5
PM2.5 Total Bio- CO2 NBio- CO2 Total CO2 CH4 N2O CO2e
Category lb/day lb/day
Hauling 0.0000 0.0000 0.0000 0.0000 0.0000 0.0000 0.0000 0.0000 0.0000 0.0000 0.0000 0.0000 0.0000 0.0000
Vendor 0.0000 0.0000 0.0000 0.0000 0.0000 0.0000 0.0000 0.0000 0.0000 0.0000 0.0000 0.0000 0.0000 0.0000
Worker 0.2290 0.1354 1.8145 4.9800e-003
0.3281 3.0500e-003
0.3311 0.0905 2.8000e-003
0.0933 495.7175 495.7175 0.0127 496.0352
Total 0.2290 0.1354 1.8145 4.9800e-003
0.3281 3.0500e-003
0.3311 0.0905 2.8000e-003
0.0933 495.7175 495.7175 0.0127 496.0352
Mitigated Construction Off-Site
CalEEMod Version: CalEEMod.2016.3.2 Date: 7/18/2018 9:31 AMPage 20 of 28
SART Phase IV, Reaches B & C - Riverside-South Coast County, Summer

3.7 Architectural Coating - 2020
ROG NOx CO SO2 Fugitive PM10
Exhaust PM10
PM10 Total
Fugitive PM2.5
Exhaust PM2.5
PM2.5 Total Bio- CO2 NBio- CO2 Total CO2 CH4 N2O CO2e
Category lb/day lb/day
Archit. Coating 15.6626 0.0000 0.0000 0.0000 0.0000 0.0000 0.0000
Off-Road 1.3110 12.0083 7.4579 0.0249 0.4398 0.4398 0.4076 0.4076 2,367.0366
2,367.0366
0.7371 2,385.4646
Total 16.9736 12.0083 7.4579 0.0249 0.4398 0.4398 0.4076 0.4076 2,367.0366
2,367.0366
0.7371 2,385.4646
Unmitigated Construction On-Site
ROG NOx CO SO2 Fugitive PM10
Exhaust PM10
PM10 Total
Fugitive PM2.5
Exhaust PM2.5
PM2.5 Total Bio- CO2 NBio- CO2 Total CO2 CH4 N2O CO2e
Category lb/day lb/day
Hauling 0.0000 0.0000 0.0000 0.0000 0.0000 0.0000 0.0000 0.0000 0.0000 0.0000 0.0000 0.0000 0.0000 0.0000
Vendor 0.0000 0.0000 0.0000 0.0000 0.0000 0.0000 0.0000 0.0000 0.0000 0.0000 0.0000 0.0000 0.0000 0.0000
Worker 1.0737 0.6350 8.5078 0.0233 2.3585 0.0143 2.3728 0.6255 0.0132 0.6386 2,324.3645
2,324.3645
0.0596 2,325.8540
Total 1.0737 0.6350 8.5078 0.0233 2.3585 0.0143 2.3728 0.6255 0.0132 0.6386 2,324.3645
2,324.3645
0.0596 2,325.8540
Unmitigated Construction Off-Site
CalEEMod Version: CalEEMod.2016.3.2 Date: 7/18/2018 9:31 AMPage 21 of 28
SART Phase IV, Reaches B & C - Riverside-South Coast County, Summer

4.0 Operational Detail - Mobile
3.7 Architectural Coating - 2020
ROG NOx CO SO2 Fugitive PM10
Exhaust PM10
PM10 Total
Fugitive PM2.5
Exhaust PM2.5
PM2.5 Total Bio- CO2 NBio- CO2 Total CO2 CH4 N2O CO2e
Category lb/day lb/day
Archit. Coating 15.6626 0.0000 0.0000 0.0000 0.0000 0.0000 0.0000
Off-Road 1.3110 12.0083 7.4579 0.0249 0.4398 0.4398 0.4076 0.4076 0.0000 2,367.0366
2,367.0366
0.7371 2,385.4646
Total 16.9736 12.0083 7.4579 0.0249 0.4398 0.4398 0.4076 0.4076 0.0000 2,367.0366
2,367.0366
0.7371 2,385.4646
Mitigated Construction On-Site
ROG NOx CO SO2 Fugitive PM10
Exhaust PM10
PM10 Total
Fugitive PM2.5
Exhaust PM2.5
PM2.5 Total Bio- CO2 NBio- CO2 Total CO2 CH4 N2O CO2e
Category lb/day lb/day
Hauling 0.0000 0.0000 0.0000 0.0000 0.0000 0.0000 0.0000 0.0000 0.0000 0.0000 0.0000 0.0000 0.0000 0.0000
Vendor 0.0000 0.0000 0.0000 0.0000 0.0000 0.0000 0.0000 0.0000 0.0000 0.0000 0.0000 0.0000 0.0000 0.0000
Worker 1.0737 0.6350 8.5078 0.0233 1.5383 0.0143 1.5526 0.4242 0.0132 0.4373 2,324.3645
2,324.3645
0.0596 2,325.8540
Total 1.0737 0.6350 8.5078 0.0233 1.5383 0.0143 1.5526 0.4242 0.0132 0.4373 2,324.3645
2,324.3645
0.0596 2,325.8540
Mitigated Construction Off-Site
CalEEMod Version: CalEEMod.2016.3.2 Date: 7/18/2018 9:31 AMPage 22 of 28
SART Phase IV, Reaches B & C - Riverside-South Coast County, Summer

ROG NOx CO SO2 Fugitive PM10
Exhaust PM10
PM10 Total
Fugitive PM2.5
Exhaust PM2.5
PM2.5 Total Bio- CO2 NBio- CO2 Total CO2 CH4 N2O CO2e
Category lb/day lb/day
Mitigated 0.0000 0.0000 0.0000 0.0000 0.0000 0.0000 0.0000 0.0000 0.0000 0.0000 0.0000 0.0000 0.0000 0.0000
Unmitigated 0.0000 0.0000 0.0000 0.0000 0.0000 0.0000 0.0000 0.0000 0.0000 0.0000 0.0000 0.0000 0.0000 0.0000
4.1 Mitigation Measures Mobile
4.2 Trip Summary Information
4.3 Trip Type Information
Average Daily Trip Rate Unmitigated Mitigated
Land Use Weekday Saturday Sunday Annual VMT Annual VMT
Other Non-Asphalt Surfaces 0.00 0.00 0.00
Total 0.00 0.00 0.00
Miles Trip % Trip Purpose %
Land Use H-W or C-W H-S or C-C H-O or C-NW H-W or C-W H-S or C-C H-O or C-NW Primary Diverted Pass-by
Other Non-Asphalt Surfaces 16.60 8.40 6.90 0.00 0.00 0.00 0 0 0
4.4 Fleet Mix
Land Use LDA LDT1 LDT2 MDV LHD1 LHD2 MHD HHD OBUS UBUS MCY SBUS MH
Other Non-Asphalt Surfaces 0.538064 0.038449 0.184390 0.122109 0.017402 0.005339 0.017250 0.067711 0.001365 0.001213 0.004629 0.000959 0.001120
CalEEMod Version: CalEEMod.2016.3.2 Date: 7/18/2018 9:31 AMPage 23 of 28
SART Phase IV, Reaches B & C - Riverside-South Coast County, Summer

5.0 Energy Detail
ROG NOx CO SO2 Fugitive PM10
Exhaust PM10
PM10 Total
Fugitive PM2.5
Exhaust PM2.5
PM2.5 Total Bio- CO2 NBio- CO2 Total CO2 CH4 N2O CO2e
Category lb/day lb/day
NaturalGas Mitigated
0.0000 0.0000 0.0000 0.0000 0.0000 0.0000 0.0000 0.0000 0.0000 0.0000 0.0000 0.0000 0.0000
NaturalGas Unmitigated
0.0000 0.0000 0.0000 0.0000 0.0000 0.0000 0.0000 0.0000 0.0000 0.0000 0.0000 0.0000 0.0000
5.1 Mitigation Measures Energy
Historical Energy Use: N
CalEEMod Version: CalEEMod.2016.3.2 Date: 7/18/2018 9:31 AMPage 24 of 28
SART Phase IV, Reaches B & C - Riverside-South Coast County, Summer

6.1 Mitigation Measures Area
6.0 Area Detail
5.2 Energy by Land Use - NaturalGas
NaturalGas Use
ROG NOx CO SO2 Fugitive PM10
Exhaust PM10
PM10 Total
Fugitive PM2.5
Exhaust PM2.5
PM2.5 Total Bio- CO2 NBio- CO2 Total CO2 CH4 N2O CO2e
Land Use kBTU/yr lb/day lb/day
Other Non-Asphalt Surfaces
0 0.0000 0.0000 0.0000 0.0000 0.0000 0.0000 0.0000 0.0000 0.0000 0.0000 0.0000 0.0000 0.0000
Total 0.0000 0.0000 0.0000 0.0000 0.0000 0.0000 0.0000 0.0000 0.0000 0.0000 0.0000 0.0000 0.0000
Unmitigated
NaturalGas Use
ROG NOx CO SO2 Fugitive PM10
Exhaust PM10
PM10 Total
Fugitive PM2.5
Exhaust PM2.5
PM2.5 Total Bio- CO2 NBio- CO2 Total CO2 CH4 N2O CO2e
Land Use kBTU/yr lb/day lb/day
Other Non-Asphalt Surfaces
0 0.0000 0.0000 0.0000 0.0000 0.0000 0.0000 0.0000 0.0000 0.0000 0.0000 0.0000 0.0000 0.0000
Total 0.0000 0.0000 0.0000 0.0000 0.0000 0.0000 0.0000 0.0000 0.0000 0.0000 0.0000 0.0000 0.0000
Mitigated
CalEEMod Version: CalEEMod.2016.3.2 Date: 7/18/2018 9:31 AMPage 25 of 28
SART Phase IV, Reaches B & C - Riverside-South Coast County, Summer

ROG NOx CO SO2 Fugitive PM10
Exhaust PM10
PM10 Total
Fugitive PM2.5
Exhaust PM2.5
PM2.5 Total Bio- CO2 NBio- CO2 Total CO2 CH4 N2O CO2e
Category lb/day lb/day
Mitigated 1.0803 5.0000e-005
5.9200e-003
0.0000 2.0000e-005
2.0000e-005
2.0000e-005
2.0000e-005
0.0126 0.0126 3.0000e-005
0.0135
Unmitigated 1.0803 5.0000e-005
5.9200e-003
0.0000 2.0000e-005
2.0000e-005
2.0000e-005
2.0000e-005
0.0126 0.0126 3.0000e-005
0.0135
6.2 Area by SubCategory
ROG NOx CO SO2 Fugitive PM10
Exhaust PM10
PM10 Total
Fugitive PM2.5
Exhaust PM2.5
PM2.5 Total Bio- CO2 NBio- CO2 Total CO2 CH4 N2O CO2e
SubCategory lb/day lb/day
Architectural Coating
0.1911 0.0000 0.0000 0.0000 0.0000 0.0000 0.0000
Consumer Products
0.8886 0.0000 0.0000 0.0000 0.0000 0.0000 0.0000
Landscaping 5.6000e-004
5.0000e-005
5.9200e-003
0.0000 2.0000e-005
2.0000e-005
2.0000e-005
2.0000e-005
0.0126 0.0126 3.0000e-005
0.0135
Total 1.0803 5.0000e-005
5.9200e-003
0.0000 2.0000e-005
2.0000e-005
2.0000e-005
2.0000e-005
0.0126 0.0126 3.0000e-005
0.0135
Unmitigated
CalEEMod Version: CalEEMod.2016.3.2 Date: 7/18/2018 9:31 AMPage 26 of 28
SART Phase IV, Reaches B & C - Riverside-South Coast County, Summer

8.1 Mitigation Measures Waste
7.1 Mitigation Measures Water
7.0 Water Detail
8.0 Waste Detail
6.2 Area by SubCategory
ROG NOx CO SO2 Fugitive PM10
Exhaust PM10
PM10 Total
Fugitive PM2.5
Exhaust PM2.5
PM2.5 Total Bio- CO2 NBio- CO2 Total CO2 CH4 N2O CO2e
SubCategory lb/day lb/day
Architectural Coating
0.1911 0.0000 0.0000 0.0000 0.0000 0.0000 0.0000
Consumer Products
0.8886 0.0000 0.0000 0.0000 0.0000 0.0000 0.0000
Landscaping 5.6000e-004
5.0000e-005
5.9200e-003
0.0000 2.0000e-005
2.0000e-005
2.0000e-005
2.0000e-005
0.0126 0.0126 3.0000e-005
0.0135
Total 1.0803 5.0000e-005
5.9200e-003
0.0000 2.0000e-005
2.0000e-005
2.0000e-005
2.0000e-005
0.0126 0.0126 3.0000e-005
0.0135
Mitigated
9.0 Operational Offroad
Equipment Type Number Hours/Day Days/Year Horse Power Load Factor Fuel Type
10.0 Stationary Equipment
Fire Pumps and Emergency Generators
CalEEMod Version: CalEEMod.2016.3.2 Date: 7/18/2018 9:31 AMPage 27 of 28
SART Phase IV, Reaches B & C - Riverside-South Coast County, Summer

11.0 Vegetation
Equipment Type Number Hours/Day Hours/Year Horse Power Load Factor Fuel Type
Boilers
Equipment Type Number Heat Input/Day Heat Input/Year Boiler Rating Fuel Type
User Defined Equipment
Equipment Type Number
CalEEMod Version: CalEEMod.2016.3.2 Date: 7/18/2018 9:31 AMPage 28 of 28
SART Phase IV, Reaches B & C - Riverside-South Coast County, Summer

1.1 Land Usage
Land Uses Size Metric Lot Acreage Floor Surface Area Population
Other Non-Asphalt Surfaces 57.59 Acre 57.59 2,508,620.40 0
1.2 Other Project Characteristics
Urbanization
Climate Zone
Urban
10
Wind Speed (m/s) Precipitation Freq (Days)2.4 28
1.3 User Entered Comments & Non-Default Data
1.0 Project Characteristics
Utility Company Southern California Edison
2020Operational Year
CO2 Intensity (lb/MWhr)
702.44 0.029CH4 Intensity (lb/MWhr)
0.006N2O Intensity (lb/MWhr)
SART Phase IV, Reaches B & CRiverside-South Coast County, Winter
CalEEMod Version: CalEEMod.2016.3.2 Date: 7/18/2018 9:34 AMPage 1 of 28
SART Phase IV, Reaches B & C - Riverside-South Coast County, Winter

Project Characteristics -
Land Use -
Construction Phase - Assumed 6 months of construction per Project Applicant.
Off-road Equipment - Construction equipment per Project Applicant.
Off-road Equipment - Construction equipment per Project Applicant.
Off-road Equipment - Construction equipment per Project Applicant.
Off-road Equipment - Construction equipment per Project Applicant.
Off-road Equipment - Construction equipment per Project Applicant.
Off-road Equipment - Construction equipment per Project Applicant.
Grading -
Demolition - Assumed 0.8 miles x 5 feet width of asphault demo.
Consumer Products -
Construction Off-road Equipment Mitigation - Per SCAQMD Rule 403. Reductions per SCAQMD CEQA Handbook.
Architectural Coating - Adjusted painting square footage to reflect 3.2 miles of striping.
Trips and VMT - Building construction vendor trips accounted for in construction equipment list.
Table Name Column Name Default Value New Value
tblArchitecturalCoating ConstArea_Parking 150,517.00 16,896.00
tblConstDustMitigation CleanPavedRoadPercentReduction 0 40
tblConstDustMitigation WaterUnpavedRoadVehicleSpeed 0 15
tblConstructionPhase NumDays 75.00 5.00
tblConstructionPhase NumDays 1,110.00 60.00
tblConstructionPhase NumDays 70.00 7.00
tblConstructionPhase NumDays 110.00 15.00
tblConstructionPhase NumDays 75.00 50.00
tblConstructionPhase NumDays 40.00 7.00
tblConstructionPhase PhaseEndDate 12/2/2025 10/19/2020
CalEEMod Version: CalEEMod.2016.3.2 Date: 7/18/2018 9:34 AMPage 2 of 28
SART Phase IV, Reaches B & C - Riverside-South Coast County, Winter

tblConstructionPhase PhaseEndDate 5/6/2025 8/3/2020
tblConstructionPhase PhaseEndDate 7/7/2020 4/9/2020
tblConstructionPhase PhaseEndDate 2/2/2021 5/11/2020
tblConstructionPhase PhaseEndDate 8/19/2025 10/12/2020
tblConstructionPhase PhaseEndDate 9/1/2020 4/20/2020
tblConstructionPhase PhaseStartDate 8/20/2025 10/13/2020
tblConstructionPhase PhaseStartDate 2/3/2021 5/12/2020
tblConstructionPhase PhaseStartDate 9/2/2020 4/21/2020
tblConstructionPhase PhaseStartDate 5/7/2025 8/4/2020
tblConstructionPhase PhaseStartDate 7/8/2020 4/10/2020
tblGrading MaterialImported 0.00 150.00
tblGrading MaterialImported 0.00 150.00
tblOffRoadEquipment OffRoadEquipmentUnitAmount 1.00 0.00
tblOffRoadEquipment OffRoadEquipmentUnitAmount 3.00 0.00
tblOffRoadEquipment OffRoadEquipmentUnitAmount 3.00 0.00
tblOffRoadEquipment OffRoadEquipmentUnitAmount 1.00 0.00
tblOffRoadEquipment OffRoadEquipmentUnitAmount 1.00 2.00
tblOffRoadEquipment OffRoadEquipmentUnitAmount 2.00 1.00
tblOffRoadEquipment OffRoadEquipmentUnitAmount 2.00 1.00
tblOffRoadEquipment OffRoadEquipmentUnitAmount 2.00 3.00
tblOffRoadEquipment OffRoadEquipmentUnitAmount 2.00 1.00
tblOffRoadEquipment OffRoadEquipmentUnitAmount 1.00 0.00
tblOffRoadEquipment OffRoadEquipmentUnitAmount 3.00 1.00
tblOffRoadEquipment OffRoadEquipmentUnitAmount 3.00 2.00
tblOffRoadEquipment OffRoadEquipmentUnitAmount 4.00 2.00
tblOffRoadEquipment OffRoadEquipmentUnitAmount 1.00 0.00
tblTripsAndVMT VendorTripNumber 411.00 0.00
CalEEMod Version: CalEEMod.2016.3.2 Date: 7/18/2018 9:34 AMPage 3 of 28
SART Phase IV, Reaches B & C - Riverside-South Coast County, Winter

2.0 Emissions Summary
2.1 Overall Construction (Maximum Daily Emission)
ROG NOx CO SO2 Fugitive PM10
Exhaust PM10
PM10 Total
Fugitive PM2.5
Exhaust PM2.5
PM2.5 Total Bio- CO2 NBio- CO2 Total CO2 CH4 N2O CO2e
Year lb/day lb/day
2020 18.0251 98.0087 99.8943 0.2435 11.7812 4.1875 15.9687 3.5277 3.8832 7.0076 0.0000 23,801.2196
23,801.2196
4.2896 0.0000 23,908.4595
Maximum 18.0251 98.0087 99.8943 0.2435 11.7812 4.1875 15.9687 3.5277 3.8832 7.0076 0.0000 23,801.2196
23,801.2196
4.2896 0.0000 23,908.4595
Unmitigated Construction
ROG NOx CO SO2 Fugitive PM10
Exhaust PM10
PM10 Total
Fugitive PM2.5
Exhaust PM2.5
PM2.5 Total Bio- CO2 NBio- CO2 Total CO2 CH4 N2O CO2e
Year lb/day lb/day
2020 18.0251 98.0087 99.8943 0.2435 7.6843 4.1875 11.8718 2.1188 3.8832 6.0020 0.0000 23,801.2196
23,801.2196
4.2896 0.0000 23,908.4595
Maximum 18.0251 98.0087 99.8943 0.2435 7.6843 4.1875 11.8718 2.1188 3.8832 6.0020 0.0000 23,801.2196
23,801.2196
4.2896 0.0000 23,908.4595
Mitigated Construction
CalEEMod Version: CalEEMod.2016.3.2 Date: 7/18/2018 9:34 AMPage 4 of 28
SART Phase IV, Reaches B & C - Riverside-South Coast County, Winter
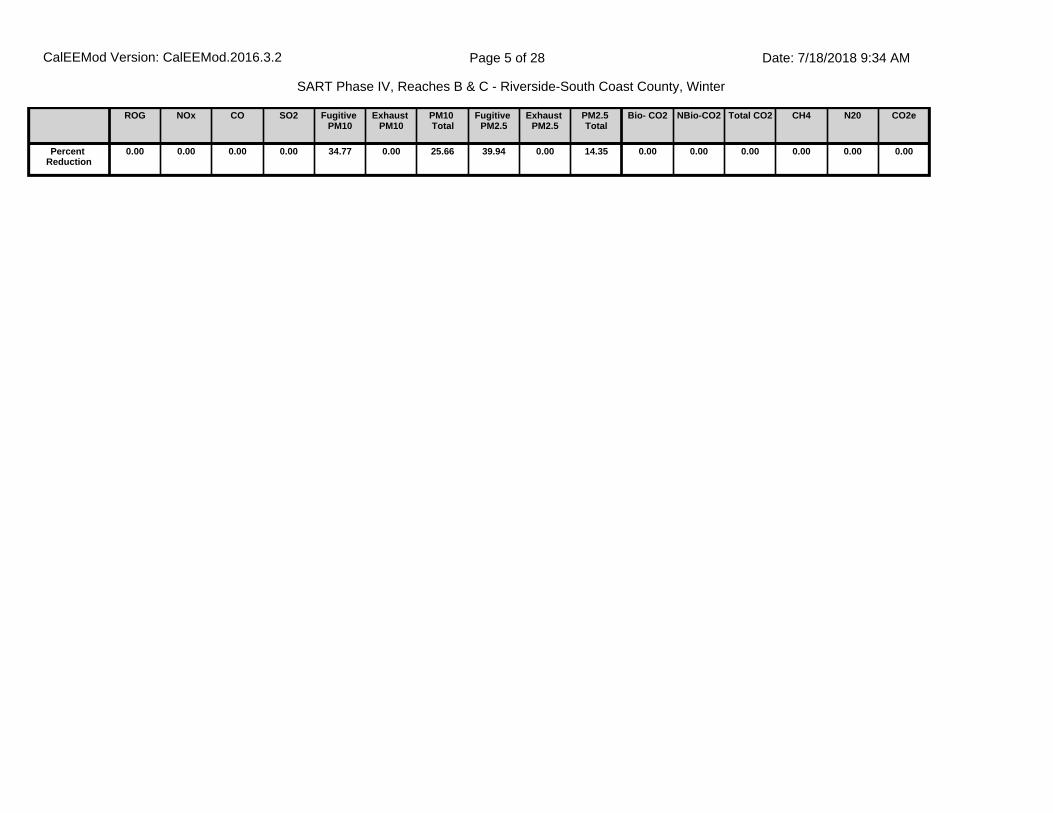
ROG NOx CO SO2 Fugitive PM10
Exhaust PM10
PM10 Total
Fugitive PM2.5
Exhaust PM2.5
PM2.5 Total
Bio- CO2 NBio-CO2 Total CO2 CH4 N20 CO2e
Percent Reduction
0.00 0.00 0.00 0.00 34.77 0.00 25.66 39.94 0.00 14.35 0.00 0.00 0.00 0.00 0.00 0.00
CalEEMod Version: CalEEMod.2016.3.2 Date: 7/18/2018 9:34 AMPage 5 of 28
SART Phase IV, Reaches B & C - Riverside-South Coast County, Winter

2.2 Overall Operational
ROG NOx CO SO2 Fugitive PM10
Exhaust PM10
PM10 Total
Fugitive PM2.5
Exhaust PM2.5
PM2.5 Total Bio- CO2 NBio- CO2 Total CO2 CH4 N2O CO2e
Category lb/day lb/day
Area 1.0803 5.0000e-005
5.9200e-003
0.0000 2.0000e-005
2.0000e-005
2.0000e-005
2.0000e-005
0.0126 0.0126 3.0000e-005
0.0135
Energy 0.0000 0.0000 0.0000 0.0000 0.0000 0.0000 0.0000 0.0000 0.0000 0.0000 0.0000 0.0000 0.0000
Mobile 0.0000 0.0000 0.0000 0.0000 0.0000 0.0000 0.0000 0.0000 0.0000 0.0000 0.0000 0.0000 0.0000 0.0000
Total 1.0803 5.0000e-005
5.9200e-003
0.0000 0.0000 2.0000e-005
2.0000e-005
0.0000 2.0000e-005
2.0000e-005
0.0126 0.0126 3.0000e-005
0.0000 0.0135
Unmitigated Operational
ROG NOx CO SO2 Fugitive PM10
Exhaust PM10
PM10 Total
Fugitive PM2.5
Exhaust PM2.5
PM2.5 Total Bio- CO2 NBio- CO2 Total CO2 CH4 N2O CO2e
Category lb/day lb/day
Area 1.0803 5.0000e-005
5.9200e-003
0.0000 2.0000e-005
2.0000e-005
2.0000e-005
2.0000e-005
0.0126 0.0126 3.0000e-005
0.0135
Energy 0.0000 0.0000 0.0000 0.0000 0.0000 0.0000 0.0000 0.0000 0.0000 0.0000 0.0000 0.0000 0.0000
Mobile 0.0000 0.0000 0.0000 0.0000 0.0000 0.0000 0.0000 0.0000 0.0000 0.0000 0.0000 0.0000 0.0000 0.0000
Total 1.0803 5.0000e-005
5.9200e-003
0.0000 0.0000 2.0000e-005
2.0000e-005
0.0000 2.0000e-005
2.0000e-005
0.0126 0.0126 3.0000e-005
0.0000 0.0135
Mitigated Operational
CalEEMod Version: CalEEMod.2016.3.2 Date: 7/18/2018 9:34 AMPage 6 of 28
SART Phase IV, Reaches B & C - Riverside-South Coast County, Winter
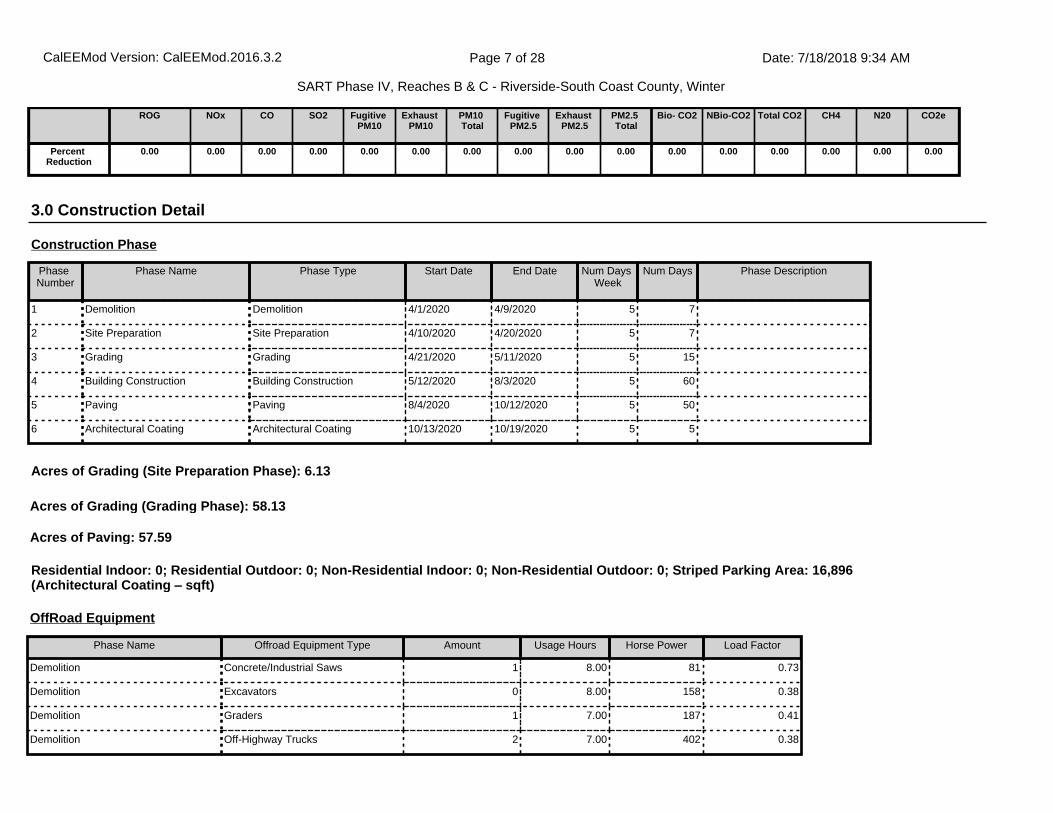
3.0 Construction Detail
Construction Phase
Phase Number
Phase Name Phase Type Start Date End Date Num Days Week
Num Days Phase Description
1 Demolition Demolition 4/1/2020 4/9/2020 5 7
2 Site Preparation Site Preparation 4/10/2020 4/20/2020 5 7
3 Grading Grading 4/21/2020 5/11/2020 5 15
4 Building Construction Building Construction 5/12/2020 8/3/2020 5 60
5 Paving Paving 8/4/2020 10/12/2020 5 50
6 Architectural Coating Architectural Coating 10/13/2020 10/19/2020 5 5
OffRoad Equipment
Phase Name Offroad Equipment Type Amount Usage Hours Horse Power Load Factor
Demolition Concrete/Industrial Saws 1 8.00 81 0.73
Demolition Excavators 0 8.00 158 0.38
Demolition Graders 1 7.00 187 0.41
Demolition Off-Highway Trucks 2 7.00 402 0.38
ROG NOx CO SO2 Fugitive PM10
Exhaust PM10
PM10 Total
Fugitive PM2.5
Exhaust PM2.5
PM2.5 Total
Bio- CO2 NBio-CO2 Total CO2 CH4 N20 CO2e
Percent Reduction
0.00 0.00 0.00 0.00 0.00 0.00 0.00 0.00 0.00 0.00 0.00 0.00 0.00 0.00 0.00 0.00
Residential Indoor: 0; Residential Outdoor: 0; Non-Residential Indoor: 0; Non-Residential Outdoor: 0; Striped Parking Area: 16,896 (Architectural Coating – sqft)
Acres of Grading (Site Preparation Phase): 6.13
Acres of Grading (Grading Phase): 58.13
Acres of Paving: 57.59
CalEEMod Version: CalEEMod.2016.3.2 Date: 7/18/2018 9:34 AMPage 7 of 28
SART Phase IV, Reaches B & C - Riverside-South Coast County, Winter

Demolition Rubber Tired Dozers 1 8.00 247 0.40
Demolition Rubber Tired Loaders 1 7.00 203 0.36
Demolition Signal Boards 3 7.00 6 0.82
Demolition Skid Steer Loaders 1 7.00 65 0.37
Demolition Tractors/Loaders/Backhoes 2 7.00 97 0.37
Site Preparation Concrete/Industrial Saws 1 7.00 81 0.73
Site Preparation Graders 2 7.00 187 0.41
Site Preparation Off-Highway Trucks 2 7.00 402 0.38
Site Preparation Rollers 2 7.00 80 0.38
Site Preparation Rubber Tired Dozers 1 8.00 247 0.40
Site Preparation Signal Boards 3 7.00 6 0.82
Site Preparation Skid Steer Loaders 1 7.00 65 0.37
Site Preparation Tractors/Loaders/Backhoes 2 8.00 97 0.37
Grading Bore/Drill Rigs 1 7.00 221 0.50
Grading Cranes 1 7.00 231 0.29
Grading Crawler Tractors 2 7.00 212 0.43
Grading Excavators 2 8.00 158 0.38
Grading Graders 2 8.00 187 0.41
Grading Off-Highway Tractors 1 7.00 124 0.44
Grading Rollers 2 7.00 80 0.38
Grading Rubber Tired Dozers 0 8.00 247 0.40
Grading Scrapers 2 8.00 367 0.48
Grading Signal Boards 3 7.00 6 0.82
Grading Skid Steer Loaders 2 7.00 65 0.37
Grading Surfacing Equipment 1 7.00 263 0.30
Grading Tractors/Loaders/Backhoes 2 8.00 97 0.37
Grading Trenchers 1 7.00 78 0.50
CalEEMod Version: CalEEMod.2016.3.2 Date: 7/18/2018 9:34 AMPage 8 of 28
SART Phase IV, Reaches B & C - Riverside-South Coast County, Winter

Building Construction Bore/Drill Rigs 1 7.00 221 0.50
Building Construction Concrete/Industrial Saws 2 7.00 81 0.73
Building Construction Cranes 1 7.00 231 0.29
Building Construction Crawler Tractors 2 7.00 212 0.43
Building Construction Excavators 2 7.00 158 0.38
Building Construction Forklifts 0 8.00 89 0.20
Building Construction Generator Sets 0 8.00 84 0.74
Building Construction Graders 2 7.00 187 0.41
Building Construction Off-Highway Tractors 1 7.00 124 0.44
Building Construction Off-Highway Trucks 1 7.00 402 0.38
Building Construction Other Construction Equipment 1 7.00 172 0.42
Building Construction Pavers 1 7.00 130 0.42
Building Construction Paving Equipment 1 7.00 132 0.36
Building Construction Rollers 1 7.00 80 0.38
Building Construction Rough Terrain Forklifts 1 7.00 100 0.40
Building Construction Scrapers 2 7.00 367 0.48
Building Construction Signal Boards 3 7.00 6 0.82
Building Construction Skid Steer Loaders 2 7.00 65 0.37
Building Construction Surfacing Equipment 1 7.00 263 0.30
Building Construction Tractors/Loaders/Backhoes 2 7.00 97 0.37
Building Construction Trenchers 1 7.00 78 0.50
Building Construction Welders 0 8.00 46 0.45
Paving Graders 1 7.00 187 0.41
Paving Off-Highway Tractors 1 7.00 124 0.44
Paving Off-Highway Trucks 2 7.00 402 0.38
Paving Pavers 1 8.00 130 0.42
Paving Paving Equipment 1 8.00 132 0.36
CalEEMod Version: CalEEMod.2016.3.2 Date: 7/18/2018 9:34 AMPage 9 of 28
SART Phase IV, Reaches B & C - Riverside-South Coast County, Winter

3.1 Mitigation Measures Construction
Use Soil Stabilizer
Replace Ground Cover
Water Exposed Area
Reduce Vehicle Speed on Unpaved Roads
Clean Paved Roads
Paving Rollers 3 8.00 80 0.38
Paving Scrapers 2 7.00 367 0.48
Paving Signal Boards 3 7.00 6 0.82
Paving Skid Steer Loaders 1 7.00 65 0.37
Paving Surfacing Equipment 1 7.00 263 0.30
Paving Tractors/Loaders/Backhoes 2 7.00 97 0.37
Architectural Coating Air Compressors 0 6.00 78 0.48
Architectural Coating Off-Highway Trucks 2 7.00 402 0.38
Architectural Coating Signal Boards 3 7.00 6 0.82
Trips and VMT
Phase Name Offroad Equipment Count
Worker Trip Number
Vendor Trip Number
Hauling Trip Number
Worker Trip Length
Vendor Trip Length
Hauling Trip Length
Worker Vehicle Class
Vendor Vehicle Class
Hauling Vehicle Class
Demolition 12 30.00 0.00 50.00 14.70 6.90 20.00 LD_Mix HDT_Mix HHDT
Site Preparation 14 35.00 0.00 19.00 14.70 6.90 20.00 LD_Mix HDT_Mix HHDT
Grading 22 55.00 0.00 19.00 14.70 6.90 20.00 LD_Mix HDT_Mix HHDT
Building Construction 28 1,054.00 0.00 0.00 14.70 6.90 20.00 LD_Mix HDT_Mix HHDT
Paving 18 45.00 0.00 0.00 14.70 6.90 20.00 LD_Mix HDT_Mix HHDT
Architectural Coating 5 211.00 0.00 0.00 14.70 6.90 20.00 LD_Mix HDT_Mix HHDT
CalEEMod Version: CalEEMod.2016.3.2 Date: 7/18/2018 9:34 AMPage 10 of 28
SART Phase IV, Reaches B & C - Riverside-South Coast County, Winter

3.2 Demolition - 2020
ROG NOx CO SO2 Fugitive PM10
Exhaust PM10
PM10 Total
Fugitive PM2.5
Exhaust PM2.5
PM2.5 Total Bio- CO2 NBio- CO2 Total CO2 CH4 N2O CO2e
Category lb/day lb/day
Fugitive Dust 1.5625 0.0000 1.5625 0.2366 0.0000 0.2366 0.0000 0.0000
Off-Road 3.9889 40.6459 23.5004 0.0582 1.7712 1.7712 1.6483 1.6483 5,580.4300
5,580.4300
1.6223 5,620.9865
Total 3.9889 40.6459 23.5004 0.0582 1.5625 1.7712 3.3337 0.2366 1.6483 1.8848 5,580.4300
5,580.4300
1.6223 5,620.9865
Unmitigated Construction On-Site
ROG NOx CO SO2 Fugitive PM10
Exhaust PM10
PM10 Total
Fugitive PM2.5
Exhaust PM2.5
PM2.5 Total Bio- CO2 NBio- CO2 Total CO2 CH4 N2O CO2e
Category lb/day lb/day
Hauling 0.0386 1.7061 0.2444 5.3000e-003
0.1250 5.4700e-003
0.1304 0.0343 5.2300e-003
0.0395 562.5413 562.5413 0.0376 563.4822
Vendor 0.0000 0.0000 0.0000 0.0000 0.0000 0.0000 0.0000 0.0000 0.0000 0.0000 0.0000 0.0000 0.0000 0.0000
Worker 0.1495 0.0934 0.9785 2.9800e-003
0.3353 2.0300e-003
0.3374 0.0889 1.8700e-003
0.0908 296.4707 296.4707 7.3600e-003
296.6548
Total 0.1882 1.7995 1.2229 8.2800e-003
0.4603 7.5000e-003
0.4678 0.1232 7.1000e-003
0.1303 859.0120 859.0120 0.0450 860.1370
Unmitigated Construction Off-Site
CalEEMod Version: CalEEMod.2016.3.2 Date: 7/18/2018 9:34 AMPage 11 of 28
SART Phase IV, Reaches B & C - Riverside-South Coast County, Winter

3.2 Demolition - 2020
ROG NOx CO SO2 Fugitive PM10
Exhaust PM10
PM10 Total
Fugitive PM2.5
Exhaust PM2.5
PM2.5 Total Bio- CO2 NBio- CO2 Total CO2 CH4 N2O CO2e
Category lb/day lb/day
Fugitive Dust 0.5977 0.0000 0.5977 0.0905 0.0000 0.0905 0.0000 0.0000
Off-Road 3.9889 40.6459 23.5004 0.0582 1.7712 1.7712 1.6483 1.6483 0.0000 5,580.4300
5,580.4300
1.6223 5,620.9865
Total 3.9889 40.6459 23.5004 0.0582 0.5977 1.7712 2.3688 0.0905 1.6483 1.7387 0.0000 5,580.4300
5,580.4300
1.6223 5,620.9865
Mitigated Construction On-Site
ROG NOx CO SO2 Fugitive PM10
Exhaust PM10
PM10 Total
Fugitive PM2.5
Exhaust PM2.5
PM2.5 Total Bio- CO2 NBio- CO2 Total CO2 CH4 N2O CO2e
Category lb/day lb/day
Hauling 0.0386 1.7061 0.2444 5.3000e-003
0.0872 5.4700e-003
0.0927 0.0250 5.2300e-003
0.0302 562.5413 562.5413 0.0376 563.4822
Vendor 0.0000 0.0000 0.0000 0.0000 0.0000 0.0000 0.0000 0.0000 0.0000 0.0000 0.0000 0.0000 0.0000 0.0000
Worker 0.1495 0.0934 0.9785 2.9800e-003
0.2187 2.0300e-003
0.2208 0.0603 1.8700e-003
0.0622 296.4707 296.4707 7.3600e-003
296.6548
Total 0.1882 1.7995 1.2229 8.2800e-003
0.3059 7.5000e-003
0.3134 0.0853 7.1000e-003
0.0924 859.0120 859.0120 0.0450 860.1370
Mitigated Construction Off-Site
CalEEMod Version: CalEEMod.2016.3.2 Date: 7/18/2018 9:34 AMPage 12 of 28
SART Phase IV, Reaches B & C - Riverside-South Coast County, Winter

3.3 Site Preparation - 2020
ROG NOx CO SO2 Fugitive PM10
Exhaust PM10
PM10 Total
Fugitive PM2.5
Exhaust PM2.5
PM2.5 Total Bio- CO2 NBio- CO2 Total CO2 CH4 N2O CO2e
Category lb/day lb/day
Fugitive Dust 6.9535 0.0000 6.9535 3.4109 0.0000 3.4109 0.0000 0.0000
Off-Road 4.4423 46.0784 27.0796 0.0632 2.0607 2.0607 1.9127 1.9127 6,059.0192
6,059.0192
1.7963 6,103.9270
Total 4.4423 46.0784 27.0796 0.0632 6.9535 2.0607 9.0142 3.4109 1.9127 5.3236 6,059.0192
6,059.0192
1.7963 6,103.9270
Unmitigated Construction On-Site
ROG NOx CO SO2 Fugitive PM10
Exhaust PM10
PM10 Total
Fugitive PM2.5
Exhaust PM2.5
PM2.5 Total Bio- CO2 NBio- CO2 Total CO2 CH4 N2O CO2e
Category lb/day lb/day
Hauling 0.0147 0.6483 0.0929 2.0100e-003
0.0475 2.0800e-003
0.0496 0.0130 1.9900e-003
0.0150 213.7657 213.7657 0.0143 214.1232
Vendor 0.0000 0.0000 0.0000 0.0000 0.0000 0.0000 0.0000 0.0000 0.0000 0.0000 0.0000 0.0000 0.0000 0.0000
Worker 0.1744 0.1090 1.1416 3.4700e-003
0.3912 2.3700e-003
0.3936 0.1038 2.1800e-003
0.1059 345.8825 345.8825 8.5900e-003
346.0973
Total 0.1891 0.7573 1.2345 5.4800e-003
0.4387 4.4500e-003
0.4432 0.1168 4.1700e-003
0.1209 559.6482 559.6482 0.0229 560.2205
Unmitigated Construction Off-Site
CalEEMod Version: CalEEMod.2016.3.2 Date: 7/18/2018 9:34 AMPage 13 of 28
SART Phase IV, Reaches B & C - Riverside-South Coast County, Winter
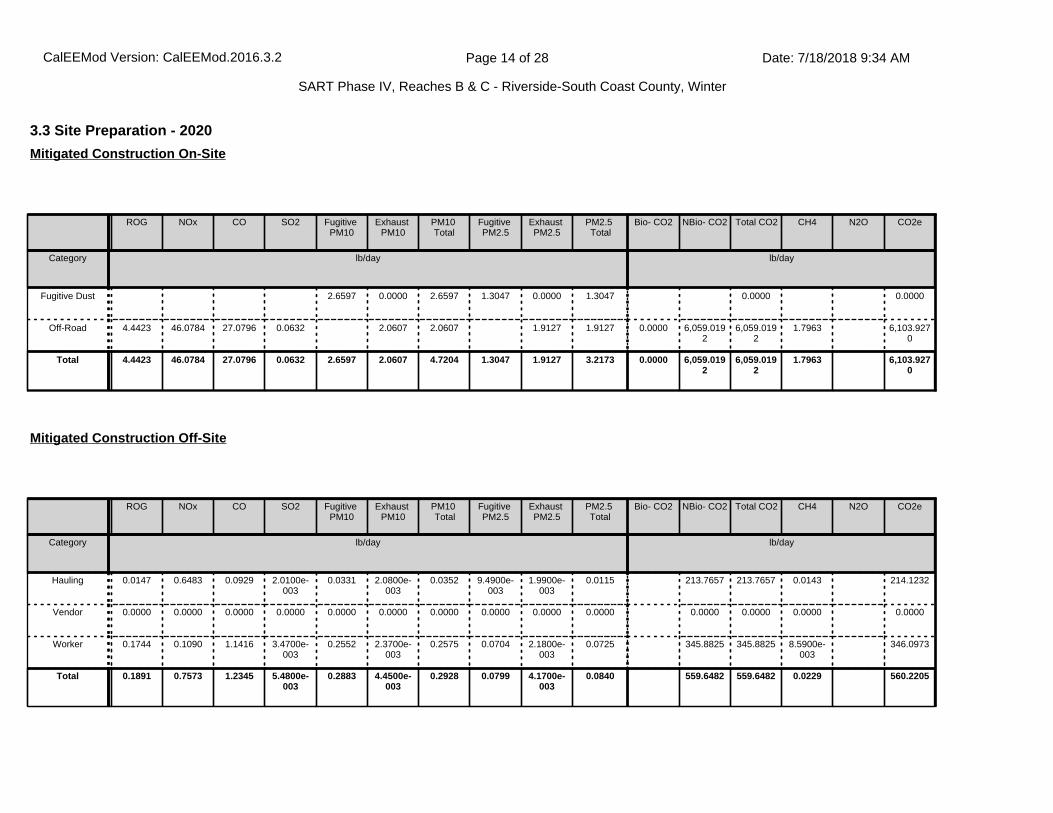
3.3 Site Preparation - 2020
ROG NOx CO SO2 Fugitive PM10
Exhaust PM10
PM10 Total
Fugitive PM2.5
Exhaust PM2.5
PM2.5 Total
Bio- CO2 NBio- CO2 Total CO2 CH4 N2O CO2e
Category lb/day lb/day
Fugitive Dust 2.6597 0.0000 2.6597 1.3047 0.0000 1.3047 0.0000 0.0000
Off-Road 4.4423 46.0784 27.0796 0.0632 2.0607 2.0607 1.9127 1.9127 0.0000 6,059.0192
6,059.0192
1.7963 6,103.9270
Total 4.4423 46.0784 27.0796 0.0632 2.6597 2.0607 4.7204 1.3047 1.9127 3.2173 0.0000 6,059.0192
6,059.0192
1.7963 6,103.9270
Mitigated Construction On-Site
ROG NOx CO SO2 Fugitive PM10
Exhaust PM10
PM10 Total
Fugitive PM2.5
Exhaust PM2.5
PM2.5 Total
Bio- CO2 NBio- CO2 Total CO2 CH4 N2O CO2e
Category lb/day lb/day
Hauling 0.0147 0.6483 0.0929 2.0100e-003
0.0331 2.0800e-003
0.0352 9.4900e-003
1.9900e-003
0.0115 213.7657 213.7657 0.0143 214.1232
Vendor 0.0000 0.0000 0.0000 0.0000 0.0000 0.0000 0.0000 0.0000 0.0000 0.0000 0.0000 0.0000 0.0000 0.0000
Worker 0.1744 0.1090 1.1416 3.4700e-003
0.2552 2.3700e-003
0.2575 0.0704 2.1800e-003
0.0725 345.8825 345.8825 8.5900e-003
346.0973
Total 0.1891 0.7573 1.2345 5.4800e-003
0.2883 4.4500e-003
0.2928 0.0799 4.1700e-003
0.0840 559.6482 559.6482 0.0229 560.2205
Mitigated Construction Off-Site
CalEEMod Version: CalEEMod.2016.3.2 Date: 7/18/2018 9:34 AMPage 14 of 28
SART Phase IV, Reaches B & C - Riverside-South Coast County, Winter

3.4 Grading - 2020
ROG NOx CO SO2 Fugitive PM10
Exhaust PM10
PM10 Total
Fugitive PM2.5
Exhaust PM2.5
PM2.5 Total
Bio- CO2 NBio- CO2 Total CO2 CH4 N2O CO2e
Category lb/day lb/day
Fugitive Dust 4.1111 0.0000 4.1111 0.4440 0.0000 0.4440 0.0000 0.0000
Off-Road 6.9263 80.4614 50.7220 0.1101 3.3931 3.3931 3.1246 3.1246 10,619.7210
10,619.7210
3.4062 10,704.8762
Total 6.9263 80.4614 50.7220 0.1101 4.1111 3.3931 7.5042 0.4440 3.1246 3.5685 10,619.7210
10,619.7210
3.4062 10,704.8762
Unmitigated Construction On-Site
ROG NOx CO SO2 Fugitive PM10
Exhaust PM10
PM10 Total
Fugitive PM2.5
Exhaust PM2.5
PM2.5 Total
Bio- CO2 NBio- CO2 Total CO2 CH4 N2O CO2e
Category lb/day lb/day
Hauling 6.8500e-003
0.3026 0.0433 9.4000e-004
0.0222 9.7000e-004
0.0231 6.0700e-003
9.3000e-004
7.0000e-003
99.7573 99.7573 6.6700e-003
99.9242
Vendor 0.0000 0.0000 0.0000 0.0000 0.0000 0.0000 0.0000 0.0000 0.0000 0.0000 0.0000 0.0000 0.0000 0.0000
Worker 0.2741 0.1712 1.7940 5.4500e-003
0.6148 3.7200e-003
0.6185 0.1630 3.4300e-003
0.1665 543.5297 543.5297 0.0135 543.8672
Total 0.2809 0.4738 1.8373 6.3900e-003
0.6369 4.6900e-003
0.6416 0.1691 4.3600e-003
0.1735 643.2870 643.2870 0.0202 643.7914
Unmitigated Construction Off-Site
CalEEMod Version: CalEEMod.2016.3.2 Date: 7/18/2018 9:34 AMPage 15 of 28
SART Phase IV, Reaches B & C - Riverside-South Coast County, Winter

3.4 Grading - 2020
ROG NOx CO SO2 Fugitive PM10
Exhaust PM10
PM10 Total
Fugitive PM2.5
Exhaust PM2.5
PM2.5 Total
Bio- CO2 NBio- CO2 Total CO2 CH4 N2O CO2e
Category lb/day lb/day
Fugitive Dust 1.5725 0.0000 1.5725 0.1698 0.0000 0.1698 0.0000 0.0000
Off-Road 6.9263 80.4614 50.7220 0.1101 3.3931 3.3931 3.1246 3.1246 0.0000 10,619.7210
10,619.7210
3.4062 10,704.8762
Total 6.9263 80.4614 50.7220 0.1101 1.5725 3.3931 4.9656 0.1698 3.1246 3.2944 0.0000 10,619.7210
10,619.7210
3.4062 10,704.8762
Mitigated Construction On-Site
ROG NOx CO SO2 Fugitive PM10
Exhaust PM10
PM10 Total
Fugitive PM2.5
Exhaust PM2.5
PM2.5 Total
Bio- CO2 NBio- CO2 Total CO2 CH4 N2O CO2e
Category lb/day lb/day
Hauling 6.8500e-003
0.3026 0.0433 9.4000e-004
0.0155 9.7000e-004
0.0164 4.4300e-003
9.3000e-004
5.3600e-003
99.7573 99.7573 6.6700e-003
99.9242
Vendor 0.0000 0.0000 0.0000 0.0000 0.0000 0.0000 0.0000 0.0000 0.0000 0.0000 0.0000 0.0000 0.0000 0.0000
Worker 0.2741 0.1712 1.7940 5.4500e-003
0.4010 3.7200e-003
0.4047 0.1106 3.4300e-003
0.1140 543.5297 543.5297 0.0135 543.8672
Total 0.2809 0.4738 1.8373 6.3900e-003
0.4164 4.6900e-003
0.4211 0.1150 4.3600e-003
0.1194 643.2870 643.2870 0.0202 643.7914
Mitigated Construction Off-Site
CalEEMod Version: CalEEMod.2016.3.2 Date: 7/18/2018 9:34 AMPage 16 of 28
SART Phase IV, Reaches B & C - Riverside-South Coast County, Winter

3.5 Building Construction - 2020
ROG NOx CO SO2 Fugitive PM10
Exhaust PM10
PM10 Total
Fugitive PM2.5
Exhaust PM2.5
PM2.5 Total
Bio- CO2 NBio- CO2 Total CO2 CH4 N2O CO2e
Category lb/day lb/day
Off-Road 8.5359 94.7272 65.5156 0.1389 4.1161 4.1161 3.8175 3.8175 13,385.2144
13,385.2144
4.0309 13,485.9865
Total 8.5359 94.7272 65.5156 0.1389 4.1161 4.1161 3.8175 3.8175 13,385.2144
13,385.2144
4.0309 13,485.9865
Unmitigated Construction On-Site
ROG NOx CO SO2 Fugitive PM10
Exhaust PM10
PM10 Total
Fugitive PM2.5
Exhaust PM2.5
PM2.5 Total
Bio- CO2 NBio- CO2 Total CO2 CH4 N2O CO2e
Category lb/day lb/day
Hauling 0.0000 0.0000 0.0000 0.0000 0.0000 0.0000 0.0000 0.0000 0.0000 0.0000 0.0000 0.0000 0.0000 0.0000
Vendor 0.0000 0.0000 0.0000 0.0000 0.0000 0.0000 0.0000 0.0000 0.0000 0.0000 0.0000 0.0000 0.0000 0.0000
Worker 5.2526 3.2815 34.3787 0.1045 11.7812 0.0713 11.8526 3.1244 0.0657 3.1901 10,416.0053
10,416.0053
0.2587 10,422.4731
Total 5.2526 3.2815 34.3787 0.1045 11.7812 0.0713 11.8526 3.1244 0.0657 3.1901 10,416.0053
10,416.0053
0.2587 10,422.4731
Unmitigated Construction Off-Site
CalEEMod Version: CalEEMod.2016.3.2 Date: 7/18/2018 9:34 AMPage 17 of 28
SART Phase IV, Reaches B & C - Riverside-South Coast County, Winter
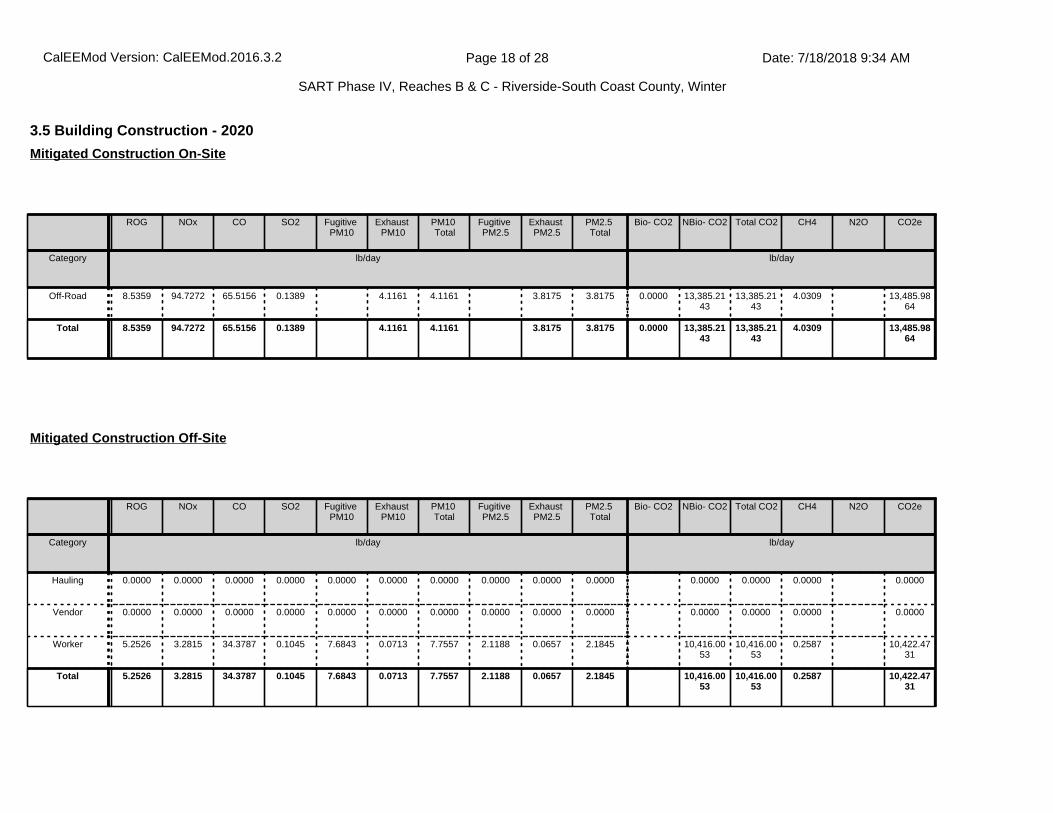
3.5 Building Construction - 2020
ROG NOx CO SO2 Fugitive PM10
Exhaust PM10
PM10 Total
Fugitive PM2.5
Exhaust PM2.5
PM2.5 Total
Bio- CO2 NBio- CO2 Total CO2 CH4 N2O CO2e
Category lb/day lb/day
Off-Road 8.5359 94.7272 65.5156 0.1389 4.1161 4.1161 3.8175 3.8175 0.0000 13,385.2143
13,385.2143
4.0309 13,485.9864
Total 8.5359 94.7272 65.5156 0.1389 4.1161 4.1161 3.8175 3.8175 0.0000 13,385.2143
13,385.2143
4.0309 13,485.9864
Mitigated Construction On-Site
ROG NOx CO SO2 Fugitive PM10
Exhaust PM10
PM10 Total
Fugitive PM2.5
Exhaust PM2.5
PM2.5 Total
Bio- CO2 NBio- CO2 Total CO2 CH4 N2O CO2e
Category lb/day lb/day
Hauling 0.0000 0.0000 0.0000 0.0000 0.0000 0.0000 0.0000 0.0000 0.0000 0.0000 0.0000 0.0000 0.0000 0.0000
Vendor 0.0000 0.0000 0.0000 0.0000 0.0000 0.0000 0.0000 0.0000 0.0000 0.0000 0.0000 0.0000 0.0000 0.0000
Worker 5.2526 3.2815 34.3787 0.1045 7.6843 0.0713 7.7557 2.1188 0.0657 2.1845 10,416.0053
10,416.0053
0.2587 10,422.4731
Total 5.2526 3.2815 34.3787 0.1045 7.6843 0.0713 7.7557 2.1188 0.0657 2.1845 10,416.0053
10,416.0053
0.2587 10,422.4731
Mitigated Construction Off-Site
CalEEMod Version: CalEEMod.2016.3.2 Date: 7/18/2018 9:34 AMPage 18 of 28
SART Phase IV, Reaches B & C - Riverside-South Coast County, Winter
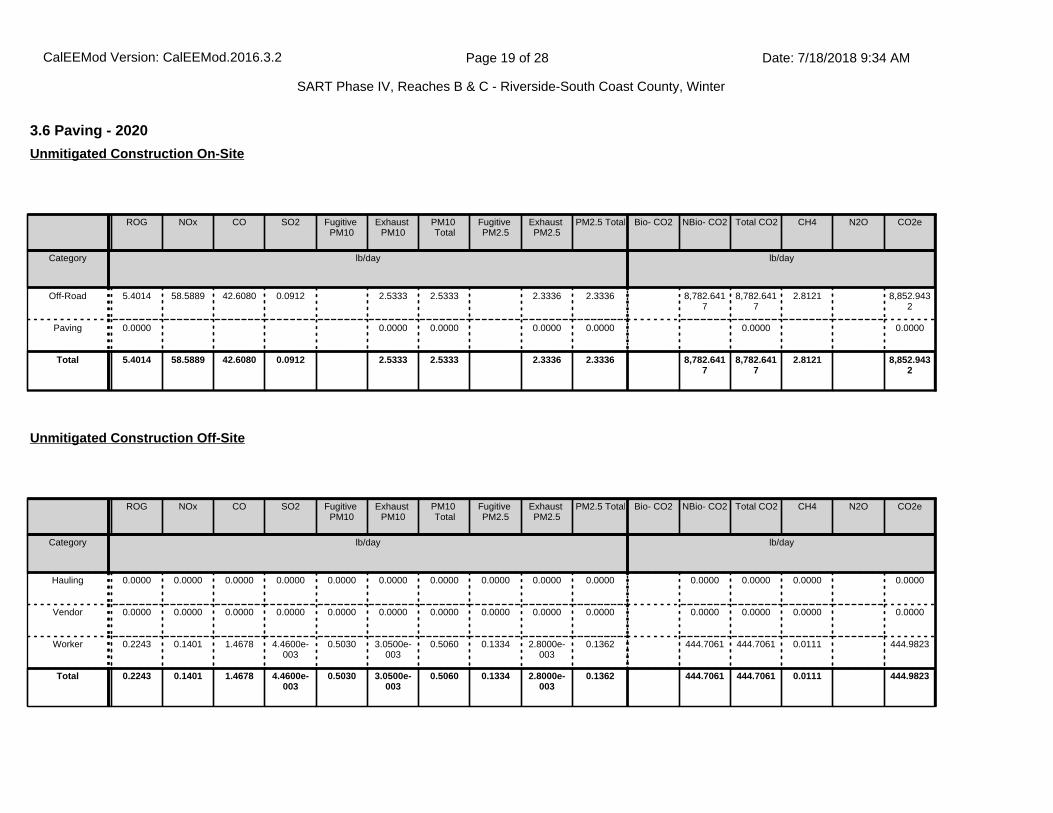
3.6 Paving - 2020
ROG NOx CO SO2 Fugitive PM10
Exhaust PM10
PM10 Total
Fugitive PM2.5
Exhaust PM2.5
PM2.5 Total Bio- CO2 NBio- CO2 Total CO2 CH4 N2O CO2e
Category lb/day lb/day
Off-Road 5.4014 58.5889 42.6080 0.0912 2.5333 2.5333 2.3336 2.3336 8,782.6417
8,782.6417
2.8121 8,852.9432
Paving 0.0000 0.0000 0.0000 0.0000 0.0000 0.0000 0.0000
Total 5.4014 58.5889 42.6080 0.0912 2.5333 2.5333 2.3336 2.3336 8,782.6417
8,782.6417
2.8121 8,852.9432
Unmitigated Construction On-Site
ROG NOx CO SO2 Fugitive PM10
Exhaust PM10
PM10 Total
Fugitive PM2.5
Exhaust PM2.5
PM2.5 Total Bio- CO2 NBio- CO2 Total CO2 CH4 N2O CO2e
Category lb/day lb/day
Hauling 0.0000 0.0000 0.0000 0.0000 0.0000 0.0000 0.0000 0.0000 0.0000 0.0000 0.0000 0.0000 0.0000 0.0000
Vendor 0.0000 0.0000 0.0000 0.0000 0.0000 0.0000 0.0000 0.0000 0.0000 0.0000 0.0000 0.0000 0.0000 0.0000
Worker 0.2243 0.1401 1.4678 4.4600e-003
0.5030 3.0500e-003
0.5060 0.1334 2.8000e-003
0.1362 444.7061 444.7061 0.0111 444.9823
Total 0.2243 0.1401 1.4678 4.4600e-003
0.5030 3.0500e-003
0.5060 0.1334 2.8000e-003
0.1362 444.7061 444.7061 0.0111 444.9823
Unmitigated Construction Off-Site
CalEEMod Version: CalEEMod.2016.3.2 Date: 7/18/2018 9:34 AMPage 19 of 28
SART Phase IV, Reaches B & C - Riverside-South Coast County, Winter

3.6 Paving - 2020
ROG NOx CO SO2 Fugitive PM10
Exhaust PM10
PM10 Total
Fugitive PM2.5
Exhaust PM2.5
PM2.5 Total Bio- CO2 NBio- CO2 Total CO2 CH4 N2O CO2e
Category lb/day lb/day
Off-Road 5.4014 58.5889 42.6080 0.0912 2.5333 2.5333 2.3336 2.3336 0.0000 8,782.6417
8,782.6417
2.8121 8,852.9431
Paving 0.0000 0.0000 0.0000 0.0000 0.0000 0.0000 0.0000
Total 5.4014 58.5889 42.6080 0.0912 2.5333 2.5333 2.3336 2.3336 0.0000 8,782.6417
8,782.6417
2.8121 8,852.9431
Mitigated Construction On-Site
ROG NOx CO SO2 Fugitive PM10
Exhaust PM10
PM10 Total
Fugitive PM2.5
Exhaust PM2.5
PM2.5 Total Bio- CO2 NBio- CO2 Total CO2 CH4 N2O CO2e
Category lb/day lb/day
Hauling 0.0000 0.0000 0.0000 0.0000 0.0000 0.0000 0.0000 0.0000 0.0000 0.0000 0.0000 0.0000 0.0000 0.0000
Vendor 0.0000 0.0000 0.0000 0.0000 0.0000 0.0000 0.0000 0.0000 0.0000 0.0000 0.0000 0.0000 0.0000 0.0000
Worker 0.2243 0.1401 1.4678 4.4600e-003
0.3281 3.0500e-003
0.3311 0.0905 2.8000e-003
0.0933 444.7061 444.7061 0.0111 444.9823
Total 0.2243 0.1401 1.4678 4.4600e-003
0.3281 3.0500e-003
0.3311 0.0905 2.8000e-003
0.0933 444.7061 444.7061 0.0111 444.9823
Mitigated Construction Off-Site
CalEEMod Version: CalEEMod.2016.3.2 Date: 7/18/2018 9:34 AMPage 20 of 28
SART Phase IV, Reaches B & C - Riverside-South Coast County, Winter

3.7 Architectural Coating - 2020
ROG NOx CO SO2 Fugitive PM10
Exhaust PM10
PM10 Total
Fugitive PM2.5
Exhaust PM2.5
PM2.5 Total Bio- CO2 NBio- CO2 Total CO2 CH4 N2O CO2e
Category lb/day lb/day
Archit. Coating 15.6626 0.0000 0.0000 0.0000 0.0000 0.0000 0.0000
Off-Road 1.3110 12.0083 7.4579 0.0249 0.4398 0.4398 0.4076 0.4076 2,367.0366
2,367.0366
0.7371 2,385.4646
Total 16.9736 12.0083 7.4579 0.0249 0.4398 0.4398 0.4076 0.4076 2,367.0366
2,367.0366
0.7371 2,385.4646
Unmitigated Construction On-Site
ROG NOx CO SO2 Fugitive PM10
Exhaust PM10
PM10 Total
Fugitive PM2.5
Exhaust PM2.5
PM2.5 Total Bio- CO2 NBio- CO2 Total CO2 CH4 N2O CO2e
Category lb/day lb/day
Hauling 0.0000 0.0000 0.0000 0.0000 0.0000 0.0000 0.0000 0.0000 0.0000 0.0000 0.0000 0.0000 0.0000 0.0000
Vendor 0.0000 0.0000 0.0000 0.0000 0.0000 0.0000 0.0000 0.0000 0.0000 0.0000 0.0000 0.0000 0.0000 0.0000
Worker 1.0515 0.6569 6.8823 0.0209 2.3585 0.0143 2.3728 0.6255 0.0132 0.6386 2,085.1775
2,085.1775
0.0518 2,086.4723
Total 1.0515 0.6569 6.8823 0.0209 2.3585 0.0143 2.3728 0.6255 0.0132 0.6386 2,085.1775
2,085.1775
0.0518 2,086.4723
Unmitigated Construction Off-Site
CalEEMod Version: CalEEMod.2016.3.2 Date: 7/18/2018 9:34 AMPage 21 of 28
SART Phase IV, Reaches B & C - Riverside-South Coast County, Winter

4.0 Operational Detail - Mobile
3.7 Architectural Coating - 2020
ROG NOx CO SO2 Fugitive PM10
Exhaust PM10
PM10 Total
Fugitive PM2.5
Exhaust PM2.5
PM2.5 Total Bio- CO2 NBio- CO2 Total CO2 CH4 N2O CO2e
Category lb/day lb/day
Archit. Coating 15.6626 0.0000 0.0000 0.0000 0.0000 0.0000 0.0000
Off-Road 1.3110 12.0083 7.4579 0.0249 0.4398 0.4398 0.4076 0.4076 0.0000 2,367.0366
2,367.0366
0.7371 2,385.4646
Total 16.9736 12.0083 7.4579 0.0249 0.4398 0.4398 0.4076 0.4076 0.0000 2,367.0366
2,367.0366
0.7371 2,385.4646
Mitigated Construction On-Site
ROG NOx CO SO2 Fugitive PM10
Exhaust PM10
PM10 Total
Fugitive PM2.5
Exhaust PM2.5
PM2.5 Total Bio- CO2 NBio- CO2 Total CO2 CH4 N2O CO2e
Category lb/day lb/day
Hauling 0.0000 0.0000 0.0000 0.0000 0.0000 0.0000 0.0000 0.0000 0.0000 0.0000 0.0000 0.0000 0.0000 0.0000
Vendor 0.0000 0.0000 0.0000 0.0000 0.0000 0.0000 0.0000 0.0000 0.0000 0.0000 0.0000 0.0000 0.0000 0.0000
Worker 1.0515 0.6569 6.8823 0.0209 1.5383 0.0143 1.5526 0.4242 0.0132 0.4373 2,085.1775
2,085.1775
0.0518 2,086.4723
Total 1.0515 0.6569 6.8823 0.0209 1.5383 0.0143 1.5526 0.4242 0.0132 0.4373 2,085.1775
2,085.1775
0.0518 2,086.4723
Mitigated Construction Off-Site
CalEEMod Version: CalEEMod.2016.3.2 Date: 7/18/2018 9:34 AMPage 22 of 28
SART Phase IV, Reaches B & C - Riverside-South Coast County, Winter

ROG NOx CO SO2 Fugitive PM10
Exhaust PM10
PM10 Total
Fugitive PM2.5
Exhaust PM2.5
PM2.5 Total Bio- CO2 NBio- CO2 Total CO2 CH4 N2O CO2e
Category lb/day lb/day
Mitigated 0.0000 0.0000 0.0000 0.0000 0.0000 0.0000 0.0000 0.0000 0.0000 0.0000 0.0000 0.0000 0.0000 0.0000
Unmitigated 0.0000 0.0000 0.0000 0.0000 0.0000 0.0000 0.0000 0.0000 0.0000 0.0000 0.0000 0.0000 0.0000 0.0000
4.1 Mitigation Measures Mobile
4.2 Trip Summary Information
4.3 Trip Type Information
Average Daily Trip Rate Unmitigated Mitigated
Land Use Weekday Saturday Sunday Annual VMT Annual VMT
Other Non-Asphalt Surfaces 0.00 0.00 0.00
Total 0.00 0.00 0.00
Miles Trip % Trip Purpose %
Land Use H-W or C-W H-S or C-C H-O or C-NW H-W or C-W H-S or C-C H-O or C-NW Primary Diverted Pass-by
Other Non-Asphalt Surfaces 16.60 8.40 6.90 0.00 0.00 0.00 0 0 0
4.4 Fleet Mix
Land Use LDA LDT1 LDT2 MDV LHD1 LHD2 MHD HHD OBUS UBUS MCY SBUS MH
Other Non-Asphalt Surfaces 0.538064 0.038449 0.184390 0.122109 0.017402 0.005339 0.017250 0.067711 0.001365 0.001213 0.004629 0.000959 0.001120
CalEEMod Version: CalEEMod.2016.3.2 Date: 7/18/2018 9:34 AMPage 23 of 28
SART Phase IV, Reaches B & C - Riverside-South Coast County, Winter
5.0 Energy Detail
ROG NOx CO SO2 Fugitive PM10
Exhaust PM10
PM10 Total
Fugitive PM2.5
Exhaust PM2.5
PM2.5 Total Bio- CO2 NBio- CO2 Total CO2 CH4 N2O CO2e
Category lb/day lb/day
NaturalGas Mitigated
0.0000 0.0000 0.0000 0.0000 0.0000 0.0000 0.0000 0.0000 0.0000 0.0000 0.0000 0.0000 0.0000
NaturalGas Unmitigated
0.0000 0.0000 0.0000 0.0000 0.0000 0.0000 0.0000 0.0000 0.0000 0.0000 0.0000 0.0000 0.0000
5.1 Mitigation Measures Energy
Historical Energy Use: N
CalEEMod Version: CalEEMod.2016.3.2 Date: 7/18/2018 9:34 AMPage 24 of 28
SART Phase IV, Reaches B & C - Riverside-South Coast County, Winter

6.1 Mitigation Measures Area
6.0 Area Detail
5.2 Energy by Land Use - NaturalGas
NaturalGas Use
ROG NOx CO SO2 Fugitive PM10
Exhaust PM10
PM10 Total
Fugitive PM2.5
Exhaust PM2.5
PM2.5 Total Bio- CO2 NBio- CO2 Total CO2 CH4 N2O CO2e
Land Use kBTU/yr lb/day lb/day
Other Non-Asphalt Surfaces
0 0.0000 0.0000 0.0000 0.0000 0.0000 0.0000 0.0000 0.0000 0.0000 0.0000 0.0000 0.0000 0.0000
Total 0.0000 0.0000 0.0000 0.0000 0.0000 0.0000 0.0000 0.0000 0.0000 0.0000 0.0000 0.0000 0.0000
Unmitigated
NaturalGas Use
ROG NOx CO SO2 Fugitive PM10
Exhaust PM10
PM10 Total
Fugitive PM2.5
Exhaust PM2.5
PM2.5 Total Bio- CO2 NBio- CO2 Total CO2 CH4 N2O CO2e
Land Use kBTU/yr lb/day lb/day
Other Non-Asphalt Surfaces
0 0.0000 0.0000 0.0000 0.0000 0.0000 0.0000 0.0000 0.0000 0.0000 0.0000 0.0000 0.0000 0.0000
Total 0.0000 0.0000 0.0000 0.0000 0.0000 0.0000 0.0000 0.0000 0.0000 0.0000 0.0000 0.0000 0.0000
Mitigated
CalEEMod Version: CalEEMod.2016.3.2 Date: 7/18/2018 9:34 AMPage 25 of 28
SART Phase IV, Reaches B & C - Riverside-South Coast County, Winter

ROG NOx CO SO2 Fugitive PM10
Exhaust PM10
PM10 Total
Fugitive PM2.5
Exhaust PM2.5
PM2.5 Total Bio- CO2 NBio- CO2 Total CO2 CH4 N2O CO2e
Category lb/day lb/day
Mitigated 1.0803 5.0000e-005
5.9200e-003
0.0000 2.0000e-005
2.0000e-005
2.0000e-005
2.0000e-005
0.0126 0.0126 3.0000e-005
0.0135
Unmitigated 1.0803 5.0000e-005
5.9200e-003
0.0000 2.0000e-005
2.0000e-005
2.0000e-005
2.0000e-005
0.0126 0.0126 3.0000e-005
0.0135
6.2 Area by SubCategory
ROG NOx CO SO2 Fugitive PM10
Exhaust PM10
PM10 Total
Fugitive PM2.5
Exhaust PM2.5
PM2.5 Total Bio- CO2 NBio- CO2 Total CO2 CH4 N2O CO2e
SubCategory lb/day lb/day
Architectural Coating
0.1911 0.0000 0.0000 0.0000 0.0000 0.0000 0.0000
Consumer Products
0.8886 0.0000 0.0000 0.0000 0.0000 0.0000 0.0000
Landscaping 5.6000e-004
5.0000e-005
5.9200e-003
0.0000 2.0000e-005
2.0000e-005
2.0000e-005
2.0000e-005
0.0126 0.0126 3.0000e-005
0.0135
Total 1.0803 5.0000e-005
5.9200e-003
0.0000 2.0000e-005
2.0000e-005
2.0000e-005
2.0000e-005
0.0126 0.0126 3.0000e-005
0.0135
Unmitigated
CalEEMod Version: CalEEMod.2016.3.2 Date: 7/18/2018 9:34 AMPage 26 of 28
SART Phase IV, Reaches B & C - Riverside-South Coast County, Winter

8.1 Mitigation Measures Waste
7.1 Mitigation Measures Water
7.0 Water Detail
8.0 Waste Detail
6.2 Area by SubCategory
ROG NOx CO SO2 Fugitive PM10
Exhaust PM10
PM10 Total
Fugitive PM2.5
Exhaust PM2.5
PM2.5 Total Bio- CO2 NBio- CO2 Total CO2 CH4 N2O CO2e
SubCategory lb/day lb/day
Architectural Coating
0.1911 0.0000 0.0000 0.0000 0.0000 0.0000 0.0000
Consumer Products
0.8886 0.0000 0.0000 0.0000 0.0000 0.0000 0.0000
Landscaping 5.6000e-004
5.0000e-005
5.9200e-003
0.0000 2.0000e-005
2.0000e-005
2.0000e-005
2.0000e-005
0.0126 0.0126 3.0000e-005
0.0135
Total 1.0803 5.0000e-005
5.9200e-003
0.0000 2.0000e-005
2.0000e-005
2.0000e-005
2.0000e-005
0.0126 0.0126 3.0000e-005
0.0135
Mitigated
9.0 Operational Offroad
Equipment Type Number Hours/Day Days/Year Horse Power Load Factor Fuel Type
10.0 Stationary Equipment
Fire Pumps and Emergency Generators
CalEEMod Version: CalEEMod.2016.3.2 Date: 7/18/2018 9:34 AMPage 27 of 28
SART Phase IV, Reaches B & C - Riverside-South Coast County, Winter

11.0 Vegetation
Equipment Type Number Hours/Day Hours/Year Horse Power Load Factor Fuel Type
Boilers
Equipment Type Number Heat Input/Day Heat Input/Year Boiler Rating Fuel Type
User Defined Equipment
Equipment Type Number
CalEEMod Version: CalEEMod.2016.3.2 Date: 7/18/2018 9:34 AMPage 28 of 28
SART Phase IV, Reaches B & C - Riverside-South Coast County, Winter