
SARAWAK GENERAL HOSPITAL MAIN BLOCK BUILDING … General Hospital main block... · SARAWAK GENERAL...
24
SARAWAK GENERAL HOSPITAL MAIN BLOCK BUILDING RETROFIT FEATURES FOR ENERGY EFFICIENCY Muhammad Syukri Imran Master of Engineering (Civil) 2011
Transcript of SARAWAK GENERAL HOSPITAL MAIN BLOCK BUILDING … General Hospital main block... · SARAWAK GENERAL...
SARAWAK GENERAL HOSPITAL MAIN BLOCK BUILDING RETROFIT FEATURES FOR ENERGY EFFICIENCY
Muhammad Syukri Imran
Master of Engineering (Civil) 2011
Pu at Kbidrruu M roat A kadfmik (JNJVtftSlll MALAV. f4 R W. J(
P.KHIDMAT MAKLUMAT AKADEMIK
1IIIIIIIIIIi'li~ 111111111 1000246282
SARAWAK GENERAL HOSPITAL MAIN BLOCK BUILDING RETROFIT FEATURES FOR ENERGY
EFFICIENCY
MUHAMMADS~IMRAN
A dissertation submitted in partial fulfillment of the requirements for the degree Master of Engineering (Civil)
Faculty of Engineering UNIVERSITI MALAYSIA SARA W AK
2011
"
DEC LARA TION
I would like to declare that this dissertation is my original writing, except the data, the notes
and fact that already stated with its sources and origins.
MD SYUKRI IMRAN
800102-13-5607
11
\
\
Jor my 6e{oved wife, daugfiter andson
;'
iii
I

ACKNOWLEDGEMENT
In the name of ALLAH the Most Gracious and Most Merciful
All praise belongs only to ALLAH and peace be upon our Prophet Muhammad S.A.W.
I take this opportunity to express my sincere gratitude to my supervisor Assoc. Prof. Dr
Azhaili Baharun for his momentous support and guidance for me to complete this project.
Not forgetting also to Dr Siti Halipah who was kind enough to give meaningful comments to
this writing.
I should like to thank the Director of Sarawak General Hospital and Clinical Research Centre
for being very kind to allow me access to conduct my study in the hospital. Thanks also to
Faber Mediserve Sdn Bhd Engineering Facility Manager and his maintenance engineers for
their invaluable support during my numerous visits and surveys to the hospital. Further
thanks to Jabatan Kerja Raya Sarawak for providing me with the architectural drawings
which was most needed to complete the computer simulations.
Last but not least my admiration to both my parents, beloved wife Siti Nor Fazilahwati,
beautiful daughter Siti Zulaikha as well as my new born son Umar Meshaal whom I cherish
most for their immeasurable support as well as inspiration that they have given me.
IV
ABSTRACT
[ The purpose of this study is to evaluate the energy use of the Sarawak General Hospital main
medical block building and to propose a low energy measures that would satisfy the
Malaysian Energy Standard MSl525 solar heat gain through building envelope (OTTV)
maximum recommended value of 50W/m2• Cooling and lighting alone constitute about 56%
of energy use in the building which if energy efficiency strategies were applied to could
produce a significant energy savings. A few measures were considered which included
double low e glazing, shading devices such as overhangs and fins and high reflective
coatings. The potential and limitation of the measures on the cooling load of the building
were assessed with the use of building energy program Energy PIUS) Analysis of the indoor
temperature sensitivity to material input uncertainty was also included in this study as part of
the program validation. Day lighting control influence on the energy consumption was also
evaluated here. Investment criteria such as Life Cycle Cost and Simple Payback Method
were used to evaluate the benefits of continuing savings to end of the life of the retrofits
proposed.
v
ABSTRAK
Kajian ini diadakan bertujuan untuk menilai penggunaan tenaga elektrik di blok utama
Hospital Umum Sarawak dan mencadangkan langkah-Iangkah penjimatan tenaga yang boleh
memenuhi syarat MS 1525 iaitu bagi mencapai nilai Overall Thermal Transfer Value
(OTTV) tidak melebihi 50 W/m2 . Pencahayaan dan hawa dingin sahaja menggunakan
sekitar 56% tenaga dalam bangunan. Langkah-Iangkah penjimatan tenaga jika dilaksanakan
pada dua jenis penggunaan tenaga ini dapat menghasilkan penjimatan yang ketara. Beberapa
langkah yang telah dipertimbangkan termasuk kaca berkembar (double lowe glazing),
overhangs dan fins serta lapisan reflective coatings. Potensi dan had setiap langkah yang
dicadangkan akan dinilai menggunakan program komputer, Energy Plus. Pengesahan
program Energy Plus turut dilaksanakan di dalam kajian ini tennasuklah analisa sensitiviti.
Di samping itu kesan kawalan pencahayaan siang hari ke atas penjimatan tenaga turut dikaji.
Kriteria pelaburan seperti kos kitar hayat dan kaedah bayar balik digunakan di dalam kajian
ini bagi menilai faedah penjimatan yang dihasilkan oleh strategi yang telah dicadangkan.
VI
1
Pusat Khidmat MakJum:,u ad mt . UNlVERSm A L\ ARAW K
TABLE OF CONTENT
ACKNOWLEDGEMENT................................................................................................................................. IV
ABSTRACT.....•••........•..........•.....................•......•....•..••........•.....•...•..........•.........•........•........................•..........•... V
LIST OF TABLES ............................................................................................................................................. IX
LIST OF FIGURES ............................................................................................................................................. X
CHAPTER 1 INTRODUCTION ......................................................................................................................... 1
1.0 GENERAL ... ... .... .. .. .............. ........ .... ...... ... ... .. •.... ......... .... ......... .......... ........ .... ......... ... ......... ... ....... ... ... ... I
1.1 OBJECTIVES .... ........ .. .... ................ ... .. ....... ... ....... ..... .•. .. ...... ........... ......... ......... ....... .... ... ....... ..... ......... ... 3
1.2 SCOPE .. ....... ... .. .. ...... ...... ....... ... .•............... ..... .. ...... ..... ........ ..... ...... ... ...•. .......... ........ ...... .. ...•. ...... .. .. ..... .. 3
CHAPTER 2 LITERATURE REVIEW ............................................................................................................. 4
2.0 GENERAL ... ... ... .... ........ ...... ....... .............. ... ....... .... ... .... .... ... ... .... ........ ..... ....... ... ..... ... .... .... .... ... ........ .. .... 4
2. 1 ENERGY USAGE PAlTERN IN HEALTHCARE BUILDING .... ..... ....... .... ............... ... ... ....... ................. ....... .. 5
2.2 FACTORS AFFECTING ENERGY USAGE - THE ARCHITECTURAL ApPROACH .. .•. ...... .... .... ... .. ......... ... ....... 7
2.3 SIMULATION OF ENERGY EFFICIENT RETROFITS .. .. ........ ..... ....... ..•....... ..... ....... ........ .... ......... ... .. .. .... .... 16
2.4 FINITE DIFFERENCE SOLUTION FOR HEAT EQUATION ...... ... .. .......... .. ....... ........... .... ........ ........... .......... 21
CHAPTER 3 METHODOLOGY ...................................................................................................................... 29
3.0 ENERGY AUDIT TO UNDERSTAND ENERGY USAGE PAlTERN..... .. ..... ... ....... ............ ........... ...... ...... .. .... 29
3.0.1 General. ... .. ..... ..... .. ..... ... ........ ... ... ...... ... ... ......... .......... ....... .... ........... ................ .. ............ .. .............. 29
3.0.2 Procedure O/Conducting Survey ... ..... .... ... ..... ........... .... .. ... ...... ....... .. ......... ... ............. ............. ..... 30
3.0.3 Measuring Instrument .. .. ........ ...... .. ... ......... ........... ........ ........ ... ..... ........ ..... ........ .. .... ... .... ...... ........ 32
3.0.4 Asset Survey ....... .. ........ .. ......... .... ..... ... ... .. .... .. .......... ... .... ...... ............ .. ....... .......... .... .. ...... ... ..... ...... 34
3.0.5 Architectural Survey ....... ........ .. ................. .. ...... ...... ..... .. ........ .. ... ........ ............ ... ....:.. ... ... ... ... .. ...... 36
vii
I ,..
3.0.6 HVAC Survey .............. ........ .. .. ... .... ....... ..... ....... ..... ..... ..... .. ... ... .... ......... ........ ........ ... ...... ..... ...... ..... 39
3.0.7 Lighting Survey ... ........ .... ....... ........ ... ........ ... ..... ................. .. ......... ....... .... ...... ........... ......... .. ....... .. 41
3.0.8 Plant Visit .... .... ......... ... ....... ................ ... ... ............... ...... ...... .. ............ ... ... ............ ........ ...... ... ......... 42
3.0.9 Energy Audit Survey Result ... ... .. .............. .... .. ........ ........... ... .. ............. ... ...... ... .... .... ....... .. ..... .... .... 44
3.1 PROGRAM VALIDATION .. . ... . ........ . .... .... . ........ ... .. ....... .... .... . .. ....... .... .... . .. ..... . .. ....... .. ... ... .... ..... . .... . ...... . 46
3.1.1 General....... .... ............ ......... ....... ........ ........... ........ ..... ........ .. ... ... ....... ..... ... ... .... ...... ...... ....... .... ....... 46
3.1.2 Introduction ..... ..... ......... .............. ..... ...... ..... ....... ..... ... .............. ........ ..... ... ....... ... ..... ......... ..... ... ... ... 48
3.1.3 Description ofData Sets .......... ...... ..... ... .. ....... ....... ..... ...... ... .... ... ...... .. ...... ......... .. .... ... ........ ... .. ..... .. 50
3.1.4 Test Building Data Collection .... ........ .... .... .. ...... ...... ... ...... .... .. .. .......... .. .. .... .. ....... .. .. ..... .... .... .... .. ,.. 53
3.1.5 Monte Carlo Analysis ..... .... .... .... ...... ...... ...... ... ...... ...... ...... .......... ... ...... ..... ...... ... ... .... ...... ........ ... .... 55
3.1.6 Comparison ofTest Building and Predicted Values .. ...... ...... .. ............. ....... ......... ........ ..... ...... ...... . 57
3.1.7 Building Utility Performance .. .... .... ...... ... .... ... ........ .. ........ .... .......... .... .... .... .. .. ... .... ......... .... ........... 58
3.1.8 Validation Conclusion ... ..... .... ..... ..... ... ..... .... ....... ..... .... .. ..... .. ... ...... .... .. ........ .... ...... .. .. ........ ........... . 59
3.2 MODEL DEVELOPM ENT .. .. .. .. ............. ........ .. ........ . ........ ...... .......... .................. .... ...... ... .. . .... .. ........ ........ 60
3.2.1 Modeling Input ............. .. ......... .. ..... ........... ...... .. ...... .. .. ......... ..... ........... .. ........ ..... ... .. .. ...... ... ..... .. ... 60
3.2.2 Sensitivity Analysis .... ...... ........ ... ....... ...... .... ........ ... ... .... , ..... .... .... ........ ............ ..... ..... .. ..... .... .. .... ... 63
CHAPTER 4 RESULT ....................................................................................................................................... 71
4.0 GENERAL ..... .. ........ ...... ........... ... .. ........ . .. ... ... ........ ... ...... .. .... ..... ......... .... .. ........ .... .. ...................... . ....... 71
4.1 ENERGY IMPACT OF RETROFITS MEASURES ............ .... ..... ...... .... .. ...... .. .... ............. .. ........ .. ................. .. 72
4 .2 JUSTIFICATION OF RETROFIITING Low ENERGY MEASURES .. ....... .. .... .. ........ .... .. .. .. .. ...... ...... .......... .... 79
4.3 THERMAL COMFORT EVALUATION .......... .... .................. .. ..... .. . ........ .. ..... . .......... . .. . ........ .. ... .. .. ....... . ..... 82
CHAPTER 5 SUMMARY AND CONCLUSION ......................... : .................................................................. 83
REFERENCES ................................................................................................................................................... 85
APPENDIX.......................................................................................................................................................... 90
Vlll
I
I'
List of Tables
Table 1: Other building energy analysis simulation programs participated in the comparison (U.S. Department
ofEnergy, 2004) ... ........... .......... .. ........ ... ... ... .... ........ .... ........... ... .......... .. ....... .. ....... .. .... ....... ..... ......... ..... ....... ...... . 20
Table 2: Modelformulations which use finite differences solution techniques . .. .......... .. .. ....... ... ... ...... ... ........ ... .. 23
Table 3: Model dimension ..... ... ... ....... ..... ........ ...... ....... .... ... .. ... ........ ... .. ......... ..... ..... .. ..... ... .......... ..... ....... .... .. ...... 51
Table 4: Building envelope material detail ...... .. ............ ...... ...... .. ..... .. .... ... ... ....... ..... ....... ........ .. ..... .... ....... .... .. ... .. 52
Table 5: Internal load density ........ ... ........... ..... ...... ........ ... ... ...... ............ ... ..... ...... ...... ...... ... .. .. ....... ...... ....... ...... ... 53
Table 6: List oftemp probes connected to data logger ..... ...... ..... ........... .. ........ ....... .. ......... ......... ... .. ..... ....... ... ..... 54
Table 7: Uncertainty in the predicted maximum temperature .. .... .. ...... ... .... ..... ... ......... ............ .. ...... ............... ..... 56
Table 8: Energy consumption comparison .. .. ... ........ ... ....... .... ........ .... ... ..... .. ..... ....... ...... ........ ...... ................. ....... 58
Table 9: Model parameter .... .. ... .............. .......... ..... ........ ... ..... ....... .. ............ ... .... ........ .... .... .... ... ....... ... .. .. ... .......... 60
Table /0: Building envelope description ... ..... ........ .... ........ ......... .... ....... ... .. .... .... ....... .... .. ...... ....... ....... ...... ...... .... 61
Table J J : Fenestration.. .. ......... ...... ... .. ..... .......... ...... ....... ..... ......... ... ..... ..... ..... ...... ..... ........... ..... ........... ..... .... .... ... 61
Table 12: Summary ofmodel input references ... .... ...... ..... ...... ..... ...... ...... ....... ... ..... ... ......... ... .. .. .......... ......... ... ... . 61
Table J3: Climatic data summary .... .. ... ..... .. ... .... .. .... ........ ....... .... .. .... ........ ............. .. ...... .. .. .. ...... ..... ... ..... .. .......... . 62
Table 14: Comparison between simulation energy use data and recorded energy use data ..... ........ ....... ... .... ..... 63
Table 15: Comparison between simulation maximum zone temperature and recorded maximum temperature .. 63
Table 16: Building envelope performance .... ... ....... .. ... .. ... .... .. ... .... .. ... ......... ... ..... .. .... .... ... ...... .. .. .......... ....... ....... .. 77
Table 17: OTTV & RTTV comparison for different order ofidentical series .... ...... ..... ..... ... ............ .. ........... ... ... 78
Table J8: Net present value with LCCfor several low energy meas'ures . .. .... ..... .... .... ....... ...... .... ...... ......... .. ...... 80
Table 19: Simple payback cost analysis for several low energy options ... ........ ... .... ... ..... ..... ... .... ............ .. ..... ..... 81
Table 20: Thermal comfort condition after implementation oflow energy measures ... ........ .. ... ....... ... .... ..... .... ... 82
IX
,..
List of Figures
Figure I: Electrical consumption breakdown ( Saidur et al. 2010) ... .......... ..... ..... .... ..... .......... ... ..... .... .. .. .. ........... 7
Figure 2: Electricity savingsfor both skin load dominated building (left hand side) and internal load dominated
building. cited from (Radhi. 2009) ... ......... ..... .... ....... ........... ..... ..... .... ....... .......... .. ........ ....... .......... .. .. ........ ........ .. .. 8
Figure 3: Relationship between shading coefficient and light transmission (top) as well as relative heat gain
(bottom) (Mohsen. 2006) ...... ....... .... .... .. .... ....... ..... ..... ....... ...... ... ... .... ....... ........ ... ..... ... ......... ........... ... ... ............ ... 10
Figure 4: Comparison between annual heating. cooling. lighting and total energy demandfor the base case with
passive and active lighting control and the studied roller shade case with the selected transmittance and control.
(Alhanassios & Andreas. 2007) ..... .. .. .. ..... ... ...... ... ......... ...... .. .. ........ .. ................ ............ .. ........ .... .. ...... ... ... .. ..... .... 11
Figure 5: Correlations between day lighting. electric lighting and thermal performance indices taking into
account the impact ofautomatic shading and lighting contro!.. .... ...... .. .. ........ .... .... .......... .. ..... .. .. .. ............ .......... 12
Figure 6: The impact ofdaylight is included in the thermal calculations. (Athanassios & Andreas. 2007)..... ... 12
Figure 7: Time lag and decrement for heavy and light construction as well as effect of mass with ventilation
(right) (Baker. 1987) .. .... ........ .... .... ...... .. ... .... ......... ... ..... ....... ... .. .... ....... ... ........ ....... .. ...... ... .... ....... ..... ... .. ......... ..... 13
Figure 8: Thermal resistance (per 5 cm thickness) of common building insulation materials (Concrete block is
added in thejigure as a reference for comparison purposes). (AI-Homoud. 2005) .. .. ............. ............ .. .. ..... ... .... 14
Figure 9: Wall and roofinsulation placement method (AI-Homoud. 2005) ....... ..... ......... .... ......... ... ..... ...... .... ... .. 15
Figure 10: BESTEST comparison of energy plus and other simulation programs (U.s. Department ofEnergy.
2004) ... .. .. ............................ ...... .............. ... ........ .... ............. ........... .... .... ... .... ............ ................. .... ....... ... ... ....... ... 19
Figure 11: Energy plus program schematic (US Department ofEnergy. 2010) .. ............... .. .. .. ... ...... ... .......... .. ... 23
Figure 12: FOIWard difference. backward difference and central difference method for approximating the
solutions to differential equations ......... ..... ........ ...... .. ........... .. ......... ...... ....... ..... ....... .... ... .... .. ...... ............... .... .... .. 28
Figure 13: Energy audit procedure flowchart .. ............. ..... ..... .... ..... ....... .. .. .... .. .. .... ............. .... ...... ....... ............... 31
Figure 14: Energy Audit measuring equipment ....... ........ ........ .. ....... .... ........... .. .. ............... .. ... .......... ............ ... .. .. 33
Figure 15: Ministry OfHealth Malaysia on line asset register .... .. ... .... ........ ... ......... ... ... .... ... ... .... ........ ........... .... 35
Figure 16: Architectural drawing ofmain block ......... .... .. ... ..... ..... ......... ... ..... .. ... .. ................ .. .......... .... .... .... .... . 37
x
-
Figure 17: Snapshots ofbuilding architecturalfeatures during walk through ................... ..... ... .......................... 38
Figure 18: Air conditioning schedules ........ .. ................ ............ .... ... .. ................. ....... ............................ ... ............ 40
Figure 19: Lighting survey form .. .............................................. .. .. ......................................................... .......... .... 41
Figure 20: Plant room visit ............ .......... .......................... ... ................. ... ....... ..... .... ...... .................. .... ............... 43
Figure 21: Final end load uses ..... .............. .......... ..................... ....... ... ... ..................... ..... .. ...... .. .. .................... .. .. 45
Figure 22: Building Layout Plan ......... .... ... .. .................... ............ .................... ......... ..................... ...................... 51
Figure 23: Isometric view ofEP model .............. ................ ......... .... .... .......................... .. .................................... . 51
Figure 24: Data logger (32 channel capacity) ............... ...................................................................................... 53
Figure 25: Thermocouple probe .............. ... .. ......................................................................................................... 53
Figure 26: Data logger with thermocouple probe layout .. .......... .... ....... .. .. ...... ................ .. .... ... ............. .. ...... ... ... 54
Figure 27: Diagram showing the sensitivity analysis technique (Lomas & Herbert, 1992)................ .. .... ........... 56
Figure 28: Eastfacing wall surface temperature .. ......... ...... ............. .. ....... ............ .... ......... ....... ................ ........ .. 57
Figure 29: North facing wall surface temperature ............................................................................................... 57
Figure 30: South facing wall surface temperature ............................................................................................... 57
Figure 3/: West facing wall surface temperature ................ ......................................................... ........ ................ 57
Figure 32: Indoor ceiling surface temperature .................................................................................................... 58
Figure 33: Indoorfloor surface temperature ... ........ ....... ... ......... ................ ..... ............................ ........................ 58
Figure 34: Zone temperature ..... .. ................... ..... .......... ... .. .................................................................................. 58
Figure 3j: Energy end use given by energy plus ..... ......... ........................... ..... ............. ....... ...... .... ............ .......... 59
Figure 36: Baseline model: view from southwest .... .................. ... ................ .... ............ .............. .......... ...... ......... 64
Figure 37: Hospital 1st floor plan ....................................................................................... ................................ 65
Figure 38: Hospital 2ndfloor plan .......... .... .................................................... .. ..... ... ............... ... ........... ..... ..... .... 66
Figure 39: Hospital 3rdfloor plan ............................................... .'...................................................................... 67
Figure 40: Hospital 4th floor plan....................................... .. .............. .............. ....... .... ................. ..... ................. 68
Figure 41: Hospital 5th to 9th floor plan ...................................... ..... ..... ............. .... ................ .... ............... ....... 69
Figure 42: Hospital l(jh floor plan.... ... .......................................................... ..................................................... 70
Figure 43: Cooling energy demand for selected air conditioned location at every floor..................................... 72
Figure 44: Influence ofseries ofretrofits on Cooling load demand............................................. ........................ 73
Figure 45: Reduction ofenergy consumption ofeach improvement method...... .. ................................................ 74
xi
.1
Figure 46: Influence o/shading devices (overhang &fin) to cooling load in 2 different order o/installation ... . 75
Figure 47: Pet:{ormance 0/PU insulation in the wall envelope ...... .... ... .. ..... ..... .. ... .. ....... .... ...... ..... ....... ........ ..... 77
Figure 48: Electricity bill saving when implementing the series 0/low energy measures .... .... ... ... .... ..... .. ... ... .. . 79
J
xii
CHAPTER 1
INTRODUCTION
1.0 General
Energy demand has grown considerable with the rising cost of energy. Therefore
energy conservation and rational use of energy is needed not only to address high energy
consmnption problem but also environmental issue of C02 emission which is responsible for
about 50% of the global wanning. (Walsh, 1990)
Any building of any sizes and usage could be improved in many ways to make it an
energy efficiency building even before its construction. Malaysian Standard MS 1525 have
been developed to encourage this and have sets the standard and criteria needed so that
building owner will not only rely less on energy but help to improve the environment in
reducing its. share of carbon print.
MS 1525 explains some but not limited to architectural and passive design strategy
that if considered and applied should help to reduce energy use. Some recommendation
given by the standard covers optimizing passive cooling strategies as well as optimizing
environmental cooling through natural means such as vegetation, landscaping and shading.
1
This study which entitles 'Sarawak General Hospital Main Block Building - Retrofit
Features for energy efficiency' is to identify architectural features that could be integrated
into the existing hospital building in order to increase energy efficiency in the building. This
will be simulated in Energy Plus, a building energy software to show the effect of proposed
architectural features and extent of its influence particularly on cooling load and indoor
lighting condition. Features proposed in the study will have to meet MS 1525:2007
minimum standard while maintaining the indoor environment to its desired thennal comfort.
To measure the possible energy saving that could be achieved, an energy audit will be
conducted on the selected building. Current energy use will be expressed in building energy
indices. The current Overall Thennal Transfer Value (OITV) and Roof Thennal Transfer
Value (RTTV) for the selected building envelope win be measured to give the indication on
how much heat is entering the building and its share of indoor cooling load.
Air conditioning and lighting systems are considered major energy user in most
building thus MS 1525 recommends improving efficiency and minimizing energy losses in
this area to save energy. However in this study focus is given to the architectural features that
will contribute to passive cooling thus improving building energy efficiency and conserve
more energy. This includes how best to improve building envelope in tenn of OTTV and
RTIV so that it in tum will result in higher indoor temperature set point and therefore reduce
energy consumption of HV AC systems as suggested by AI-Sanea and Zedan (2008).
"
2
1.1 Objectives
There are four objectives to be achieved in this study which are
a) To conduct a case study of energy usage of SGH Main block through energy auditing
b) To identify some retrofitting features on building which would meet the minimum
requirement of Malaysian Energy Standard MS1525 in tenn ofOTIV
c) To simulate and validate selected retrofitting features
d) To recommend retrofitting features and justify recommendation of retrofitting through
life cycle cost (LCC) and simple payback method.
1.2 Scope
The study will be conducted on a government health care facilities and due to time
constraint and complexity of the hospital set up, the study will focus only on the 9 storey
inpatient care block which houses most of the medical wards. The retrofitting to be
recommended will only consider features that could be implemented on the existing building
to meet the recommended OTTV.
3
CHAPTER 2
LITERATURE REVIEW
2.0 General
The effect of climate change has an impact on the way we use energy. (C.Ward, 2008)
The need to save energy was simply an effort to reduce global warming through reducing
global greenhouse gasses which was the main objective of Kyoto Protocol 1997 of which
Malaysia has ratified. As part of the Malaysian government policy to reduce its carbon
footprint, energy efficiency measures are being intensified in industrial, transport and
commercial sectors as well as government building. (Department Of Environment, 2006) In
building sector, not only there is an upward trend of demand in electrical energy, there is a
need and also a big potential in applying energy saving technologies in Malaysia since the
energy usage in the commercial and residential building alone accounts for up to 48% of
total electrical consumption. [(Nigel & Lucas, 2008) cited in (Anwar et at. 2009) ]
The global contributions from buildings towards.energy consumption, both residential
and commercial, have steadily increased, reaching figures between 20% and 40% in
developed countries. [(Lombard et at. 2008) cited in (Saidur, 2009)] Options available to
reduce energy use in building are such as building envelope with high performance glazing
with well insulated walls and roofs, use of daylight as source of lighting during daytime as
well as energy efficient equipment. (Anwar et at. 2009) Hospitals are among the top five
4
Pusat Khidmlu MakJum~t Akl:ld n,' UNI\'tRSlTI MALAYSIA AltA AK
energy consumers for non domestic sectors which also include industries, commercial
offices, schools and shops. Hospitals cover about 5% of total energy consumption in the
service sectors. (C.Ward, 2008)
2.1 Energy Usage Pattern In Healthcare Building
Energy Efficiency in building is about promoting optimum usage of energy for
heating, cooling and lighting in a building. This can be achieved through means but not
limited to options which have been mentioned above. Low energy office (LEO) building, a
building in Federal Government Administrative Territory, Putrajaya occupied by Ministry of
Energy, Green Technology and Water has achieved a building energy index of 100
kW/m2/yr. (commonly used energy index for comparing energy use in buildings and usually
expressed as kWhlm2/year) Additional 10% was needed for the construction cost which gives
payback for the extra investment of less than 10 years. Pusat Tenaga Malaysia (PTM), an
energy research agency establish by Government of Malaysia with one of its major function
is to promote national Energy Efficiency and Renewable Energy programs has establish a
building project (Zero Energy Office) that does not consumes energy more than can it
produce using renewable energy sources on site. As a key demonstration building, ZEO
energy index is 65 kW/m2/yr compared to typical c~nventional office building in Kuala
Lumpur of 250-300 kW/m2/yr. (Chua & Oh, 2010) The following are a few known Energy
Indices for healthcare buildings locally and internationally. The amount of energy used in ·
buildings depends on what it is used for thus the variation in energy consumption.
5
The Building Energy Index (BEl) for Hospital Kuala Lumpur is 390 kW/m2/yr as
reported by Pusat Tenaga Malaysia (PTM) in December 2008. The energy intensity for
hospitals in Thailand was reported to be at 148.8 kW/m2/yr. (Chirarattananon S, 2010) .
Another study on energy consumption in hospital building was done in Greece and showed
that the annual energy consumption in hospital is 407 kW/m2/yr and 275 kW/m2/yr for
clinics. (Santamouris et al. 1994) The authors also have shown that lighting consume about
52 kW/m2/yr (1 2.8%) , equipment 53 kW/m2/yr (13%) , electric 24 kW/m2/yr (6%), cooling
3.3 kW/m2/yr (0.8%) and thermal 274 kW/m2/yr (67.4%) . The biggest energy consumer in
healthcare building located in temperate climate is for heating purpose. Among the strategies
adopted to conserve energy used for heating are adding insulation, use of double pane
windows as well as proper orientation of building to increase solar gain to reduce heating
load. (This is in contrast to hot and humid climate which avoids long building fa9ade being
oriented towards the sun to reduce the cooling load) As a comparison, study in Hospital
Kuala Lumpur by PTM shows that 46% of electrical energy is used for air conditioning, 10%
for lighting, steam and hot water 22% while others (which consists of medical equipment,
medical gas, office equipment and general equipment) consume 22%. PTM suggest energy
saving measures that include lamp control system, changing to energy efficient lamp, use of
variable speed drive for AHUs, indoor temperature reset, improvement of Overall Thermal
Transfer Value (OTTV) and Roof Thermal Transfer Value (RTTV). The estimated Building
Energy Index could be improved from 390 kW/m2/yr to 312 kW/m2/yr should the
recommendations were implemented.
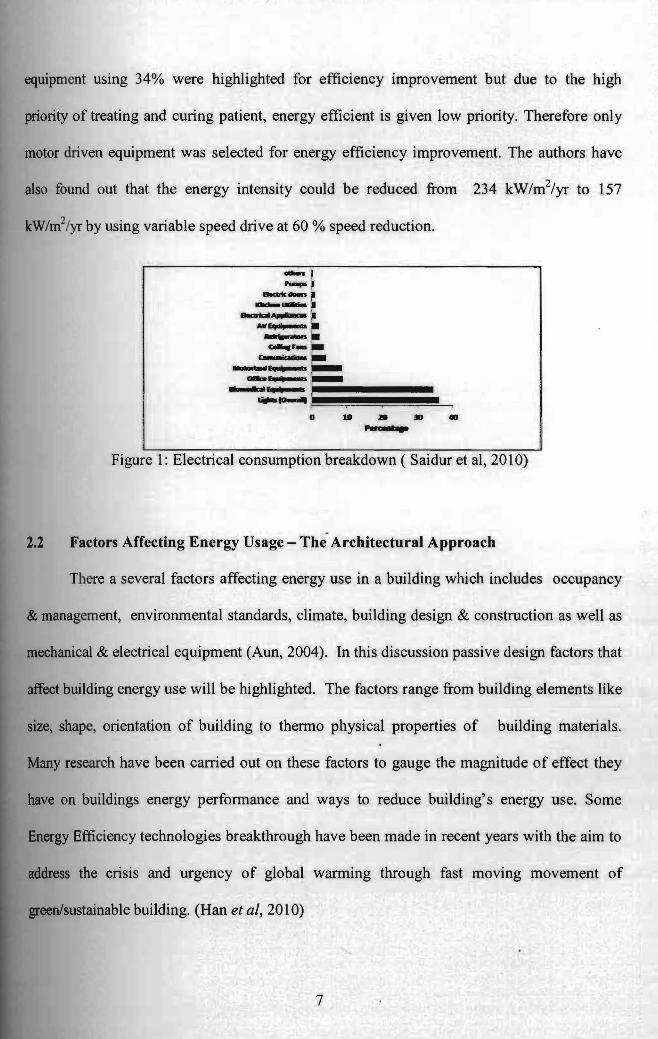
In a related study, an energy audit have been conducted in a hospital in 2008 with
energy intensity of 234 kW/m2/yr. (Saidur et aI, 2010) Figure 1 shows the breakdown of
energy consumption in this hospital. Lighting which uses 36% and fol1ow~ by biomedical
6
-----
equipment using 34% were highlighted for efficiency improvement but due to the high
priority of treating and curing patient, energy efficient is given low priority. Therefore only
motor driven equipment was selected for energy efficiency improvement. The authors have
also found out that the energy intensity could be reduced from 234 kW/m2/yr to 157
kW/m2/yr by using variable speed drive at 60 % speed reduction.
"'- ~ -~ ,.--I-I
1t1I~.
-c.-...-.Ii F_ ..
c • ..
-~~
--~-...... '-::;;:;;:;:;;;L.,......~~ o 18 ZD JO _
PM 'e
Figure 1: Electrical consumption breakdown ( Saidur et aI, 2010)
2.2 Factors Affecting Energy Usage - The Architectural Approach
There a several factors affecting energy use in a building which includes occupancy
& management, environmental standards, climate, building design & construction as well as
mechanical & electrical equipment (Aun, 2004). In this discussion passive design factors that
affect building energy use will be highlighted. The factors range from building elements like
size, shape, orientation of building to thenno physical properties of building materials.
Many research have been carried out on these factors to gauge the magnitude of effect they
have on buildings energy performance and ways to reduce building's energy use. Some
Energy Efficiency technologies breakthrough have been made in recent years with the aim to
address the crisis and urgency of global warming through fast moving movement of
greenlsustainable building. (Han et ai, 2010)
7
• • - -
According to work done by researchers which are briefly highlighted in the following
paragraph on passive cooling on building, significant amount of energy saving could be
achieved by applying architectural measures such as building orientation, providing solar
shading, use of thermal mass construction material, utilizing light colored roofs and surfaces
and heat reflective windows. The remaining of this chapter will provide insight into some of
these architectural features which is being widely used in order to improve energy efficiency
of a building.
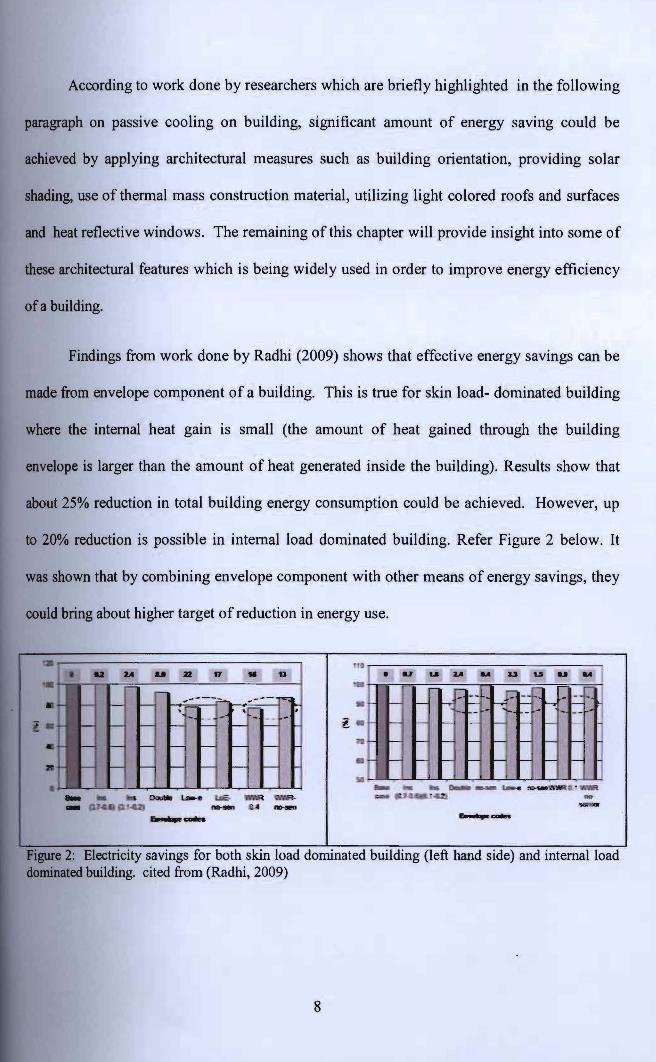
Findings from work done by Radhi (2009) shows that effective energy savings can be
made from envelope component of a building. This is true for skin load- dominated building
where the internal heat gain is small (the amount of heat gained through the building
envelope is larger than the amount of heat generated inside the building). Results show that
about 25% reduction in total building energy consumption could be achieved. However, up
to 20% reduction is possible in internal load dominated building. Refer Figure 2 below. It
was shown that by combining envelope component with other means of energy savings, they
could bring about higher target of reduction in energy use.
.. IA .. 2Z n 11 13
-
.., u :u ... loS U ..... U• ~ . ~ -
r- --- -.: r-
t-. - -
----: - r---: - r-
- - f-I--
~- -=-- i-~h• 'i- _ , ,-
-- fo-CI - r- r-f-f 1'1 -- r- r-H ~ -- f • r--t n,5B - --~ ....--.. -
..-Figure 2: Electricity savings for both skin load dominated building (left hand side) and internal load dominated building. cited from (Radhi, 2009)
8
Glass is a popular building element in many countries including Malaysia. With glass
come the issues of building overheating and sun glare which if ill selected would result in not
only poor day lighting and increased cooling load (high cooling loads leads to increase annual
electricity consumption) but also would cause health related issues such as fatigue, insomnia
and other seasonal affective disorder or SAD (Mohsen, 2006) .
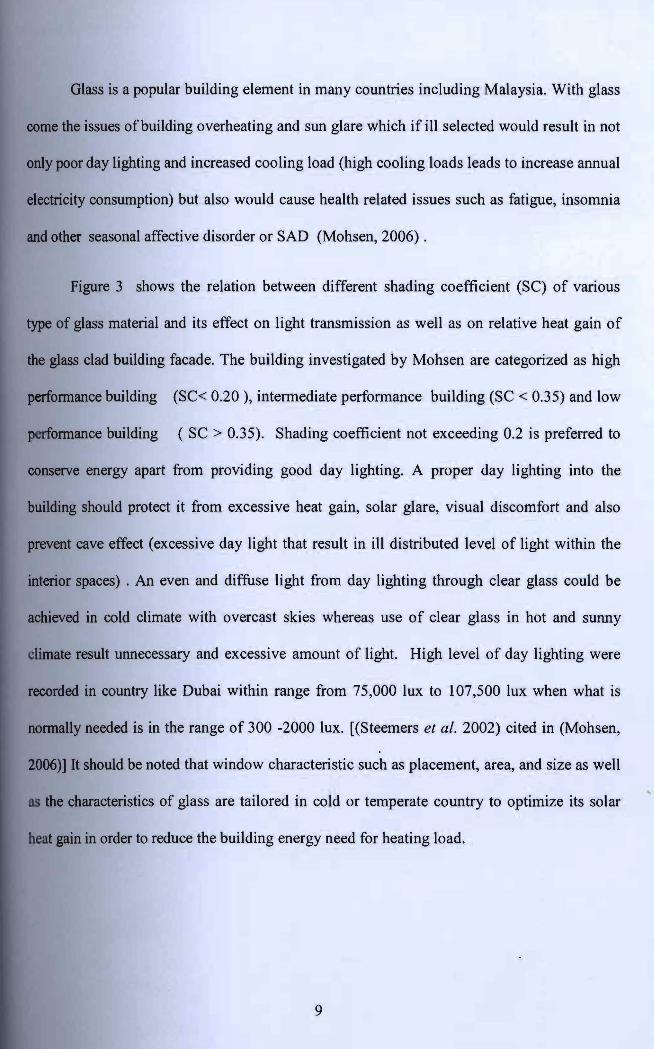
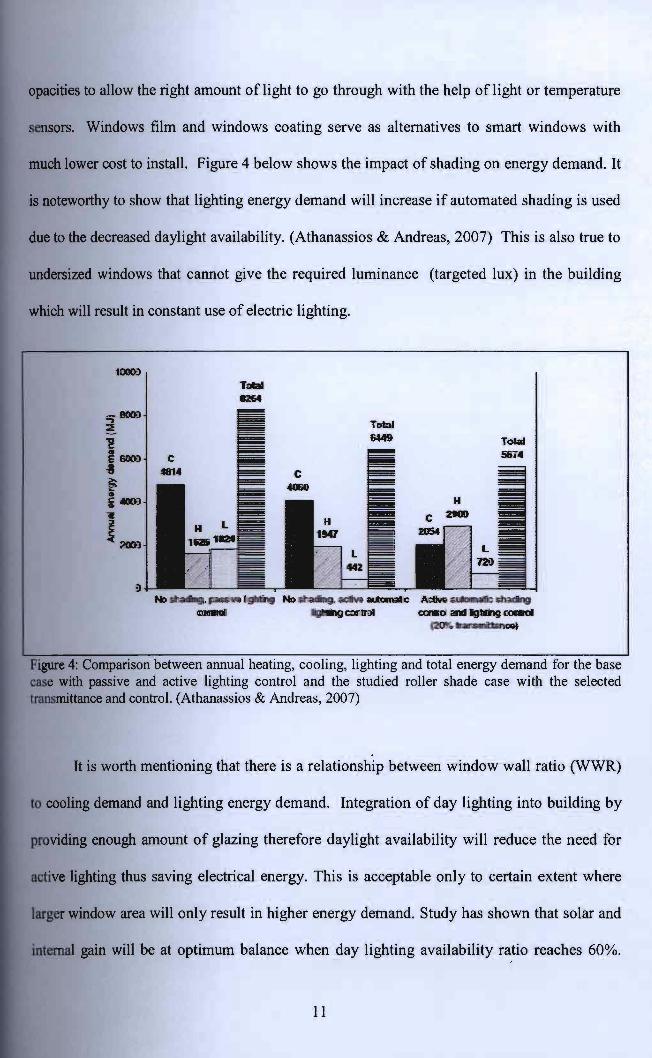
Figure 3 shows the relation between different shading coefficient (SC) of various
type of glass material and its effect on light transmission as well as on relative heat gain of
the glass clad building facade. The building investigated by Mohsen are categorized as high
performance building (SC< 0.20 ), intennediate perfonnance building (SC < 0.35) and low
performance building (SC > 0.35). Shading coefficient not exceeding 0.2 is preferred to
conserve energy apart from providing good day lighting. A proper day lighting into the
building should protect it from excessive heat gain, solar glare, visual discomfort and also
prevent cave effect (excessive day light that result in ill distributed level of light within the
interior spaces) . An even and diffuse light from day lighting through clear glass could be
achieved in cold climate with overcast skies whereas use of clear glass in hot and sunny
climate result unnecessary and excessive amount of light. High level of day lighting were
recorded in country like Dubai within range from 75,000 lux to 107,500 lux when what is
normally needed is in the range of 300 -2000 lux. [(Steemers et al. 2002) cited in (Mohsen,
2006)] It should be noted that window characteristic such as placement, area, and size as well
as the characteristics of glass are tailored in cold or temperate country to optimize its solar
beat gain in order to reduce the building energy need for heating load.
9
CiI! _ us .... - '-i ., i C.!5 - """"! " 30
~ U S - I-- - frU)
:11J ; 1L _ • 10 em t.cIO 4 -+ 4
....... e.iIIt_T_ !'-. ..... ...... fIr.- Ib........, ~.DIfIC.~ Or--1i -- t!C: roo_- - '- ""' ""~ ..... >c. .... . -...-. r.... c...... r~- ..~ -- ''''''.... .-- [ l 'JDe ' _Im< - BIne& - ,
as: I. i>
:"'" 1« ., ~nl >:;:
i n: Ii: i i 125
f- S) ! ~ / ~..
;.JAZ c ! <II
r~
II ~ ;
.~ lI __ " • I• ., :!O ::
-= 1'-" ... a :- = - "'- "' _lIC_ - "'"- - :.. .. -.- -- -- - - 0. -
I _~~~o-_- ... , "r~ 5XI ,., -• --Ill:
-r
I- i ~
.t Xl:! " ~~ Iu
f:s h z,
• - ~. - I ..• _W •• '" ,. ••• -~ . ~-- ..., - - -- ----- - - < - - - -- - -
:-"'_~-___-'Or ..:d
,
,
,
,
Figure 3: Relationship between shading coefficient and light transmission (top) as well as relative heat gain (bottom) (Mohsen, 2006)
Windows with shading are common features 10 any building and on the energy
efficient point of view are usually designed in such a way to help reduce heating and cooling
load. This include solar deflector, fixed or movable overhangs and blinds, shingled glass
facades, double glazed fayade system, motorized louvers, awnings and screens. Smart
windows which have made appearance commercially since 2006, has the ability to adjust its
10
opacities to allow the right amount of light to go through with the help of light or temperature
sensors. Windows film and windows coating serve as alternatives to smart windows with
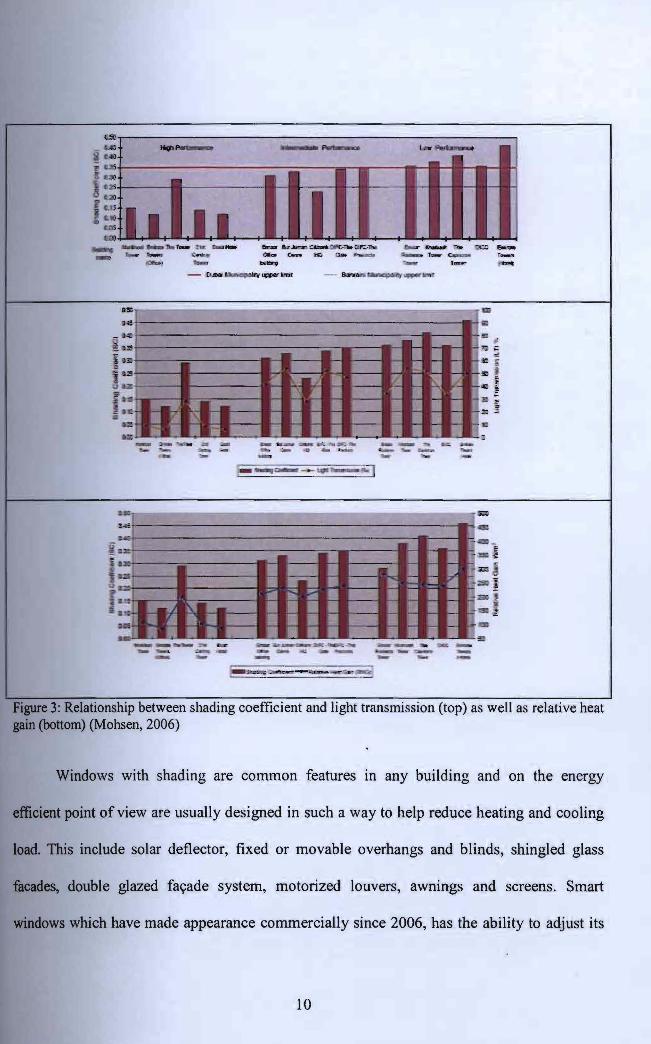
much lower cost to install. Figure 4 below shows the impact of shading on energy demand. It
is noteworthy to show that lighting energy demand will increase if automated shading is used
due to the decreased daylight availability. (Athanassios & Andreas, 2007) This is also true to
undersized windows that cannot give the required luminance (targeted lux) in the building
which will result in constant use of electric lighting.
TDIaII 8264
-8!»>2
ToW! e6eI) c ~
f eo1i ...
I ;JeD)
A;::tive ~ INIirV c::rtnl caao and IglIIng (01lII0I
.......aw.......
Pigw-e 4: Comparison between annual heating, cooling, lighting and total energy demand for the base case with passive and active lighting control and the studied roller shade case with the selected ttaDsmittance and control. (Athanassios & Andreas, 2007)
It is worth mentioning that there is a relationship between window wall ratio (WWR)
to cooling demand and lighting energy demand. Integration of day lighting into building by
providing enough amount of glazing therefore daylight availability will reduce the need for
active lighting thus saving electrical energy. This is acceptable only to certain extent where
larger window area will only result in higher energy demand. Study has shown that solar and
iDtemal gain will be at optimum balance when day lighting availability ratio reaches 60%.
11