
Sarah shannon
22
Projections of surface mass balance change in the Himalayan mountain glaciers during the 21 st Century Sarah Shannon, University of Exeter Richard Betts 1,2 , Tony Payne 3 , Andy Wiltshire 2 and Robin Smith 4 1 University of Exeter, 2 UK Met Office, 3 University of Bristol and 4 University of Reading Climate Change Innovation and Resilience for Sustainable Livelihood, Kathmandu 11 th -14 th January 2015 EC Seventh Framework Programme contract 603864
Transcript of Sarah shannon
Projections of surface mass balance change in the Himalayan mountain glaciers during the 21st Century
Sarah Shannon, University of Exeter
Richard Betts1,2, Tony Payne3, Andy Wiltshire2 and Robin Smith4
1University of Exeter, 2UK Met Office, 3University of Bristol and 4University of Reading
Climate Change Innovation and Resilience for Sustainable Livelihood, Kathmandu 11th -14th
January 2015
EC Seventh Framework Programme contract 603864
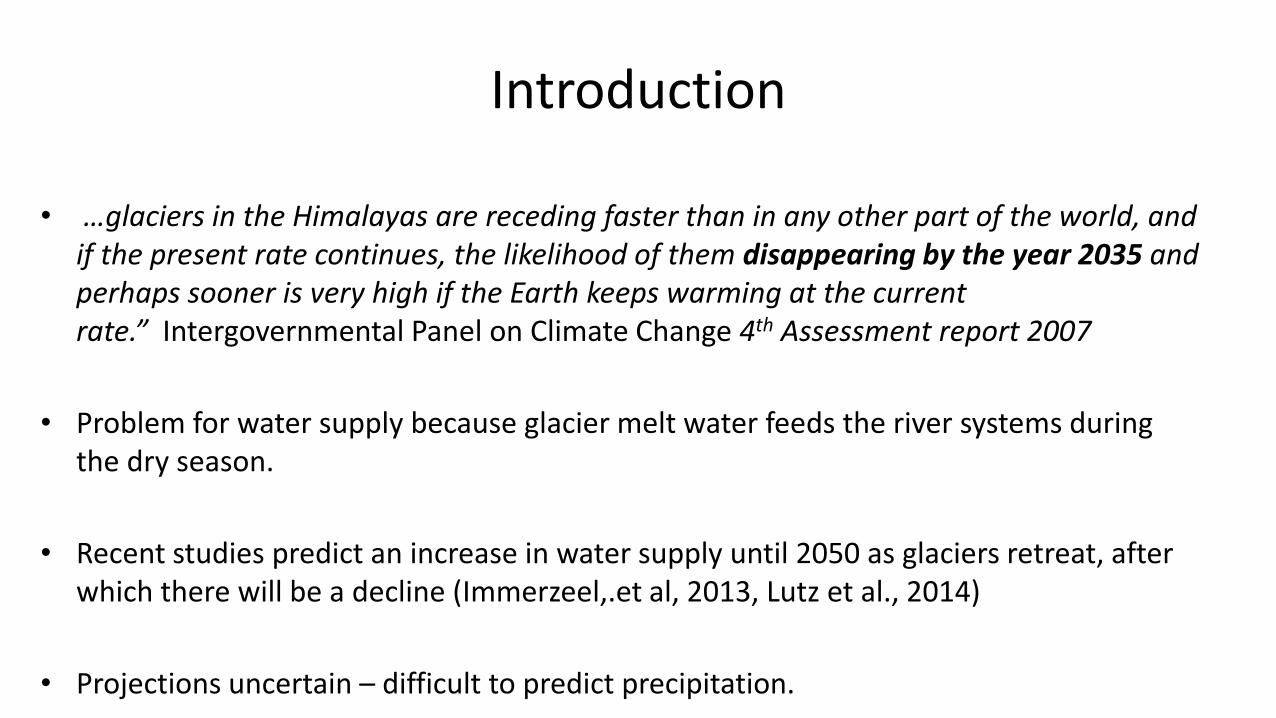
• …glaciers in the Himalayas are receding faster than in any other part of the world, and if the present rate continues, the likelihood of them disappearing by the year 2035 and perhaps sooner is very high if the Earth keeps warming at the current rate.” Intergovernmental Panel on Climate Change 4th Assessment report 2007
• Problem for water supply because glacier melt water feeds the river systems during the dry season.
• Recent studies predict an increase in water supply until 2050 as glaciers retreat, after which there will be a decline (Immerzeel,.et al, 2013, Lutz et al., 2014)
• Projections uncertain – difficult to predict precipitation.
Introduction
Outline
• The HELIX project.
• Model developments and validation.
• Preliminary results – projections of surface mass balance for the 21st Century.
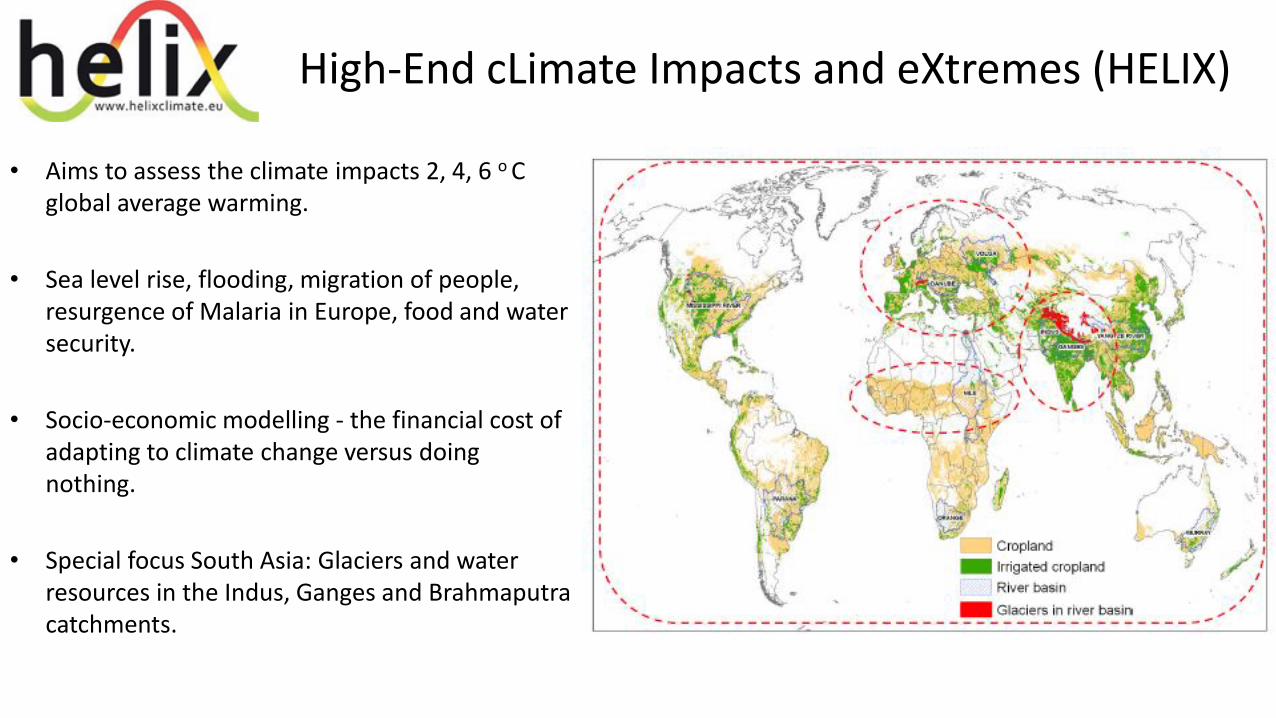
High-End cLimate Impacts and eXtremes (HELIX)
• Aims to assess the climate impacts 2, 4, 6 o C global average warming.
• Sea level rise, flooding, migration of people, resurgence of Malaria in Europe, food and water security.
• Socio-economic modelling - the financial cost of adapting to climate change versus doing nothing.
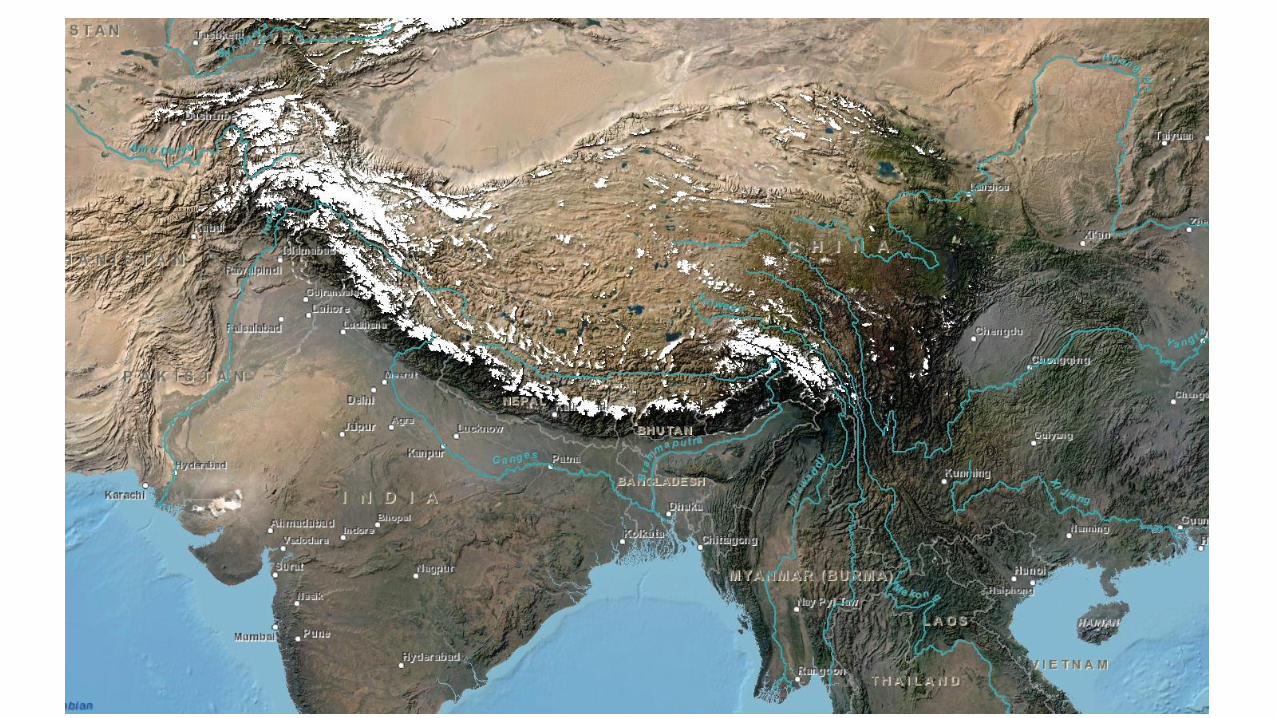
• Special focus South Asia: Glaciers and water resources in the Indus, Ganges and Brahmaputra catchments.
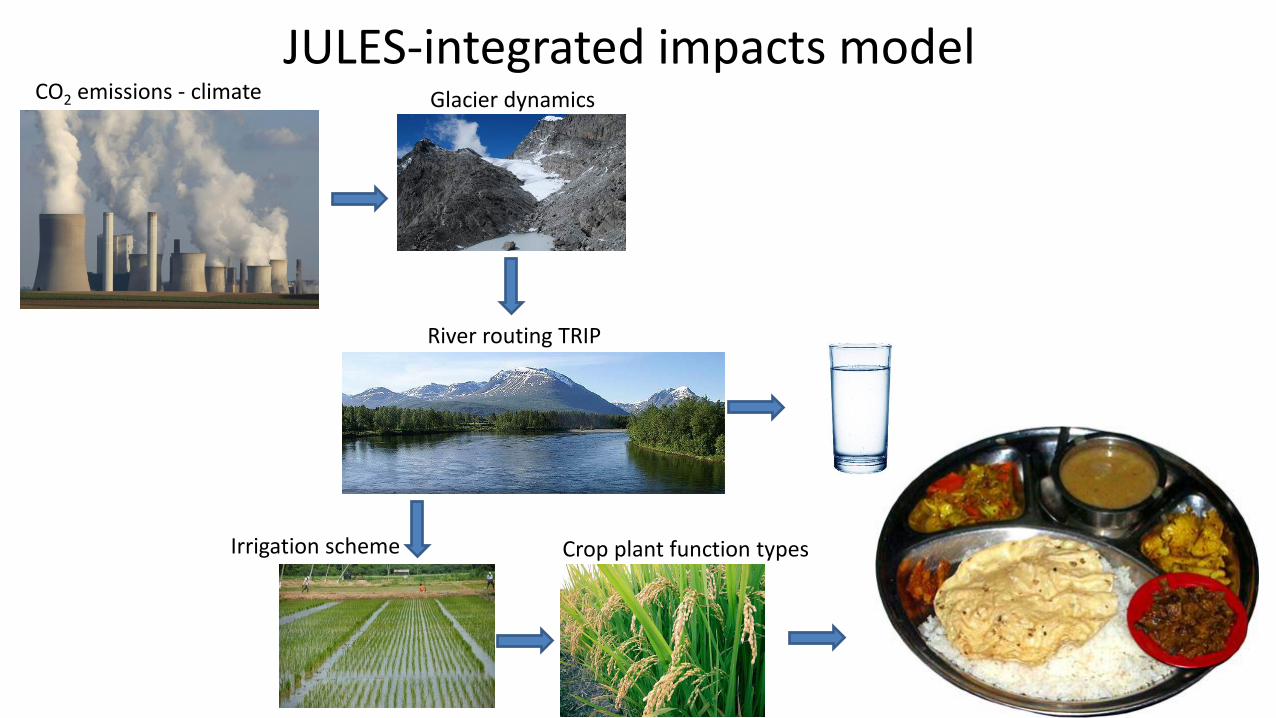
JULES-integrated impacts model Glacier dynamics
River routing TRIP
Irrigation scheme
CO2 emissions - climate
Crop plant function types
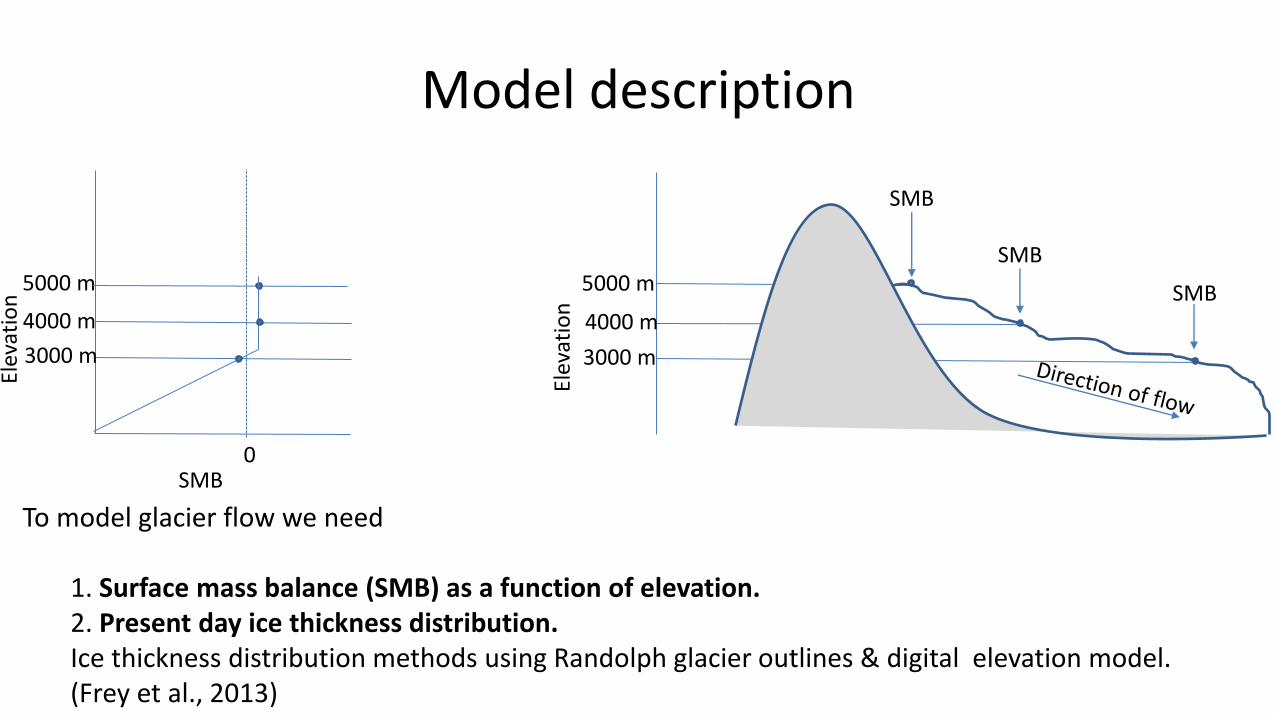
Model description
SMB
Elev
atio
n
4000 m
To model glacier flow we need
1. Surface mass balance (SMB) as a function of elevation. 2. Present day ice thickness distribution. Ice thickness distribution methods using Randolph glacier outlines & digital elevation model. (Frey et al., 2013)
5000 m
3000 m
SMB
SMB 5000 m
Elev
atio
n
4000 m
3000 m
SMB 0
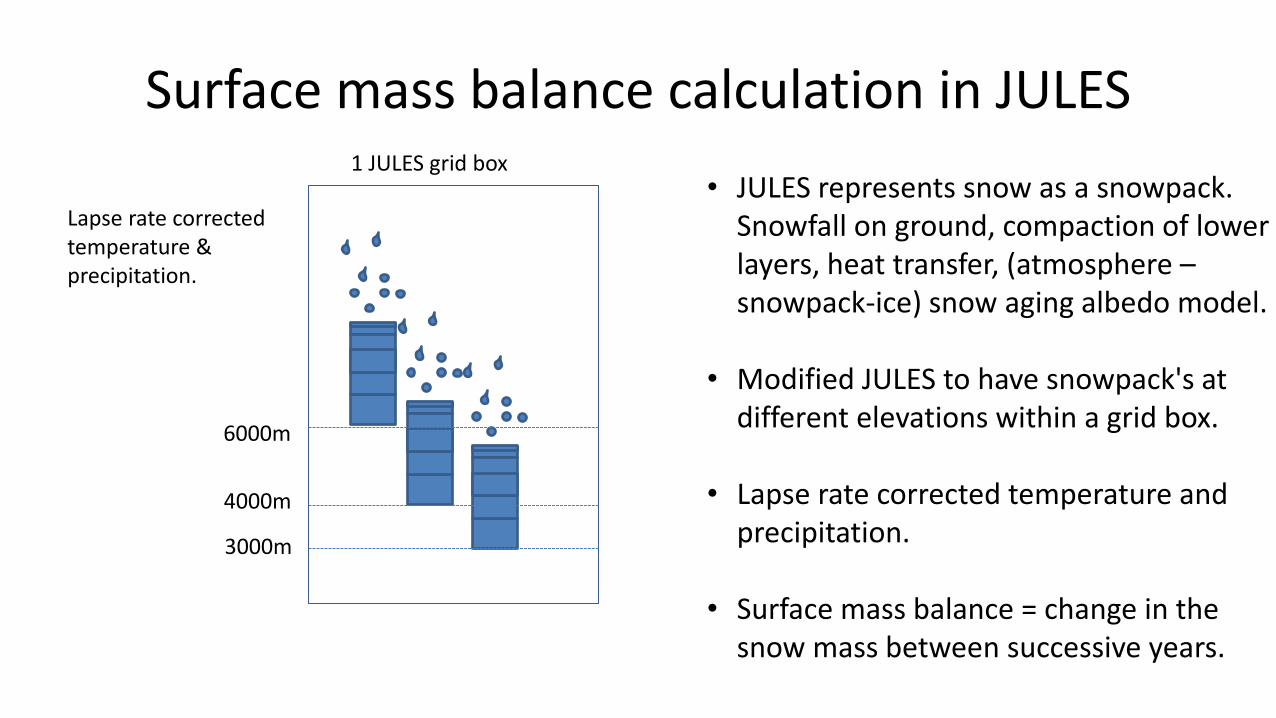
Surface mass balance calculation in JULES
Lapse rate corrected temperature & precipitation.
1 JULES grid box • JULES represents snow as a snowpack.
Snowfall on ground, compaction of lower layers, heat transfer, (atmosphere – snowpack-ice) snow aging albedo model.
• Modified JULES to have snowpack's at different elevations within a grid box.
• Lapse rate corrected temperature and
precipitation.
• Surface mass balance = change in the snow mass between successive years.
6000m
4000m
3000m
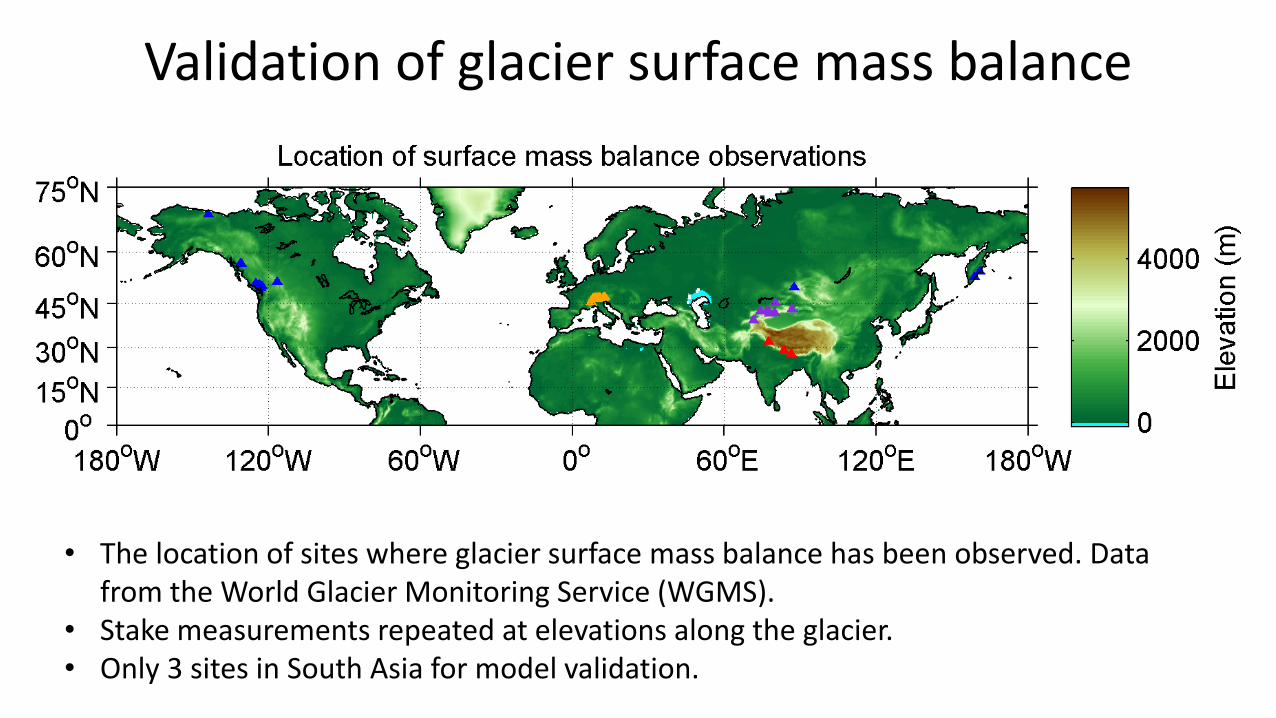
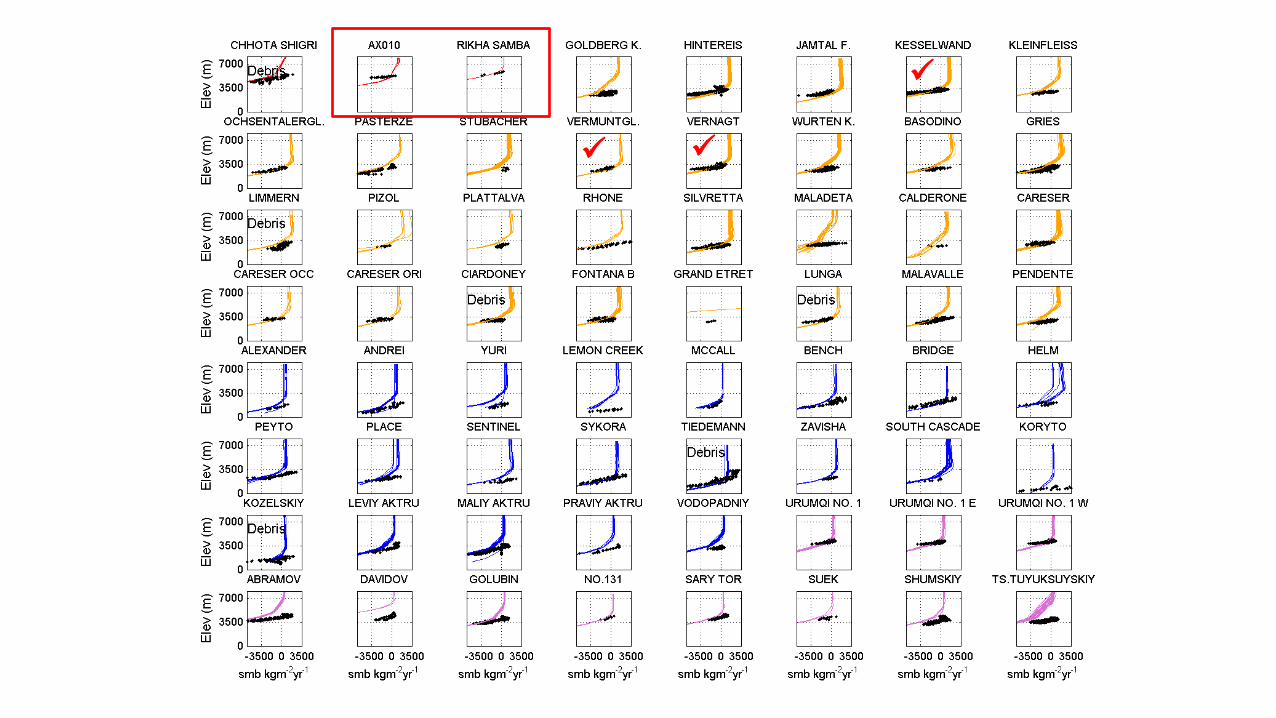
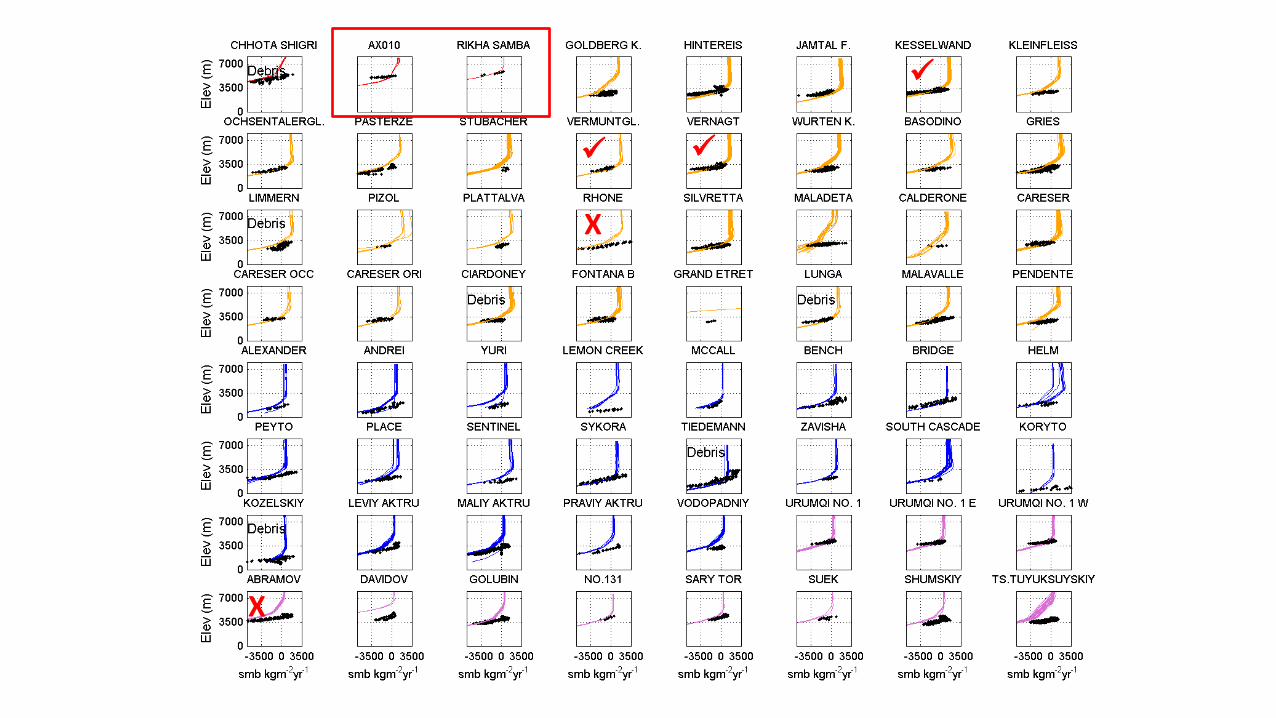
Validation of glacier surface mass balance
• The location of sites where glacier surface mass balance has been observed. Data from the World Glacier Monitoring Service (WGMS).
• Stake measurements repeated at elevations along the glacier. • Only 3 sites in South Asia for model validation.
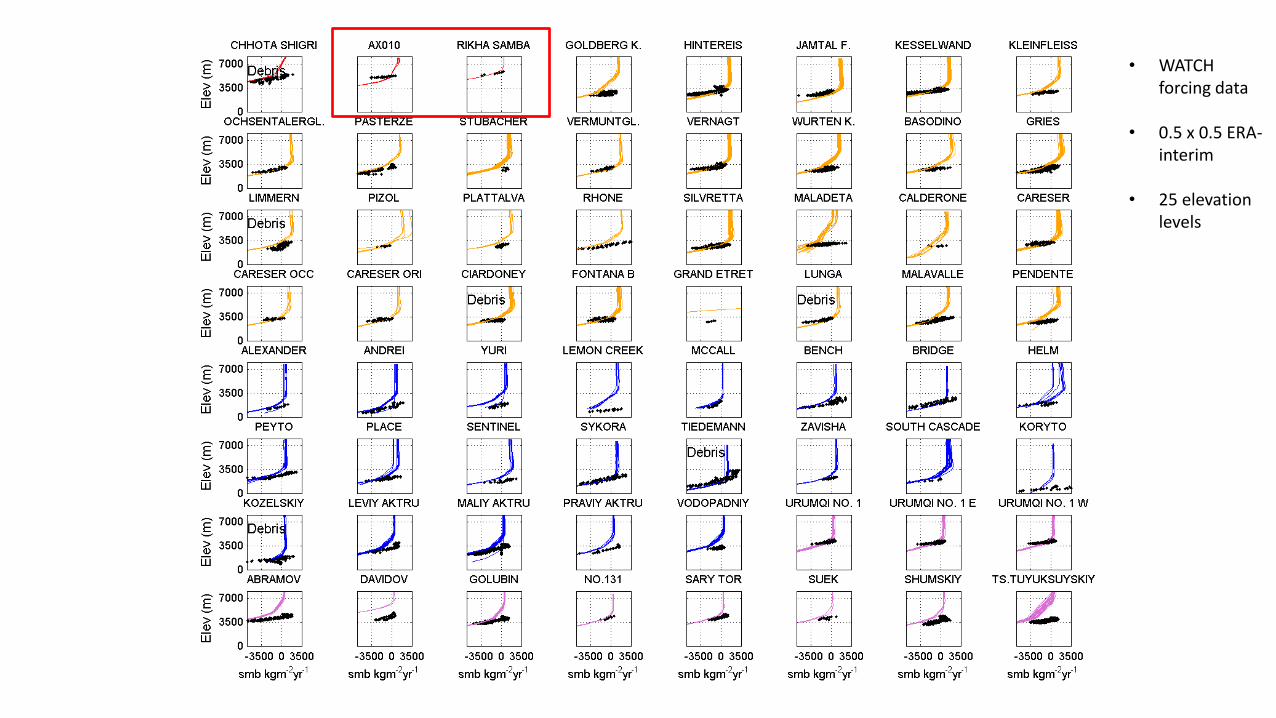
• WATCH forcing data
• 0.5 x 0.5 ERA-interim
• 25 elevation levels
X
X
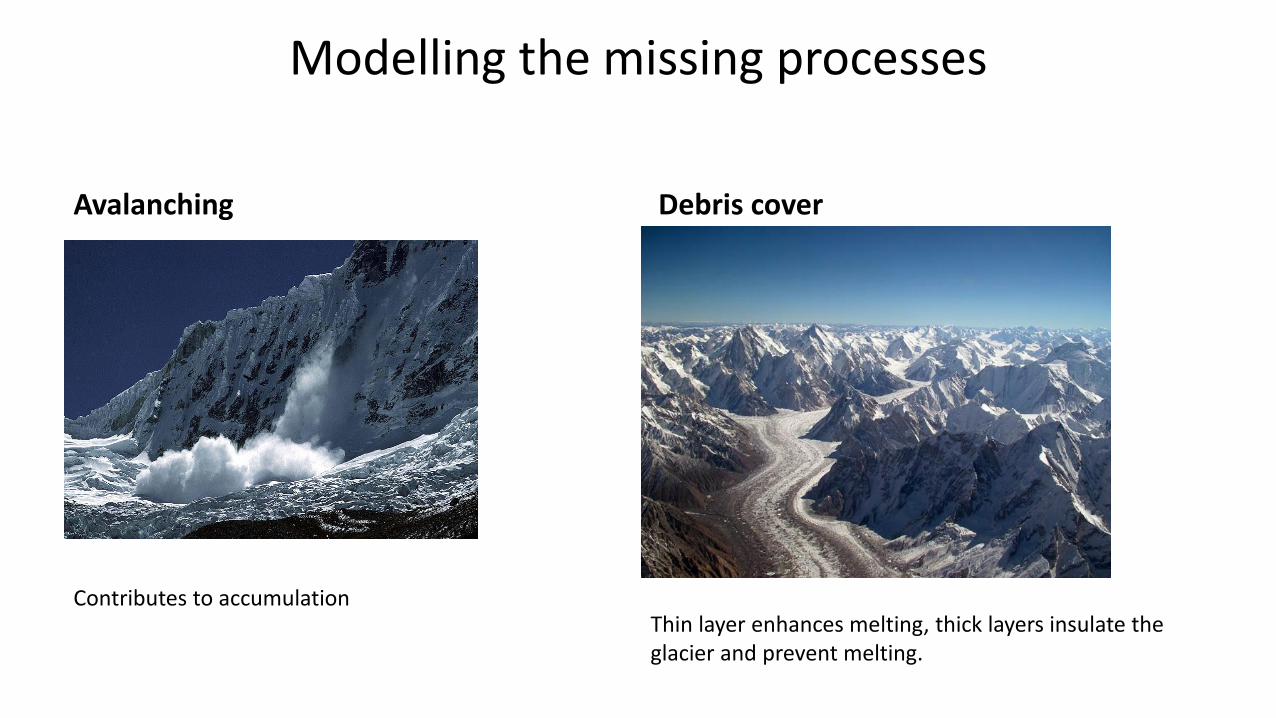
Modelling the missing processes
Avalanching
Debris cover
Contributes to accumulation Thin layer enhances melting, thick layers insulate the glacier and prevent melting.
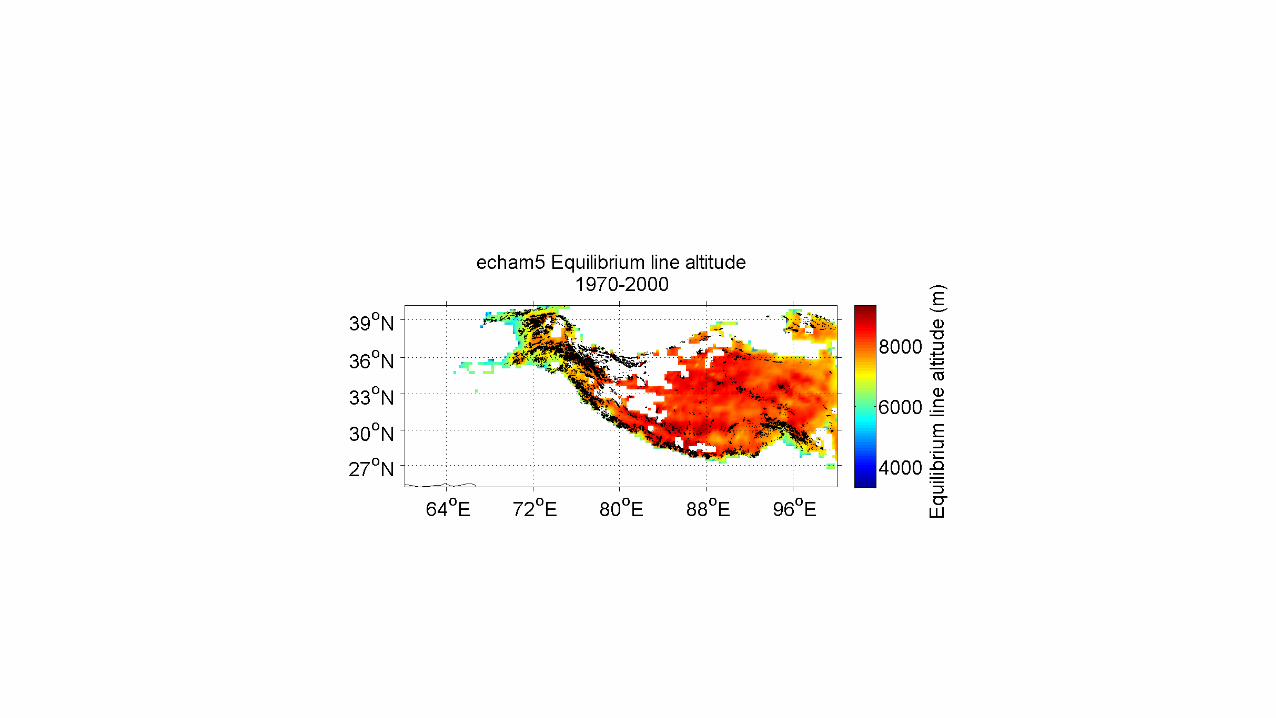
Projections of surface mass balance change during the 21st Century- preliminary results
• Force model with regional climate model data from the HighNoon project.
• HadRM3 regional climate model with lateral boundary conditions from ECHAM5 GCM
• 25km regional climate simulations South Asia for 1960-2100
• “Business as usual” A1B SRES scenario
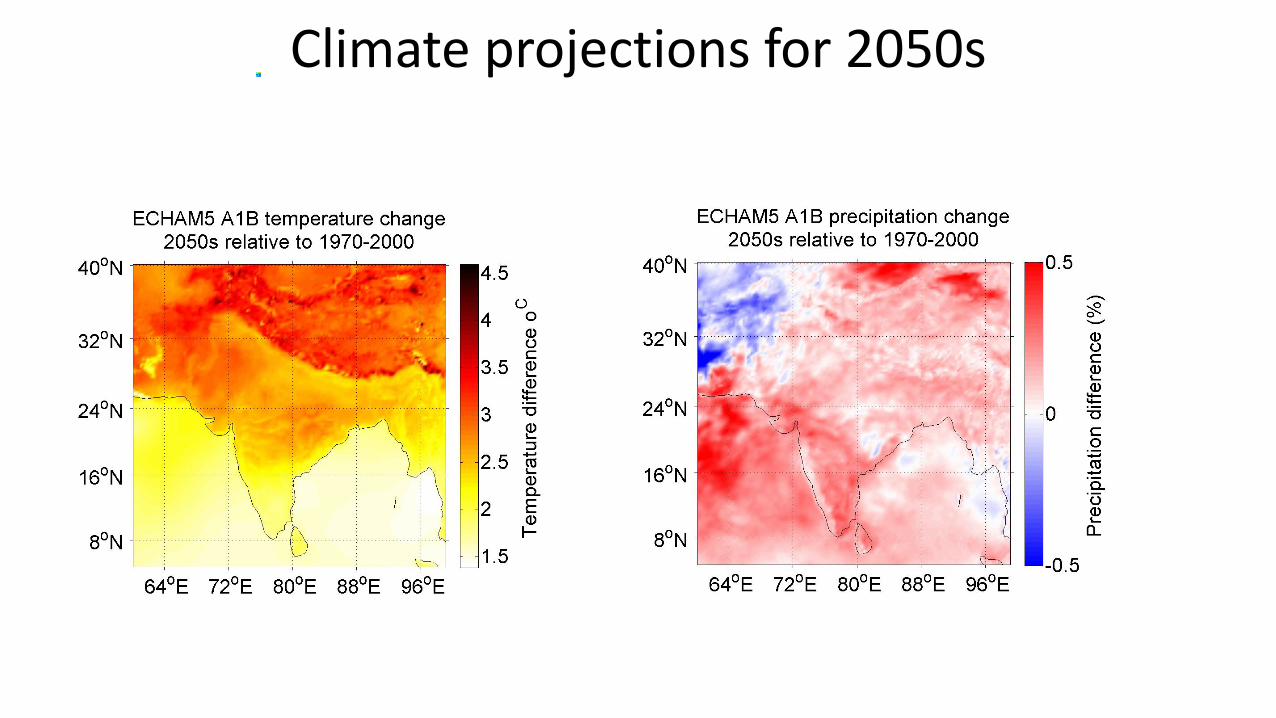
Climate projections for 2050s
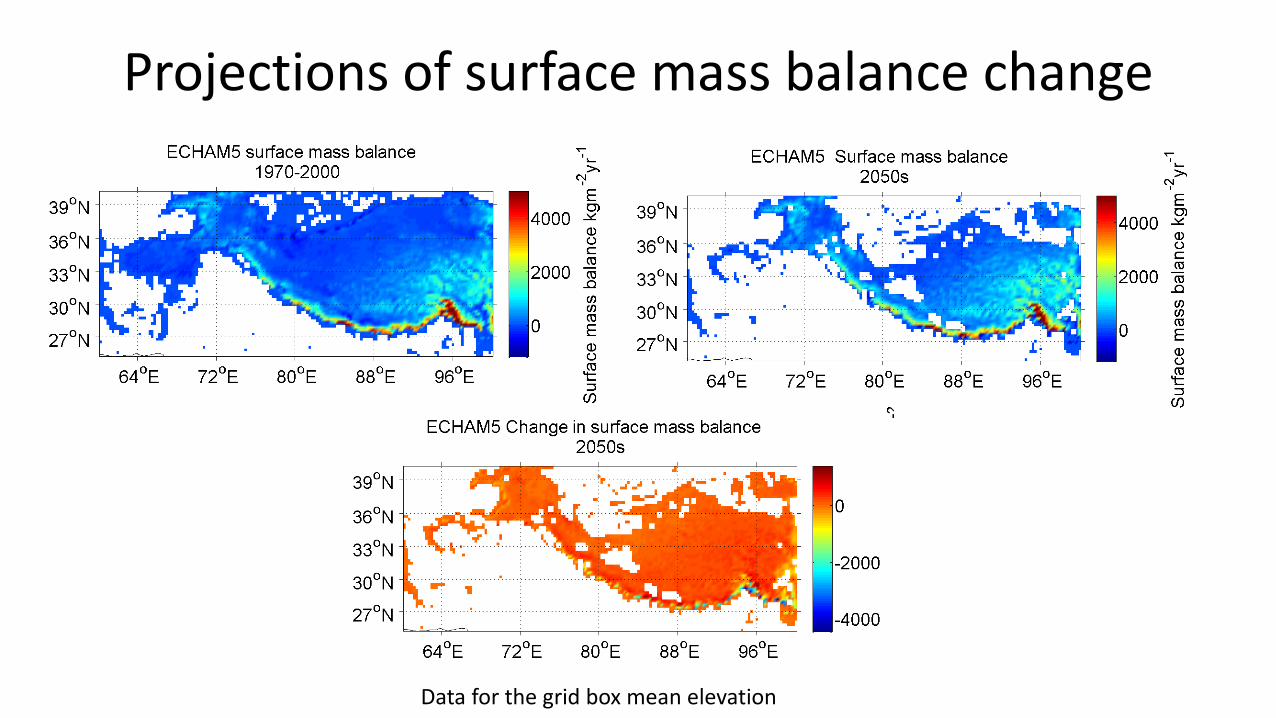
Projections of surface mass balance change
Data for the grid box mean elevation
Conclusions • Preliminary results show surface mass balance is projected to decrease by 2050
despite an increase in precipitation – implications for water supply during the dry season.
• Another year of model development
– ice thickness estimation
– include missing processes
– couple the ice dynamics model to JULES
• Run HELIX high end climate change scenarios.
• Are there river basins that would make interesting case studies?

Extra stuff
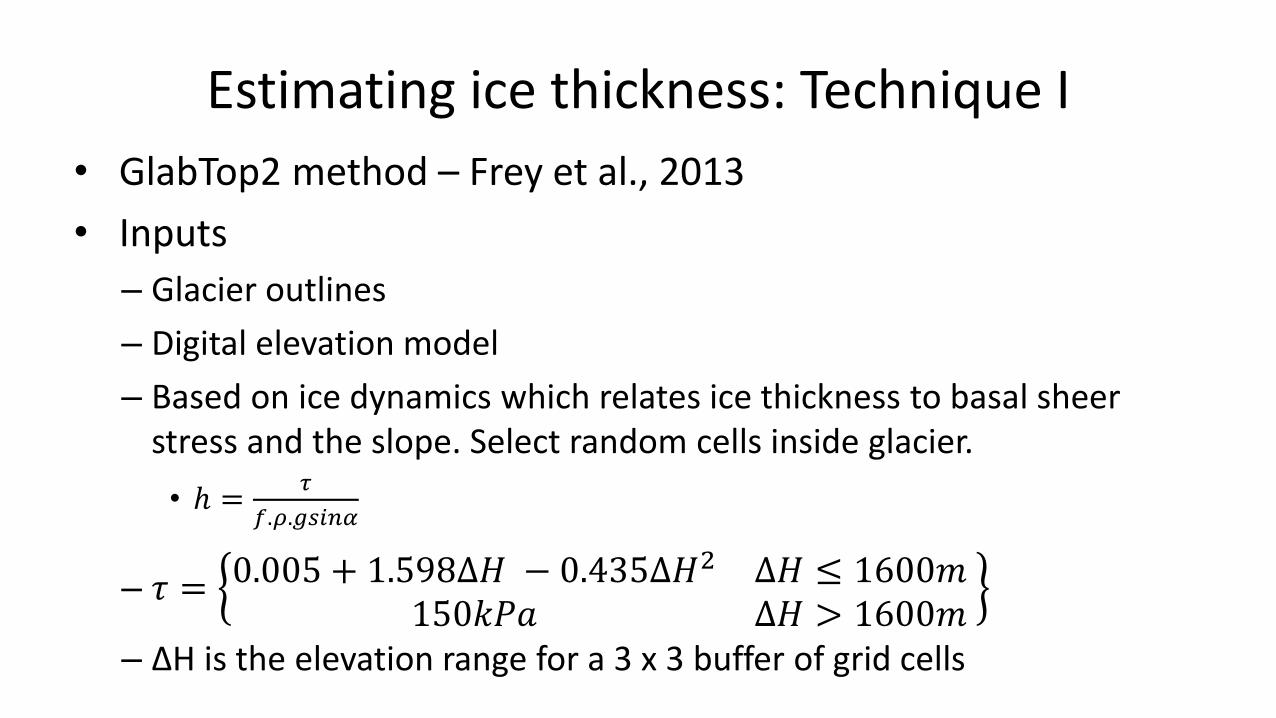
Estimating ice thickness: Technique I
• GlabTop2 method – Frey et al., 2013
• Inputs
– Glacier outlines
– Digital elevation model
– Based on ice dynamics which relates ice thickness to basal sheer stress and the slope. Select random cells inside glacier.
• ℎ =𝜏
𝑓.𝜌.𝑔𝑠𝑖𝑛𝛼
– 𝜏 = 0.005 + 1.598∆𝐻 − 0.435∆𝐻2 ∆𝐻 ≤ 1600𝑚150𝑘𝑃𝑎 ∆𝐻 > 1600𝑚
– ΔH is the elevation range for a 3 x 3 buffer of grid cells
Estimating ice thickness: Technique II
• Ice Thickness Estimation Method (ITEM) (Farinotti et al., 2009)
•