
SAR images statistics and preprocessing - Earth...
30
September 6,2007 D3Pb-4 SAR Statistics and Preprocessing Thuy Le Toan Thuy Le Toan September 6, 2007 Lecture D3Pb4 SAR images statistics and preprocessing
Transcript of SAR images statistics and preprocessing - Earth...

September 6,2007 D3Pb-4 SAR Statistics and Preprocessing Thuy Le Toan
Thuy Le Toan
September 6, 2007 Lecture D3Pb4
SAR images statistics and preprocessing

September 6,2007 D3Pb-4 SAR Statistics and Preprocessing Thuy Le Toan
SAR measurementStatistical properties and data
preprocessing

September 6,2007 D3Pb-4 SAR Statistics and Preprocessing Thuy Le Toan
SAR images
The basic measurement made by a SAR is S (amplitude and phase). This is the complex image.
Main types of images:
A is the amplitude image.I = A2 is the intensity image.(the phase of a single image is not exploitable)

September 6,2007 D3Pb-4 SAR Statistics and Preprocessing Thuy Le Toan
polarimetric images derived from S the complex image if the SAR system is polarimetric
interferometric images(coherence, phase) derived from S
multi polarisation intensity images
multitemporal intensity images
ASAR repeat pass
ASAR APP
ASAR
Exploitation of multiple imagesmulti temporal, multi polarisation, multi incidence

September 6,2007 D3Pb-4 SAR Statistics and Preprocessing Thuy Le Toan
The radar cross-sectionThe radar cross-section (RCS) is defined as
R is the radar-target distancePi is the incident power, Ps is the power scattered by the target.
[ ]222m44
i
spqpq P
PRS ππσ ==

September 6,2007 D3Pb-4 SAR Statistics and Preprocessing Thuy Le Toan
The backscattering coefficientFor distributed targets each resolution cell contains many scatterers and the phase varies rapidly with position.
The differential backscattering coefficient, σo, is
[m2/m2]
where is the area of the illuminated surface over which the phase can be considered constant.
i
so
PP
AR
Δ=
24πσ
AΔ

September 6,2007 D3Pb-4 SAR Statistics and Preprocessing Thuy Le Toan
What is a SAR image?
The image is seen as a picture.
Pixels are numbers.
Image is affected by speckle noise
Most commonly used: Intensity image

September 6,2007 D3Pb-4 SAR Statistics and Preprocessing Thuy Le Toan
Speckle effects
Same image, with speckle reduced

September 6,2007 D3Pb-4 SAR Statistics and Preprocessing Thuy Le Toan
Estimating the backscattering coefficientGiven L independent measurements from a uniform distributed target, the MLE of is given by
where the I(k) are individual intensity measurements.
N.B. This does not depend on the original form of the data (amplitude, intensity or complex).
L is called the number of looks.
∑==
L
k
kIL
I1
)(1
0σ

September 6,2007 D3Pb-4 SAR Statistics and Preprocessing Thuy Le Toan
The multi-look intensity distributionThe PDF of I is:
(1)
Hence
Coefficient of variation = CV = SD/ mean = .
Putting L = 1 (single look) gives SD = mean, CV = 1.
For calibrated data, the symbol σ in (1) is equal to σo. More generally, it will be proportional to σo.
( ) ( )σ
σLIL
L
I eILL
IP −−⎟⎠⎞
⎜⎝⎛
Γ= 11
( )L
I2
var σ=σ=I
L1
September 6,2007 D3Pb-4 SAR Statistics and Preprocessing Thuy Le Toan
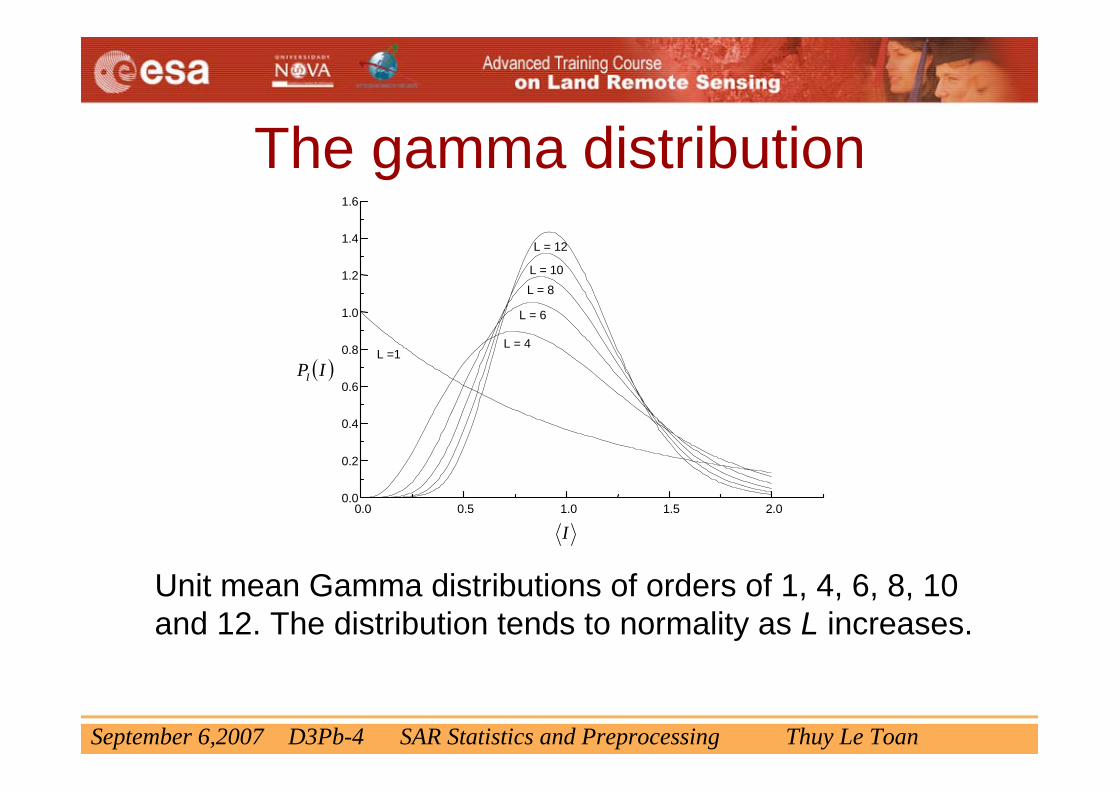
The gamma distribution
0.0 0.5 1.0 1.5 2.0 0.0
0.2
0.4
0.6
0.8
1.0
1.2
1.4
1.6
L = 12
L = 10 L = 8
L = 6
L = 4 L =1
( )IPI
I
Unit mean Gamma distributions of orders of 1, 4, 6, 8, 10 and 12. The distribution tends to normality as L increases.

September 6,2007 D3Pb-4 SAR Statistics and Preprocessing Thuy Le Toan
Pdf of amplitude image for a given backscatter value. The distribution is narrower with anincreasing number of looks
of a
mpl
itude
ASpeckle: Multilooking effect
Amplitude A

September 6,2007 D3Pb-4 SAR Statistics and Preprocessing Thuy Le Toan
Equivalent Number of Looks (ENL)In SAR intensity data, the speckle variance is proportional to the mean intensity squared.
If ENL is large, the spread of values due to speckle is small.
( )variancemeanENL
2
=

September 6,2007 D3Pb-4 SAR Statistics and Preprocessing Thuy Le Toan
Speckle filteringTo reduce the speckle noise in order to retrieve the usefulinformation content: structure in images, physical information..
1. Frequency filtering: spectral filtering during SAR processingASAR images provided to users: 3 Looks
2. Spatial filtering: local estimation on gliding windowsFilters of Lee, Kuan, Frost, MAP widely available
3. Multi channel filtering: applied on multiple images of the same scene muti polarisation, multi temporal, and multi frequencyASAR dual polarisation and multitemporal images

September 6,2007 D3Pb-4 SAR Statistics and Preprocessing Thuy Le Toan
Spatial filtering and adaptivityVarious methods are available
♦ Minimum mean square error (Kuan and Lee)♦ Maximum a posteriori MAP(applicable to textured
regions)
The filters tend to degrade resolution unless they use spatially adaptive windows to estimate local filter parameters (e.g. Frost).

September 6,2007 D3Pb-4 SAR Statistics and Preprocessing Thuy Le Toan
Purpose of filter:(1) Preserve radiometry ⇒ unbiased
(2) Minimise the variance of subject to the Mconstraints in (1)
Multi-image Intensity Filtering1I 2I
Filter
2J1J
MI
MJ
. . . . . . .
. . . . . . .
( ) ( ) MkyxJyxI kk ≤≤= 1,,
kJ
Original Images
Filtered images

September 6,2007 D3Pb-4 SAR Statistics and Preprocessing Thuy Le Toan
1 2 M…………….date 1 date Mdate 2
Example of Chaindeveloped using:
•Gamma ASAR (Gamma RS)
•Multi-image filtering(Quegan et al., 2000)
• Temporal change (Le Toan et al., 1997)
Processing chain
1 2 M…………….
.
.
1 2 M…………….
1 2 M…………….
Analysis , Retrieval Classification
Spatial filteringGeocoding
Multi image filtering
CalibrationRegistration
Initial images
Calibrated coregistered
Filtered
Filteredgeocoded

September 6,2007 D3Pb-4 SAR Statistics and Preprocessing Thuy Le Toan
Image preprocessing1. Calibration, to convert the data to standard
geophysical measurement units.2. Geocoding, to allow the data to be referenced to a
map and to allow geolocation.3. Registration, to make sure multiple images can be
matched point to point.
There are well-developed methods for each of these operations.

September 6,2007 D3Pb-4 SAR Statistics and Preprocessing Thuy Le Toan
CalibrationCalibration is the process converting voltages measured at the sensor to geophysical units; (usually σ0).
Relative calibration ensures that the values everywhere in a single image are proportional to σ0.
Calibration is essential to allow comparison of data from
♦ different sensors♦ different times♦ different positions

September 6,2007 D3Pb-4 SAR Statistics and Preprocessing Thuy Le Toan
Radiometric Effects of Topography
( )( )ϕθ
ϕθρ
−∝−
= cosm/Powersin
2XY
Relative increase in returned power = ( )ϕθθ−sin
sin
ϕ
θρ
θρ
X
Yϕ

September 6,2007 D3Pb-4 SAR Statistics and Preprocessing Thuy Le Toan
CoregistrationExample: Use of the point spread function in spatial correlation

September 6,2007 D3Pb-4 SAR Statistics and Preprocessing Thuy Le Toan
HH
HHVV
VV
Intensity 3 Looks imagesHongze (Jiangsu)2004 09 06
Multi-channel speckle filtering
Filtered images using HH, VV at multidates (10)
HH

September 6,2007 D3Pb-4 SAR Statistics and Preprocessing Thuy Le Toan
0 0.02 0.04 0.06 0.08 0.1 0.12 0.140
20
40
60
80
0 0.02 0.04 0.06 0.08 0.1 0.12 0.140
20
40
60
80
Multi image filtering
Histogram of ahomogeneous areabefore and after filteringusing 6 dates HH and VV(12 images)
Initial: APP 3 Looks

September 6,2007 D3Pb-4 SAR Statistics and Preprocessing Thuy Le Toan
Changes in backscattert1 or polarisation1 t2 or polarisation2
Temporal or polarisation changes
1σ 2σ
Δσ

September 6,2007 D3Pb-4 SAR Statistics and Preprocessing Thuy Le ToanHongze Lake WideSwath VV
Changes in backscatter
2004 08 18 2004 10 08Temporal change

September 6,2007 D3Pb-4 SAR Statistics and Preprocessing Thuy Le Toan
Changes in backscatter
HH VV
Hongze (Jiangsu) 2004 09 06
Changes in Polarisation

September 6,2007 D3Pb-4 SAR Statistics and Preprocessing Thuy Le Toan
Change based on ratiosThe distribution of the ratio is given by21 / IIZ =
( ) ( )( )( ) L
LL
ZLZLZp 22
12+Γ
Γ=
−
γγ
2
1
σσ
γ =where is the true intensity ratio.
Advantages:♦ Depends only on the relative change in intensity
between the images. ♦ Unaffected by topography and other multiplicative
effects, e.g., calibration.
Ratio of intensities is equivalent to the difference of the logs.

September 6,2007 D3Pb-4 SAR Statistics and Preprocessing Thuy Le Toan
Hongze Lake
The ratio image
20040818 / 20041008

September 6,2007 D3Pb-4 SAR Statistics and Preprocessing Thuy Le Toan
Hongze Lake WS
R : VV_20040818
G : VV_20041008
B : VV_2 / VV_1
Temporal change image

September 6,2007 D3Pb-4 SAR Statistics and Preprocessing Thuy Le Toan
An important topic is the effect of speckle noise which need to be reduced before to use the SAR image as physical measurements
Preprocessing steps are important
Knowledge of the scattering physics and the SAR statistical properties is essential in applications
Remarks
![STATISTICS ORIENTED PREPROCESSING OF ......Statistics Oriented Preprocessing 385 the single skew estimation [6], i.e. global text skew. A method based on geometrical transformation](https://static.fdocuments.us/doc/165x107/6004d2e94f092e7ff107c2b3/statistics-oriented-preprocessing-of-statistics-oriented-preprocessing-385.jpg)