sappi cover 24470 - ShareDatasappi cover 24470 14/12/01 10:31 AM Page 2. sappi > 2001 page 1...
126
annual report sappi sappi
Transcript of sappi cover 24470 - ShareDatasappi cover 24470 14/12/01 10:31 AM Page 2. sappi > 2001 page 1...

annu
al r
epor
t
01
sappi
sappi @ www.sappi.com
sappi 2001 annual report
sappi
sappi cover 24470 14/12/01 10:31 AM Page 1

sappiThe word for fine paper
Ifc Financial highlights2 Sappi profile
12 Sappi at a glance14 Sappi worldwide16 Sappi executive committee18 Chairman’s statement24 Questions and answers 26 Sappi Board28 Sappi fine paper32 Sappi forest products36 Sappi’s people37 Environmental commitment39 Value added statement
40 Management discussionand analysis of results(incorporating FinancialDirector’s report)
48 Financial performance49 Performance against financial
objectives50 Five-year review52 Share statistics 54 Corporate governance56 Auditors’ report56 Directors’ approval56 Secretary’s certificate
57 Directors’ report60 Income statement61 Balance sheet62 Cash flow statement63 Statement of changes in
shareholders’ equity64 Income statement in rands65 Balance sheet in rands66 Notes to the annual financial
statements107 Company income statement107 Company balance sheet108 Company cash flow statement
108 Company statement ofchanges in shareholders’ equity
109 Notes to the company financialstatements
110 Investments112 Notice to members116 Divisional and corporate
management117 Glossary118 Shareholders’ diary118 Administration118 Forward-looking statement119 Proxy form
G R A P H I C O R 2 4 4 7 0
Printing technique – printed cmyk, special blue andspecial silver both outside and inside cover. Overall mattlamination outside, overall aqueous varnish inside, spotUV varnish outside and inside.
idea exchange
Sappi paper used in the annual report – Cover Strobe Silk – 325 gsmPages 1 – 16 Strobe Silk – 148 gsmPages 17 – 56 Magno Satin – 150 gsmPages 57 – 120 Diamond Premium Art Matt – 135 gsm
idea exchange
CONTENTS
sappi cover 24470 14/12/01 10:31 AM Page 2

sappi > 2 0 0 1 p a g e 1
September September September
2001 2000 * 2001
US$ million US$ million ZAR million
Sales 4,184 4,718 33,294
EBITDA 797 1,052 6,342
Operating profit 446 672 3,549
Net profit 138 363 1,098
EPS (cents) 59 153 469
Earnings before exceptional items 263 347 2,093
EPS before exceptional items (cents) 113 146 899
Dividend per share (cents)
– declared after year-end ** 26 25 250
Ordinary shareholders’ interest
per share (cents) 655 677 5,854
Achieved Achieved
September September
2001 2000 *
Operating profit to sales (%) 10.7 14.2
Return on net assets (RONA) (%) 13.1 18.2
Return on equity (ROE) (%) *** 15.9 23.8
Debt-to-total-capitalisation ratio 0.30 0.33
Cash interest cover 6.2 7.3
● Difficult market conditions
● Headline EPS 113 US cents
● Strong balance sheet
● Dividend increased to 26 US cents
* Comparative figures have been restated for accounting policy changes to ensure consistency.
** The dividends for both financial years were declared subsequent to year-end and, in terms of our newly adopted accounting policy,
are accounted for and included in the statement of changes in equity in the following financial year.
*** September 2001 – ROE before Mobile mill closure costs.
financial highlights

The geographic spread of our assets is a key component of
Sappi’s success – it allows us to take advantage of strong
markets and weak currencies and, therefore, minimise the
impact of the fluctuation of currencies and demand.
5,000
4,500
4,000
3,500
3,000
2,500
2,000
1,500
1,000
500
0
Sales(US$m)
97
3,55
7
98
4,30
8
99
4,42
2
00
4,71
8
01
4,18
4
400
350
300
250
200
150
100
50
0
Net profit(US$m)
97 98 99 00 01
20
107 114
363
138
160
140
120
100
80
60
40
20
0
Headline earnings per share(US cents)
97 98 99 00 01
15
45
73
146
113
800
700
600
500
400
300
200
100
0
Operating profit(US$m)
97 98 99 00 01
238
409
395
672
446

sappi is the world’s leading
producer of coated fine paper.
We hold major market shares in Europe, North America and
Africa. We have customers in over 100 countries worldwide.
Our manufacturing operations span eight countries on three continents.
Sappi’s achievements are driven by:
• Concentrated focus on our core business
• A successful pulp integration strategy
• A culture of innovation in products and technology
• The development of strong, globally competitive brands
• World-class assets
• An unrelenting focus on efficiency and cost management
We strive constantly to deliver value to
our shareholders, our customers and the
communities in which we operate.
We are a truly global company.
sappi > 2 0 0 1 p a g e 2
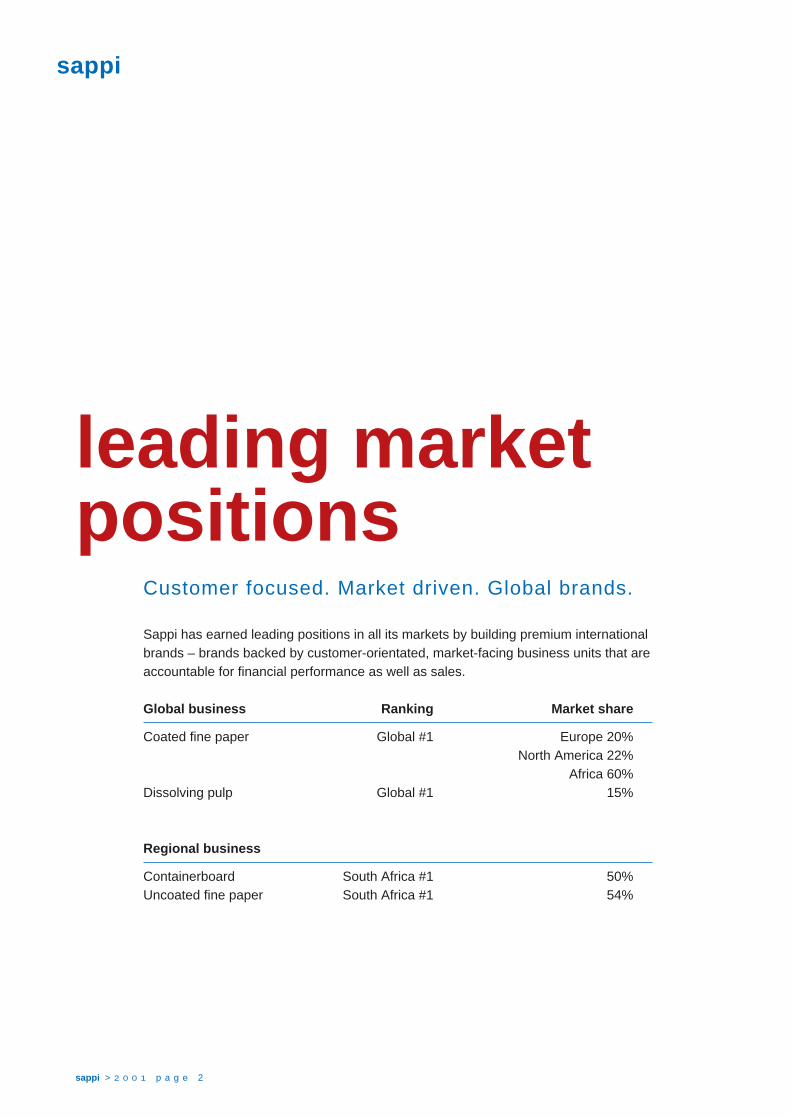
Customer focused. Market driven. Global brands.
leading marketpositions
Sappi has earned leading positions in all its markets by building premium internationalbrands – brands backed by customer-orientated, market-facing business units that areaccountable for financial performance as well as sales.
Global business Ranking Market share
Coated fine paper Global #1 Europe 20%North America 22%
Africa 60%Dissolving pulp Global #1 15%
Regional business
Containerboard South Africa #1 50%Uncoated fine paper South Africa #1 54%
sappi

Printing technique – printed cmyk and hi-fiorange, overall matt UV varnish and spot UVvarnish.
idea exchange

sappi > 2 0 0 1 p a g e 4
geographic spreadSappi’s 18 pulp and paper mills across Europe, North America and Southern Africa,together with its global customer base, enable maximised opportunities where marketsare strong and minimised risk where they are weak.
Our geographic spread helps offset the volatile movement of major currencies andprovides cost benefits when currencies are weak and higher revenues when theyare strong.
Sappi is listed on the Johannesburg, New York, London and Frankfurt stockexchanges.
Maximising opportunities. Minimising risk. Optimising value.
Sales by destination
Europe41%
Far East10% South Africa
13%
Net operating assets
Europe41%
NorthAmerica
31%South Africa28%
Shareholders
Europe17%
NorthAmerica
47%South Africa36%
NorthAmerica
36%
sappi
Printing technique – gloss silver foil,overprinted cmyk.
idea exchange

thinking innovationDynamic technology clusters which operate across our regions drive Sappi’s ability to design andenhance value-adding products and services bringing them to the market faster than ever.
The companies that make up the Sappi Group today are the originators of almost all coated finepaper product innovations in the last century. This excellence is continued by our three researchand development centres in Europe, North America and South Africa.
sappi
sappi > 2 0 0 1 p a g e 6
Cutting-edge technology. Pioneering products. Global approach.
Printing technique – pearlescent varnishoverprinted cmyk and spot UV varnish.
idea exchange

sappi
sappi > 2 0 0 1 p a g e 8
world-class assetsStrategic acquisitions. Operating scale. Optimal efficiency.
Our international acquisitions have included Hannover Papier, the market leader inGermany (acquired in 1992), SD Warren, the market leader in North America(acquired in 1994) and KNP Leykam, the market leader in Europe (acquired in 1997).Over these eight years, Sappi has added some of the lowest cost and most efficientassets in the fine paper sector to its leading Southern African asset base.
The average output per paper machine (one measure of efficiency) of our fine paperassets in Europe is 240,000 tons and in North America 175,000 tons, compared to thethree largest competitors in each of these regions of 140,000 tons and 115,000 tonsrespectively. Our Saiccor mill is the largest and lowest cost dissolving pulp millglobally.
Sappi has clearly identified its core businesses and investment criteria and isintolerant of non-performing assets.

sappi > 2 0 0 1 p a g e 9
Printing technique – gold aqueous varnish,overprinted cmyk and textured spot UV varnish.
idea exchange

sappi
sappi > 2 0 0 1 p a g e 1 0
sappi peopleQuality. Depth. Talent.
Dinga Mncube (41), Sappi Timber Industries General Manager – Sappi Forest Products
“Sappi has afforded me exciting career opportunities and strong management support. Of special note has been Sappi’s Project
Grow, where I have been instrumental in empowering economically disadvantaged rural communities . . . 35 small and medium
micro enterprises outside of the community tree farming project now employ in excess of 1 000 people and generate a
sustainable annual turnover of ZAR24 million.”
Paul Leslie-Smith (38), Group Investor Relations Manager – Sappi Limited
“The rapid expansion of Sappi’s shareholder base into the global arena has resulted in a whirlwind of interaction with financial
communities spanning three continents. For me promoting Sappi in the international equity markets is an exciting experience
with each day presenting its own unique challenges to be met and opportunities to be taken.”
Michael Spallart (39), Marketing and Sales Director Graphics Papers – Sappi Fine Paper Europe
“Every day our business provides me with challenges and scope to develop new ideas as we set about creating a competitive
advantage over our competitors for our products, brands and services in such a way that merchants and specifiers (such as
printers, publishers, creative agencies and the corporate customer) will insist on doing business with us.”
Math Jennekens (48), Director Research and Development – Sappi Fine Paper Europe
“I am part of a team which by pooling our global resources, skills and knowledge, together with the strategic alliances we have
with our suppliers, will continue to develop innovative products for our customers ahead of our competition.”
Ray Parent (51), Vice-president of Technology – Sappi Fine Paper North America
“I’m a commercial technologist at heart, so it’s rewarding to work for a company which is committed to innovation that drives
bottom line results. Sappi recognises that being a fast second doesn’t cut it. Our mission is to lead the market with profitable,
innovative products faster and more frequently than anyone else. That’s what drives me!”
Jennifer Miller (46), Executive Vice-president Administration – Sappi Fine Paper North America
“I’m driven – the entire Sappi team is driven – to create a blow-away competitive advantage based on a fierce customer focus.
Today, our customers demand more from us. Innovative, flexible service. A keener appreciation of what drives their profitability.
A commitment to execution. My goal is to channel our talent and resources to meet, and beat, customer expectations.”
Deborah Farnaby (36), Director, Group Information and Technologies – Sappi Limited
“I thrive on challenge and in my experience Sappi provides an extraordinary working environment which encourages
entrepreneurial behaviour. Developing Sappi’s global technology platform has given me the opportunity to grow, develop,
manage and innovate while benefiting from the experience of my colleagues.”
Our continued success is ultimately due to our people and the depth and quality oftalent that comprises our organisation.
We are proud of our ability to attract and challenge people that have vision, leadershipand the energy to excel.

Printing technique – printed cmyk, hi-fi green,hi-fi blue and textured spot matt UV varnish andgloss UV varnish.
idea exchange
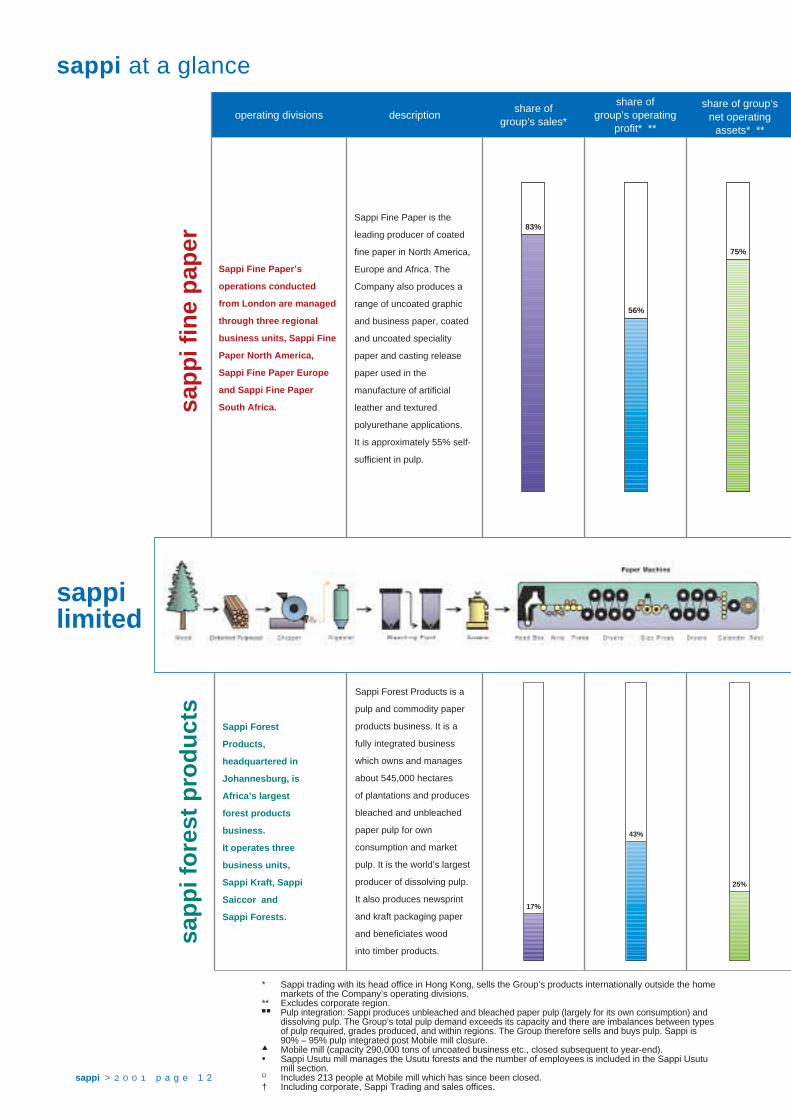
sappi at a glance
sappi > 2 0 0 1 p a g e 1 2
share ofgroup’s sales*
share ofgroup’s operating
profit* **
share of group’snet operating
assets* **
sappi limited
Sappi Fine Paper’s
operations conducted
from London are managed
through three regional
business units, Sappi Fine
Paper North America,
Sappi Fine Paper Europe
and Sappi Fine Paper
South Africa.
Sappi Forest
Products,
headquartered in
Johannesburg, is
Africa’s largest
forest products
business.
It operates three
business units,
Sappi Kraft, Sappi
Saiccor and
Sappi Forests.
sap
pi f
ine
pap
ersa
pp
i fo
rest
pro
du
cts
Sappi Fine Paper is the
leading producer of coated
fine paper in North America,
Europe and Africa. The
Company also produces a
range of uncoated graphic
and business paper, coated
and uncoated speciality
paper and casting release
paper used in the
manufacture of artificial
leather and textured
polyurethane applications.
It is approximately 55% self-
sufficient in pulp.
operating divisions description
Sappi Forest Products is a
pulp and commodity paper
products business. It is a
fully integrated business
which owns and manages
about 545,000 hectares
of plantations and produces
bleached and unbleached
paper pulp for own
consumption and market
pulp. It is the world’s largest
producer of dissolving pulp.
It also produces newsprint
and kraft packaging paper
and beneficiates wood
into timber products.
* Sappi trading with its head office in Hong Kong, sells the Group’s products internationally outside the homemarkets of the Company’s operating divisions.
** Excludes corporate region.■ ■ Pulp integration: Sappi produces unbleached and bleached paper pulp (largely for its own consumption) and
dissolving pulp. The Group’s total pulp demand exceeds its capacity and there are imbalances between typesof pulp required, grades produced, and within regions. The Group therefore sells and buys pulp. Sappi is90% – 95% pulp integrated post Mobile mill closure.
▲ Mobile mill (capacity 290,000 tons of uncoated business etc., closed subsequent to year-end).• Sappi Usutu mill manages the Usutu forests and the number of employees is included in the Sappi Usutu
mill section.� Includes 213 people at Mobile mill which has since been closed.† Including corporate, Sappi Trading and sales offices.
83%
56%
75%
43%
17%
25%
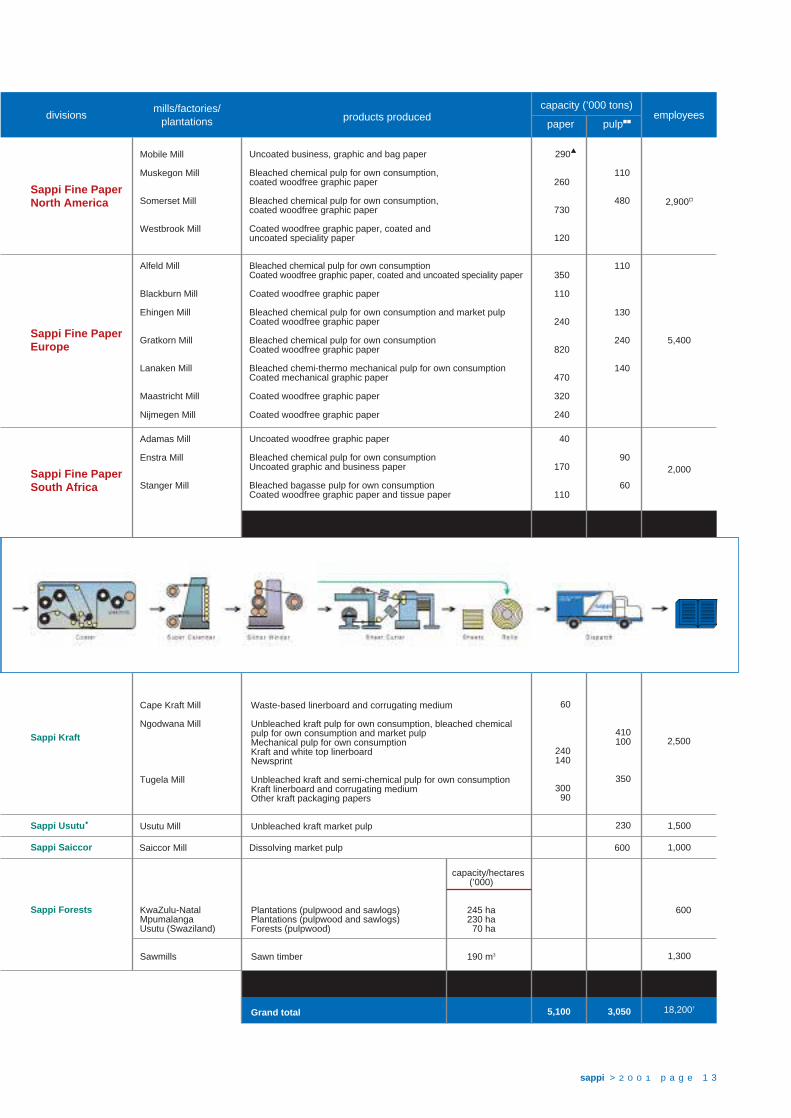
sappi > 2 0 0 1 p a g e 1 3
Cape Kraft Mill
Ngodwana Mill
Tugela Mill
Usutu Mill
KwaZulu-NatalMpumalangaUsutu (Swaziland)
Sawmills
Bleached chemical pulp for own consumptionCoated woodfree graphic paper, coated and uncoated speciality paper
Coated woodfree graphic paper
Bleached chemical pulp for own consumption and market pulpCoated woodfree graphic paper
Bleached chemical pulp for own consumption Coated woodfree graphic paper
Bleached chemi-thermo mechanical pulp for own consumptionCoated mechanical graphic paper
Coated woodfree graphic paper
Coated woodfree graphic paper
Sappi Fine PaperEurope
Uncoated business, graphic and bag paper
Bleached chemical pulp for own consumption, coated woodfree graphic paper
Bleached chemical pulp for own consumption, coated woodfree graphic paper
Coated woodfree graphic paper, coated and uncoated speciality paper
divisionsmills/factories/
plantations products producedcapacity (’000 tons)
paper pulp■■employees
Sappi Fine PaperNorth America
Mobile Mill
Muskegon Mill
Somerset Mill
Westbrook Mill
Alfeld Mill
Blackburn Mill
Ehingen Mill
Gratkorn Mill
Lanaken Mill
Maastricht Mill
Nijmegen Mill
Adamas Mill
Enstra Mill
Stanger Mill
290▲
110260
480730
120
2,900�
5,400
10,300
2,000
110350
110
130240
240820
140470
320
240
40
90170
60110
4,270 1,360
60
410100
240140
350300
90
230
830 1,690
5,100 3,050
Sappi Saiccor
Sappi Usutu•
Sappi Forests
Sappi Kraft
Sappi Fine PaperSouth Africa
1,300
18,200†
6,900
600
1,000
1,500
2,500
Uncoated woodfree graphic paper
Bleached chemical pulp for own consumptionUncoated graphic and business paper
Bleached bagasse pulp for own consumptionCoated woodfree graphic paper and tissue paper
Subtotal Sappi Fine Paper
Waste-based linerboard and corrugating medium
Unbleached kraft pulp for own consumption, bleached chemicalpulp for own consumption and market pulpMechanical pulp for own consumptionKraft and white top linerboardNewsprint
Unbleached kraft and semi-chemical pulp for own consumptionKraft linerboard and corrugating mediumOther kraft packaging papers
Unbleached kraft market pulp
capacity/hectares(’000)
Plantations (pulpwood and sawlogs) 245 haPlantations (pulpwood and sawlogs) 230 haForests (pulpwood) 70 ha
Sawn timber 190 m3
Subtotal Sappi Forest Products
Grand total
600Dissolving market pulpSaiccor Mill

sappi worldwide
sappi > 2 0 0 1 p a g e 1 4
•
NORTH AMERICA
• Fine Paper Mills (3)
• Sales Offices (24)
• Sappi Trading Office (1)
•
•
•• •
•••
• •• ••••
••• •••
••••• •••
04:00
am pm
12:00 22:00 • • • •
equator
CENTRAL AMERICA
• Sappi Trading Office (1)
SOUTH AMERICA
• Sappi Trading Office (1)
•

sappi > 2 0 0 1 p a g e 1 5
Because we have global brands and, above all,
because we have a global marketing and customer
service strategy, we can take advantage of changing
markets.
•
••
•••••••••
••
•
••• • •••• •
••••••••••
EUROPE
• Fine Paper Mills (7)
• UK Speciality Operations (1)
• Sales Offices (10)
• Sappi Trading Office (1)
ASIA
• Sappi Trading Offices (3)
CENTRAL AFRICA
• Sappi Trading Office (1)
•
AUSTRALIA
• Sappi Trading Office (1)
SOUTHERN AFRICA
• Corporate Head Office
(Johannesburg)
• Fine Paper Mills (3)
• Forest Products Mills (5)
• Sales Offices (8)
• Sappi Trading Offices (3)
•• ••••••
•
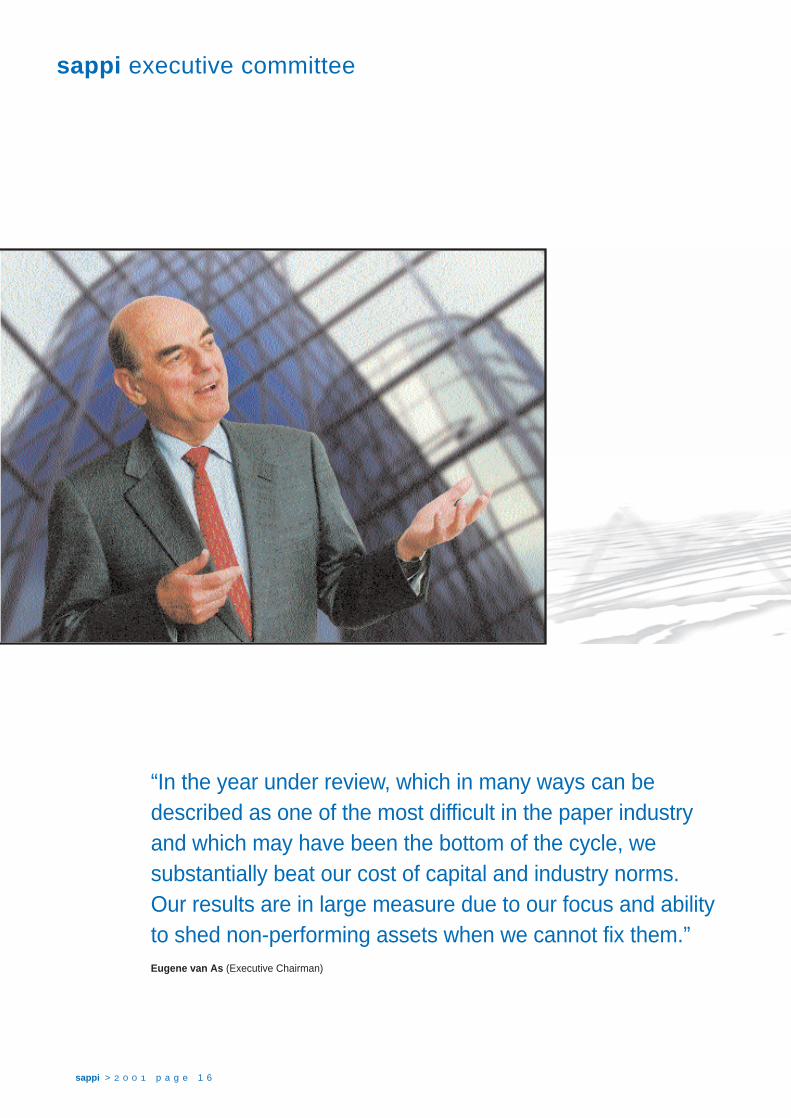
sappi executive committee
sappi > 2 0 0 1 p a g e 1 6
“In the year under review, which in many ways can bedescribed as one of the most difficult in the paper industryand which may have been the bottom of the cycle, wesubstantially beat our cost of capital and industry norms.Our results are in large measure due to our focus and abilityto shed non-performing assets when we cannot fix them.”Eugene van As (Executive Chairman)

sappi > 2 0 0 1 p a g e 1 7
Sappi Fine Paper – Bill SheffieldChief Executive Officer
“With the geographic spread of our assets wetake advantage of changing markets andcurrencies and we have, I believe, the mostproductive papermaking facilities and mostglobally recognised brands in the world.”
Sappi Forest Products – John JobChairman of SA Businesses
“In a tough environment both locally andinternationally, Sappi Forest Products continuedto generate good returns against its weightedaverage cost of capital. Our businesses haveproved this and to South African investors, Sappihas confirmed its status as a strong Rand hedge.”
Sappi Fine Paper Europe –Wolfgang PfarlChief Executive Officer
“Our European business performed well in spiteof very low demands. Inventory management andtight cost control were key contributing factors, aswere our relentless endeavours to best serve ourcustomers.”
Sappi Limited – Donald WilsonExecutive Director – Finance
“The Group’s debt is now well within our targetrange and the fine margins achieved in ourEuro 900 million facility, which we raised thisyear, will significantly reduce our finance costsgoing forward.”
Sappi Fine Paper North America –Monte HaymonPresident and Chief Executive Officer
“Faced with the biggest ever decline in demandfor our products in North America we focused onimproving our competitiveness through rigorouscost control and increasing our range of coatedfine paper for our customers.”
It is a challenging environment but
Sappi has the necessary strategic and
operational structure in place.
Last year I discussed how the globalisation of the Group and
the acquisition strategy that we followed should enable the
Group to deliver a strong performance across all its markets
over the cycle. Globalisation has created a Group that we
believe will fare better than most of its competitors when
the markets turn down as they started to do towards the end
of 2000.
In a decade Sappi has transformed itself from a purely South
African forest products company, exporting a modest
proportion of its production, to the number one provider of
coated woodfree paper in the world with the leading market
shares in Europe, North America and South Africa. Some
recently announced mergers and acquisitions have created
potential competitors with a higher installed capacity, but in
terms of real market share, we believe that Sappi still leads on
both continents and is unchallenged on a global basis.
Last year some challenged the sustainability of the Group’s
performance. It had performed well because of a strong up-
cycle, which was surely true. However, in the year under
review, which in many ways can be described as one of the
most difficult years in the paper industry in the last decade or
two, Sappi has demonstrated for the first time since embarking
on this strategy ten years ago, that the Group has the
fundamentals to deliver better than average returns. I believe
chairman’s statement
sappi > 2 0 0 1 p a g e 1 8
Sappi is now a business that can deliver more than its cost of
capital through the cycle. In the past year, which may have
been the bottom of the cycle, we substantially beat our cost of
capital. That may not always be possible, but I am very
confident that the business, as it is currently constructed,
should on average meet the targets we set for it.
Following the shocking and tragic events that took place on
11 September 2001 in the United States, the world faces the
spectre of global recession. The optimists may believe that it
can be avoided, but the likelihood is that we face a very difficult
year ahead. It is a challenging environment, but Sappi has
the necessary strategic and operational structure in place to
weather the storm that we face in the coming months.
One of Sappi’s key strengths is its global presence. We are not
focused only on Europe, North America, Africa or the East. We
participate in all those markets, but our main markets are the
large developed markets of Europe and North America. Even
as these markets face sharp declines, which in the coated
paper business may not have such a severe impact in the
coming year because of the very large inventory reduction that
took place in the past 12 months, their coated paper markets
will continue to grow in the long term at a pace faster than all
other paper products. We are, therefore, well placed to benefit
from that growth when it begins to absorb excess capacity.

Sappi’s acquisition of first-class assets and the rationalisation
of its operations (it is seldom realised that Sappi has closed
13 paper machines since 1994) brings with it strong operating
efficiencies. We have made great progress in sharing
knowledge between our operations in developing best practice
and having the right product in the right place at the right time.
We have globally recognised brands: Magno is today the most
widely distributed and recognised international paper brand in
the world – both in sales and in distribution – which covers
more than 100 countries. It is well supported by Somerset,
HannoArt, Lustro (the world’s oldest coated paper brand) and
Strobe, as well as the newer brands such as Diamond.
The geographic spread of our assets is another key
component to Sappi’s success. In particular it allows us to take
advantage of strong markets and weak currencies and,
therefore, minimise the impact of the fluctuation of currencies
and demand.
Because we have global brands and, above all, because we
have a global marketing and customer service strategy, we
can take advantage of changing markets. With the strong
Dollar our European operations are able to export more
products to North America. This is managed by our North
American business and extends the range of our products
available to the market.
sappi > 2 0 0 1 p a g e 1 9
The Group has followed a policy of being economically
integrated into pulp and our South African forest products
business is the key to the success of this strategy as it
significantly reduces Sappi’s exposure to the violent swings of
the pulp market. Our Forest Products division is an extremely
low-cost and efficient producer of pulp. It gives us a significant
competitive advantage.
Perhaps one of Sappi’s strongest differentiating features is its
focus on developing a global information technology platform.
I believe that Sappi is probably the only paper company that
has one technology platform across all its businesses. This
has been achieved over the last few years at great cost, but it
has given us a unique capability to offer our customers an
e-business facility on a global basis. Our customers order
directly from us, they can visit our website, learn about our
business, learn about our products and, above all, learn about
the facilities which we offer them by introducing them through
the Idea Exchange to the developments of their peer group
around the world.
The past year saw the explosion of the .com phenomenon and
its decline. Sappi resisted the temptation to join in many of
these start-up facilities that sought to provide an instant
solution to paper ordering and instant wealth to its founders.
Instead we stuck to our own development platform and have

declined by 15% by year-end, but in Europe they held up much
better declining by only 4%.
Three uncoated woodfree paper machines in Europe were
converted to coated woodfree production by two major
producers during the year. This added almost a million tons to
capacity. In the event, this new capacity has been managed
and absorbed by the industry, although a large overcapacity
now exists. Logically this will in time lead to further rationalisa-
tion of uncompetitive capacity.
Sappi had a difficult year. Operating income declined by
34%, but earnings before exceptional items declined by much
less because we were able to reduce our finance cost
significantly and had the benefit of changed tax legislation
in Germany which bolstered the Company’s after-tax income.
We can be pleased with Sappi’s performance in these
circumstances.
also become a founding partner of the pan-European
marketplace known as Expresso, which will provide the
industry with specific B2B trading capacity. All of this, of course,
only works when the participant has a sufficiently sophisticated
front-end system for its customers. Sappi is well advanced in
being able to provide that and we expect close to half the
volume of our business to come in that form by the end of the
next calendar year.
Last year the demand for coated woodfree paper, which is
covered elsewhere in this document, declined sharply in the
United States by 14%, the largest drop ever. There was also
a very sharp decline of 8% in Europe. In both markets
manufacturers curtailed output sharply to match their supply
with customer demand. We controlled inventories throughout
this process to our pre-determined criteria. Prices, of course,
came under pressure, but the fact that there was not excessive
inventory, moderated the price declines. In the USA they
chairman’s statement ( c o n t i n u e d )
sappi > 2 0 0 1 p a g e 2 0
Geographic diversity adds strength . . .Sales by region
Where the product is manufactured
North America 34%
Europe 43%
Southern Africa 23%
Where the product is sold
North America 36%
Europe 41%
Southern Africa 13%
Far East and other 10%

We have focused on reducing our finance costs. All the high-
cost debt which we took on to buy SD Warren in 1994 will have
been re-financed or repaid by December 2001, and our
finance costs will drop even more rapidly in the year ahead. It
was particularly encouraging when we went to the debt
markets a few months ago to be able to raise €900 million on
an unsecured basis at between 55 and 70 basis points above
the Interbank rate. This will ensure that we have fairly low
costs in the year ahead and for some time to come.
We continue to strive to get all our operating assets to optimal
performance. During the year we had to close, or announce
the closure of, two facilities. Our Mobile mill in Alabama, North
America, which had been losing money for some time, was no
longer viable and had to be closed. We took a significant cost
write-off, but we should benefit by about US$35 million a year,
before tax, in the years ahead. In the UK our Transcript mill,
which made carbonless paper and was a non-core asset, was
sappi > 2 0 0 1 p a g e 2 1
Sappi’s acquisition of first-class assets and the
rationalisation of its operations brings with it strong
operating efficiencies.
Free cash flows*(US$m)
700
600
500
400
300
200
100
0
* Cash retained from operating activities (post net working capital movements, finance costs, taxation and dividendspaid) less non-discretionary capital expenditure
01
361
00
628
99
454
EBITDA(US$m)
1,200
1,000
800
600
400
200
001
797
00
1,05
2
99
776
Net finance costs*(US$m)
200
180
160
140
120
100
80
60
40
20
0
* Net finance costs before capitalised interest
01
125
00
144
99
190
running at more or less break-even, but needed to invest
substantially in environmental projects, and this was not viable.
This mill will be closed at the end of the year.
Sappi today has a strong balance sheet. Our business
continues to generate healthy cash flows and we are poised to
benefit from any opportunities that arise in the market. Our
share price has recovered significantly, although it is still
trading at a lower multiple than most of our peer group. The
Group has, however, gained recognition from investors across
the world and as they get to know us better, I am hopeful that
the rating will improve further.
THE ROAD AHEAD
There continues to be a need for further consolidation in the
coated paper sector, although four or five of the major
producers now supply nearly 80% of the coated woodfree
market in North America and Europe, it is likely that there will

quarter of our fiscal year is going to be severely impacted by
the effect of 11 September 2001, and further dented by two of
our major profit earners, Somerset and Ngodwana, having
their once-in-30-months shut in that period. In terms of the new
International Accounting Standards this must now be
accounted for in the period where as previously the costs were
spread over 30 months. The first quarter earnings will
therefore decline quite sharply from the last quarter, but we
believe that earnings in the next three quarters will be similar to
those in the quarters just past unless there is a further
deterioration of economic conditions. There is some
opportunity for them to improve if the world economy starts to
recover in the middle of the year.
be further consolidation. Within this environment Sappi’s
strategy is to strengthen our leading position in this market in
Europe, North America and eventually in Asia, mainly through
low-cost organic growth. We also examine all acquisition
opportunities and we will participate in them when they appear
to be viable – when they produce a return that beats our cost of
capital and are in the medium term more advantageous than
buying back our own stock. We will not acquire assets simply
for the sake of becoming bigger and we will continue to
maintain a strong balance sheet.
In these volatile times and entering what looks like a global
recession, it is very difficult to judge the year ahead. The first
chairman’s statement ( c o n t i n u e d )
sappi > 2 0 0 1 p a g e 2 2
We have strong market focus . . .Sales by product group
Coated fine paper 62%
Our current geographic ownership . . .
Coated specialities 9%
Pulp 9%
Commodity paper 8%
Other 2%
Uncoated fine paper 10%North American investors 47%
South African investors 36%
European investors 17%

In our home market, South Africa, we have seen a further year
of development and the economic outlook is positive relative to
other world markets, although here too growth will be stunted.
Sappi is proud of the way in which we have been able to
contribute to the growth of development opportunities in the
community, particularly in supporting the growth of small
emerging entrepreneurs.
As we enter the new year, we also enter a period of a number
of changes in Sappi’s Board structure. Bill Sheffield joined us
in May this year as Chief Executive of Sappi Fine Paper and
joined the Board at that time. Early in the new year Monte
Haymon will retire as Chief Executive of North America,
although he will stay on as a Non-executive Chairman of that
company to the end of 2002. At the AGM next year two of our
long serving directors, Ken Lechmere-Oertel and Bill Hewitt,
come up for re-election, but they have decided not to make
themselves available for re-election. Both of them were
executive colleagues of mine over many years and have
sappi > 2 0 0 1 p a g e 2 3
We have globally recognised brands: Magno is today the
most widely distributed and recognised international
paper brand in the world – both in sales and distribution.
continued to offer counsel after their retirement. On behalf
of the Board I thank them both for their guidance and
commitment to Sappi. These changes have caused the Board
to relook at its structure. It will seek to broaden its composition
and representation over the next few months.
Next year I will retire as Chief Executive and the Board
announced at our results announcement last month that it is
their intention to evaluate internal and external candidates
during the course of the year and to make an announcement
on the new Chief Executive towards the middle of 2002. They
have asked me to stay on the Board as Non-executive
Chairman to help effect the transition in the leadership of the
Company, which I am delighted to be able to do.
In conclusion I want to thank all Sappi employees for the
special efforts they made in this last year, which has been
challenging. To my colleagues on the Board, thank you for
your counsel and guidance.

Question
Has the recent share performance been driven by the
prospects of a bid for Sappi?
Answer
It is clearly inappropriate ever to comment on rumours of a
bid. As far as the share performance is concerned we believe
the improvement since January 2001 reflects our changing
shareholder base and our performance relative to the peer
group. It is encouraging but the gap between us and our peers
remains disappointing, particularly when measured in
US Dollars. Our results in a very difficult year show the relative
quality of our assets and the fundamental strength of our
market position. Our cost management, financial discipline and
our balance sheet also reflect our strength. Further, for our
South African investors Sappi’s shares are a good Rand hedge.
Question
Can Sappi continue to grow in its chosen sector – coated
woodfree paper?
Answer
There is still significant scope to grow our market shares and to
expand into other markets. The coated woodfree sector has
itself averaged a compound growth of 7% per annum over the
last decade, notwithstanding the cyclical decline in 2001. We
will achieve this growth through taking advantage of value-
adding bolt-on acquisitions and through organic growth
opportunities.
Question
Is Sappi committed to the share buy-back programme and
what are Sappi’s priorities for free cash flow?
Answer
Sappi has budgeted to continue the share buy-back
programme in the new financial year and believes that this is
the optimal way to maximise shareholder value if we don’t find
any other suitable investment alternatives. We are focused on
the efficient deployment of capital. Our first priority is to reinvest
to maintain the strength of our current business. Thereafter we
will apply capital to the repurchase of shares and the
repayment of debt to maintain an efficient capital structure.
Acquisitions, in addition to beating our cost of capital, must be
better over the medium term than buying back shares.
Question
Sappi’s US shareholder base has grown rapidly over the
last year. Is this a priority for the Company?
Answer
The US has been a priority because of the size of its capital
markets and its paper sector and the relative values of
companies in the paper sector.
questions and answers
sappi > 2 0 0 1 p a g e 2 4
Eugene van As answers some questions
concerning Sappi
Sappi also believes that its shareholder base should more or
less reflect the location of its operations (in terms of assets and
turnover). We will continue to develop interest in our share in
the UK and Europe, North America and South Africa, and to
actively communicate with investors everywhere.
Question
What is Sappi’s vision of its future?
Answer
We intend to be the foremost company in our sector in terms of
creating value for our shareholders and our customers. We will
do this by continuing to grow the value-adding parts of our
business and eliminating underperforming assets, as we have
shown this year.
We have chosen the fast-growing coated fine paper sector, in
which we already have leading market shares, which we
intend to grow. We will continue to apply technology and to
innovate to develop new products for our customers, and more
effective ways of manufacturing and distributing them. We
will support our focus on coated woodfree paper with a high
level of pulp integration with the objective of reducing the
average cost of pulp to the Group and protecting us from pulp
volatility.
Question
With you approaching retirement, who will lead Sappi to
fulfil this vision?
Answer
The Sappi Board has announced the process through which
succession will be achieved when I retire late next year. The
Board is looking externally and internally for the best candidate
to run this global business and expects to be able to make a
further announcement towards the middle of 2002.
As Non-executive Chairman I will be available to provide
some continuity and to act as a sounding board for the new
Chief Executive. The new CEO will, however, take over the
leadership of the Group.
sappi > 2 0 0 1 p a g e 2 5
We intend to be the foremost company in our sector
in terms of creating value for our shareholders
and our customers.

sappi board
sappi > 2 0 0 1 p a g e 2 6
EXECUTIVE DIRECTORS
Eugene van As (62), Executive Chairman. Eugene van As
joined Sappi in 1977 as the Managing Director of Sappi Kraft
(Pty) Limited. In 1978, he was appointed Group Managing
Director and Chief Executive Officer, Sappi Limited, becoming
Executive Chairman in 1991. He is also a Director of the
Council for Scientific and Industrial Research, Chairman of the
African Self Help Association and Chairman of Business South
Africa. Mr van As was appointed to the Board of Sappi Limited
on 21 January 1977.
Monte Roy Haymon (64), Bachelor of Science in Chemical
Engineering, President and Chief Executive Officer of Sappi
Fine Paper North America since 1 October 1995. Previously
he had been President and Chief Operating Officer of Ply-Gem
Industries and, for 13 years, President and Chief Executive
Officer of Packaging Corporation of America, a division of
Tenneco Inc. Mr Haymon was appointed to the Board of Sappi
Limited on 10 October 1995.
John Leonard Job (56), BSc Hons (Rand), PhD (McGill),
Executive Director and Chairman of Sappi SA businesses.
Dr John Job joined Sappi in July 1999 and was appointed to
the Board on 1 August 1999. He has 25 years’ experience in
the chemical industry and was the former Chief Executive
Officer of Sentrachem, which was acquired by Dow Chemical
in 1997. He is a Director of the National Research Foundation
of South Africa.
Wolfgang Pfarl (56), Dipl Kfm, Chief Executive Officer of Sappi
Fine Paper Europe. Wolfgang Pfarl was appointed to his
present position with the completion in December 1997 of
Sappi’s acquisition of KNP Leykam. In 1989, Wolfgang Pfarl
was appointed Chairman of the Executive Board of Leykam-
Mürztaler and became Executive Chairman of KNP Leykam
after the merger in 1993 of the fine paper production activities
of N.V. Koninklijke KNP BT (now Buhrmann NV) and the
Austrian paper producer Leykam-Mürztaler. Mr Pfarl was
appointed to the Board of Sappi Limited on 31 December 1997.
William Herbert Sheffield (53), BSc (Chemistry), MBA, Chief
Executive of Sappi Fine Paper. Prior to joining Sappi on 1 May
2001, Bill Sheffield spent 13 years in the newsprint business
with Abitibi Consolidated, most recently managing Abitibi’s
international business. He was a founding board member of
Pan Asia Paper, the Asian newsprint joint venture based in
Singapore. Previous positions include Logistics, Marketing,
Operating and a 17-year career in the North American steel
sector. Mr Sheffield is a Canadian citizen, currently residing
in London.
Donald Gert Wilson (44), BCom CTA, Chartered Accountant
(South Africa), Executive Director – Finance of Sappi Limited.
He joined Sappi in April 1999 and was appointed to the Board
on 27 May 1999. He has held various executive financial
positions in the Barloworld Group, a South African-based
international industrial corporation, mainly within their
Caterpillar earthmoving division.
NON-EXECUTIVE DIRECTORS
David Charles Brink (62), MSc Eng (Mining), DCom (hc).
Dave Brink is currently the Executive Chairman of Murray and
Roberts Holdings Limited, Deputy Chairman of ABSA Group
Limited and of ABSA Bank Limited, Chairman of Unitrans
Limited, a Director of BHP Billiton plc and of BHP Billiton
Limited, and a Director of Sanlam Limited. Mr Brink was
appointed a Non-executive Director of Sappi Limited on
8 March 1994 and is currently Chairman of the Human
Resources Committee and a member of the Nomination
Committee of the Board of Directors of Sappi Limited.
Thomas Louw de Beer (66), Chartered Accountant (South
Africa). Tom de Beer was appointed Chief Executive, Finance,
of General Mining and Finance Corporation Limited in 1978
and as Financial Director of Gencor Limited in 1983 in which
capacity he remained until Gencor’s unbundling in 1993. He is
currently Chairman of Genbel South Africa Limited. He is also
a Director of Genbel Securities Limited, Gensec Bank Limited
and Iscor Limited. Mr de Beer is a member of the Audit
Committee and the Human Resources Committee of the Board
of Directors of Sappi Limited and Chairman of the Audit
Committee of Sappi Forests Products and Sappi Fine Paper
South Africa. He was appointed a Non-executive Director of
Sappi Limited on 28 February 1981.

sappi > 2 0 0 1 p a g e 2 7
John Steele Chalsty (68), BSc Hons (Wits), MSc (Wits), MBA
(Harvard). John Chalsty is Senior Adviser to Credit Suisse First
Boston, the international investment bank. He previously
served as the Chairman of the Board of Directors and former
Chief Executive Officer of Donaldson, Lufkin and Jenrette Inc.
and as Vice-chairman of the New York Stock Exchange Inc. He
is a member of the Board of Directors of AXA Financial Inc.,
Occidental Petroleum Company and Metromedia. Mr Chalsty
was appointed to the Board of Directors of Sappi Limited on
1 August 1998. Mr Chalsty is a member of the Audit Committee
of the Board of directors of Sappi Limited and Chairman of the
Audit Committee of Sappi Fine Paper North America.
William Edward Hewitt (66), Chartered Accountant (South
Africa) A.C.M.A. Bill Hewitt qualified as a chartered accountant
in 1957. He has held executive financial positions in the motor,
steel, transportation and retailing sectors and was Group
Financial Director, Toyota (South Africa), until 1987. He was
appointed Executive Director – Finance of Sappi Limited in
1987, a position he held until his retirement on 31 May 1999,
and was appointed to the Board of Sappi Limited on
1 September 1987. He continues to serve as a Non-executive
Director of Sappi Limited.
Derek Nigel Anthony Hunt-Davis (65), Chartered Accountant
(South Africa). Derek Hunt-Davis retired as an Executive
Director of Sankorp Limited in 1994. He served as Chief
Accountant and Chief Financial Officer of the Industrial
Development Corporation prior to becoming Group Financial
Director of the Premier Group Limited in 1982. Mr Hunt-Davis
was appointed a Non-executive Director of Sappi Limited on
19 February 1990 and is currently Chairman of the Audit
Committee and of the Nomination Committee of the Board of
directors of Sappi Limited.
Klaas de Kluis (65). From 7 January 1998 until 27 July 1998,
Klaas de Kluis acted as Chairman of the Executive Board of
N.V. Koninklijke KNP BT (now Buhrmann NV). He held
the position of Vice-chairman of the Executive Board of
N.V. Koninklijke KNP BT from March 1993 to April 1996.
Presently he is a member of the Supervisory Board of
Buhrmann NV as well as a number of public and private
companies in the Netherlands. Mr de Kluis is a member of the
Audit Committee of the Board of Directors of Sappi Limited and
Chairman of the Audit Committee of Sappi Fine Paper Europe.
Mr de Kluis was appointed to the Board of Sappi Limited on 13
January 1998.
Kenneth Richard Lechmere-Oertel (61), BSc (Chemical
Engineering). After having worked in various capacities with
Wiggins Teape and the Lion Match Group, Kenneth Lechmere-
Oertel joined Sappi as Managing Director, Sappi Fine Paper
South Africa, in 1978, was appointed as an Executive Director of
Sappi in 1981 and was appointed to the Board of Sappi Limited
on 6 March 1981. In 1992, he was appointed Executive Director,
Sappi, with particular responsibility for special projects. He
retired as an Executive Director in 1996, but continues to serve
as a Non-executive Director of Sappi Limited.
Franklin Abraham Sonn (62). Originally a graduate of the
University of the Western Cape and Unisa, Dr Franklin Sonn
subsequently received nine doctoral qualifications in law,
education, humanities and philosophy from various institutions
in Europe, North America and South Africa. Dr Sonn was the
South African Ambassador to the United States from 1995 to
1998. Prior to this position, he was a board member of seven
major South African banks and businesses and he currently
serves on the boards of a number of South African companies.
He was appointed to the Board of Sappi Limited on 1 July 1999.
Andries Gert Johannes Vlok (66), BSc, Hons B (B&A). André
Vlok spent virtually the whole of his career with Sappi, joining
as a technical assistant in 1962. He progressed through
various positions within Sappi including Mill Manager and
Managing Director of subsidiary companies and was
appointed Technical Director in 1988. He was appointed a
Director of Sappi on 15 February 1983. He retired as an
Executive Director in December 1998, but continues to serve
as a Non-executive Director of Sappi Limited.

sappi fine paper
sappi > 2 0 0 1 p a g e 2 8
leading the fine paper market“We are in all the high-end coated paper markets that
count. Being the most global coated fine paper company,
we have significant production capacity in Europe, North
America and South Africa and market presence throughout
the rest of the world. This global positioning helps us
deliver results in difficult times.”
Bill Sheffield – Chief Executive Officer – Sappi Fine Paper

OVERVIEW
Sappi Fine Paper is a global business with manufacturing
assets in eight countries on three continents, and
customers in over 100 countries.
Total paper capacity of 4.3 million tons and total sales of
US$3.4 billion.
We are the recognised global leader in coated fine paper
and have significant market share in all the key
international markets.
– North America 22%
– Europe 20%
– Africa 60%
Our fundamental strengths lie in:
• our focus on high-end branded coated paper (with well
known brands such as Magno and Somerset);
• our focus on driving growth through product and
technological innovation;
• the scale and efficiency of our operating assets; and
• the geographic spread of our manufacturing base and
distribution network.
We are building a solid track record of profitability, with
returns exceeding our cost of capital even in one of the
poorest years in the industry.
Strong cash flow generation despite poor trading
conditions.
An efficient and well-maintained asset park with machines
largely based in the North American and European
markets.
MANAGEMENT
Bill Sheffield Chief Executive Officer
Monte Haymon President and Chief Executive
Officer, North America
Wolfgang Pfarl Chief Executive Officer, Europe
Albert Lubbe Managing Director, South Africa
Hank Mollenhauer Marketing and Sales Director
Doeko Bosscher Technical Director
Mike Turner Chief Financial Officer
MARKETS AND OPERATING PERFORMANCE
It was a difficult year in the coated fine paper markets,
particularly in North America, which experienced its biggest
ever decline in apparent demand. A significant portion of
reduced North American shipments was due to de-stocking
amongst merchants, printers and publishers. Local US
producers were further impacted by increasing exports from
Europe and Asia. This resulted in significant pressure on price
and volume. We are very proud that in spite of the difficult
conditions, we outperformed our US competitors and that our
brand equity resulted in a gain in market share. Our North
American business responded to this softening market with
production curtailment, rigorous cost control and was assisted
by the falling pulp price.
In Europe there was also a significant decline in orders
throughout the coated fine sector as the inventory chain was
reduced. Producers curtailed approximately 2 million tons of
production in Europe to keep supply and demand in balance.
sappi > 2 0 0 1 p a g e 2 9
2,500
2,000
1,500
1,000
500
0
** Prices are list prices. Actual transaction prices could differ from prices depicted in the graph.Source: Pulp and Paper Week
Jan93
Coated woodfree prices – Germany(DM/metric ton**)90 gsm sheets
Jan94
Jan95
Jan96
Jan97
Jan98
Jan99
Jan00
Jan01
Coated woodfree prices – USA (East Coast)(US$/short ton**)No. 3 – 60 lb rolls
1,400
1,200
1,000
800
600
400
200
0
** Prices are list prices. Actual transaction prices could differ from prices depicted in the graph.Source: Pulp and Paper Week
Jan93
Jan94
Jan95
Jan96
Jan97
Jan98
Jan99
Jan00
Jan01
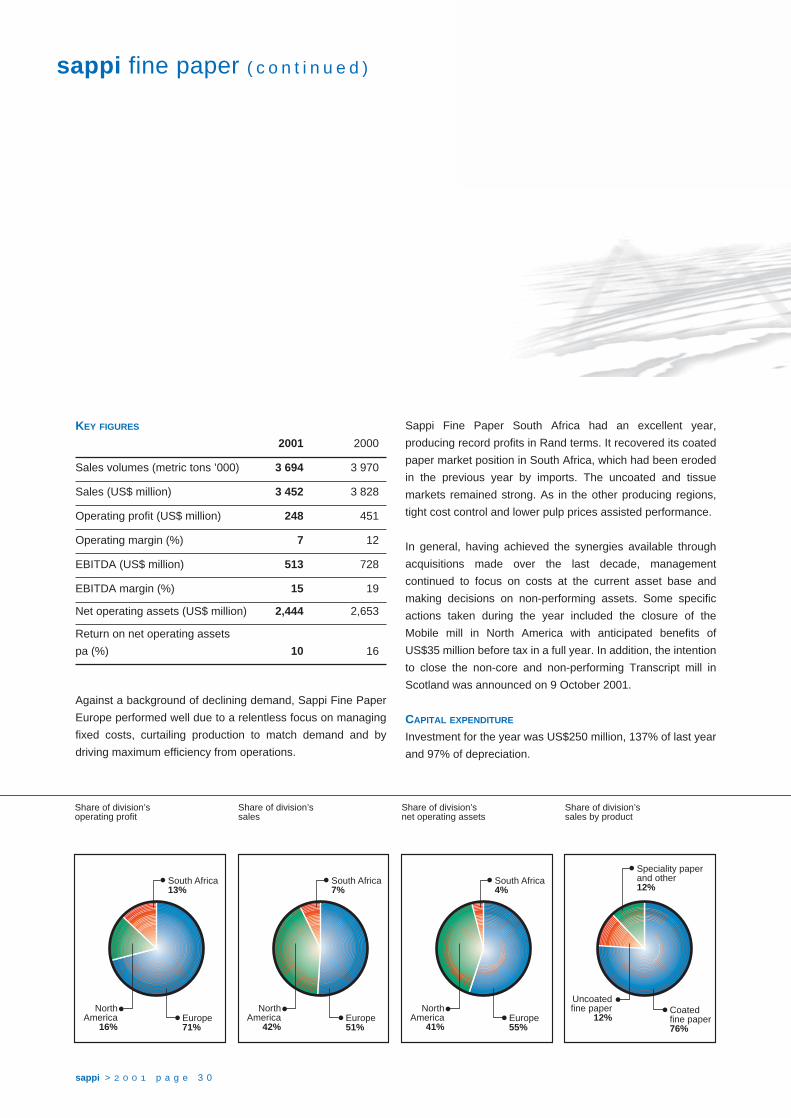
KEY FIGURES
2001 2000
Sales volumes (metric tons ’000) 3 694 3 970
Sales (US$ million) 3 452 3 828
Operating profit (US$ million) 248 451
Operating margin (%) 7 12
EBITDA (US$ million) 513 728
EBITDA margin (%) 15 19
Net operating assets (US$ million) 2,444 2,653
Return on net operating assets
pa (%) 10 16
Against a background of declining demand, Sappi Fine Paper
Europe performed well due to a relentless focus on managing
fixed costs, curtailing production to match demand and by
driving maximum efficiency from operations.
Sappi Fine Paper South Africa had an excellent year,
producing record profits in Rand terms. It recovered its coated
paper market position in South Africa, which had been eroded
in the previous year by imports. The uncoated and tissue
markets remained strong. As in the other producing regions,
tight cost control and lower pulp prices assisted performance.
In general, having achieved the synergies available through
acquisitions made over the last decade, management
continued to focus on costs at the current asset base and
making decisions on non-performing assets. Some specific
actions taken during the year included the closure of the
Mobile mill in North America with anticipated benefits of
US$35 million before tax in a full year. In addition, the intention
to close the non-core and non-performing Transcript mill in
Scotland was announced on 9 October 2001.
CAPITAL EXPENDITURE
Investment for the year was US$250 million, 137% of last year
and 97% of depreciation.
sappi fine paper ( c o n t i n u e d )
sappi > 2 0 0 1 p a g e 3 0
Share of division’ssales
South Africa7%
NorthAmerica
42%Europe51%
Share of division’soperating profit
South Africa13%
NorthAmerica
16%Europe71%
Share of division’snet operating assets
South Africa4%
NorthAmerica
41%Europe55%
Share of division’ssales by product
Speciality paperand other12%
Uncoatedfine paper
12%Coatedfine paper76%

Investment focused on high return projects. At Muskegon in
North America, Gratkorn in Europe, and Stanger in South
Africa, major projects were completed to upgrade operating
equipment. These projects will improve product quality and
reduce costs. In addition, increased capacity was created,
although this will not be utilised until customer demand picks
up. All our mills in North America are now in compliance with
the US environmental regulations (“cluster rules”).
PRODUCT AND BRAND DEVELOPMENT
Fine Paper’s strategy of focusing on brand equity continued to
reap benefits. The strength of many of the Group’s European
products, such as HannoArt and Magno, creates meaningful
opportunities for growth. For example, these products are now
penetrating new markets in North America and gaining rapid
acceptance. More than 80% of our products are sold under
Sappi brands.
The Group’s ability to use innovative coated paper technology
to grow was also demonstrated by the continued strong
performance from the unique Ultracast product used to
transfer textured designs to artificial leather and other fashion
fabrics.
Another successful brand, Lusterprint, which is used in the
production of pet food bags in North America was retained
following the closure of Mobile by transferring its manufacture
to other Sappi mills.
OUTLOOK
Looking forward it is anticipated that North America will feel the
brunt of a difficult first financial quarter. It is too early to predict
when the world economy will turn or the extent of the impact of
recent events on the pulp and paper industry.
Due to its low cost base, global brands and financial strength
Sappi Fine Paper is well positioned to either withstand further
difficulties should they continue in the ensuing quarters, or
quickly benefit from any sudden re-bound in advertising and
consumer confidence.
sappi > 2 0 0 1 p a g e 3 1
Sappi’s global position – capacity (’000 tons)Coated woodfree paper
0
Sappi
* Source: EMGESeptember 2001
3,215
M-Real
Stora Enso
APP
Oji Paper
Nippon Unipac
Lecta (CVC)
MeadWestvaco
UPM-Kymmene
Burgo 835
2,565
2,540
1,730
1,535
1,335
1,290
1,285
1,235
500 1,000 1,500 2,000 2,500 3,000 3,500

sappi forest products
sappi > 2 0 0 1 p a g e 3 2
delivering good results“Forest Products has in its portfolio the largest and
most efficient mill of its kind in the world. Saiccor’s
delivered cost to market, anywhere in the world, is
much lower than the next biggest player.”
John Job – Chairman of South African Businesses

sappi > 2 0 0 1 p a g e 3 3
OVERVIEW
Sappi Forest Products provides the Group with a pulp
revenue stream which hedges the pulp purchases of the
global fine paper business. This is integral to Sappi’s
strategy as it reduces the Group’s exposure to the swings
in the global pulp price.
The fundamental strength of this business lies in its low
cost of fibre production, which arises from it operating out
of South Africa combined with a relentless focus on cost
control.
Products include dissolving pulp (in which we have a
leading market share worldwide), kraft pulp, container-
board, packaging paper and newsprint, and solid wood
products. The division owns and manages about 545,000
ha of fast growing pine and eucalyptus plantations in
Southern Africa.
Forest Products enjoys leading market shares in South
Africa.
• Containerboard 50%
• Sackkraft 90%
• Newsprint 40%
Forest Products contributed 17% to Group sales and 43%
to Group operating profit.
EBITDA margin of 38% reflected very strong cash flows.
Return on net operating assets was 22%, far exceeding
the business’ cost of capital.
MANAGEMENT
John Job SA Chairman and
CEO Forest Products
Andrew Carr Managing Director – Sappi Kraft
Brian Dick Director, Human Resources
Andrea Rossi Director, Strategic Projects
Alan Tubb Managing Director, Sappi Saiccor
Jan Labuschagne Finance Director
Bertus van der Merwe Technical Director
Andre Wagenaar Managing Director, Sappi Forests
MARKETS
Pulp markets remained weak throughout the year with paper
pulp prices starting the year at US$710 per ton and ending the
year at US$450 per ton. Producers continued to curtail pro-
duction and by year-end inventories of the North American and
Scandinavian products had dropped to almost 1.5 million tons
(26 days of supply) and price increases of US$30 per ton were
announced for October.
OPERATIONAL PERFORMANCE
Despite the significant reduction in the pulp price the Forest
Products business delivered good results, due in the main to
our low input costs, our focus on the containment of fixed costs
and our on-going efforts to drive greater operating efficiencies.
In a tough environment both locally and internationally, we
were extremely pleased that we continued to generate good
returns against our cost of capital.
1,200
1,000
800
600
400
200
0
** Prices are list prices. Actual transaction prices could differ from prices depicted in the graph.Source: Pulp and Paper Week and RISI
Jan93
Northern bleached softwood kraft pulp(US$/metric ton**)CIF Northern Europe
Jan94
Jan95
Jan96
Jan97
Jan98
Jan99
Jan00
Jan01
Kraft linerboard(US$/metric ton**)CIF Northern Europe
800
700
600
500
400
300
200
100
0
** Prices are list prices. Actual transaction prices could differ from prices depicted in the graph.Source: Pulp and Paper Week
Jan93
Jan94
Jan95
Jan96
Jan97
Jan98
Jan99
Jan00
Jan01

sappi forest products ( c o n t i n u e d )
sappi > 2 0 0 1 p a g e 3 4
KEY FIGURES
2001 2000
Sales volumes (metric tons ’000) 2,412 2,770
Sales (US$ million) 732 890
Operating profit (US$ million) 194 224
Operating margin (%) 27 25
EBITDA (US$ million) 280 327
EBITDA margin (%) 38 37
Net operating assets (US$ million) 825 941
Return on net operating assets
pa (%) 22 21
The Kraft division enjoyed a record year, with the Kraft mills
collectively producing more product than ever. We are very
proud of this performance, which resulted from a concerted
marketing and sales effort particularly into international markets
where most of the growth was generated. The South African
markets remained robust.
Saiccor maintained good margins, despite a decrease in both
volume and price as a result of soft cellulose markets. During
the year production was curtailed by 100,000 tons to match
reduced world demand.
At Sappi Usutu production was stabilised at a substantially
higher level than prior years. We are currently undertaking a
major restructuring exercise at Usutu, particularly focusing on
the infrastructure and cost base. Once this process is finished
we anticipate significant benefits in the future.
Share of division’ssales by product
Share of division’ssales
Share of division’snet operating assets
Share of division’soperating profit
Forests6%
Saiccor39% Kraft
55%
Forest Products6%
Paper44% Pulp
50%
Kraft37%
Saiccor16%
Forests47%
Kraft40%
Saiccor60%

sappi > 2 0 0 1 p a g e 3 5
Saiccor developed a higher purity pulp and a broader
spectrum of products resulting in a greater range of customers’
end-uses. Having made sizeable investments in R&D facilities
and staff during the year, we anticipate further innovations in
the areas of product and process developments.
CAPITAL EXPENDITURE
Total investment in Forest Products for the year (excluding
plantations) was US$43 million which was 22% higher than
last year. Capex was focused on areas of environmental
management and maintaining the existing business.
OUTLOOK
There is some evidence that the global pulp market has
reached the bottom and that production discipline has paid off
with inventories well down.
However, the general environment is expected to remain
tough. Demand for Saiccor’s products is expected to remain
under pressure mainly due to significant inter-fibre
competition, however the mill’s low cost structure will help it
withstand better than most, what we expect to be a challenging
trading environment.
It is expected that the domestic containerboard market will
remain firm on the back of robust agricultural output.
Sappi’s global position – capacity (’000 tons)Dissolving pulp
0
Sappi Saiccor
* Source: LMC International, 2001
600
Rayonier
International Paper
Domsjo
Bratsky LPK
Buckeye
Indorayon
Tembec
Western Pulp
Borregaard 160
380
350
200
200
180
180
165
165
100 200 300 400 500 600 700
People underpin our world-class operations. At Sappi we are
committed to the health, welfare, safety and personal growth of
all our staff. We are also committed to the communities in
which our operations are based and from which we draw the
majority of our staff.
The global nature of the Company presents particular
personnel challenges and opportunities for us. We are proud of
our more than 18,000 staff from diverse cultures who work in
18 mills in eight countries, and four corporate and more than
50 sales offices in 16 countries. We actively encourage our staff
to fulfil their potential and offer pertinent training and
development through in-house training and tertiary education.
We create cross-regional cluster groups to deal with content
and process issues affecting the Company and we set
minimum standards for health and safety across the Group.
In November 2000, Sappi introduced the Sappi Academy to
accelerate the development and growth of our management
resources. Selected personnel are exposed to training and
discussion topics such as Sappi as a global company, its
strategic direction, organisational and management structure
and its culture. It is anticipated that the outcome of the
Academy will be the development of ever-improving inter-
regional collaboration, global networking and action-orientated
results. Based on its successful launch, the initiative is now
being driven worldwide.
Our focus on safety initiatives continues to provide good
results with safety incidents in Europe down a further 26% and
in the USA down a further 15% from the previous year.
During the year under review Sappi closed an operation in
North America and announced the closure of one in Scotland.
The Company is sensitive to the effect on employees of such
closures and separation benefits, including outplacement
support services, have been provided to affected employees.
As a result of our focus on core businesses, Sappi also sold off
the South African mining timber operation to a management
consortium, allowing its employees to develop in new directions.
Sappi is responsive to the needs of the communities in which it
operates. In South Africa, Sappi focuses on educational
support in science, mathematics and technology for grades
10 – 12 children from previously disadvantaged communities,
as well as upgrading teachers’ skills in these subjects. Our
American operations focus on volunteer efforts and support for
the youth through local community organisations.
Sappi strongly believes that education and training, in
the Company and the community, are fundamental to its
long-term success.
sappi’s people
sappi > 2 0 0 1 p a g e 3 6

Sappi is committed to the continuous improvement of our
environmental management through the principles of
sustainable development. We manage the natural resources
on which we depend in an inclusive manner, taking full account
of the importance of being socially responsible while achieving
long-term growth through sound economic performance.
To do this in a consistent way, we implement internationally
recognised environmental management systems throughout
all our operations. Six of our seven European mills have
common ISO 14001 and ISO 9001 certificates. In the UK,
Nash mill is ISO 14001 certified and Blackburn mill is expected
to be ISO 14001 compliant in 2002. Three European mills also
have the European-specific Eco-Management and Audit
System (EMAS) certification.
All our North American operations apply the principles of
ISO 14001 while complying with the environmental and health
principles developed and monitored by the American Forests
and Paper Association.
In South Africa, Sappi’s forests are ISO 14001 certified. Three
Sappi mills received their ISO 14001 certificate and the
remaining five expect certification by the end of 2002.
LEGISLATION
In each of its regions Sappi is regulated by a wide range of
laws which amongst others address issues such as waste
management, air and water emissions, odour, noise and energy
consumption. Through industry forums Sappi is actively involved
in developing new policies and regulations which affect the pulp
and paper industry. This is particularly relevant in parts of Europe
and in South Africa.
Regulations in all countries in which we operate require that
prior to any planned expansion an environmental impact
assessment of our project is conducted. Sappi proactively
engages in these processes to ensure that our current and
planned operations (and expansions) meet requirements.
In Germany, the European Integrated Pollution Prevention
Control (IPPC) Directive requires both Alfeld and Ehingen mills
to meet new requirements in the pulp mills’ effluent treatment
and the use of metal chelating agents by 2003.
Sappi in North America completed capital investments and
equipment upgrades necessary to comply with the US
Environmental Protection Agency “Cluster Rule” regulations.
Both Somerset and Muskegon mills completed testing and
licensing requirements prior to the April deadline. Capital
investments at Muskegon mill resulted in the elimination of
elemental chlorine from the pulp bleaching process.
In June 2001, all Sappi mills and forests in South Africa
registered their use of water in terms of the new National
Water Act. In line with future requirements of the Act and in
conjunction with regional and national authorities, Sappi has
instituted a process to develop integrated water and waste
management plans in all its mills to reduce water use (already
at very low levels compared to our international peer group),
recycle water where possible and to improve on the quality of
the liquid effluent.
INVESTMENT IN ENVIRONMENTAL PROJECTS
Sappi considers environmental operating expenses as part of
normal operating costs and therefore does not account for
them separately. However, we do separately account for
environmental capital expenses. In the year under review we
spent €4.5 million in Europe, US$38 million in North America
and ZAR52 million in South Africa on capital projects that
control air and water emissions or otherwise create an
environmental benefit.
Sappi continues to invest in projects to reduce solid waste
requirements, improve water utilisation, reduce wastewater
and air emissions.
• Waste management and water treatment
– Improvements in waste management and wastewater
sappi > 2 0 0 1 p a g e 3 7
environmental commitment

Somerset mill received recognition from the Maine Fish and
Wildlife Department for engineering and other assistance to
the Governor’s Hill State Fish Hatchery which raises all of the
lake trout and splake that are stocked in Maine’s lakes.
Sappi’s long-standing involvement in conservation projects
continues through our joint eco-tourism Forest and Wetland
Venture with the World Wide Fund For Nature (WWF) and
continues to explore new projects in sensitive indigenous
forests and wetlands. During 2001, the second project was
completed – an aerial boardwalk and observation tower in the
canopy of the Dlinza Forest in the town of Eshowe, KwaZulu-
Natal, designed to draw eco-tourists to the area and benefit
local communities.
environmental commitment ( c o n t i n u e d )
sappi > 2 0 0 1 p a g e 3 8
quality and usage were achieved in Europe at the Alfeld,
Ehingen and Lanaken mills.
– Plans to expand the Lignotech plant at Saiccor in South
Africa by 100,000 mtpa, further reducing the disposal of
solids by way of the sea pipeline.
• Air emissions
– Reductions in air and odour emissions were successful
at Gratkorn, Maastricht and Nijmegen mills.
– Significant improvements were also achieved in South
Africa, particularly at Ngodwana mill.
– Sappi’s Regional Air Emission Monitoring Project in
South Africa is demonstrating compliance with existing
laws and preparing us for new air emission standards
(expected in December 2002). The project will be
completed in February 2002.
OTHER ENVIRONMENTAL INITIATIVES AND ACHIEVEMENTS
A Groupwide working group has been established to focus on
assembling consistently measured emissions data from our
mills in all regions. Once collected, progress and improve-
ments will be monitored against current baselines and
international industry standards.
sappi > 2 0 0 1 p a g e 3 9
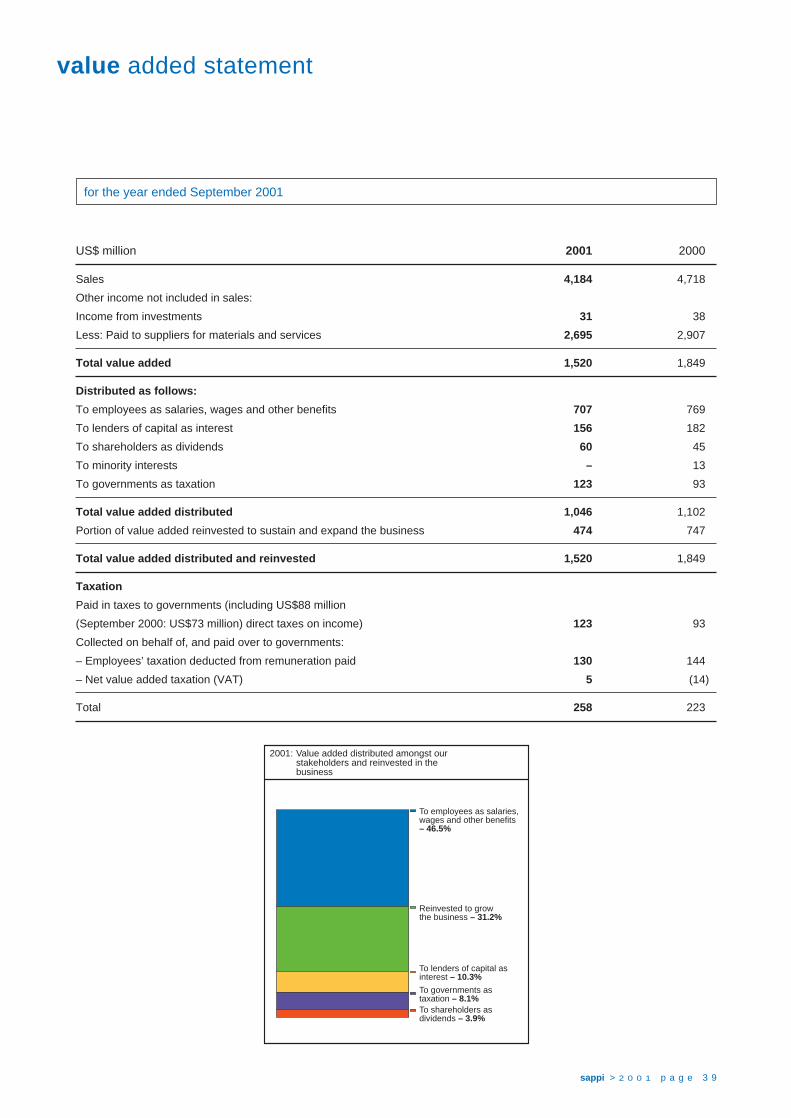
value added statement
for the year ended September 2001
US$ million 2001 2000
Sales 4,184 4,718
Other income not included in sales:
Income from investments 31 38
Less: Paid to suppliers for materials and services 2,695 2,907
Total value added 1,520 1,849
Distributed as follows:
To employees as salaries, wages and other benefits 707 769
To lenders of capital as interest 156 182
To shareholders as dividends 60 45
To minority interests – 13
To governments as taxation 123 93
Total value added distributed 1,046 1,102
Portion of value added reinvested to sustain and expand the business 474 747
Total value added distributed and reinvested 1,520 1,849
Taxation
Paid in taxes to governments (including US$88 million
(September 2000: US$73 million) direct taxes on income) 123 93
Collected on behalf of, and paid over to governments:
– Employees’ taxation deducted from remuneration paid 130 144
– Net value added taxation (VAT) 5 (14)
Total 258 223
2001: Value added distributed amongst ourstakeholders and reinvested in thebusiness
To employees as salaries,wages and other benefits– 46.5%
Reinvested to growthe business – 31.2%
To lenders of capital asinterest – 10.3%
To governments astaxation – 8.1%To shareholders asdividends – 3.9%

HIGHLIGHTS
• Arranged €900 million (US$770 million) finance facility at
favourable interest rates
• Repurchase of 12 million (5%) of our issued shares at an
average price of US$7.62 (ZAR59) per share
• Net debt reduced by a further US$142 million to
US$1.1 billion
• Debt-to-total capitalisation ratio at 30%
• Cash interest cover 6.2 times
OPERATING REVIEW
The following table sets out sales and operating income by
business unit (operating income percentages expressed of
sales of the applicable business unit):
September % of September % of
2001 sales 2000 sales
US$ million US$ million
SALES:
Sappi Fine Paper
North America 1,442 34.5 1,607 34.1
Europe 1,781 42.5 1,994 42.2
South Africa 229 5.5 227 4.8
Total
Fine Paper 3,452 82.5 3,828 81.1
Forest Products 732 17.5 890 18.9
Consolidated sales 4,184 100 4,718 100
September % of September % of
2001 sales 2000 sales
US$ million US$ million
OPERATING INCOME:
Sappi Fine Paper
North America 40 2.8 179 11.1
Europe 177 9.9 252 12.6
South Africa 31 13.5 20 8.8
Total
Fine Paper 248 7.2 451 11.8
Forest Products 194 26.5 224 25.2
Corporate 4 – (3) –
Consolidated
operating income 446 10.7 672 14.2
Year ended September 2001 (“2001”) compared to year
ended September 2000 (“2000”)
SALES
The year was characterised by difficult market conditions
resulting in low demand for most of our products. In 2001, total
sales volumes decreased by 9.4%, from 6.7 million to
6.1 million tons with a decline in Fine Paper and Forest
Products divisions of 0.3 and 0.4 million tons, respectively. In
North America the industry faced the largest ever decline in
demand and the strength of the Dollar led to high levels of low-
priced coated woodfree paper imports. Apparent consumption
for coated woodfree paper as measured by shipments from
producers net of imports and exports was 14% below last year
in the USA and 8% in Europe. Real consumption was probably
considerably better than apparent consumption, as most
customers reduced inventories throughout the period. In North
America and Europe, paper production volumes were
managed to meet consumption demand with production
curtailment throughout the year.
management’s discussion and analysis of results(incorporating financial director’s report)
sappi > 2 0 0 1 p a g e 4 0

sappi > 2 0 0 1 p a g e 4 1
Consolidated sales in 2001 decreased by 11.3% to
US$4,184 million, with a decline in Fine Paper and Forest
Products divisions of US$376 million and US$158 million,
respectively. The results of Sappi Forest Products and Sappi
Fine Paper Europe in local currency terms were, however,
positively affected by the depreciation of the Rand and the
Euro against the US Dollar in 2001.
Sappi Fine Paper. The volume of fine paper sold in 2001 by
Sappi Fine Paper decreased by 7.0%, from 4.0 million to
3.7 million tons. Sappi Fine Paper Europe’s volumes
decreased by 9.0% to 2.2 million tons while Sappi Fine Paper
North America’s sales volume decreased by 6.1% to
1.2 million tons in 2001. Sappi Fine Paper South Africa’s
volumes sold increased by 7.1% to 0.3 million tons due to
recovery of market position and an improved uncoated fine
paper and tissue market in South Africa.
Average selling prices per ton were US$1,165, US$821 and
US$795 for the North American, European and South African
operations, respectively, compared to US$1,219, US$837 and
US$844, respectively, in the prior year. In local currencies,
European and South African selling prices increased by 7.7%
and 14.5%, respectively.
Sappi Forest Products. Sales volumes of paper pulp,
dissolving pulp, commodity paper products and timber
products decreased by 0.4 million tons or 12.9% in 2001. This
decrease is mainly attributable to the disposal of Novobord in
2000 and Mining Timber in 2001. The average prices for
dissolving pulp increased by 3.5%. For commodity paper
products, the average price increased by 4.5% to US$483 per
ton in 2001. The average price for timber products decreased
by 50.0% to US$45 per ton, following the disposal of Novobord
and Mining Timber.
OPERATING EXPENSES
Group operating expenses (comprising cost of goods sold and
selling, general and administration expenses) decreased by
7.6% to US$3.7 billion in 2001. This decrease was mainly due to
the lower volume of sales. Cost of sales per ton increased by
only 2.0% compared to last year, despite reduced sales
volumes, mainly due to cost containment and the effect of the
appreciation of the Dollar against the Euro and the Rand.
Selling, general and administrative expenses were
US$363 million, a decrease of 8.3%, in line with the decrease
in volume sold.
OPERATING INCOME
Consolidated operating income decreased significantly by
US$226 million, or 33.6%, to US$446 million, which occurred
mainly at Sappi Fine Paper North America and Sappi Fine
Paper Europe.
Operating margin decreased significantly to 10.7% in 2001
(14.2% in 2000). This decrease is mainly due to lower sales
volumes, lower selling prices and production curtailment.
Sappi Fine Paper . Operating income decreased by 45.0% to
US$248 million, and operating margin decreased to 7.2% from
11.8% in 2000.
Sappi Fine Paper Europe had a reduction in operating income
of 29.8% to US$177 million in 2001. The operating margin
decreased to 9.9% in 2001 from 12.6% in 2000. Improved
productivity and cost reductions, as well as the decrease in
input cost of pulp, contained this decrease.
For Sappi Fine Paper North America, operating income
decreased significantly by 77.7%, to US$40 million, and
operating margin decreased to 2.8% in 2001, from 11.1% in
2000. This decrease was mainly due to competition from low-
priced imports, reduced demand, curtailment of production to
manage inventories and the continued slowdown of the
US economy.

Sappi Fine Paper South Africa had an increase in operating
income of 55.0% to US$31 million in 2001. This increase is
mainly due to increased sales volumes and the depreciation of
the Rand against the US Dollar. Operating margin increased to
13.5% in 2001, from 8.8% in 2000.
Sappi Forest Products . Sappi Forest Products operating
income decreased by 13.4% to US$194 million in 2001. This is
mainly attributable to lower sales volumes. Operating margin
increased slightly to 26.5% in 2001, from 25.2% in 2000,
mainly due to cost containment, increased productivity and
internal efficiencies.
NON-TRADING LOSS
Non-trading loss represents all income received from and
expenses incurred on activities which do not constitute normal
trading and includes profits and losses on the disposal of fixed
assets. Also included are mill closure and asset impairment
costs when these occur. Non-trading loss of US$207 million
in 2001 (US$2 million in 2000) consisted primarily of a
US$183 million pre-tax charge for the write-off of the assets
and closure costs relating to the Mobile mill, and a non-
recurring charge of US$9 million relating to the write-off of
deferred finance cost resulting from the refinancing of the US
credit facility in 2001.
NET FINANCE COSTS
Net finance costs consists of interest expense, net of interest
received, interest capitalised and forex gains and losses. Net
finance costs decreased to US$92 million in 2001. The
decrease of US$5 million in net finance costs resulted mainly
from lower prevailing interest rates and lower levels of
borrowings, as well as the refinancing of certain higher cost
loans. Cash interest cover decreased to 6.2 times for 2001
(7.3 times in 2000).
Our policy is to capitalise the holding costs of plantations in
Southern Africa and the pre-commissioning finance costs on
major capital expenditure projects. Interest capitalised in 2001
and 2000 were US$33 million and US$47 million, respectively.
The South African Producer Price Index is used as a limit in
determining the amount of interest to be capitalised in respect
of the holding cost of plantations. The reduction in interest
capitalised in 2001 is due to lower interest rates and the effect
of the appreciation of the US Dollar against the Rand.
TAXATION
Taxation charge was US$9 million, decreasing by
US$188 million from 2000. The Group tax charge for the year
was reduced as a result of lower levels of profit as well as the
US$73 million tax credit, relating to the Mobile mill closure
charge, resulting in a 6% effective rate for the year. The
effective rate for ongoing operations excluding Mobile mill was
approximately 25% for the full financial year and was reduced
by the geographic split of earnings, in particular the lower
proportion of earnings in North America, and a reduction in the
German tax rate.
NET INCOME
Net income decreased significantly by US$225 million to
US$138 million in 2001 (2000: US$363 million). Earnings per
share decreased by 61.4% to US59 cents per share in 2001
from US153 cents per share in 2000. This reduction in net
income and earnings per share is due to lower sales volumes
and selling prices, as well as the US$110 million after-tax
charge resulting from the closure of the Mobile mill in 2001.
Earnings before exceptional items per share (headline)
decreased by 22.6% to US113 cents per share in 2001 from
US146 cents per share in 2000.
FINANCIAL REPORTING
Change in accounting policies
There have been a number of accounting policy changes in
2001. This is mainly due to the numerous changes to South
African accounting standards to harmonise with International
Accounting Standards. We changed our accounting policy with
management’s discussion and analysis ( c o n t i n u e d )
sappi > 2 0 0 1 p a g e 4 2
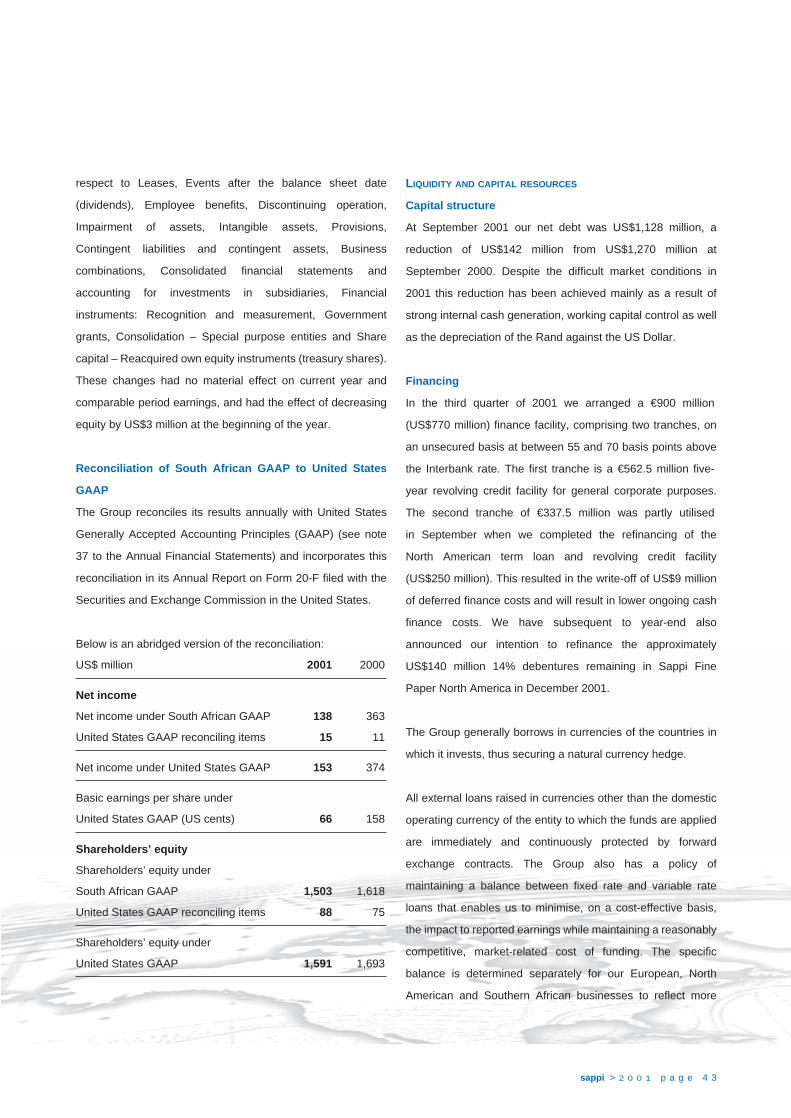
sappi > 2 0 0 1 p a g e 4 3
respect to Leases, Events after the balance sheet date
(dividends), Employee benefits, Discontinuing operation,
Impairment of assets, Intangible assets, Provisions,
Contingent liabilities and contingent assets, Business
combinations, Consolidated financial statements and
accounting for investments in subsidiaries, Financial
instruments: Recognition and measurement, Government
grants, Consolidation – Special purpose entities and Share
capital – Reacquired own equity instruments (treasury shares).
These changes had no material effect on current year and
comparable period earnings, and had the effect of decreasing
equity by US$3 million at the beginning of the year.
Reconciliation of South African GAAP to United States
GAAP
The Group reconciles its results annually with United States
Generally Accepted Accounting Principles (GAAP) (see note
37 to the Annual Financial Statements) and incorporates this
reconciliation in its Annual Report on Form 20-F filed with the
Securities and Exchange Commission in the United States.
Below is an abridged version of the reconciliation:
US$ million 2001 2000
Net income
Net income under South African GAAP 138 363
United States GAAP reconciling items 15 11
Net income under United States GAAP 153 374
Basic earnings per share under
United States GAAP (US cents) 66 158
Shareholders’ equity
Shareholders’ equity under
South African GAAP 1,503 1,618
United States GAAP reconciling items 88 75
Shareholders’ equity under
United States GAAP 1,591 1,693
LIQUIDITY AND CAPITAL RESOURCES
Capital structure
At September 2001 our net debt was US$1,128 million, a
reduction of US$142 million from US$1,270 million at
September 2000. Despite the difficult market conditions in
2001 this reduction has been achieved mainly as a result of
strong internal cash generation, working capital control as well
as the depreciation of the Rand against the US Dollar.
Financing
In the third quarter of 2001 we arranged a €900 million
(US$770 million) finance facility, comprising two tranches, on
an unsecured basis at between 55 and 70 basis points above
the Interbank rate. The first tranche is a €562.5 million five-
year revolving credit facility for general corporate purposes.
The second tranche of €337.5 million was partly utilised
in September when we completed the refinancing of the
North American term loan and revolving credit facility
(US$250 million). This resulted in the write-off of US$9 million
of deferred finance costs and will result in lower ongoing cash
finance costs. We have subsequent to year-end also
announced our intention to refinance the approximately
US$140 million 14% debentures remaining in Sappi Fine
Paper North America in December 2001.
The Group generally borrows in currencies of the countries in
which it invests, thus securing a natural currency hedge.
All external loans raised in currencies other than the domestic
operating currency of the entity to which the funds are applied
are immediately and continuously protected by forward
exchange contracts. The Group also has a policy of
maintaining a balance between fixed rate and variable rate
loans that enables us to minimise, on a cost-effective basis,
the impact to reported earnings while maintaining a reasonably
competitive, market-related cost of funding. The specific
balance is determined separately for our European, North
American and Southern African businesses to reflect more

accurately the different interest rate environments in which
these businesses operate. We monitor market conditions and
may utilise interest rate derivatives to alter the existing balance
between fixed and variable interest loans in response to
changes in the interest rate environment.
Our gross debt at the end of 2001 and 2000 is detailed as
follows:
By currency:
September September
2001 % of 2000 % of
US$ million total US$ million total
US Dollar 859 57.2 737 51.2
Euro 485 32.2 491 34.1
South African Rand 159 10.6 201 14.0
UK Pound Sterling 11 0.7
Total 1,503 100.0 1,440 100.0
By maturity:
2001 – – 162 11.3
2002 489 32.5 426 29.6
2003 378 25.2 107 7.4
2004 122 8.1 127 8.8
2005 82 5.5 210 14.6
2006 (2000: Thereafter) 59 3.9 408 28.3
Thereafter 373 24.8 – –
Total 1,503 100.0 1,440 100.0
Of gross debt, at September 2001, US$489 million is payable
within one year. This is an increase of US$327 million over
2000, mainly as a result of the US$243 million convertible
notes which mature in August 2002. The Group has adequate
cash on hand and short and long-term banking facilities to
meet these short-term commitments. At September 2001,
Sappi’s divisions had aggregate unused borrowing facilities
availability of US$1,359 million (US$188 million in South
Africa, US$79 million in the United States and US$1,092
million in Europe). Unused borrowing facilities at the end of
2000 were US$784 million. At September 2001 the ratio of net
debt to total capitalisation was 30%, down from 33% at the end
of 2000. The ratio of net borrowings to equity at September
2001 was 75% (76% in 2000.)
Foreign exchange
Sappi made sales in a range of currencies in 2001 and 2000 as
follows:
September September
2001 2000
% %
(Percentage of sales)
US Dollar 48.6 49.5
South African Rand 11.9 12.9
Euro (1) 30.2 21.7
UK Pound Sterling 7.1 6.9
Other 2.2 9.0
100.0 100.0
(1) Including currencies of countries that linked their currencies to the Euro.
The principal currencies in which our subsidiaries conduct
business are the US Dollar, Euro and Rand. In Europe and
North America, sales and expenses are generally
denominated in Euro and US Dollars, respectively. However,
pulp purchases in Europe are mainly also denominated in
US Dollars.
In Southern Africa, local sales are denominated in Rands, and
exports, which represent approximately 47% of sales, are
management’s discussion and analysis ( c o n t i n u e d )
sappi > 2 0 0 1 p a g e 4 4

sappi > 2 0 0 1 p a g e 4 5
denominated mainly in US Dollars. Expenses incurred are
generally denominated in Rands. Exports to other regions
are mainly denominated in US Dollars. The depreciation of the
Rand also tends to enhance the Rand value of exports from
South Africa and have a positive effect on gross margins on
exports and domestic sales which are priced relative to
international Dollar prices.
In 2001 and 2000, the Dollar appreciated, on average, by 8.9%
and 11.9% against the Euro, and by 21.5%, and 8.9% against
the Rand, respectively, compared to the average exchange
rate for each respective prior year. Year on year, the Dollar
depreciated by 4.2% against the Euro, whilst in 2000, the
Dollar appreciated by 19.3% against the Euro. The Dollar
appreciated in Rand terms by 23.6% and 20.4% in 2001 and
2000, respectively. In the last quarter of 2001 alone, the Rand
depreciated by 10.8% against the Dollar.
The following table sets out the US Dollar exchange rates used
in preparing our consolidated financial statements:
2001 2000 2001 2000
Income statement Balance sheet
Exchange rate
US Dollar/SA Rand 7.9574 6.5472 8.9386 7.2240
Euro/US Dollar 0.8855 0.9720 0.9167 0.8777
Our foreign exchange policy consists of the following principal
elements:
• All external borrowings are taken in the currency of the
operating company concerned and, if not, then the exposure
is fully and specifically hedged immediately.
• All major capital expenditure in foreign currencies is hedged
immediately on approval of the project.
• All trade receivables/payables are hedged on a net basis
from the time the transactions are consummated.
• Anticipated exposures for near-term (quarterly) trading are
netted at central treasury and appropriate hedging
techniques evaluated.
• Variations in this policy are from time to time considered, but
are always subject to prior Board approval.
Translation risks are not hedged. Sappi manages its foreign
exchange translation exposure by financing its equity
investments in different currencies with similar currency ratios
of equity to debt finance. This does not necessarily protect the
absolute amounts of equity investment or of profit after finance
costs from exchange rate movements.
CAPITAL EXPENDITURES
Capital expenditures(1) in 2001 and 2000 consisted of the
following:
September September
2001 2000
US$ million US$ million
Sappi Fine Paper
Sappi Fine Paper North America 99 96
Sappi Fine Paper Europe 116 78
Sappi Fine Paper South Africa 35 9
Total 250 183
Sappi Forest Products 43 35
Corporate – 3
Consolidated total 293 221
(1) Excludes investment in plantations, which amounted to approximately
US$28 million and US$32 million in 2001 and 2000, respectively.

management’s discussion and analysis ( c o n t i n u e d )
sappi > 2 0 0 1 p a g e 4 6
Of the US$293 million of capital expenditure in 2001,
approximately US$154 million related to investment to
maintain operations. Total capital expenditure, including the
investment in plantations, amounted to 91% of depreciation,
amortisation and fellings. This percentage is expected to
decline to approximately 70% in 2002.
OTHER EVENTS/FACTORS
Share buyback
At a general meeting of shareholders held on 15 December
2000, a special resolution granting general authority for Sappi
subsidiaries to purchase Sappi shares subject to the
provisions of the South African Companies Act 61 of 1973, as
amended, and the Listings Requirements of the JSE Securities
Exchange, was approved. At the annual general meeting of
members held on 1 March 2001, a special resolution granting
authority to Sappi or Sappi subsidiaries to buy back up to 20%
of the issued shares of Sappi Limited in any one financial year,
was approved. This authority expires at the next annual
general meeting, unless renewed thereat. In terms of the
Companies Act subsidiaries may not hold more than 10% of
the issued share capital of the parent company.
Following the approval on 15 December 2000, 12 million
shares had been repurchased by subsidiaries at a total cost of
approximately US$94 million at an average price of US$7.62
(ZAR59.44) at the end of 2001.
In terms of the JSE Securities Exchange regulations,
companies may not repurchase its shares for periods of
40 trading days prior to the announcement of half-year and
full-year results. We apply a voluntary restriction on
repurchases of seven trading days prior to the announcement
of first and third-quarterly results.
Shareholder base
Over the past four years, our shareholder base has changed
from one of a high concentration, where two shareholders held
approximately 46% of the shares, to a substantially more
widespread shareholder base. According to the information
currently available to us, no shareholder holds more than 10%
of the share capital of the Company and, consequently, the
liquidity of the Company’s shares has improved considerably.
At 12 November 2001, the shareholder base of Sappi Limited
was split as follows: North America (47%), South Africa (36%)
and UK and Continental Europe and others (17%).
Mill closures
We closed the Mobile mill in Alabama, USA, and have
provided a US$110 million after-tax charge for the write-off of
the assets and closure costs. Subsequent to year-end we
announced the intention to close the Transcript mill in
Scotland. The closure costs are expected to amount to
US$10 million after tax.
Disposal of Mining Timber
Effective 1 October 2000, we disposed of our mining timber
operations in South Africa.
Dividends
Sappi Limited declared dividends in respect of the ordinary
shares of US26 cents and US25 cents per share for 2001 and
sappi > 2 0 0 1 p a g e 4 7
2000 respectively. In May 1998 we announced that future
dividends would be considered only on an annual basis. The
Group aims to declare regular dividends which incorporate,
over time, real growth for shareholders. To this end dividend
cover in each year will vary in line with changes in the business
cycle, but will be maintained at a long-term average of three
times. Our dividends were covered 2.3 and 6.1 times in 2001
and 2000 respectively.
Performance against financial objectives
Group objectives for operating performances shown on page
49 are Dollar-based and are expressed as returns in
percentages which recognise the current economic factors of
the countries in which we operate and the expectations of our
investors. These percentages are reviewed from time to time
in the light of changing circumstances, in particular with regard
to risk-free interest rates, market risk premiums, inflation and
the cost of debt.
Insurance
The Group has an active programme of risk management in
each of our geographical operating regions to address and
to reduce exposure to risk and business interruption. All
production and distribution units are audited regularly and are
subject to risk assessments, which receive the attention of
senior management. The risk programmes are co-ordinated at
Group level in order to achieve a harmonisation of methods.
Furthermore we follow a practice of insuring our assets against
unavoidable loss arising from catastrophic events. These
include fire, flood, explosion, earthquake and machinery
breakdown as well as the business interruption, which may
result from these events. Specific environmental risks are also
insured.
We accept internal insurance deductibles which vary,
depending on the magnitude and nature of risk, and insure a
further layer through a captive insurance company, thereafter
accessing the world insurance markets. Our insurance
structure has both regional and global layers, and the majority
of insurance is placed with our own captive insurance
company which in turn reinsures the vast majority of the risk
with third-party insurance companies.
The Group renews its insurance cover annually on
1 November. Due to a substantial hardening of the insurance
market and following the events on 11 September, placement
of Property Damage insurance cover has become considerably
more difficult this year. Self-insured deductibles for any one
occurrence have increased to US$12.5 million in the South
African and European regions and to US$19.8 million in North
America. There are no aggregate limits. Contrary to previous
years, Property Damage is no longer covered to Full Value,
although Maximum Foreseeable losses are exceeded
comfortably. Furthermore, Property Damage cover now
generally excludes losses from acts of terrorism. We have
covered these separately to a value of US$250 million.

financial performance
sappi > 2 0 0 1 p a g e 4 8
516
766
776
1,05
2
797
2,000
1,800
1,600
1,400
1,200
1,000
800
600
400
200
0
Group cash flow (EBITDA) andoperating profit(US$m)
97 98 99 00 01
Operating profitGroup cash flow (EBITDA)
238
409
395
672
446
180
160
140
120
100
80
60
40
20
0
Earnings growth(US cents)
97
13 15
98
53
45
99
51
73
0015
3
146
01
59
113
Earnings per shareEarnings per share beforeexceptional items
3,000
2,500
2,000
1,500
1,000
500
0
Net debt(US$m)
97
2,62
0
98
2,70
3
99
2,10
9
00
1,27
0
01
1,12
8
500
450
400
350
300
250
200
150
100
50
0
Capital expenditure compared to depreciation,amortisation and fellings(US$m)
DepreciationFellingsAmortisation*
97
221
291
1839
41
01
300
293
3021
28
00
320
221
3624
32
99
336
234
2223
32
98
311
247
2026
40
Capex – Plantations* Primarily relates to plantations
Capex – Fixed assets
1,000
900
800
700
600
500
400
300
200
100
0
Net asset value per share(US cents)
97
894
98
802
99
792
00
870
01
821
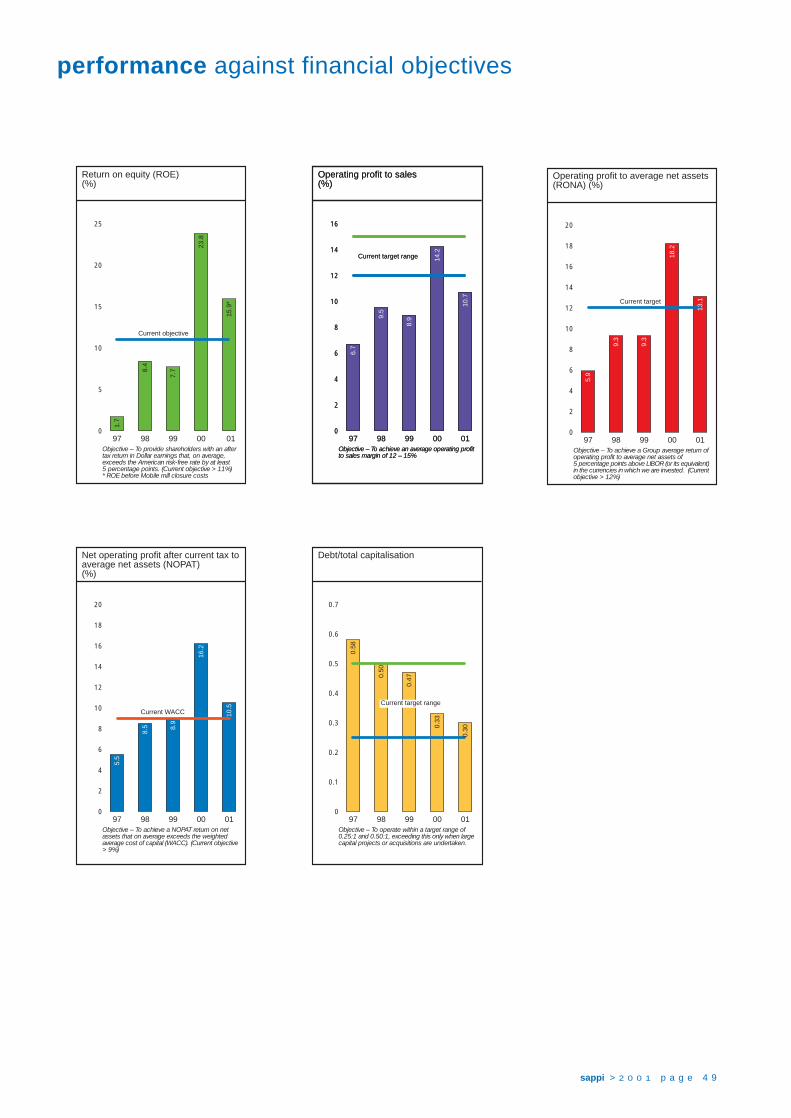
sappi > 2 0 0 1 p a g e 4 9
25
20
15
10
5
0
Return on equity (ROE)(%)
97
1.7
98
8.4
99
7.7
00
23.8
01Objective – To provide shareholders with an aftertax return in Dollar earnings that, on average,exceeds the American risk-free rate by at least5 percentage points. (Current objective > 11%)* ROE before Mobile mill closure costs
Current objective
15.9
*16
14
12
10
8
6
4
2
0
Operating profit to sales(%)
97 98 99 0014
.201
Objective – To achieve an average operating profitto sales margin of 12 – 15%
Current target range
10.7
16
14
12
10
8
6
4
2
0
Operating profit to sales(%)
97
6.7
98
9.5
99
8.9
0014
.201
Objective – To achieve an average operating profitto sales margin of 12 – 15%
Current target range
10.7
20
18
16
14
12
10
8
6
4
2
0
Net operating profit after current tax toaverage net assets (NOPAT)(%)
97
5.5
98
8.5
99
8.9
00
16.2
01Objective – To achieve a NOPAT return on netassets that on average exceeds the weightedaverage cost of capital (WACC). (Current objective> 9%)
Current WACC 10.5
0.7
0.6
0.5
0.4
0.3
0.2
0.1
0
Debt/total capitalisation
97
0.58
98
0.50
99
0.47
00
0.33
01Objective – To operate within a target range of0.25:1 and 0.50:1, exceeding this only when largecapital projects or acquisitions are undertaken.
Current target range
0.30
20
18
16
14
12
10
8
6
4
2
0
Operating profit to average net assets(RONA) (%)
97
5.9
98
9.3
99
9.3
00
18.2
01Objective – To achieve a Group average return ofoperating profit to average net assets of5 percentage points above LIBOR (or its equivalent)in the currencies in which we are invested. (Currentobjective > 12%)
Current target
13.1
performance against financial objectives

five-year review
sappi > 2 0 0 1 p a g e 5 0
Annual September September September September September
compound 2001 2000 1999 1998 1997
growth US$ million US$ million US$ million US$ million US$ million
Income statement and cash flow Sales 4.1% 4,184 4,718 4,422 4,308 3,557 Operating profit 17.0% 446 672 395 409 238 Net finance costs (before capitalised interest) (15.8%) 125 144 190 263 249 Depreciation, amortisation and fellings 351 380 381 357 278 Profit before tax 14.5% 147 573 176 205 86 Net taxation 9 197 46 81 35 Income attributable to minority interests – 13 16 17 31 Net profit 62.1% 138 363 114 107 20 Earnings before exceptional items (headline) 81.9% 263 347 163 90 24Cash generated by operations 10.5% 771 1,048 781 886 517 EBITDA 11.5% 797 1,052 776 766 516
Balance sheet Non-current assets 3,346 3,600 4,170 4,758 3,945 Current assets 1,160 1,168 1,164 1,578 1,221 Total assets (3.4%) 4,506 4,768 5,334 6,336 5,166 Current liabilities 1,360 1,101 1,655 1,513 1,212 Total capital employed (5.6%) 3,146 3,667 3,679 4,823 3,954Net debt * (19.0%) 1,128 1,270 2,109 2,703 2,620
Statistics Number of ordinary shares (millions) In issue at year-end ***** 9.6% 229.5 239.1 224.6 223.8 159.2Weighted average number of sharesin issue during the year ***** 10.0% 232.8 236.9 223.8 200.5 159.2
Share performance: per share (in US cents) Basic earnings after exceptional items 47.2% 59 153 51 53 13 Diluted earnings after exceptional items 50.3% 59 151 51 52 12 Earnings before exceptional items (headline) 65.4% 113 146 73 45 15 Diluted earnings before exceptional items (headline) 65.1% 112 144 71 45 15 Ordinary dividend declared ** 26 25 19 18 – Net asset value *** (2.1%) 821 870 792 802 894 Ordinary dividend cover (times) ** 2.3 6.1 2.7 2.7 –

September September September September September
2001 2000 1999 1998 1997
US$ million US$ million US$ million US$ million US$ million
Returns (%) Operating profit to sales 10.7 14.2 8.9 9.5 6.7 Operating profit to average net assets (RONA) 13.1 18.2 9.3 9.3 5.9 Net profit to average ordinary shareholders’ equity (ROE) # 15.9 23.8 7.7 8.4 1.7
Ratios Debt/total capitalisation * 0.30 0.33 0.47 0.50 0.58 Debt/equity ratio * 0.75 0.76 1.33 1.69 1.87 Current asset ratio 0.85 1.06 0.70 1.04 1.01 Cash interest cover 6.2 7.3 4.1 3.4 2.1
Number of employees 18,231 19,276 20,245 23,640 21,055
Exchange rates US$ per one Euro exchange rate – closing **** 0.9167 0.8777 1.0470 1.1747 1.1050US$ per one Euro exchange rate – average (12 month) **** 0.8855 0.9720 1.1027 1.1116 1.1381ZAR to one US$ exchange rate – closing 8.9386 7.2240 6.0000 5.8150 4.6655ZAR to one US$ exchange rate – average (12 month) 7.9574 6.5472 6.0122 5.2714 4.5591
Comparative figures have been restated for accounting policy changes to ensure consistency.# September 2001 – ROE before Mobile mill closure costs.* Comparative net debt figures and ratios restated to reflect minority interest in debt.** The dividends for all the financial years were declared subsequent to year-end and, in terms of our newly adopted accounting policy, are
accounted for and included in the statement of changes in equity in the following financial year.*** Net asset value includes net deferred tax. **** Prior to 1/1/99 the US$/ECU rate is reflected above.***** Net of Treasury shares (refer note 14).
sappi > 2 0 0 1 p a g e 5 1
5,000
4,500
4,000
3,500
3,000
2,500
2,000
1,500
1,000
500
0
Sales(US$m)
Sep97
3,55
7
Sep98
4,30
8
Sep99
4,42
2
Sep00
4,71
8
Sep01
4,18
4
25,000
20,000
15,000
10,000
5,000
0
Number of employees
Sep97
21,0
55
Sep98
23,6
40
Sep99
20,2
45
Sep00
19,2
76
Sep01
18,2
31
300
250
200
150
100
50
0
Sales per employee(US$ ’000)
Sep97
169
Sep98
182
Sep99
218
Sep00
245
Sep01
229

share statistics
sappi > 2 0 0 1 p a g e 5 2
Shareholding Number Number % of shares
– ordinary shares in issue of shareholders % of shares in issue
1 – 5 000 3,574 97.70 1,038,530 0.45
5 001 – 10 000 33 0.90 221,965 0.10
10 001 – 50 000 29 0.79 676,473 0.29
50 001 – 100 000 7 0.19 542,686 0.24
100 001 – 1 000 000 7 0.19 4,887,803 2.13
Over 1 000 000 8 0.23 222,118,311 96.79
3,658 100.00 229,485,768 100.00
Analysis of holdings
Standard Bank Nominees
(Transvaal) (Pty) Limited * 1 0.03 141,810,118 61.79
CSD Dematerialised Control Account * 1 0.03 32,345,598 14.09
Industrial Development Corporation of SA Limited 1 0.03 19,804,620 8.63
Nedcor Bank Nominees Limited * 1 0.03 18,037,819 7.86
CMB Nominees (Pty) Limited * 1 0.03 7,158,944 3.12
ABSA Nominees (Pty) Limited * 1 0.03 1,955,975 0.85
First National Nominees (Pty) Limited * 1 0.03 1,005,237 0.44
Mercantile Custodial Nominees (Pty) Limited * 1 0.03 896,832 0.39
Old Mutual Nominees (Pty) Limited * 1 0.03 831,291 0.36
Other companies 224 6.10 2,504,608 1.09
Other trust funds and investment companies 117 3.20 138,569 0.06
Other insurance companies and pension funds 4 0.11 44,527 0.02
Individuals 3,304 90.32 2,951,630 1.30
3,658 100.00 229,485,768 100.00
* Nominee holdings
These holdings include nominee companies as beneficial shareholders. Pursuant to Section 140A of the South African
Companies Act, 1973, as amended, the directors have investigated the beneficial ownership of shares in Sappi Limited which are
registered in the nominee holdings and these investigations have to date revealed the following beneficial holder of more than 5%
of the issued share capital of Sappi Limited:
Shares %
Public Investment Commissioner 15,460,361 6.74
Further, as a result of these investigations, the directors have ascertained that some of the shares registered in the names of the
nominee holders are managed by various fund managers and that, as of September 2001, the following fund managers were
responsible for managing 5% or more of the share capital of Sappi Limited:
Shares %
Capital Group 17,251,800 7.52
RMB Asset Management 14,293,257 6.23
Highfields Capital 12,374,417 5.39
at September 2001
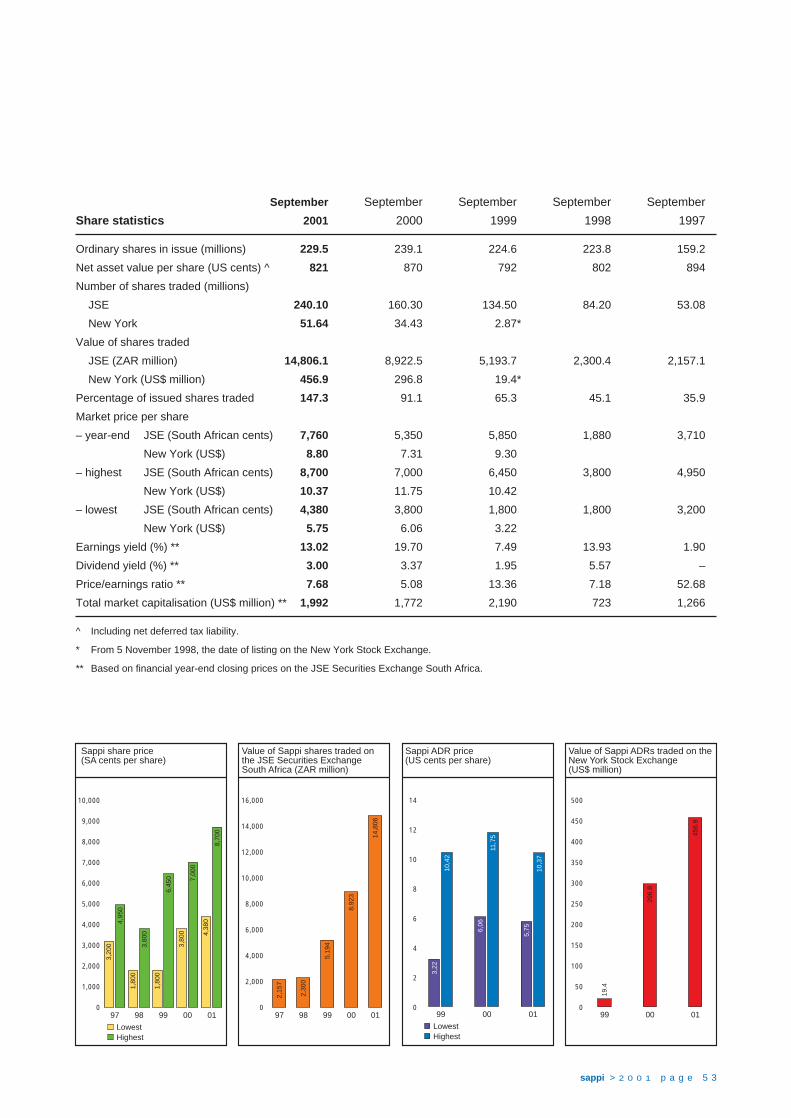
sappi > 2 0 0 1 p a g e 5 3
September September September September September
Share statistics 2001 2000 1999 1998 1997
Ordinary shares in issue (millions) 229.5 239.1 224.6 223.8 159.2
Net asset value per share (US cents) ^ 821 870 792 802 894
Number of shares traded (millions)
JSE 240.10 160.30 134.50 84.20 53.08
New York 51.64 34.43 2.87*
Value of shares traded
JSE (ZAR million) 14,806.1 8,922.5 5,193.7 2,300.4 2,157.1
New York (US$ million) 456.9 296.8 19.4*
Percentage of issued shares traded 147.3 91.1 65.3 45.1 35.9
Market price per share
– year-end JSE (South African cents) 7,760 5,350 5,850 1,880 3,710
New York (US$) 8.80 7.31 9.30
– highest JSE (South African cents) 8,700 7,000 6,450 3,800 4,950
New York (US$) 10.37 11.75 10.42
– lowest JSE (South African cents) 4,380 3,800 1,800 1,800 3,200
New York (US$) 5.75 6.06 3.22
Earnings yield (%) ** 13.02 19.70 7.49 13.93 1.90
Dividend yield (%) ** 3.00 3.37 1.95 5.57 –
Price/earnings ratio ** 7.68 5.08 13.36 7.18 52.68
Total market capitalisation (US$ million) ** 1,992 1,772 2,190 723 1,266
^ Including net deferred tax liability.
* From 5 November 1998, the date of listing on the New York Stock Exchange.
** Based on financial year-end closing prices on the JSE Securities Exchange South Africa.
500
450
400
350
300
250
200
150
100
50
0
Value of Sappi ADRs traded on theNew York Stock Exchange(US$ million)
99
19.4
00
296.
8
01
456.
9
14
12
10
8
6
4
2
0
Sappi ADR price(US cents per share)
99
3,22
10,4
2
00
6,06
11,7
5
01
5,75
10,3
7
LowestHighest
16,000
14,000
12,000
10,000
8,000
6,000
4,000
2,000
0
Value of Sappi shares traded onthe JSE Securities ExchangeSouth Africa (ZAR million)
97
2,15
7
98
2,30
0
99
5,19
4
00
8,92
3
01
14,8
06
10,000
9,000
8,000
7,000
6,000
5,000
4,000
3,000
2,000
1,000
0
Sappi share price(SA cents per share)
LowestHighest
01
4,38
0
8,70
0
00
3,80
0
7,00
0
99
1,80
0
6,45
0
98
1,80
0
3,80
0
97
3,20
0
4,95
0

STATEMENT ON CORPORATE GOVERNANCE
The Group endorses the Code of Corporate Practices and
Conduct as contained in the King Report and complies in all
material respects with the principles incorporated in that report.
FINANCIAL STATEMENTS
The directors are responsible for the preparation and for the final
approval of the annual financial statements. The auditors are
responsible for auditing the annual financial statements and
expressing an opinion thereon in the course of executing their
statutory duties.
Suitable accounting policies, consistently applied and supported
by reasonable and prudent judgements and estimates, have been
used in the preparation of the annual financial statements, which
fairly present the state of affairs of the Group. In this process,
appropriate accounting standards have been applied and
adequate accounting records have been maintained.
The going concern basis has been adopted in preparing the
annual financial statements. The Directors see no reason to
believe that the Group will not continue to be a going concern in
the foreseeable future.
The quarterly results were reviewed by the Group’s external
auditors and the audit committee prior to their submission to the
Board.
Internal controls
The Board is responsible for the Group’s systems of internal
financial and operational control. The Group’s internal controls and
systems are designed to provide reasonable, but not absolute,
assurance as to the integrity and reliability of the annual financial
statements, that assets are adequately safeguarded against
material loss and that transactions are properly authorised and
recorded. Such controls are based on established written policies
and procedures which are monitored throughout the Group and
are applied by trained, skilled personnel with an appropriate
segregation of duties through clearly defined lines of accountability
and delegation of authority. The control system includes
comprehensive reporting and analysis of actual results against
approved standards and budgets. All employees are required to
maintain the highest ethical standards in ensuring that the
Company’s business practices are conducted in a manner which in
all reasonable circumstances is above reproach. During the year
under review, nothing has come to the attention of the directors to
indicate that any material breakdown in the functioning of these
controls, procedures and systems has occurred. A material
breakdown is defined as a critical weakness in process or financial
systems which would result in a material loss, contingency or
uncertainty requiring disclosure in the published annual financial
statements.
RISK MANAGEMENT
The Company has adopted a continuous, systematic, enterprise-
wide risk management process which aims to ensure that all
material risks are identified, evaluated and addressed. Ownership
of the process is at a regional management level, with support
being provided by functional teams. This risk assessment process
aims to maximise long-term shareholder value, to protect our
people, our assets and the environment, and to protect the
reputation and the Sappi brand name.
The Group Risk Management Team reviews the effectiveness of
the risk management process and reports back to both the
Executive Committee and the Board on an annual basis.
UNITED STATES OF AMERICA FOREIGN CORRUPT PRACTICES
ACT (“FCPA”)As the Company is listed on the New York Stock Exchange and
has securities registered under the USA Securities Exchange Act
of 1934, it is subject to the FCPA. A Compliance Committee has
been instituted and meets on a regular basis. The Company has
reviewed and amended its policies to ensure that all aspects of the
FCPA have been addressed.
THE BOARD OF DIRECTORS
The Board is constituted with six executive and nine Non-executive
Directors who collectively determine major policies and strategies.
The number and calibre of Non-executive Directors carry sufficient
weight in the Board’s deliberations and resolutions, thus acting as a
balance to the Executive Directors. Non-executive Directors are
independent of management and free from any relationship that could
materially interfere with the execution of their independent judgement.
Their business experience enables them to evaluate strategy and act
in the Group’s best interest. The Board meets regularly, at least every
quarter, to carry out its functions. Its main functions include: to
establish a strategy and direct the Group accordingly, to take
decisions of a material nature reserved for the Board’s deliberation, to
monitor the activities and performance of executive management,
to provide for Board and management succession, and to provide
information on the business of the Company to shareholders and
stakeholders. The chairman meets routinely with the Non-executive
Directors to discuss his performance and any other issues.
Directors have to notify the Group Secretary of any intention to buy
or sell shares in the Group whether directly or indirectly. Directors
and any employees who become aware of sensitive financial
information cannot directly or indirectly deal in the Group’s shares
until the information is in the public arena.
corporate governance
sappi > 2 0 0 1 p a g e 5 4
All the Directors may seek independent professional advice if
necessary and have access to the services of the Company
Secretary who is responsible to ensure both the effective functioning
of the Board and the proper administration of Board proceedings.
THE NOMINATION COMMITTEE
The nomination committee is constituted as a sub-committee of
the Board and consists of three Non-executive Directors (one of
whom serves as chairman) and the Executive Chairman of the
Group. The committee considers the composition of the Board,
retirements and appointments of additional and replacement Non-
executive Directors and makes appropriate recommendations
to the Board.
COMMUNICATION
The Group acknowledges that it operates within a community and
values a good working relationship with its stakeholders. The Group
consistently strives to strengthen links through regular communi-
cation with all stakeholders which conforms with the criterion of
timeous, objective, relevant and transparent communication.
AUDIT COMMITTEE
An audit committee of the Board was established in 1984 and
assists the Board in discharging its responsibilities to safeguard the
Group’s assets, maintain adequate accounting records and
develop and maintain effective systems of internal financial control.
It also oversees the financial reporting process and is concerned
with compliance with accounting policies, Group policies, legal
requirements and internal controls within the Group. It interacts with
and evaluates the effectiveness of the external and internal audit
process and reviews compliance with the Group’s code of ethics.
The audit committee consists of five independent Non-executive
Directors of the Board and is regulated by a specific mandate
from the Board. The adequacy of the mandate is reviewed and
reassessed annually. The audit committee meets with senior
management, which includes the Executive Chairman of the Board
and the Executive Director – Finance, at least four times a year.
The external and internal auditors attend these meetings and have
unrestricted access to the committee and its chairman.
Subsidiary company audit committees exist in all major regions.
These committees have a mandate from the Group’s audit
committee, to whom they report on a regular basis.
INTERNAL AUDIT
The Group’s internal audit department has a current complement
of fifteen senior qualified persons. It has a specific mandate from
the audit committee and independently appraises the adequacy
and effectiveness of the Group’s systems, financial internal
controls and accounting records, reporting its findings to local and
divisional management, the external auditors as well as the
respective audit committees. The Group Internal Audit
Manager, as head of the department, reports to the Executive
Director – Finance on a functional basis and has direct access to
the chairman of the audit committee and the chairman of
the Board.
The internal audit coverage plan is based on a risk assessment
performed at each operating unit. The coverage plan is updated
annually based on the risk assessment and results of the audit
work performed. This ensures that the audit coverage is focused
on identified areas of high risk.
HUMAN RESOURCES COMMITTEE
The human resources committee, which consists of two Non-
executive Directors (one of whom serves as chairman) and the
Executive Chairman of the Group, is constituted as a
subcommittee of the Board and operates within the terms of
reference set by the Board. The responsibilities of the committee
are, inter alia, to determine human resource policy and strategy as
well as the remuneration and incentives in respect of those
Executives reporting directly to the Executive Chairman. The
remuneration of the Executive Chairman is determined by the
Non-executive Directors of the committee. Human resources
committees exist for all the Company’s major operating
subsidiaries outside of Southern Africa. Aggregate Directors’
emoluments are disclosed in the financial statements.
WORKER PARTICIPATION AND AFFIRMATIVE ACTION
The Group promotes the empowerment of its employees through
participative structures on employee related matters, training,
development and information sharing. The Group’s employment
policies are designed to provide equal opportunities, without
discrimination, to all employees.
The Group complies with the South African Employment Equity Act.
CODE OF ETHICS
The Group’s code of ethics requires all employees within the
Group to act with the utmost good faith and integrity in all
transactions and with all stakeholders with whom they interact. It
commits the Company and employees to sound business
practices and compliance with legislation.
An Ethicsline has been implemented for all the regions in which the
Group operates. This service, operated by an independent
company, enables employees to report environmental, safety,
ethics or other concerns. All reported matters are followed up by
Group Internal Audit.
sappi > 2 0 0 1 p a g e 5 5
sappi > 2 0 0 1 p a g e 5 6
Report of the independent auditors to the members ofSappi Limited GroupWe have audited the annual financial statements and Groupannual financial statements of Sappi Limited set out on pages 57to 63 and pages 66 to 111 for the year ended 30 September2001. These financial statements are the responsibility of theCompany’s Directors. Our responsibility is to express an opinionon these financial statements based on our audit.
ScopeWe conducted our audit in accordance with statements ofSouth African Auditing Standards. Those standards requirethat we plan and perform the audit to obtain reasonableassurance that the financial statements are free of materialmisstatement. An audit includes:• examining, on a test basis, evidence supporting the amounts
and disclosures in the financial statements;• assessing the accounting principles used and significant
estimates made by management; and • evaluating the overall financial statement presentation.
We believe that our audit provides a reasonable basis for ouropinion.
Audit opinionIn our opinion, the financial statements fairly present, in allmaterial respects, the financial position of the Company andthe Group at 30 September 2001 and the results of theiroperations and cash flows for the year then ended inaccordance with South African Statements of GenerallyAccepted Accounting Practice and in the manner requiredby the Companies Act in South Africa.
Deloitte & ToucheChartered Accountants (SA)Registered Accountants and Auditors
Johannesburg14 December 2001
auditors’ report
The Directors and officers of the Company are responsible tothe extent respectively indicated for the annual financialstatements which are submitted to shareholders in generalmeeting.
The Directors are principally responsible for the overall co-ordination of the preparation and for the final approval ofsuch submission. The initial preparation is the responsibility ofthe Company’s officers. The auditors are responsible forauditing the annual financial statements in the course ofexecuting their statutory duties.
The report and annual financial statements of the Group andthe Company appear on the following pages:57 Directors’ report60 Income statement61 Balance sheet62 Cash flow statement
63 Statement of changes in shareholders’ equity64 Income statement in Rands65 Balance sheet in Rands66 Notes to the annual financial statements
107 Company financial statements110 Investments
The above statements were approved by the Board of Directorson 14 December 2001 and were signed on its behalf by:
E van AsExecutive Chairman
D G WilsonExecutive Director – Finance
Sappi Limited
directors’ approval
In terms of Section 268G(d) of the Companies Act, 1973,as amended, I certify that the Company has lodged withthe Registrar all such returns as are required by theCompanies Act.
Sappi Management Services (Pty) LimitedD J O’ConnorGroup Secretary14 December 2001
secretary’s certificate
sappi

sappi > 2 0 0 1 p a g e 5 7
Your Directors have pleasure in submitting their report for the
year ended September 2001.
Business of Sappi Limited and its operating companies
mentioned below (“the Group”)
The Group manufactures and sells a wide range of pulp, paper
and wood products for use in almost every sphere of economic
activity. Sappi Limited (“Sappi” or “the Company”) conducts its
business through two business units, namely:
– Sappi Fine Paper and
– Sappi Forest Products
Sappi Papier Holding AG owns the Group’s fine paper
businesses in Europe and North America. The worldwide
activities of the fine paper group (including South Africa) are
co-ordinated from London through Sappi Fine Paper plc.
Sappi Forest Products conducts the Group’s commodities
business in Southern Africa through six wholly-owned
management companies.
Sappi Trading operates a trading network for the international
sales and distribution of products of the two divisions outside
our core operating regions of North America, Europe and
Southern Africa.
A review of the business and operations of the operating
companies appears on pages 28 to 35.
Reporting period
The Group’s financial period now ends on the Sunday closest to
the year-end date and results are reported as if at the year-end
date. At the beginning of the current financial year the financial
period end changed from a Wednesday to a Sunday as this is
considered to be a more appropriate day for our business.
Generally Accepted Accounting Practice (GAAP)
As a South African company Sappi’s financial reporting is
based on South African GAAP. The Board has considered
the application of alternative accounting standards, but
has elected to retain the standards in use in view of the fact
that the majority of the trading in Sappi shares takes place on
the JSE Securities Exchange South Africa.
These financial statements have accordingly been prepared in
accordance with the statements of Generally Accepted
Accounting Practice approved by the South African Accounting
Practices Board.
In addition, Sappi reconciles its reporting annually with US
GAAP and incorporates this reconciliation in its annual 20-F
submission to the Securities and Exchange Commission in the
United States. The differences are included in note 37 to the
financial statements.
As the majority of the Group’s sales are in US Dollars and the
US Dollar is the major trading currency of the pulp and paper
industry, the Group reports its results in US Dollars in order to
facilitate the understanding of the results.
Disposals
Mining Timber
During the year Sappi sold its Mining Timber business in South
Africa to a consortium which included the management team
of the business.
Mill closures
Mobile mill
In May the decision was announced to close the Sappi Fine
Paper North America mill at Mobile, Alabama, USA. The mill
operated in a non-core market segment and the decision to
close was taken primarily as a result of the mill’s poor overall
cost structure. The steps which were necessary to close the
mill have proceeded according to plan – production ceased in
mid-October and it is expected that the site will be closed
completely by mid-December 2001.
Transcript mill
In October 2001 the proposal to close the Transcript mill
in Scotland in the United Kingdom was announced.
Transcript produces carbonless paper, product, which has
been overtaken by other technologies. Following consultation
with employee representatives, a final decision was taken
in November 2001 to close the mill and closure is expected
early in calendar 2002. The decision to close the mill is in
line with Sappi’s aim to dispose of non-core, under-
performing assets.
directors’ report
sappi > 2 0 0 1 p a g e 5 8
sappi
Share capital
There were no changes either to the authorised or the issued
share capital of Sappi.
At 30 September 2001 the authorised and issued share capital
of the Company was as follows:
Authorised:
325,000,000 ordinary shares of
ZAR1 each ZAR325 million
Issued:
239,071,892 ordinary shares of
ZAR1 each US$104 million
Share premium US$1,750 million
Purchase of shares by a subsidiary
Through a wholly-owned subsidiary the Sappi Group acquired
a total of 12 million Sappi shares on the open market of the
JSE Securities Exchange South Africa (during the year) for a
total consideration of approximately US$94 million. This
accords with Sappi’s stated intention, announced on
9 November 2000 and repeated in last year’s report, for a
wholly-owned Sappi subsidiary to acquire Sappi shares in the
light of the then prevailing Sappi share price and the
strengthening Group balance sheet. Some of the shares which
have been repurchased have been, and will continue to be,
utilised to meet the requirements of the Sappi Limited Share
Incentive Trust from time to time.
Convertible notes
During July 1995, the Company’s wholly-owned subsidiary,
Sappi BVI Finance Limited, issued US$250 million of 7.5%
convertible guaranteed notes due 2002. The notes are
guaranteed by Sappi. Further details of the convertible notes
are provided in note 16 to the Group annual financial
statements.
11,944,809 authorised unissued shares of Sappi are
specifically reserved for the conversion of the notes into new
shares and were placed under the control of the Directors for
this specific issue at a general meeting of shareholders on
21 August 1995.
Dividends
The Directors have declared a dividend (number 78) of 26 US
cents per share (2000: 25 US cents) for the year ended
September 2001. The record date for the dividend is 11 January
2002 and payment will be made on 14 January 2002.
The Sappi Limited Share Incentive Trust (“the Trust”)
In March 1997, shareholders approved the adoption of a new
share incentive scheme for employees, called “The Sappi
Limited Share Incentive Trust”, to replace The Sappi Limited
Share Purchase Scheme which was introduced in 1979.
10,000,000 ordinary shares (being the maximum number of
shares which could be allocated in terms of the Trust as at the
date of its adoption) were allocated to the Trust and were
placed under the control of the Directors for specific issue in
future. Subsequently, an amendment was passed at the
annual general meeting in March 2000, to provide that the
maximum number of shares which may be allocated in terms
of the Trust be fixed at 7.5% of the entire issued share capital
of the Company from time to time. Based on the existing share
capital, the maximum number of shares available for allocation
to the Trust at present is 17,930,466 shares. Please refer to
note 31 on page 94 for further information about the Trust.
Borrowing facilities
Group net borrowings amount to US$1.1 billion (September
2000: US$1.2 billion). The Company’s articles of association
allow net borrowings of up to US$4.8 billion. Details of the
long-term borrowings are set out in note 16 to the Group
annual financial statements.
Insurance
The Group has a policy of externally insuring high-severity,
low-frequency risks and self-insuring the balance of its
exposure. The Sappi captive insurer is utilised to manage
exposure and optimise re-insurance on a worldwide basis.
Risk exposure is controlled through the Group utilising
appropriate expertise including that made available through
brokers, insurers and other consultants.
Due to a substantial hardening of the insurance market and
following the events on 11 September, placement of Property
Damage insurance cover has become considerably more
directors’ report ( c o n t i n u e d )
sappi > 2 0 0 1 p a g e 5 9
difficult this year. Self-insured deductibles for any one
occurrence have increased to US$12.5 million in the South
African and European regions and to US$19.8 million in North
America. There are no aggregate limits. Contrary to previous
years, Property Damage is no longer covered to Full Value,
although Maximum Foreseeable Losses are exceeded
comfortably. Furthermore, Property Damage cover now
generally excludes losses from acts of terrorism. The Group
has covered these separately to a value of US$250 million.
Cover for the South African plantations, renewed separately
earlier in the year, remains unchanged. The self-insured
element is limited to ZAR10 million (US$1 million) for any
one occurrence.
General authority to permit the Company or any
subsidiary to acquire Sappi shares
The Board is proposing that the general authority granted at
the annual general meeting on 1 March 2001 to permit Sappi
and/or subsidiary companies of Sappi to acquire Sappi shares,
be renewed at the forthcoming annual general meeting.
Appropriate resolutions will be submitted to the forthcoming
annual general meeting. Further details are set out in the
notice to members on page 112.
Amendment to articles of association
The Board is proposing that a special resolution be passed
at the forthcoming annual general meeting of the Company to
amend the articles of association of the Company so as
to permit the Company to despatch shareholder notices
and to receive shareholders’ proxies electronically. Further
details are set out in the notice to members on page 113.
Directors and secretaries
The names of the Directors appear on page 26. The
secretaries and their business and postal addresses appear on
page 118 of this report. Mr W H Sheffield was appointed to the
Board during the year. In terms of the Company’s articles of
association, it will be necessary to confirm his appointment at
the forthcoming annual general meeting.
In terms of the Company’s articles of association Messrs
D C Brink, W E Hewitt, K R Lechmere-Oertel, D G Wilson and
Dr F A Sonn will retire from the Board at the forthcoming
annual general meeting. Messrs Hewitt and Lechmere-Oertel
have indicated that they will not be offering themselves for
re-election, whilst Messrs Brink, Wilson and Dr Sonn, all being
eligible, have offered themselves for re-election.
Personal details of Mr Sheffield and Messrs Brink, Wilson and
Dr Sonn are set out in the notice to members on page 115.
The beneficial interest of Directors in the shares of the
Company (including options and rights and options in terms of
The Sappi Limited Share Incentive Trust) were as follows:
Number of shares at September September
2001 2000
Ordinary shares 1,633,226 1,586,712
A register of interests of Directors and other executives in
shares of the Company is available to shareholders and the
public on request.
Subsidiary companies
Details of the Company’s significant subsidiaries are given in
Annexure A on page 110.
Special resolutions
A full list of the special resolutions passed by the Company and
its subsidiaries during the year will be made available to
shareholders on request.

sappi > 2 0 0 1 p a g e 6 0
for the year ended September 2001
US$ million note 2001 2000
Sales 4,184 4,718
Cost of sales 3,375 3,650
Gross profit 809 1,068
Selling, general and administrative expenses 363 396
Operating profit 4 446 672
Non-trading loss 5 207 2
Net finance costs 6 92 97
Profit before tax 147 573
Taxation 7 9 197
Profit after tax 138 376
Income attributable to minority interests – 13
Net profit 138 363
Weighted average number of ordinary shares in issue (millions) 232.8 236.9
Basic earnings per share (US cents) 8 59 153
Diluted earnings per share (US cents) 8 59 151
Earnings before exceptional items
(headline earnings) per share (US cents) 8 113 146
Diluted earnings before exceptional items (diluted headline earnings)
per share (US cents) 8 112 144
Dividends per share (US cents) – declared after year-end 26 25
income statement
sappi

sappi > 2 0 0 1 p a g e 6 1
at September 2001
US$ million note 2001 2000
Assets
Non-current assets 3,346 3,600
Property, plant and equipment 9 2,890 3,095
Plantations 324 372
Deferred taxation 10 4 37
Other non-current assets 11 128 96
Current assets 1,160 1,168
Cash and cash equivalents 445 294
Trade and other receivables 12 202 319
Inventories 13 513 555
Total assets 4,506 4,768
Equity and liabilities
Shareholders’ equity 1,503 1,618
Ordinary share capital and premium 14 1,854 1,937
Non-distributable reserves 15 (1,005) (894)
Distributable reserves 654 575
Minority interest 3 53
Non-current liabilities 1,640 1,996
Interest-bearing borrowings 16 1,014 1,278
Deferred taxation 10 385 500
Other non-current liabilities 17 241 218
Current liabilities 1,360 1,101
Interest-bearing borrowings 16 489 162
Bank overdraft 70 76
Trade and other payables 672 751
Taxation payable 48 57
Provisions 18 81 55
Total equity and liabilities 4,506 4,768
balance sheet
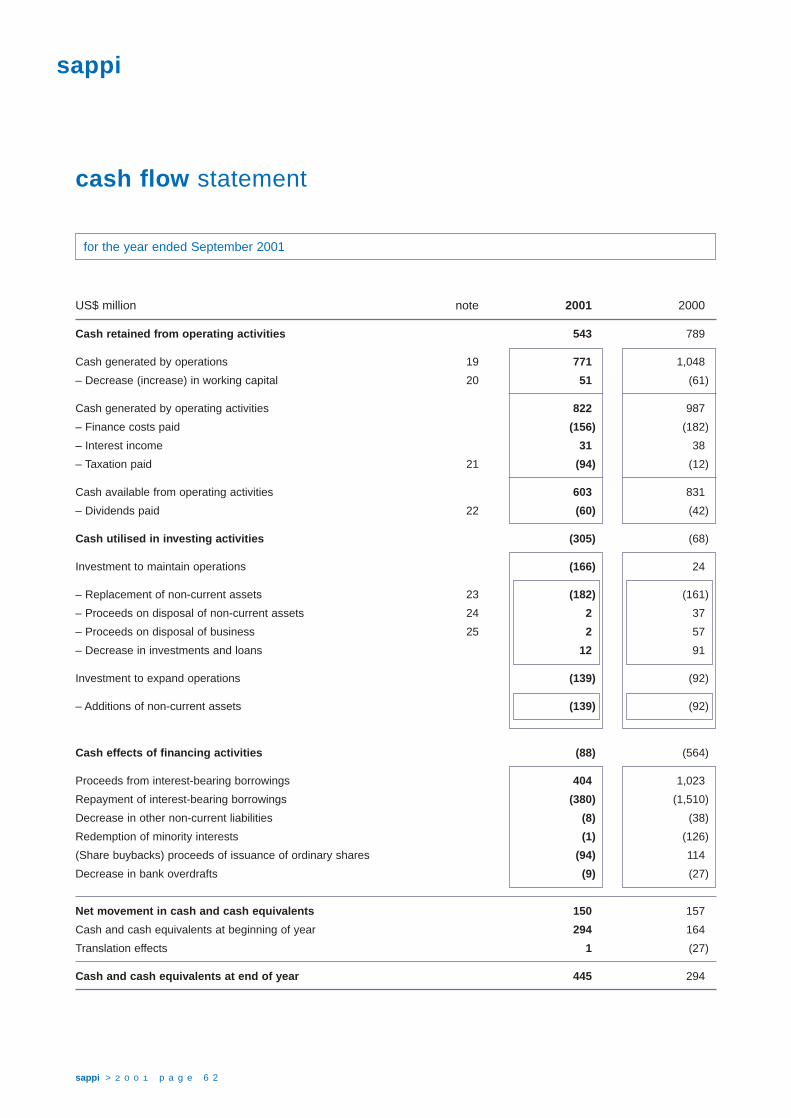
sappi > 2 0 0 1 p a g e 6 2
for the year ended September 2001
US$ million note 2001 2000
Cash retained from operating activities 543 789
Cash generated by operations 19 771 1,048
– Decrease (increase) in working capital 20 51 (61)
Cash generated by operating activities 822 987
– Finance costs paid (156) (182)
– Interest income 31 38
– Taxation paid 21 (94) (12)
Cash available from operating activities 603 831
– Dividends paid 22 (60) (42)
Cash utilised in investing activities (305) (68)
Investment to maintain operations (166) 24
– Replacement of non-current assets 23 (182) (161)
– Proceeds on disposal of non-current assets 24 2 37
– Proceeds on disposal of business 25 2 57
– Decrease in investments and loans 12 91
Investment to expand operations (139) (92)
– Additions of non-current assets (139) (92)
Cash effects of financing activities (88) (564)
Proceeds from interest-bearing borrowings 404 1,023
Repayment of interest-bearing borrowings (380) (1,510)
Decrease in other non-current liabilities (8) (38)
Redemption of minority interests (1) (126)
(Share buybacks) proceeds of issuance of ordinary shares (94) 114
Decrease in bank overdrafts (9) (27)
Net movement in cash and cash equivalents 150 157
Cash and cash equivalents at beginning of year 294 164
Translation effects 1 (27)
Cash and cash equivalents at end of year 445 294
cash flow statement
sappi

sappi > 2 0 0 1 p a g e 6 3
for the year ended September 2001
statement of changes in shareholders’ equity
Ordinary Non-Ordinary share distribu- Distribu-
Number of share Share capital and table tableUS$ million ordinary shares capital premium premium reserves reserves Total
Balance – September 1999 as reported 224.6 103 1,720 1,823 (662) 302 1,463Changes in accounting policies – – – – 8 (35) (27)
Balance – September 1999 restated 224.6 103 1,720 1,823 (654) 267 1,436Net profit – – – – – 363 363Transfer from distributable reserves – – – – 1 (1) –Foreign currency translation reserve – – – – (248) – (248)Dividends – US$0.19 per share * – – – – – (45) (45)Issuance of ordinary shares 14.5 2 112 114 – – 114Goodwill written off to equity – – – – 7 (9) (2)
Balance – September 2000 239.1 105 1,832 1,937 (894) 575 1,618Net profit – – – – – 138 138Transfer from distributable reserves – – – – 7 (7) –Foreign currency translation reserves – – – – (118) – (118)Revaluation of derivative instruments – – – – – 8 8Dividends – US$0.25 per share * – – – – – (60) (60)Share buybacks less transfers to share purchase trust (9.6) (1) (82) (83) – – (83)
Balance – September 2001 229.5 104 1,750 1,854 (1,005) 654 1,503
* This is the dividend that relates to the previous financial year’s earnings that was declared subsequent to year-end. In terms of our newly adopted
accounting policy (AC 107 revised – Events after balance sheet date), dividends declared after the balance sheet date are accounted for in the
year in which they are declared and not in the year in which the profits are earned.

sappi > 2 0 0 1 p a g e 6 4
for the year ended September 2001
ZAR million 2001 2000
Sales 33,294 30,889
Cost of sales 26,856 23,897
Gross profit 6,438 6,992
Selling, general and administrative expenses 2,889 2,592
Operating profit 3,549 4,400
Non-trading loss 1,647 13
Net finance costs 732 635
Profit before tax 1,170 3,752
Taxation 72 1,290
Profit after tax 1,098 2,462
Income attributable to minority interests – 85
Net profit 1,098 2,377
Weighted average number of ordinary shares in issue (millions) 232.8 236.9
Basic earnings per share (SA cents) 469 1,003
Diluted earnings per share (SA cents) 469 989
Earnings before exceptional items (headline earnings) per share (SA cents) 899 953
Diluted earnings before exceptional items (diluted headline earnings)
per share (SA cents) 891 943
Dividends per share (SA cents) – declared after year-end * 250 164
Note:
The income statement has been expressed in Rands for information purposes. The translation to South African Rands from United States Dollars
has been calculated at an average rate for the year of US$1 to ZAR7.9574 (September 2000: US$1 to ZAR6.5472).
* Dividends have been translated at the rate of exchange on the date of declaration.
income statement in randsconvenience translation
sappi

sappi > 2 0 0 1 p a g e 6 5
at September 2001
ZAR million 2001 2000
Assets
Non-current assets 29,908 26,006
Property, plant and equipment 25,832 22,358
Plantations 2,896 2,687
Deferred taxation 36 267
Other non-current assets 1,144 694
Current assets 10,369 8,437
Cash and cash equivalents 3,978 2,124
Trade and other receivables 1,806 2,304
Inventories 4,585 4,009
Total assets 40,277 34,443
Equity and liabilities
Shareholders’ equity 13,435 11,688
Minority interest 27 383
Non-current liabilities 14,659 14,419
Interest-bearing borrowings 9,064 9,232
Deferred taxation 3,441 3,612
Other non-current liabilities 2,154 1,575
Current liabilities 12,156 7,953
Interest-bearing borrowings 4,371 1,170
Bank overdraft 626 549
Trade and other payables 6,006 5,425
Taxation payable 429 412
Provisions 724 397
Total equity and liabilities 40,277 34,443
Note:
The balance sheet has been expressed in Rands for information purposes. The translation to South African Rands from
United States Dollars has been calculated at the closing rate for the year of US$1 to ZAR8.9386 (September 2000: US$1 to
ZAR7.2240).
balance sheet in randsconvenience translation

sappi > 2 0 0 1 p a g e 6 6
for the year ended September 2001
1. Business
Sappi Limited, a corporation organised under the laws of
the Republic of South Africa (the “Company” and,
together with its consolidated subsidiaries, “Sappi” or the
“Group”), was formed in 1936 and is a major, vertically
integrated international pulp and paper producer. Sappi is
the world’s largest producer of coated woodfree paper
and dissolving pulp and the largest forest products
company in Africa. The Group has manufacturing
facilities in eight countries, on three continents, and
customers in over 100 countries across the globe.
The Group is composed of its Sappi Fine Paper and Sappi
Forest Products business units. Sappi Trading operates a
trading network for the international marketing and
distribution of our products outside our core operating
regions of North America, Europe and Southern Africa.
Sappi Papier Holding AG owns the Group’s fine paper
business in Europe and North America, and the trading
business in Hong Kong. The worldwide activities of the fine
paper group are co-ordinated from the Sappi Fine Paper
offices in London. Sappi Forest Products, based in South
Africa, produces commodity paper products, pulp and forest
and timber products for Southern Africa and export markets.
2. Accounting policies
Basis of preparation
These financial statements have been prepared in
conformity with South African Statements of Generally
Accepted Accounting Practice. (Refer note 37 for summary
of the principal differences between SA GAAP and US
GAAP.) The principal accounting policies of the Group have
been applied consistently with the previous year except for
the changes set out in note 3.
The following standards have been adopted in the
financial statements before their effective dates:
– Events after the balance sheet date – AC 107 (revised)
– Employee benefits – AC 116 (revised)
– Financial instruments: recognition and measurement –
AC 133
The Group reports in US Dollars to facilitate a better
understanding of its results, since the majority of its sales
are in US Dollars and the US Dollar is the major currency
of the paper and pulp industry. Sappi Limited, the holding
company, reports in South African Rands.
The preparation of financial statements requires
management to make estimates and assumptions that
affect the reported amounts of assets and liabilities and
disclosure of contingent assets and liabilities at the date
of the financial statements and the reported amounts of
revenues and expenses during the reporting period.
Significant estimates used by management include
realisation of certain assets such as trade and other
accounts receivable, inventory, goodwill and deferred
taxation assets, as well as estimates of exposure and
certain liabilities of the Group. Actual results could differ
from those estimates.
Basis of consolidation
The consolidated financial statements incorporate the
assets, liabilities and results of the operations of the
Company and its subsidiaries. Subsidiaries are those
entities over whose financial and operating policies the
Group has the power to exercise control, so as to obtain
benefits from their activities.
Intercompany profits, transactions and balances have
been eliminated.
Goodwill
Goodwill arising on consolidation represents the excess of
the cost of acquisition over the Group’s interest in the fair
value of the identifiable assets and liabilities of a subsidiary
at the date of acquisition. Goodwill is recognised as an
asset and amortised on a straight-line basis following an
notes to the annual financial statements
sappi
sappi > 2 0 0 1 p a g e 6 7
for the year ended September 2001
assessment of its foreseeable life. Current estimates of
goodwill’s useful life do not exceed 20 years.
On disposal of a subsidiary, the attributable amount of
unamortised goodwill is included in the determination of
the profit or loss on disposal.
Goodwill occurring before 1 October 2000 was transferred
directly to reserves and is not restated as allowed by the
transitional provisions of AC 131 – Business combinations.
Fiscal year
The Group has changed its financial years to end on the
Sunday closest to the last day of September. Until last
year, the financial year-end was the closest Wednesday.
These financial years ended on 30 September 2001
(“year ended September 2001”) and 27 September 2000
(“year ended September 2000”).
Property, plant and equipment
Property, plant and equipment is stated at cost less
accumulated depreciation and impairment losses.
Cost includes all costs incurred to bring the plant to the
location and condition for its intended use and includes
financing costs.
Depreciation is calculated on a straight-line basis over
the effective useful lives of the assets. No depreciation is
provided on land. The effective useful lives of the major
categories of property, plant and equipment are:
Production buildings 10 – 45 years
Other buildings 9 – 45 years
Plant – pulp and paper mill equipment,
major items 10 – 40 years
– other 5 – 15 years
Motor vehicles 4 – 5 years
Office equipment 3 – 10 years
Leased assets and assets acquired under suspensive sale
agreements
Property, plant and equipment acquired under finance leases
and suspensive sale agreements are capitalised at fair value
at the date of acquisition.
Capitalised leased assets are amortised over the lesser of the
lease term and the effective useful life of the asset.
Finance costs are accrued and expensed annually, based on
the effective rate of interest applied consistently to the
remaining balance of the liability and are included in the
related liability. This liability is reduced as and when payments
are made in terms of the agreements.
Operating leases, mainly for the rental of premises and certain
office equipment, are not capitalised and rentals are expensed
on a straight-line basis over the lease term.
Plantations
Plantations are stated at the lower of cost less depletions and
realisable value. Cost includes all expenditure incurred on
acquisition, forestry development, establishment and
maintenance of plantations, and finance charges.
Depletions include the cost of timber felled, including finance
charges, which is determined on the average method, plus
amounts written off standing timber to cover loss or damage
caused, for example, by fire, disease and stunted growth.
Intangible assets
Research and development
Research costs are expensed against income in the year in
which they are incurred.
Development costs which relate to the design and testing of
new improved materials, products or processes are
recognised as an asset to the extent that it is expected that
such assets will generate future economic benefits. Such

sappi > 2 0 0 1 p a g e 6 8
for the year ended September 2001
notes to the annual financial statements ( c o n t i n u e d )
sappi
assets are amortised on a straight-line basis over their
estimated useful lives. To date all development costs have
been expensed.
Patents
Patents acquired are capitalised at cost and amortised on a
straight-line basis over their estimated useful lives, which is on
average ten years.
Impairment
The carrying amounts of the Group’s assets are reviewed at
each balance sheet date to determine whether there is any
indication of impairment. If there is any indication that an asset
may be impaired, its recoverable amount is estimated. The
recoverable amount is the higher of its net selling price and its
value in use.
In assessing value in use, the expected future cash flows from
the asset are discounted to their present value using a pre-tax
discount rate that reflects current market assessments of the
weighted average cost of capital and the risks specific to the
asset. An impairment loss is recognised whenever the carrying
amount of an asset exceeds its recoverable amount.
For an asset that does not generate cash inflows that are
largely independent of those from other assets, the
recoverable amount is determined for the cash-generating unit
to which the asset belongs. An impairment loss is recognised
in the income statement whenever the carrying amount of the
cash-generating unit exceeds its recoverable amount.
A previously recognised impairment loss is reversed if the
recoverable amount increases as a result of a change in the
estimates used to determine the recoverable amount, but not
to an amount higher than the carrying amount that would have
been determined (net of depreciation) had no impairment loss
been recognised in prior years. For goodwill a recognised
impairment loss is not reversed unless the impairment loss
was caused by a specific external event of an exceptional
nature that is not expected to recur and the increase relates
clearly to the reversal of the effect of that specific event.
Borrowing costs
Borrowing costs that are directly attributable to qualifying
assets are capitalised. Qualifying assets are those that
necessarily take a substantial period of time to prepare for their
intended use or sale. Capitalisation continues up to the date
that the assets are substantially ready for their intended use or
sale. Capitalisation is suspended during extended periods in
which active development is interrupted.
Inventories
Inventories are valued at the lower of cost, determined on the
first-in first-out (“FIFO”) basis, and net realisable value. All
damaged or substandard materials and obsolete, redundant or
slow-moving inventories are written down to their estimated
net realisable values.
The cost of raw materials, consumable stores and spares is the
delivered landed cost, while the cost of work in progress and
finished goods includes both direct costs and production
overheads.
Net realisable value is the estimated selling price in the
ordinary course of business, less the costs of completion and
selling expenses.
Share repurchases
Shares repurchased by the Company are cancelled. Shares
held by subsidiaries are treated as treasury shares, and
are presented as a reduction from equity. Gains or losses
on disposals of treasury shares are accounted for directly
in equity.
Deferred taxation
Deferred taxation is provided using the balance sheet liability
method, based on temporary differences. Temporary
differences are differences between the carrying amounts of
sappi > 2 0 0 1 p a g e 6 9
for the year ended September 2001
assets and liabilities for financial reporting purposes and their
tax base. The amount of deferred tax provided is based on
the expected manner of realisation or settlement of the
carrying amount of assets and liabilities using tax rates
enacted or substantively enacted at the balance sheet date.
Deferred tax is charged to the income statement except to
the extent that it relates to a transaction that is recognised
directly in equity, or a business combination that is an
acquisition. The effect on deferred tax of any changes in tax
rates is recognised in the income statement, except to the
extent that it relates to items previously charged or credited
directly to equity.
A deferred tax asset is recognised to the extent that it is
probable that future taxable profits will be available against
which the associated unused tax losses and deductible
temporary differences can be utilised. Deferred tax assets are
reduced to the extent that it is no longer probable that the
related tax benefit will be realised.
Provisions
Provisions are recognised when the Group has a present legal
or constructive obligation as a result of past events, for which
it is probable that an outflow of economic benefits will occur,
and where a reliable estimate can be made of the amount of
the obligation. Where the effect of discounting is material,
provisions are discounted. The discount rate used is a pre-tax
rate that reflects current market assessments of the time
value of money and, where appropriate, the risks specific to
the liability.
Foreign currencies
Foreign currency transactions
Transactions in foreign currencies are recorded at the rates of
exchange ruling on the transaction date. Monetary items
denominated in foreign currencies are translated at rates of
exchange ruling at balance sheet date. Gains and losses and
costs associated with foreign currency transactions are taken
to income in the period to which they relate.
Financial statements of entities reporting in currencies other
than the US Dollar
The financial statements are translated to US Dollars as follows:
– Assets and liabilities at rates of exchange ruling at balance
sheet date.
– Income, expenditure and cash flow items at average rates.
Differences arising from the translation of the opening
net investment at the rates ruling at balance sheet date and
income and expenditure at average rates are taken directly
to reserves.
The Group used the following exchange rates for financial
reporting purposes:
Selected currencies
Rate at September September
2001 2000
ZAR to one US$ 8.9386 7.2240
GBP to one US$ 0.6796 0.6869
EUR to one US$ 1.0909 1.1393
Average annual rate September September
2001 2000
ZAR to one US$ 7.9574 6.5472
GBP to one US$ 0.6945 0.6371
EUR to one US$ 1.1293 1.0288
Convenience translations
The consolidated income statement and the consolidated
balance sheets have been expressed in South African Rands
for information purposes.
For this purpose the consolidated income statement was
translated at the average rate for the year and the consolidated
balance sheet at the rate of exchange ruling at balance
sheet date.

sappi > 2 0 0 1 p a g e 7 0
for the year ended September 2001
notes to the annual financial statements ( c o n t i n u e d )
sappi
Environmental expenditures and liabilities
Environmental expenditures that pertain to current operations or
relate to future revenues are expensed or capitalised consistent
with the Company’s capitalisation policy. Expenditures that result
from the remediation of an existing condition caused by past
operations, and do not contribute to current or future revenues,
are expensed. Environmental accruals are recorded based on
current interpretation of environmental laws and regulations
when it is probable that a liability has been incurred and the
amount of such liability can be reasonably estimated. Amounts
accrued do not include third-party recoveries. Liabilities are
recognised for remedial activities when the clean-up is probable
and the cost can be reasonably estimated. All available
information is considered including the results of remedial
investigation/feasibility studies (“RI/FS”). In evaluating any
disposal site environmental exposure, an assessment is made of
the Company’s potential share of the remediation costs by
reference to the known or estimated volume of the Company’s
waste that was sent to the site and the range of costs to treat
similar waste at other sites if a RI/FS is not available.
Revenue recognition
Revenue is the net sales value of all products sold to third
parties after the deduction of rebates and excludes value-
added tax.
Revenue is recognised when significant risks and rewards of
ownership are transferred to the buyer, costs can be measured
reliably and receipt of the future economic benefits is probable.
Government grants
Government grants are recognised as income over the periods
necessary to match them with the related costs which they are
intended to compensate.
Discontinuing operations
A discontinuing operation results from the sale or
abandonment of an operation that represents a separate major
line of business and of which the assets, net profit or loss and
activities can be distinguished physically, operationally and for
financial reporting purposes.
Cash and cash equivalents
Cash and cash equivalents consist of highly liquid investments
with insignificant interest rate risk and original maturities of three
months or less. Similar investments with maturities beyond three
months are considered short-term marketable securities.
Financial instruments
Measurement
Financial instruments are initially measured at cost, which
includes transaction costs. Subsequent to initial recognition
these instruments are measured as set out below.
Investments
Listed investments are carried at market value, which is
calculated by reference to stock exchange quoted selling
prices at the close of business on the balance sheet date.
Other investments are shown at fair value.
Trade and other receivables
Trade and other receivables originated by the Group are stated
at cost less provision for doubtful debts.
Cash and cash equivalents
Cash and cash equivalents are measured at fair value, based
on the relevant exchange rates at balance sheet date.
Financial liabilities
Non-derivative financial liabilities are recognised at amortised
cost, comprising original debt less principal payments and
amortisations.
Derivative instruments
Derivative instruments are measured at fair value.
Gains and losses on subsequent measurement
Gains and losses arising from a change in the fair value of
financial instruments that are not part of a hedging relationship

sappi > 2 0 0 1 p a g e 7 1
for the year ended September 2001
are included in net profit or loss in the period in which the
change arises.
For the purposes of hedge accounting, hedges are classified
into two categories: (a) fair value hedges which hedge the
exposure to changes in the fair value of a recognised asset or
liability; and (b) cash flow hedges, which hedge exposure to
variability in cash flows that is either attributable to a particular
risk associated with a recognised asset or liability or a
forecasted transaction.
In relation to fair value hedges which meet the conditions for
hedge accounting, any gain or loss from remeasuring the
hedging instrument to fair value is recognised immediately
against income. Any gain or loss on the hedged item
attributable to the hedged risk is adjusted against the carrying
amount of the hedged item and recognised against income.
In relation to cash flow hedges which meet the conditions for
hedge accounting, the portion of the gain or loss on the
hedging instrument that is determined to be an effective hedge
is recognised directly in shareholders’ equity and the
ineffective portion is recognised against income. For cash flow
hedges affecting future transactions, the gains or losses which
are recognised in shareholders’ equity are transferred to
income in the same period in which the hedged transaction
affects income. Where the hedged transaction results in the
recognition of an asset or a liability, then at the time the asset
or liability is recognised, the associated gains or losses that
had previously been recognised in shareholders’ equity are
included in the initial measurement of the acquisition cost or
other carrying amount of the asset or liability.
Employee benefits
Post-employment benefits – pensions
The policy of the Group is to provide retirement benefits for its
employees. The Group’s contributions to defined contribution
plans in respect of service during a particular period are
recognised as an expense in that period. The current service
cost in respect of defined benefit plans is recognised as an
expense in the current period. Past-service costs, experience
adjustments, the effects of changes in actuarial assumptions
and plan amendments in respect of existing employees in
defined benefit plans are recognised as an expense or income
over the expected remaining working lives of those employees.
The effects of plan amendments in respect of retired
employees in defined benefit plans are measured at the
present value of the effect of the amendments and recognised
as an expense or income in the period in which the plan
amendment is made. An asset is only recognised to the extent
that the Group is able to get a refund or contribution holiday.
Post-employment benefits – medical
The estimated cost of retiree health care and life insurance
benefit plans is accrued during the participants’ actual service
periods up to the dates they become eligible for full benefits.
Workmen’s compensation insurance
Sappi Fine Paper North America has a combination of self-
insured and insured workers’ compensation programmes. The
self-insurance claim liability for workers’ compensation is
based on claims reported and actuarial estimates of adverse
developments and claims incurred but not reported.
Equity compensation benefits
The Group grants share options to certain employees under an
employee share plan. Costs incurred in administering the
scheme are expensed as incurred. No compensation cost
is recognised in these financial statements for options or
shares granted to employees from employee share plans.
Comparative figures
Comparative figures have been regrouped or restated where
necessary to give a more appropriate comparison.
sappi > 2 0 0 1 p a g e 7 2
for the year ended September 2001
US$ million
3. Changes in accounting policies
During the year the Group adopted the following new and revised standards. Where appropriate, comparative figures have
been restated.
Employee benefits: AC 116 (revised)
This revised statement deals with the accounting and disclosure for all employee benefits. The effect of adopting this
statement was to reduce the pension asset to its recoverable amount and increase the leave pay provision to the full liability.
Events after the balance sheet date: AC 107 (revised)
This revised statement requires an adjustment to the financial statements for events after the balance sheet date that
provide further evidence of conditions that existed at the balance sheet date and no adjustments for events or conditions
that arose after the balance sheet date. The Group accordingly changed the treatment of dividends proposed, whereby
dividends and secondary taxation on companies (STC) thereon are recorded when the dividend is declared.
Consolidation: special purpose entities: AC 412
This statement requires the consolidation of special purpose entities, irrespective of their legal structure, in instances where
the Group has the power to govern the financial and operating policies of an entity so as to obtain benefits from its activities.
This has resulted in the consolidation of certain entities that were previously not consolidated.
Provisions, contingent liabilities and contingent assets: AC 130
This statement requires that provisions should only be recognised where the enterprise has a present obligation (legal or
constructive) arising as a result of a past event. The effect of adopting this statement was the reversal of the provision for
plant renewals and maintenance. Such costs will now be expensed in the period incurred.
The following new or revised statements had no effect on the historical financial information, but the Group’s accounting
policies were amended in line with the new standards.
– Leases: AC 105
– Discontinuing operations: AC 117
– Impairment of assets: AC 128
– Intangible assets: AC 129
– Business combinations: AC 131
– Consolidated financial statements and accounting for investments in subsidiaries: AC 132
– Financial instruments: recognition and measurement: AC 133
– Government grants: AC 134
– Share capital – reacquired own equity instruments (treasury shares): AC 416
notes to the annual financial statements ( c o n t i n u e d )
sappi

sappi > 2 0 0 1 p a g e 7 3
for the year ended September 2001
US$ million
3. Changes in accounting policies (continued)
The effects of the above changes are as follows: Net after
Gross Taxation taxation 2001 2000
Restatement of opening distributable reserves in
respect of prior year adjustments
Employee benefits (104) 31 (73) (73) (73)
Events after the balance sheet date 60 – 60 60 45
Consolidation: special purpose entities (9) – (9) (9) (9)
Provisions, contingent liabilities and contingent assets 2 – 2 2 2
(51) 31 (20) (20) (35)
Restatement of opening non-distributable reserves
in respect of prior year adjustments
Employee benefits 14 – 14 14 7
Consolidation: special purpose entities 2 – 2 2 1
Provisions, contingent liabilities and contingent assets 1 – 1 1 –
17 – 17 17 8
The effect on net profit for the current and comparative period is not material.
4. Operating profit
Operating profit is arrived at after taking into account the items detailed below:
Leasing charges for premises 15 15
Leasing charges for plant and equipment
on operating leases 41 42
Remuneration paid other than to bona fide employees
of the Company in respect of: 48 46
– technical services 22 20
– administration services 26 26
Auditors’ remuneration: 5 5
– fees for audit 3 3
– fees for other services 2 2
Research and development costs 13 15
Employee costs 707 769

sappi > 2 0 0 1 p a g e 7 4
for the year ended September 2001
US$ million 2001 2000
5. Non-trading loss
Profit on sale of business (2) (21)
Loss (profit) on sale of property, plant and equipment 2 (4)
Restructuring costs 3 5
Mill closure costs 183 –
Asset impairment 6 8
Deferred finance costs written off on early settlement of loans 9 17
Other 6 (3)
207 2
Attributable tax (77) (2)
130 –
6. Net finance costs
Gross interest and other finance costs * 156 182
Interest received (31) (38)
Interest capitalised (33) (47)
92 97
Gross interest capitalised 45 51
Excess interest cost over recoverable amount – charged against net finance costs (12) (4)
Amortisation of previously capitalised interest – charged against operating profit (15) (18)
Net interest capitalised 18 29
* This includes net foreign exchange gains of 1 9
notes to the annual financial statements ( c o n t i n u e d )
sappi

sappi > 2 0 0 1 p a g e 7 5
for the year ended September 2001
US$ million 2001 2000
7. Taxation
Current tax:
Current year 65 63
Prior year underprovision 19 9
Withholding and other taxes 4 1
Deferred tax:
Current year (58) 124
Prior year adjustment (18) –
Attributable to a reduction in the tax rate (3) –
9 197
Due to the utilisation of previously unrecognised tax losses, the
deferred tax expense for the year has been reduced by: 22 33
Reconciliation of the tax rate: % %
South African statutory taxation rate 30.0 30.0
Foreign taxation rate differential (17.1) 3.5
Weighted average statutory taxation rate 12.9 33.5
Non-taxable income (18.2) (2.9)
Effect of reduction in tax rates (2.1) –
Deferred tax asset not recognised 11.4 0.6
Other taxes 1.0 0.1
Prior year underprovision 1.2 3.1
Effective rate of taxation 6.2 34.4

sappi > 2 0 0 1 p a g e 7 6
for the year ended September 2001
US$ million
8. Earnings per share and headline earnings per shareEarnings per share (EPS)Earnings per share (EPS) is based on the Group’s net profit divided by the weighted average number of shares in issue
during the year under review.
2001 2000
Net profit Shares Per share Net profit Shares Per share
US$ million millions US cents US$ million millions US cents
Basic EPS 138 232.8 59 363 236.9 153
Share options under Sappi share
incentive scheme – 2.4 – – 2.8 –
Other share options – – – 7 5.8 114
Diluted EPS 138 235.2 59 370 245.5 151
The diluted EPS calculations exclude the effect of the convertible guaranteed notes (see note 16) and certain share options
granted under the Sappi share incentive scheme as they would be anti-dilutive.
Headline earnings per shareHeadline earnings per share is based on the Group’s headline earnings divided by the weighted average number of shares
in issue during the year.
Reconciliation between earnings and headline earnings:
2001 2000
Net profit Shares Per share Net profit Shares Per share
US$ million millions US cents US$ million millions US cents
Earnings as reported 138 232.8 59 363 236.9 153
Exceptional items, gross
– Loss (profit) on disposal of
business and fixed assets 6 – – (25) – –
– Mill closure costs and asset impairments 189 – – 8 – –
– Debt restructuring costs 9 – – 17 – –
– Decrease in provisions (5) – – (18) – –
Total tax effect on exceptional items (74) – – 2 – –
EPS before exceptional items (headline) 263 232.8 113 347 236.9 146
Share options under Sappi share
incentive scheme – 2.4 – – 2.8 –
Other share options 3 3.3 94 7 5.8 114
Diluted EPS before exceptional items (headline) 266 238.5 112 354 245.5 144
notes to the annual financial statements ( c o n t i n u e d )
sappi

sappi > 2 0 0 1 p a g e 7 7
for the year ended September 2001
US$ million 2001 2000
9. Property, plant and equipment
Land and buildings
At cost 938 925
Depreciation 376 333
562 592
Plant and equipment
At cost 4,224 4,261
Depreciation 2,048 1,919
2,176 2,342
Capitalised leased assets
Plant and equipment at cost 461 446
Depreciation 309 285
152 161
Aggregate cost 5,623 5,632
Aggregate depreciation 2,733 2,537
Aggregate book value 2,890 3,095
The movement on property, plant and equipment is reconciled as follows:
Plant Capitalised
Land and and leased 2001 2000
buildings equipment assets Total Total
Net book value at beginning of year 592 2,342 161 3,095 3,630
Additions 26 244 23 293 221
Interest capitalised – 1 1 2 –
Disposals (2) (2) – (4) (32)
Depreciation (30) (247) (23) (300) (320)
Impairment (including Mobile closure) (6) (108) – (114) (7)
Translation difference (18) (54) (10) (82) (397)
Net book value at end of year 562 2,176 152 2,890 3,095
Details of land and buildings are available at the registered offices of the respective companies (refer note 26 for details
of encumbrances).
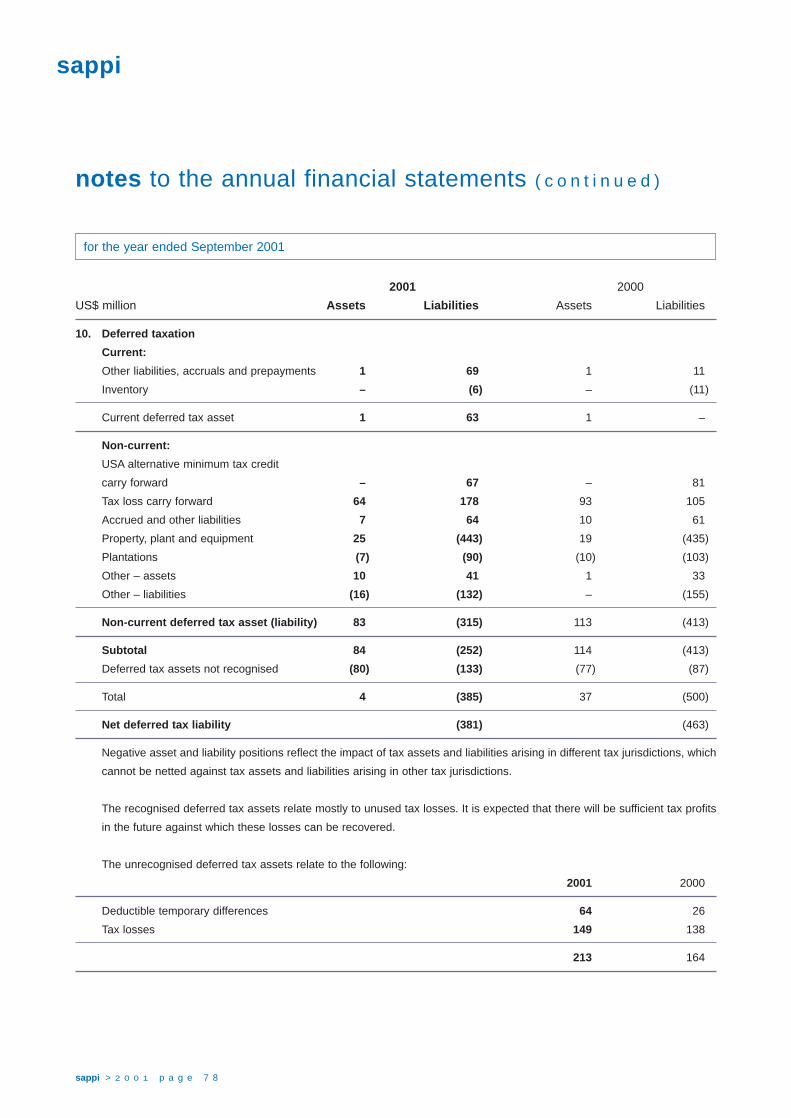
sappi > 2 0 0 1 p a g e 7 8
for the year ended September 2001
2001 2000
US$ million Assets Liabilities Assets Liabilities
10. Deferred taxation
Current:
Other liabilities, accruals and prepayments 1 69 1 11
Inventory – (6) – (11)
Current deferred tax asset 1 63 1 –
Non-current:
USA alternative minimum tax credit
carry forward – 67 – 81
Tax loss carry forward 64 178 93 105
Accrued and other liabilities 7 64 10 61
Property, plant and equipment 25 (443) 19 (435)
Plantations (7) (90) (10) (103)
Other – assets 10 41 1 33
Other – liabilities (16) (132) – (155)
Non-current deferred tax asset (liability) 83 (315) 113 (413)
Subtotal 84 (252) 114 (413)
Deferred tax assets not recognised (80) (133) (77) (87)
Total 4 (385) 37 (500)
Net deferred tax liability (381) (463)
Negative asset and liability positions reflect the impact of tax assets and liabilities arising in different tax jurisdictions, which
cannot be netted against tax assets and liabilities arising in other tax jurisdictions.
The recognised deferred tax assets relate mostly to unused tax losses. It is expected that there will be sufficient tax profits
in the future against which these losses can be recovered.
The unrecognised deferred tax assets relate to the following:
2001 2000
Deductible temporary differences 64 26
Tax losses 149 138
213 164
notes to the annual financial statements ( c o n t i n u e d )
sappi

sappi > 2 0 0 1 p a g e 7 9
for the year ended September 2001
US$ million 2001 2000
10. Deferred taxation (continued)
The following table shows the movement in the unrecognised
deferred tax assets for the year:
Opening balance (164) (190)
Unrecognised deferred tax assets originating during the current year (44) (3)
Movement in foreign exchange rates (5) 29
Closing balance (213) (164)
Reconciliation of net deferred tax liability
Net deferred tax liability at beginning of year (463) (381)
Deferred tax charge for the year 58 (124)
Tax credit originating (24) (16)
Prior year adjustment 18 –
Rate adjustment 3 –
Translation differences 27 58
Net deferred tax liability at end of year (381) (463)
A deferred tax liability of US$31 million (September 2000: US$30 million) in regard to investments in subsidiaries has not
been recognised as the applicable tax law provides a means by which the reported amounts of the investments can be
recovered and the Group expects that it will ultimately use that means.

sappi > 2 0 0 1 p a g e 8 0
for the year ended September 2001
US$ million 2001 2000
11. Other non-current assets
Deferred expenditure 4 22
Patents 9 11
Loan to executive share purchase trust participants 5 12
Unlisted and other investments and loans at cost and Directors’ valuation 60 34
Post-employment benefits – pension asset 20 17
Fair value of derivative instruments 30 –
128 96
Deferred expenditures are recorded net of accumulated amortisation of 77 61
Patents are recorded net of accumulated amortisation of 12 10
12. Trade and other receivables
Trade accounts receivable, gross 87 174
Allowance for doubtful debts 14 11
Trade accounts receivable, net 73 163
Prepayments and other receivables 129 156
202 319
Prepayments and other receivables primarily represent amounts due from
the sale of energy produced by Sappi Fine Paper North America co-generation
facilities, certain outstanding insurance claims, prepaid insurance, prepaid rent
and sundry other receivables.
13. Inventories
Raw materials 87 110
Work in progress 54 66
Finished goods 224 239
Consumable stores and spares 148 140
513 555
Included in the above is inventory carried at a net realisable value of US$53 million (September 2000: US$68 million).
notes to the annual financial statements ( c o n t i n u e d )
sappi

sappi > 2 0 0 1 p a g e 8 1
for the year ended September 2001
US$ million 2001 2000
14. Ordinary share capital and premiumAuthorised share capital:
325,000,000 (September 2000: 325,000,000) shares of R1 each
Issued share capital:
239,071,892 (September 2000: 239,071,892) shares of R1 each 104 105
Share premium 1,750 1,832
1,854 1,937
Included in the issued ordinary shares above are 9,586,124 (September 2000: nil) shares held as treasury shares by a
subsidiary (Sappi Share Facilitation Company (Pty) Limited) which will be utilised mainly to meet the requirements of the
Sappi Limited Share Incentive Trust.
Under the authority granted at the annual general meeting of the Company’s shareholders held on 1 March 2001, the
Company’s Directors were authorised to issue the balance of unissued shares to such person or persons on such terms and
conditions as they may determine. The authority expires at the next annual general meeting, unless renewed thereat.
Sappi has a general authority to purchase its shares up to a maximum of 20% of the issued share capital in any one financial
year. This is in terms of the annual general meeting of shareholders on 1 March 2001. The general authority is subject to
the Listings Requirements of the JSE Securities Exchange South Africa and the Companies Act No 61 of 1973 of South
Africa, as amended.
17,930,392 (September 2000: 17,930,392) shares have been allocated for the Executive Share Purchase Trust of which a
total of 1,799,371 (September 2000: 2,724,325) shares were in issue at September 2001.
11,944,809 (September 2000: 11,944,809) ordinary shares are reserved for the issue in the event of the conversion of the
convertible guaranteed notes issued by Sappi BVI Finance Limited (refer note 16).
15. Non-distributable reservesReduction in capital arising from the transfer of share
premium under a special resolution
dated 14 April 1975 2 2
Capitalisation of distributable reserves 32 32
Legal reserves in subsidiaries 50 43
Foreign currency translation reserve (1,089) (971)
(1,005) (894)
The negative balance in the Foreign Currency Translation Reserve represents the cumulative translation effect of the
strength of the Dollar on the Group’s equity in Rands and other currencies. The translation effect of reporting in US Dollars
has no impact on the underlying cash flows of the business.
The amounts recorded as “Capitalisation of distributable reserves” and “Legal reserves in subsidiaries” represent equity of
the Company that is not available for distribution as a result of appropriations of equity by subsidiaries and legal
requirements, respectively.

sappi > 2 0 0 1 p a g e 8 2
for the year ended September 2001
US$ million 2001 2000
16. Interest-bearing borrowings
Secured borrowings
– Mortgage and pledge over certain assets (refer note 26) 298 392
– Capitalised lease liabilities (refer note 26) 142 101
Total secured borrowings 440 493
Unsecured borrowings 1,063 947
Total borrowings 1,503 1,440
Less: Current portion included in current liabilities 489 162
1,014 1,278
The repayment profile of the interest-bearing borrowings is as follows:
Payable in the year ended September:
2001 – 162
2002 489 426
2003 378 107
2004 122 127
2005 82 210
2006 (September 2000: Thereafter) 59 408
Thereafter 373 –
1,503 1,440
Capitalised lease liabilities
Capital (finance) leases are primarily for plant and equipment. Lease terms generally range from five to ten years with
options to make early settlements or renew at varying terms. At the time of entering into capital lease agreements, the
commitments are recorded at the present value using applicable interest rates. As of September 2001, the aggregate
amounts of minimum lease payments and the related imputed interest under capitalised lease contracts payable in each of
the next five financial years and thereafter are as follows:
Present value of Present value of
Minimum lease minimum lease minimum lease
payments Interest payments payments
Payable in the year ended September:
2001 – – – 46
2002 49 (12) 37 30
2003 45 (5) 40 6
2004 39 (15) 24 10
2005 30 (3) 27 6
2006 (September 2000: Thereafter) 14 (1) 13 3
Thereafter 2 (1) 1 –
Total future minimum lease payments 179 (37) 142 101
notes to the annual financial statements ( c o n t i n u e d )
sappi

sappi > 2 0 0 1 p a g e 8 3
for the year ended September 2001
16. Interest-bearing borrowings (continued)
Set out below are details of the more significant non-current interest-bearing borrowings in the Group at September 2001.
Type Currency Interest p.a. Value Conversion Maturity Comments
Convertible notes
Convertible US$ 7.50% US$243 million At holders’ 1 August 2002 The issuer,
guaranteed notes (principal option between Sappi BVI Finance
(refer note 35) US$250 million, 26 October 1995 Limited, can
of which and 25 July 2002 redeem
US$1 million into Sappi Limited after 1 August
was repurchased share capital. 1998. To date
in January 1999 Price ZAR76 US$7 million
and US$6 million @ ZAR3.6450 repurchased
in November = US$1 and cancelled
2000)
Bank Currency Interest rate Value Security Expiry Covenants
Capitalised
leases
Sapnet Trust ZAR Variable linked ZAR185 million Plant and March 2005 No covenants
Nedbank to JIBAR equipment
ABSA ZAR Variable linked ZAR84 million Plant and March 2003 Net finance cost
to JIBAR equipment cover ratio and
debt equity ratio
First National Bank ZAR Variable linked ZAR48 million Plant and September 2006 No covenants
to JIBAR equipment
First National Bank ZAR Variable ZAR76 million Leased assets December 2007 Net finance cost
effectively encumbered cover ratio and
based on debt equity ratio
market rate
Secured bank
term loans
ABSA ZAR Fixed (swapped ZAR167 million Secured over August 2005 Net finance cost
into variable) assets cover
SCMB ZAR Fixed (swapped ZAR83 million Secured over January 2007 No covenants
into variable) assets

sappi > 2 0 0 1 p a g e 8 4
for the year ended September 2001
16. Interest-bearing borrowings (continued)
Bank Currency Interest rate Value Security Expiry Covenants
Redeemable
bondsTown of US$ Fixed US$107 million Land and 2022 No covenants
Skowhegan/ buildings
Michigan
Strategic
Fund/City of
Westbrook
Exchange debenturesUnited States US$ 14% US$135 million Unsecured December 2006 Restrictive
Trust Company (first call date covenants
of New York, December 2001)
as trustee
Bank Currency Interest rate Value Expiry Covenants
Unsecured bank term loansSyndicated loan US$ Variable US$250 million July 2003 Net finance cost cover ratio,
with agent equity ratio and net debt
Citibank to total capitalisation ratio
Consortium of US$ Variable US$119 million May 2006 Net finance cost cover and
banks with agent debt to total capitalisation ratio
Investec
Österreichische EUR Variable EUR21 million December 2001 Net finance cost cover ratio
Kontrollbank Fixed EUR224 million December 2007 and equity ratio
Raffeisen EUR Variable EUR9 million December 2001 Net finance cost cover
Zentralbank Fixed EUR23 million December 2003 ratio and equity ratio
European EUR Variable EUR80 million December 2004 Net finance cost
Investment Bank Variable EUR16 million September 2003 cover ratio and equity ratio
Fixed EUR70 million June 2002
MLS Bank ZAR Fixed (swapped ZAR400 million December 2005 Gearing ratio/interest cover
into variable)
notes to the annual financial statements ( c o n t i n u e d )
sappi

sappi > 2 0 0 1 p a g e 8 5
for the year ended September 2001
16. Interest-bearing borrowings (continued)
Financial instruments and other loansThe Group also has financial instruments and other loans with various banks, expiry dates and security, in various currencies
at fixed and variable interest rates for amounts totalling US$129 million.
Unused credit facilitiesSet out below is a synopsis of the unused credit facilities by geographic region. These facilities are at various banks in
various currencies with various expiry dates.
Geographic region Interest rate US$ million
Southern Africa Variable 188
Europe Variable 1,092
North America Variable 79
US$ million 2001 2000
17. Other non-current liabilitiesPost-employment benefits – pension obligations (refer note 29) 86 89
Post-retirement benefits other than pension obligations (refer note 30) 85 79
Workmen’s compensation 8 11
Unfavourable contracts 8 10
Restructuring provisions (refer note 18) 24 12
Fair value of derivative instruments 2 –
Other 28 17
241 218

sappi > 2 0 0 1 p a g e 8 6
for the year ended September 2001
US$ million 2001 2000
18. Provisions
Other provisions 35 34
Restructuring provisions 46 21
81 55
Summary of movement in provisions:
Other provisions Restructuring provisions
Severance Lease
and Retrench- cancel and
related ment penalty Other Total
costs costs cost restructuring restructuring
Balance at September 1999 37 15 2 – 40 57
Increase in provisions 5 3 1 – 3 7
Utilised (7) (5) (1) – (18) (24)
Translation effect (1) (2) – – (5) (7)
Balance at September 2000 34 11 2 – 20 33
Increase in provisions 8 31 3 28 41 103
Utilised (7) (4) (2) (5) (24) (35)
Released during the year – (4) (1) (14) (5) (24)
Transfer to pension obligations – – – – (8) (8)
Translation effect – – – – 1 1
Balance at September 2001 35 34 2 9 25 70
2001 2000
Included in other non-current liabilities (refer note 17) 24 12
Included in provisions 46 21
Total restructuring provisions 70 33
September 2001 restructuring plans
Sappi Fine Paper North America
During the financial year ended September 2001, Sappi Fine Paper North America announced the closure of the Mobile mill.
The closure has already affected 268 employees and costs of US$76 million relating to closure of operations, relocation of
plant facilities, retrenchment, severance and other related costs were incurred and have been included in the income
statement as mill closure cost. The provision at September 2001 was US$50 million.
notes to the annual financial statements ( c o n t i n u e d )
sappi

sappi > 2 0 0 1 p a g e 8 7
for the year ended September 2001
18. Provisions (continued)
Sappi Fine Paper Europe
During the year a programme was started to reskill certain employees at the Maastricht mill for alternative employment. It
is expected to affect 40 people of whom two were affected by year-end. The restructuring provision was increased by
US$3 million for this programme. The provision at year end September 2001 was US$3 million for the severance, training
and legal costs. During the year Blackburn mill changed the shift system from five shifts to four shifts. This is anticipated to
affect 22 people of whom six had been affected by year-end September 2001. The increase in the restructuring provision
was US$1 million which remains on the balance sheet at year-end.
September 2000 restructuring plans
Sappi Forest Products
During the financial year ended September 2000, Sappi Forest Products closed certain of its mining timber mills and
restructured the divisional head office as a result of the sale of Novobord. Three hundred and eighty-three personnel were
affected and costs of US$2 million relating to retrenchment, severance, lease cancellation and other related costs were
incurred and have been included in the income statement as restructuring costs under “Non-trading loss” (refer note 5). The
provision at September 2000 was US$2 million.
Sappi Fine Paper Europe
During the financial year ended September 2000 the Astralux division of the Blackburn mill was sold. This resulted in an
increase in the provision for restructuring of US$2 million. The plan has already affected 45 employees. The provision for
severance costs at September 2000 was US$1 million.
US$ million 2001 2000
19. Cash generated by operations
Profit before tax per income statement 147 573
Adjustment for:
– Depreciation 300 320
– Fellings 30 36
– Net finance costs 92 97
– Mill closure costs 183 –
– Asset impairment 6 8
– Other non-cash items 13 14
771 1,048
20. Decrease (increase) in working capital
Decrease (increase) in inventories 17 (92)
Decrease (increase) in receivables 108 (1)
(Decrease) increase in payables (74) 32
51 (61)
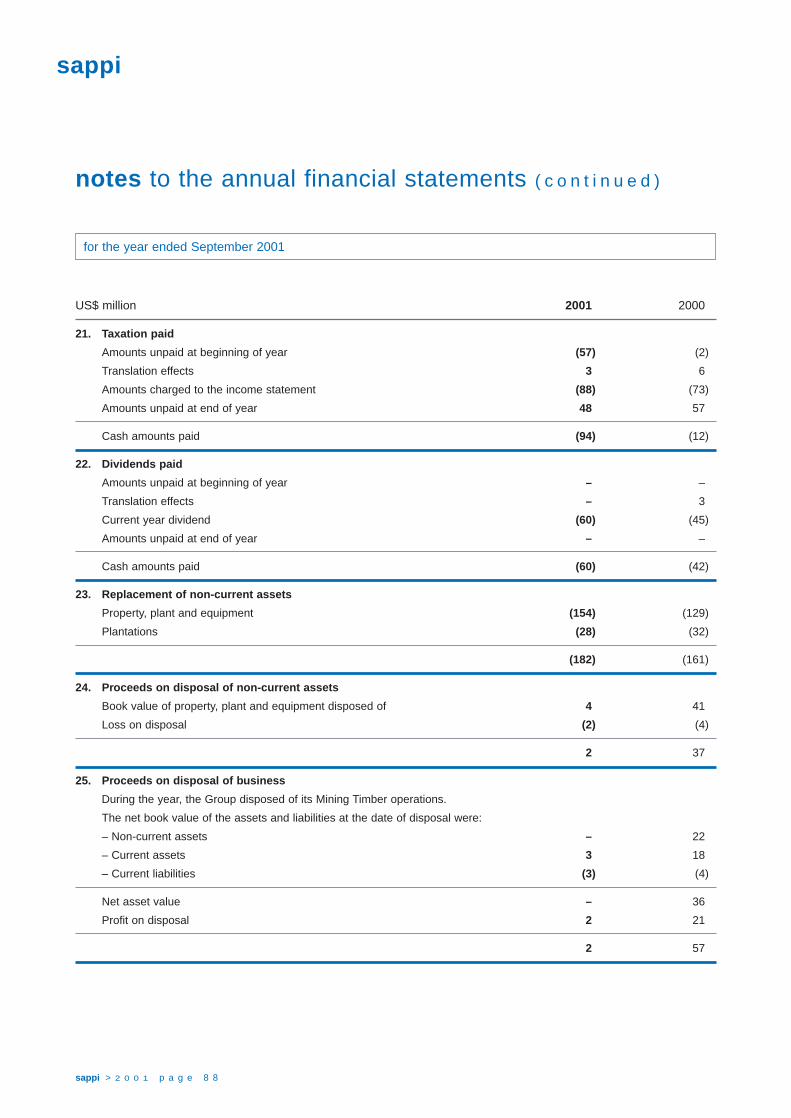
sappi > 2 0 0 1 p a g e 8 8
for the year ended September 2001
US$ million 2001 2000
21. Taxation paid
Amounts unpaid at beginning of year (57) (2)
Translation effects 3 6
Amounts charged to the income statement (88) (73)
Amounts unpaid at end of year 48 57
Cash amounts paid (94) (12)
22. Dividends paid
Amounts unpaid at beginning of year – –
Translation effects – 3
Current year dividend (60) (45)
Amounts unpaid at end of year – –
Cash amounts paid (60) (42)
23. Replacement of non-current assets
Property, plant and equipment (154) (129)
Plantations (28) (32)
(182) (161)
24. Proceeds on disposal of non-current assets
Book value of property, plant and equipment disposed of 4 41
Loss on disposal (2) (4)
2 37
25. Proceeds on disposal of business
During the year, the Group disposed of its Mining Timber operations.
The net book value of the assets and liabilities at the date of disposal were:
– Non-current assets – 22
– Current assets 3 18
– Current liabilities (3) (4)
Net asset value – 36
Profit on disposal 2 21
2 57
notes to the annual financial statements ( c o n t i n u e d )
sappi

sappi > 2 0 0 1 p a g e 8 9
for the year ended September 2001
US$ million 2001 2000
26. Encumbered assets
Suspensive sale agreements are instalment sale agreements which the
Group has entered into in respect of certain plant and equipment and the
assets purchased are encumbered as security for the outstanding liability
until such time as the liability is discharged.
The book values and details of assets which are mortgaged, hypothecated
or subject to a pledge as security for borrowings, capitalised leases or
suspensive sale agreements are as follows:
Land and buildings 115 267
Plant and equipment 322 1,112
Other non-current assets – 46
Inventories – 210
Cash at bank and on deposit – 40
437 1,675
The refinancing of the Sappi Fine Paper North America credit facility in
September 2001 has removed the encumbrances on most of their assets.
27. Commitments
Capital commitments
Contracted but not provided 78 73
Approved but not contracted 109 150
187 223
The capital expenditure will be financed by funds generated by the business, existing
cash resources and borrowing facilities available to the Group.
Revenue commitments
Future minimum obligations under operating leases:
Payable in the year ended September:
2001 – 47
2002 46 91
2003 37 30
2004 37 31
2005 (September 2000: Thereafter) 34 176
Thereafter 182 –
336 375
sappi > 2 0 0 1 p a g e 9 0
for the year ended September 2001
US$ million 2001 2000
28. Contingent liabilities
Guarantees and suretyships 79 80
Other contingent liabilities 27 46
The Group is involved in various lawsuits and administrative proceedings. The relief sought in such lawsuits and
proceedings includes injunctions, damages and penalties. Although the final results in these suits and proceedings cannot
be predicted with certainty, it is the present opinion of the Company, after consulting with legal counsel, that they will not
have a material effect on the Company’s consolidated financial position, results of operations or cash flows.
Certain Group companies are subject to taxation queries which could give rise to additional taxation costs. However,
management currently believes, based on legal counsel opinion, that no further material costs will arise.
29. Post-employment benefits – pensions
The Group operates a number of defined benefit pension schemes covering full-time permanent employees. Such plans
have been established in accordance with applicable legal requirements, customs and existing circumstances in each
country. Benefits are generally based upon compensation and years of service. With the exception of our German and
Austrian operations, the assets of these schemes are held in separate trustee administered funds which are subject to
varying statutory requirements in the particular countries concerned. In terms of these requirements, periodic actuarial
valuations of these funds are performed by independent actuaries. Sappi Papier Holding AG holds bonds to the value of
US$11 million to cover the pension obligations of Sappi Austria AG.
Actuarial valuations of all the funds are performed annually.
Group companies have no other significant post-employment benefit liabilities except for the health care benefits provided
to persons in the United States and in South Africa (refer note 30).
The following table, based on the latest valuations, summarises the funded status and amounts recognised in the Group’s
financial statements for defined benefit plans for the Group’s operations.
notes to the annual financial statements ( c o n t i n u e d )
sappi

sappi > 2 0 0 1 p a g e 9 1
for the year ended September 2001
2001 2000
Assets Assets
exceed Accumulated exceed Accumulated
accumulated benefits accumulated benefits
benefits exceed assets benefits exceed assets
Southern United Southern United
US$ million Africa Europe States Africa Europe States
29. Post-employment benefits
– pensions (continued)
Change in benefit obligation
Benefit obligations at
beginning of year 171 375 207 189 454 204
Service cost 10 11 7 9 12 7
Interest cost 21 18 16 23 23 15
Plan participants’ contribution – – – – 1 –
Amendments 3 7 13 – 2 –
Actuarial loss (gain) 8 20 4 (1) (37) (11)
Benefits paid (17) (16) (8) (16) (14) (8)
Translation difference (36) 14 – (33) (66) –
Benefit obligation at end of year 160 429 239 171 375 207
Change in plan assets
Fair value of assets at
beginning of year 200 343 205 220 361 192
Actual return on plan assets 36 (6) (9) 27 42 10
Acquisition – 12 – – (8) –
Employer contribution 2 11 5 4 15 11
Plan participants’ contribution 3 1 – 4 1 –
Benefits paid (17) (13) (8) (16) (12) (8)
Translation difference (41) 11 – (39) (56) –
Fair value of assets at end of year 183 359 193 200 343 205
Funded status
Funded status 23 (70) (46) 29 (32) (2)
Unrecognised net actuarial gain (loss) 40 30 4 55 (9) (39)
Unrecognised prior service cost 3 (2) 5 – 3 9
Contributions – – – – – 5
Net prepaid (accrued)
post-retirement cost 66 (42) (37) 84 (38) (27)
Net prepaid post-retirement
cost limited to recoverable amount (66) – – (84) – –
– (42) (37) – (38) (27)

sappi > 2 0 0 1 p a g e 9 2
for the year ended September 2001
2001 2000
Southern United Southern United
US$ million Africa Europe States Africa Europe States
29. Post-employment benefits
– pensions (continued)
Net periodic pension cost
Service cost 8 12 7 10 14 7
Interest cost 21 25 15 23 23 14
Expected return on plan assets (25) (26) (19) (29) (24) (18)
Amortisation of prior period
service cost – 1 1 3 1 1
Recognised net actuarial
loss (gain) 2 – 11 – 1 (1)
Net pension cost charged to
operating income 6 12 15 7 15 3
Actuarial assumptions
Discount rate (%) 13.50 5.82 7.50 13.81 5.82 7.75
Compensation increase (%) 11.00 3.25 4.00 12.50 3.18 4.00
Expected long-term return
on assets (%) 14.50 5.45 9.25 15.00 6.33 9.25
notes to the annual financial statements ( c o n t i n u e d )
sappi
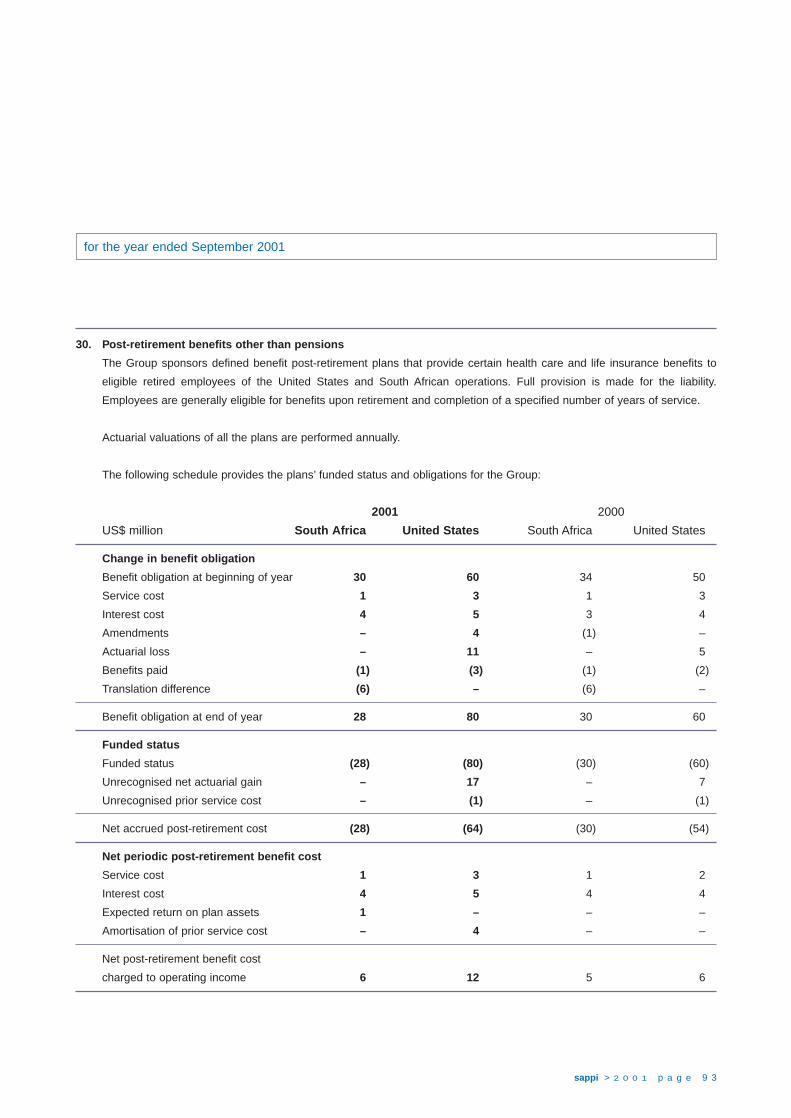
sappi > 2 0 0 1 p a g e 9 3
for the year ended September 2001
30. Post-retirement benefits other than pensions
The Group sponsors defined benefit post-retirement plans that provide certain health care and life insurance benefits to
eligible retired employees of the United States and South African operations. Full provision is made for the liability.
Employees are generally eligible for benefits upon retirement and completion of a specified number of years of service.
Actuarial valuations of all the plans are performed annually.
The following schedule provides the plans’ funded status and obligations for the Group:
2001 2000
US$ million South Africa United States South Africa United States
Change in benefit obligation
Benefit obligation at beginning of year 30 60 34 50
Service cost 1 3 1 3
Interest cost 4 5 3 4
Amendments – 4 (1) –
Actuarial loss – 11 – 5
Benefits paid (1) (3) (1) (2)
Translation difference (6) – (6) –
Benefit obligation at end of year 28 80 30 60
Funded status
Funded status (28) (80) (30) (60)
Unrecognised net actuarial gain – 17 – 7
Unrecognised prior service cost – (1) – (1)
Net accrued post-retirement cost (28) (64) (30) (54)
Net periodic post-retirement benefit cost
Service cost 1 3 1 2
Interest cost 4 5 4 4
Expected return on plan assets 1 – – –
Amortisation of prior service cost – 4 – –
Net post-retirement benefit cost
charged to operating income 6 12 5 6
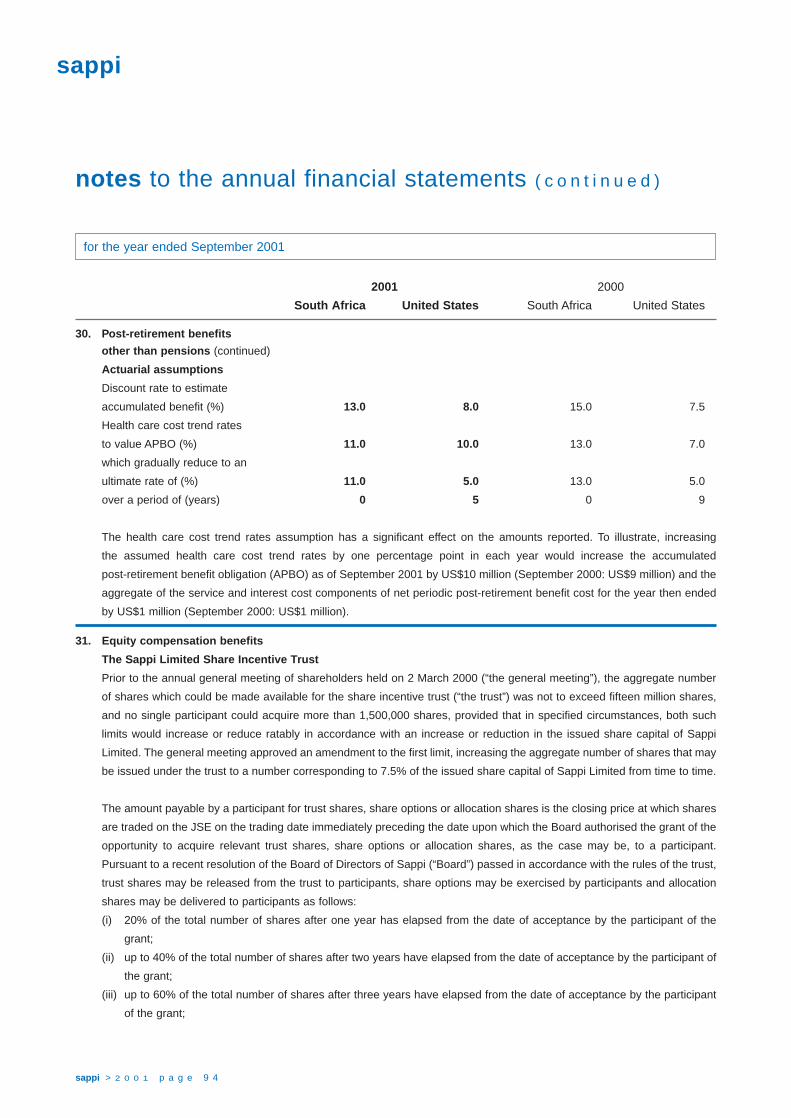
sappi > 2 0 0 1 p a g e 9 4
for the year ended September 2001
2001 2000
South Africa United States South Africa United States
30. Post-retirement benefits
other than pensions (continued)
Actuarial assumptions
Discount rate to estimate
accumulated benefit (%) 13.0 8.0 15.0 7.5
Health care cost trend rates
to value APBO (%) 11.0 10.0 13.0 7.0
which gradually reduce to an
ultimate rate of (%) 11.0 5.0 13.0 5.0
over a period of (years) 0 5 0 9
The health care cost trend rates assumption has a significant effect on the amounts reported. To illustrate, increasing
the assumed health care cost trend rates by one percentage point in each year would increase the accumulated
post-retirement benefit obligation (APBO) as of September 2001 by US$10 million (September 2000: US$9 million) and the
aggregate of the service and interest cost components of net periodic post-retirement benefit cost for the year then ended
by US$1 million (September 2000: US$1 million).
31. Equity compensation benefits
The Sappi Limited Share Incentive Trust
Prior to the annual general meeting of shareholders held on 2 March 2000 (“the general meeting”), the aggregate number
of shares which could be made available for the share incentive trust (“the trust”) was not to exceed fifteen million shares,
and no single participant could acquire more than 1,500,000 shares, provided that in specified circumstances, both such
limits would increase or reduce ratably in accordance with an increase or reduction in the issued share capital of Sappi
Limited. The general meeting approved an amendment to the first limit, increasing the aggregate number of shares that may
be issued under the trust to a number corresponding to 7.5% of the issued share capital of Sappi Limited from time to time.
The amount payable by a participant for trust shares, share options or allocation shares is the closing price at which shares
are traded on the JSE on the trading date immediately preceding the date upon which the Board authorised the grant of the
opportunity to acquire relevant trust shares, share options or allocation shares, as the case may be, to a participant.
Pursuant to a recent resolution of the Board of Directors of Sappi (“Board”) passed in accordance with the rules of the trust,
trust shares may be released from the trust to participants, share options may be exercised by participants and allocation
shares may be delivered to participants as follows:
(i) 20% of the total number of shares after one year has elapsed from the date of acceptance by the participant of the
grant;
(ii) up to 40% of the total number of shares after two years have elapsed from the date of acceptance by the participant of
the grant;
(iii) up to 60% of the total number of shares after three years have elapsed from the date of acceptance by the participant
of the grant;
notes to the annual financial statements ( c o n t i n u e d )
sappi

sappi > 2 0 0 1 p a g e 9 5
for the year ended September 2001
31. Equity compensation benefits (continued)
(iv) up to 80% of the total number of shares after four years have elapsed from the date of acceptance by the participant
of the grant; and
(v) the balance of the shares after five years have elapsed from the date of acceptance by the participant of the grant;
provided that the Board may, at its discretion, anticipate or postpone such dates. Prior to the general meeting held on 2 March
2000, the trust provided that share options will lapse, among other reasons, if they remain unexercised after the tenth anniversary
of the acceptance and that trust shares and allocation shares must be paid for in full by participants by no later than the tenth
anniversary of the acceptance. However, the general meeting approved an amendment to decrease the aforesaid ten-year
period to eight years, in respect of offers made since 3 December 1999. The Board has resolved that the benefits under the trust
of participants will be accelerated in the event of a change of control of the Company as defined in the trust, becoming effective
(a) if, in concluding the change of control, the board in office at the time immediately prior to the proposed change of control being
communicated to the Board ceases to be able to determine the future employment conditions of the Group’s employees or (b)
unless the change of control is initiated by the Board. Participants shall be entitled to require such acceleration by written notice
to the Company within a period of 90 days after the date upon which such change of control becomes effective.
Share option and allocation share option activity was as follows during the financial years ended September 2000 and 2001:
Weighted average Allocation Weighted average
Share options exercise price (US$) share options exercise price (US$)
Outstanding at September 1999 3,245,256 5.72 2,144,900 4.66
Granted 1,557,250 6.13 908,000 4.84
Exercised (127,739) 6.25 (58,500) 5.37
Forfeited (224,808) – (2,700) –
Outstanding at September 2000 4,449,959 6.65 2,991,700 5.85
Granted 791,700 6.27 606,750 6.26
Exercised (1,441,327) 4.13 (1,059,783) 3.61
Forfeited (61,153) 7.31 (76,600) 3.82
Outstanding at September 2001 3,739,179 4.39 2,462,067 4.36

sappi > 2 0 0 1 p a g e 9 6
for the year ended September 2001
31. Equity compensation benefits (continued)
The following table summarises the status of share options and allocation share options outstanding and exercisable as
of September 2001:
Share options outstanding Share options exercisable
Range of Weighted Weighted Weighted
exercise average average exercise average exercise
price (US$) Number remaining life price (US$) Number price (US$)
2.23 to 3.13 1,457,850 74 months 2.42 679,690 2.37
3.90 to 5.48 990,900 81 months 5.15 161,360 3.95
6.01 to 7.55 1,290,429 84 months 6.04 307,349 6.10
Allocation share options outstanding Allocation share options exercisable
Range of Weighted Weighted Weighted
exercise average average exercise average exercise
price (US$) Number remaining life price (US$) Number price (US$)
2.22 to 2.47 915,617 82 months 2.38 445,190 2.35
3.90 to 5.48 823,650 86 months 5.10 143,360 4.04
6.02 722,800 75 months 6.02 144,560 6.02
220,300 scheme shares (September 2000: 488,500) were granted at a weighted average exercise price per share of
US$6.27 (September 2000: US$6.13).
The Sappi Limited Share Incentive Trust has forward purchased 6,244,867 Sappi Limited shares from a subsidiary of
Sappi Limited. This subsidiary purchased the Sappi Limited shares on the open market. The delivery and payment for these
shares purchased by the Trust is deferred until it requires the shares to meet its obligation to the participants of the Trust.
Share options and allocation shares to Executive Directors, which are included in the above figures, are as follows:
Number of
options/shares
At beginning of year 925,000
Share options and allocation shares granted 205,000
Share options and allocation shares exercised (157,000)
At end of year 973,000
notes to the annual financial statements ( c o n t i n u e d )
sappi

sappi > 2 0 0 1 p a g e 9 7
for the year ended September 2001
31. Equity compensation benefits (continued)
Share options and allocation shares exercised by Executive Directors during the year had an average exercise price per
share of US$2.52 and an average market price per share of US$7.21. The following table sets forth certain information with
respect to the 973,000 share options and allocation shares granted by Sappi to Executive Directors:
Number of Exercise price
Issue date options/shares Expiration date (ZAR)
24 February 1997 40,000 24 February 2007 34.90
19 January 1998 85,000 19 January 2008 19.90
27 May 1998 100,000 27 May 2008 27.90
11 December 1998 135,000 11 December 2008 22.10
1 April 1999 64,000 1 April 2009 21.30
9 June 1999 64,000 9 June 2009 39.00
21 December 1999 280,000 21 December 2007 53.85
15 January 2001 155,000 15 January 2009 49.00
30 March 2001 50,000 30 March 2009 61.00
32. Financial instruments
The Group’s financial instruments consist mainly of cash and cash equivalents, accounts receivable, certain investments,
accounts payable, borrowings and derivative instruments.
1. Risk management objectives and policies
The principal market risks (that is the risk of loss arising from adverse changes in market rates and prices) to which Sappi
is exposed through financial instruments are:
– interest rates on non-current borrowings;
– foreign exchange rates, generating translation and transaction gains and losses.
Interest rate risk
Sappi has a policy of maintaining a balance between fixed rate and variable rate loans that enables it to minimise, on a
cost-effective basis, the impact on reported earnings while maintaining a reasonably competitive, market-related cost of
funding. The specific balance is determined separately for the European, North American and Southern African businesses
of Sappi to reflect more accurately the different interest rate environments in which these businesses operate. We monitor
market conditions and may utilise interest rate derivatives to alter the existing balance between fixed and variable interest
loans in response to changes in the interest rate environment.
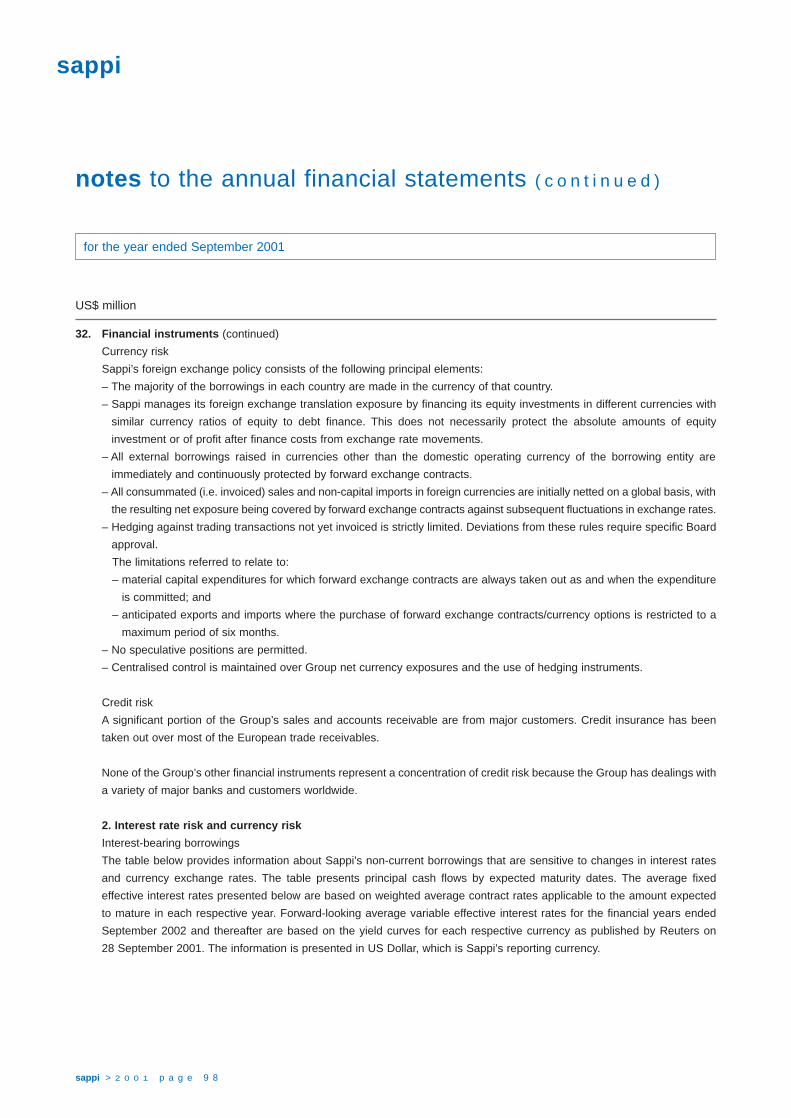
sappi > 2 0 0 1 p a g e 9 8
for the year ended September 2001
US$ million
32. Financial instruments (continued)
Currency risk
Sappi’s foreign exchange policy consists of the following principal elements:
– The majority of the borrowings in each country are made in the currency of that country.
– Sappi manages its foreign exchange translation exposure by financing its equity investments in different currencies with
similar currency ratios of equity to debt finance. This does not necessarily protect the absolute amounts of equity
investment or of profit after finance costs from exchange rate movements.
– All external borrowings raised in currencies other than the domestic operating currency of the borrowing entity are
immediately and continuously protected by forward exchange contracts.
– All consummated (i.e. invoiced) sales and non-capital imports in foreign currencies are initially netted on a global basis, with
the resulting net exposure being covered by forward exchange contracts against subsequent fluctuations in exchange rates.
– Hedging against trading transactions not yet invoiced is strictly limited. Deviations from these rules require specific Board
approval.
The limitations referred to relate to:
– material capital expenditures for which forward exchange contracts are always taken out as and when the expenditure
is committed; and
– anticipated exports and imports where the purchase of forward exchange contracts/currency options is restricted to a
maximum period of six months.
– No speculative positions are permitted.
– Centralised control is maintained over Group net currency exposures and the use of hedging instruments.
Credit risk
A significant portion of the Group’s sales and accounts receivable are from major customers. Credit insurance has been
taken out over most of the European trade receivables.
None of the Group’s other financial instruments represent a concentration of credit risk because the Group has dealings with
a variety of major banks and customers worldwide.
2. Interest rate risk and currency risk
Interest-bearing borrowings
The table below provides information about Sappi’s non-current borrowings that are sensitive to changes in interest rates
and currency exchange rates. The table presents principal cash flows by expected maturity dates. The average fixed
effective interest rates presented below are based on weighted average contract rates applicable to the amount expected
to mature in each respective year. Forward-looking average variable effective interest rates for the financial years ended
September 2002 and thereafter are based on the yield curves for each respective currency as published by Reuters on
28 September 2001. The information is presented in US Dollar, which is Sappi’s reporting currency.
notes to the annual financial statements ( c o n t i n u e d )
sappi

sappi > 2 0 0 1 p a g e 9 9
for the year ended September 2001
32. Financial instruments (continued)
Expected maturity date
2002 2003 2004 2005 2006 2007+ Total Fair value
(US$ equivalent in millions)
US Dollar
Fixed rate 243 – – – – 241 484 496
Average interest rate (%) 7.50 – – – – 10.81 9.15
Variable rate 25 275 25 25 19 5 374 374
Average interest rate (%) 7.49 4.27 7.49 7.49 7.49 – 5.00
EUR
Fixed rate 80 35 59 35 35 72 316 322
Average interest rate (%) 5.20 5.32 5.00 5.33 5.33 5.04 5.17
Variable rate 94 42 27 7 – – 170 170
Average interest rate (%) 4.36 4.72 4.80 4.80 – – 4.53
Rand
Variable rate 47 26 11 15 5 55 159 159
Average interest rate (%) 11.05 11.52 15.62 12.75 14.13 13.59 12.59
Total
Fixed rate 323 35 59 35 35 313 800 818
Average interest rate (%) 6.93 5.32 5.01 5.34 5.33 9.48 7.58
Variable rate 166 343 63 47 24 60 703 703
Average interest rate (%) 6.71 4.87 7.82 8.78 8.83 12.21 6.61
Fixed and variable 489 378 122 82 59 373 1,503 1,521
The fair value of non-current borrowings is estimated by Sappi based on the market rates quoted by Reuters for non-current borrowings with fixed
interest rates and on quotations provided by internationally recognised pricing services for notes, exchange debentures and revenue bonds.
The range of interest rates in respect of all non-current borrowings, comprising both fixed and floating rate obligations, is
between 4.27% and 15.62%. At September 2001, 53.2% of Sappi’s non-current borrowings were at fixed rates of interest,
and 46.8% were at floating rates. Floating rates of interest are based on LIBOR (London Interbank Offered Rate), on
EURIBOR (European Interbank Offered Rate) and on JIBAR (Johannesburg Interbank Agreed Rate). Fixed rates of interest
are based on contract rates.
Sappi’s Southern African operations have in the past been particularly vulnerable to adverse changes in short-term domestic
interest rates, as a result of the emerging market status of the South African money markets. During 2001 domestic interest
rates have been relatively stable within a range from 10.3% to 9.0% for the three-month JIBAR.

sappi > 2 0 0 1 p a g e 1 0 0
for the year ended September 2001
32. Financial instruments (continued)
Interest rate derivatives
Sappi uses interest rate options, caps, swaps and forward rate agreements as a means of managing interest rate risk
associated with outstanding borrowings entered into in the normal course of business. Sappi does not use these instruments
for speculative purposes. Certain interest rate derivative financial instruments are subject to hedge accounting.
As at September 2001, Sappi had five interest rate swap contracts outstanding. They were for a total amount of
US$188 million and had a favourable fair value of US$19 million. Four interest swaps converted fixed interest rates
of 17.65% (two contracts), 14.88% and 18.00% respectively into variable interest rates and one interest swap converted
a variable interest rate into a fixed interest rate of 10.31%.
In addition, at September 2001, Sappi had four caps, two forward rate agreements and one zero cost collar, with a fair value
of negative US$1 million.
Nominal value Fair value
Instrument Interest rate Maturity date US$ million US$ million
Caps:
1 19.00% March 2002 17 –
2 19.00% March 2002 17 –
3 19.30% November 2005 30 –
4 19.00% September 2003 18 –
Collars:
1
– Cap 19.00% February 2003 9 –
– Floor 14.10% February 2003 9 –
Interest rate swaps:
1 17.65% to variable February 2003 56 3
2 17.65% to variable February 2003 56 5
3 14.88% to variable December 2005 Amortising 9
4 18.00% to variable March 2003 Amortising 2
5 10.31% fixed March 2003 11 –
FRA (forward rate agreement):
1 10.30% August 2002 56 –
2 9.90% February 2003 56 –
Total 19
notes to the annual financial statements ( c o n t i n u e d )
sappi

sappi > 2 0 0 1 p a g e 1 0 1
for the year ended September 2001
32. Financial instruments (continued)
The fair value of interest rate options, caps, swaps and forward rate agreements is the estimated amount that Sappi would
pay or receive to terminate the agreement at the balance sheet date, taking into account current interest rates and the
current creditworthiness of the counterparties.
3. Fair values
All financial instruments are carried at fair value, except the non-current interest-bearing borrowings at fixed rates of interest.
Where these fixed rates of interest have been hedged into variable rates of interest, and where hedge accounting has been
applied, then these non-current interest-bearing borrowings are carried at fair value. At September 2001 the carrying amount
of the total non-current interest-bearing borrowings was US$1,014 million (September 2000: US$1,278 million) and their fair
value was US$1,025 million (September 2000: US$1,289 million). The fair value of these borrowings was estimated based
on quotations from its investment bankers. No financial assets were carried at an amount in excess of fair value.
The carrying amounts for cash, cash equivalents, accounts receivable, certain investments, accounts payable and current
portion of interest-bearing borrowings approximate fair value due to the short-term nature of these instruments.
4. Foreign currency forward exchange contracts
The Group’s foreign currency forward exchange contracts at September 2001 are detailed below.
2001 2000
Contract Fair Contract Fair
US$ million amount value amount value
US Dollar denominated – net sold (109) (7) (111) (6)
EUR denominated – net purchased 56 1 27 –
(53) (6) (84) (6)
The fair value of foreign currency contracts was estimated by the Group based upon quotations from Reuters. These foreign
currency contracts will mature in the year ended September 2002.
All forward currency exchange contracts and options are valued at fair value with the resultant profit or loss included in the
finance costs for the period.

sappi > 2 0 0 1 p a g e 1 0 2
for the year ended September 2001
32. Financial instruments (continued)
5. Asset backed securitisation
The Group has various asset backed securitisation facilities. The assets concerned have been derecognised from the
balance sheet.
The securitised accounts receivable have been derecognised on the basis that the Group no longer controls these assets.
A liability has been recognised for the fair value of the Group’s obligation to service securitised accounts receivable.
Details of these securitisation facilities at September 2001 are set out below.
Bank Currency Value Facility Discount charges
ABN-Amro US$ US$129 million US$207 million linked to 1 month US$ LIBOR
Creditanstalt EUR EUR140 million EUR140 million linked to 3 months EURIBOR
State Street Bank EUR EUR77 million EUR100 million linked to 1 month EURIBOR
State Street Bank US$ US$91 million US$100 million linked to 1 month EURIBOR
33. Segment information
The Group has two reportable segments which operate as separate business units: Sappi Fine Paper and Sappi Forest
Products. The regional information shows North America, Europe, Southern Africa and the Far East.
The accounting policies of the segments are the same as those described in the summary of significant accounting policies
(refer note 2). The Group accounts for intragroup sales and transfers as if the sales or transfers were to third parties, that
is, at current market prices. All such sales and transfers are eliminated on consolidation.
Sappi Sappi Corporate
Fine Paper Forest Products and other Group
US$ million 2001 2000 2001 2000 2001 2000 2001 2000
External sales 3,452 3,828 732 890 – – 4,184 4,718
Intragroup sales 321 295 466 549 – – 787 844
Total sales 3,773 4,123 1,198 1,439 – – 4,971 5,562
Operating profit 248 451 194 224 4 (3) 446 672
Depreciation 259 272 40 48 1 – 300 320
Amortisation and fellings 5 5 46 55 – – 51 60
Asset impairment 6 8 – – – – 6 8
Other non-cash expenses * 192 30 4 (16) – – 196 14
Capital expenditures ** 250 183 43 35 – 3 293 221
Operating assets *** 3,060 3,283 956 1,115 41 39 4,057 4,437
Operating liabilities **** 577 601 128 156 48 49 753 806
Net operating assets ***** 2,444 2,653 825 941 (13) (20) 3,256 3,574
notes to the annual financial statements ( c o n t i n u e d )
sappi

sappi > 2 0 0 1 p a g e 1 0 3
for the year ended September 2001
US$ million
33. Segment information (continued)
North America Europe Southern Africa Far East Corporate and other Group
US$ million 2001 2000 2001 2000 2001 2000 2001 2000 2001 2000 2001 2000
Sales (by customer
domicile) 1,514 1,699 1,707 1,930 554 658 369 402 40 29 4,184 4,718
Sales (by company
domicile) 1,442 1,607 1,781 1,994 961 1,117 – – – – 4,184 4,718
Operating profit 40 179 177 252 225 244 – – 4 (3) 446 672
Capital expenditures ** 99 96 116 78 78 44 – – – 3 293 221
Net operating
assets ***** 1,011 1,205 1,333 1,336 925 1,053 – – (13) (20) 3,256 3,574
* Including Mobile mill closure costs.
** Capital expenditures exclude spending on plantations.
*** Operating assets consist of property, plant and equipment, non-current assets (excluding deferred taxation) and current assets (excluding cash).
**** Operating liabilities consist of trade payables, other payables and provisions.
***** Net operating assets consist of operating assets less operating liabilities, adjusted for taxation payable and dividends payable.
34. Related party transactions
For most of the financial year there were no related party transactions.
The Buhrmann NV Group who were previously a related party to Sappi, sold its stake in Sappi Limited during the first four
months of the Company’s current financial year. (At September 2000 Buhrmann NV held 5.5% of the issued share capital of
the Company. During 2000 the Sappi Group sold 634,946 tons (US$509 million) of products to the Buhrmann Group.)
35. Subsequent events
Transcript mill
In October 2001, Sappi announced its intention to exit the non-core carbonless paper market and that the Transcript
carbonless paper mill in Scotland is to close. The closure costs are estimated to amount to US$10 million after tax.
Insurance cover
The unprecedented events on 11 September 2001 in the United States of America have resulted in major losses in the
insurance and reinsurance industry. In general, insurers have withdrawn cover for losses from acts of terrorism and the
process of negotiating renewed insurance cover with effect from 1 November 2001 has led to unsatisfactory results.
Contrary to previous years, Sappi is no longer able to cover property damage and losses from business interruption and
machinery breakdown to full value. Maximum foreseeable losses are covered in all regions and therefore protection is
adequate. Management still hopes to improve on this situation as negotiations continue, also with a view to additional
insurance capacities that might become available on 1 January 2002.
In parallel, Sappi is working on improved enterprise risk management to lower the risk of incurring losses from uncontrolled
incidents.

sappi > 2 0 0 1 p a g e 1 0 4
for the year ended September 2001
35. Subsequent events (continued)
Convertible notes
On 29 November 2001 Sappi BVI Finance Limited resolved to exercise its right to redeem, on 10 January 2002, all of its
7.5% convertible guaranteed notes for the principal amount of the notes together with accrued interest. At September 2001
the principal amount was US$243 million. Sappi will use its existing cash and non-current borrowing facilities to finance
this repayment.
36. Environmental matters
Sappi operates in an industry subject to extensive environmental regulations. Typically, Sappi does not separately account
for environmental operating expenses but does not anticipate any material expenditures related to such matters. Sappi does
separately account for environmental capital expenditures. Sappi spent approximately US$48 million in financial year
September 2001 (September 2000: US$35 million) on capital projects that control air or water emissions or otherwise create
an environmental benefit. Amounts to be spent in future years will depend on changes to existing environmental
requirements and the availability of new technologies to meet such requirements. In South Africa, requirements under the
recently enacted National Water Act, National Environmental Management Act, National Forests Act and the Air Pollution
Prevention Act may result in significant additional expenditures and/or operational constraints, although the economic and
practical effect of the implementation of these requirements on Sappi’s operations is currently uncertain. Subject to these
uncertainties, Sappi’s preliminary estimate is that total environmental capital expenditures for financial year September 2002
will be approximately US$29 million, including costs to comply with EPA “cluster rules” discussed below.
In April 1998, the US Environmental Protection Agency issued final cluster rules that impose new air and water quality
standards aimed at further reductions of pollutants from paper and pulp mills in the United States, in particular those emitting
dioxin in wastewater resulting from bleaching operations. For Sappi Fine Paper North America’s operations, compliance with
the cluster rules was required beginning in April 2001. In June 1999, Sappi closed its pulp mill at Westbrook due largely to
the expected cost of compliance (approximately US$50 million) with the new cluster rules. Sappi has spent approximately
US$71 million in capital improvements for cluster rule compliance for required upgrades at the Somerset and Muskegon
mills. These upgrades included the installation of elemental chlorine free (ECF) technology. The Company believes that
future capital expenditures for environmental compliance, the bulk of which will be for cluster rules compliance at Muskegon,
will aggregate approximately US$5 million to US$15 million through financial year September 2002.
In April 2000, 18 individuals filed a lawsuit against S. D. Warren, Kimberley-Clark Corporation and several other defendants
in Somerset County Court, Maine. The plaintiffs allege that they suffered personal injury as a result of hazardous waste from
various sources, which was allegedly transported to and stored at a local landfill during the period from 1976 through 1986.
Under Sappi’s purchase of S. D. Warren from Scott Paper Company in 1994, S. D. Warren is indemnified for monitoring,
clean-up and any other costs relating to or arising out of the affected landfill. While S. D. Warren does not believe that the
lawsuit will have a material adverse effect on its operating results or financial position, one of the reasons being the
possibility that S. D. Warren is indemnified for this matter, there can be no assurance that this will be the case.
notes to the annual financial statements ( c o n t i n u e d )
sappi
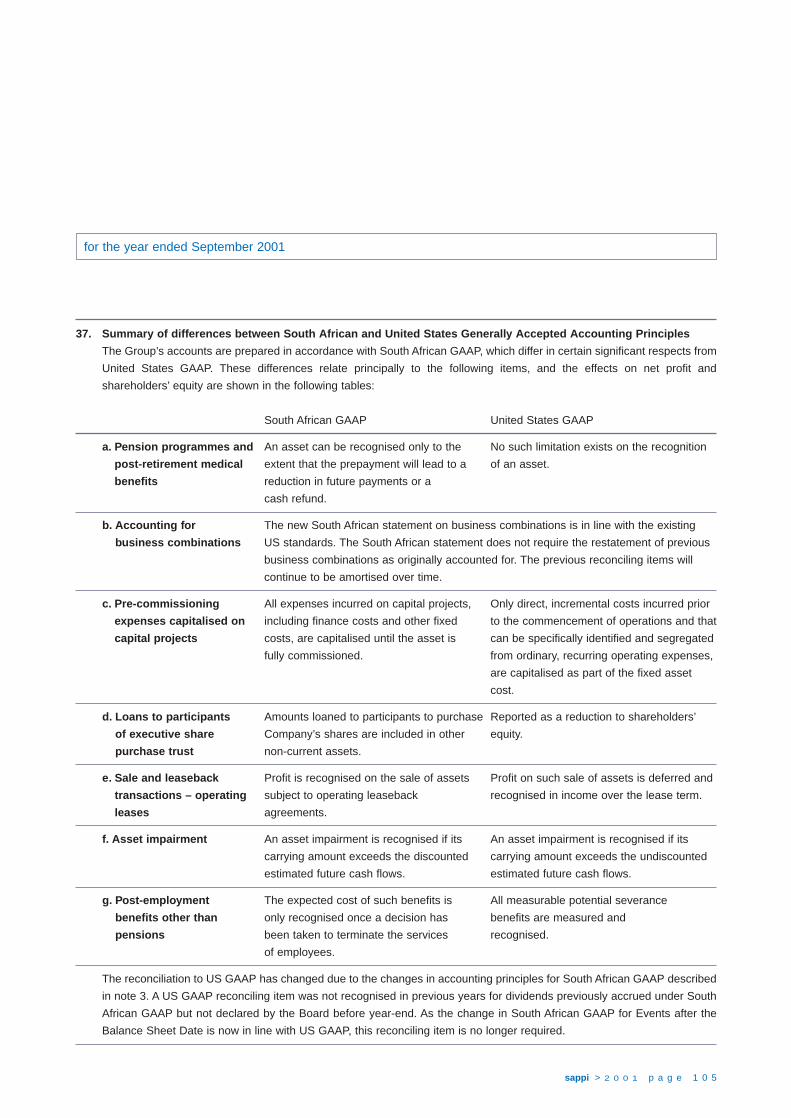
sappi > 2 0 0 1 p a g e 1 0 5
for the year ended September 2001
37. Summary of differences between South African and United States Generally Accepted Accounting Principles
The Group’s accounts are prepared in accordance with South African GAAP, which differ in certain significant respects from
United States GAAP. These differences relate principally to the following items, and the effects on net profit and
shareholders’ equity are shown in the following tables:
South African GAAP United States GAAP
a. Pension programmes and An asset can be recognised only to the No such limitation exists on the recognition
post-retirement medical extent that the prepayment will lead to a of an asset.
benefits reduction in future payments or a
cash refund.
b. Accounting for The new South African statement on business combinations is in line with the existing
business combinations US standards. The South African statement does not require the restatement of previous
business combinations as originally accounted for. The previous reconciling items will
continue to be amortised over time.
c. Pre-commissioning All expenses incurred on capital projects, Only direct, incremental costs incurred prior
expenses capitalised on including finance costs and other fixed to the commencement of operations and that
capital projects costs, are capitalised until the asset is can be specifically identified and segregated
fully commissioned. from ordinary, recurring operating expenses,
are capitalised as part of the fixed asset
cost.
d. Loans to participants Amounts loaned to participants to purchase Reported as a reduction to shareholders’
of executive share Company’s shares are included in other equity.
purchase trust non-current assets.
e. Sale and leaseback Profit is recognised on the sale of assets Profit on such sale of assets is deferred and
transactions – operating subject to operating leaseback recognised in income over the lease term.
leases agreements.
f. Asset impairment An asset impairment is recognised if its An asset impairment is recognised if its
carrying amount exceeds the discounted carrying amount exceeds the undiscounted
estimated future cash flows. estimated future cash flows.
g. Post-employment The expected cost of such benefits is All measurable potential severance
benefits other than only recognised once a decision has benefits are measured and
pensions been taken to terminate the services recognised.
of employees.
The reconciliation to US GAAP has changed due to the changes in accounting principles for South African GAAP described
in note 3. A US GAAP reconciling item was not recognised in previous years for dividends previously accrued under South
African GAAP but not declared by the Board before year-end. As the change in South African GAAP for Events after the
Balance Sheet Date is now in line with US GAAP, this reconciling item is no longer required.

sappi > 2 0 0 1 p a g e 1 0 6
for the year ended September 2001
US$ million note 2001 2000
37. Summary of differences between South African
and United States Generally Accepted
Accounting Principles (continued)
Reconciliation of net profit to United States GAAP
Net profit determined under South African GAAP 138 363
Adjustments in respect of:
Pension programmes and post-retirement medical benefits a (1) 2
Accounting for business combinations b 20 3
Pre-commissioning expenses capitalised on capital projects c 3 3
Sale and leaseback transactions e 3 4
Asset impairment f – 8
Post-employment benefits other than pensions g 1 (3)
Deferred taxation effect of adjustments (11) (6)
Total effect of United States GAAP adjustments 15 11
Net profit determined under United States GAAP 153 374
– Basic earnings per share (US cents) 66 158
– Diluted earnings per share (US cents) 65 156
Reconciliation of shareholders’ equity to United States GAAP
Shareholders’ equity determined under South African GAAP
as restated 1,503 1,618
Adjustments in respect of:
Pension programmes and post-retirement medical benefits a 69 82
Accounting for business combinations b 68 42
Pre-commissioning expenses capitalised on capital projects c (20) (24)
Loans to executive share purchase trust d (6) (12)
Sale and leaseback transactions e (29) (37)
Asset impairment f 13 12
Post-employment benefits other than pensions g (7) –
Deferred taxation effect of adjustments 3 15
Effect of United States GAAP adjustments on minority interests (3) (3)
Total effect of United States GAAP adjustments 88 75
Shareholders’ equity determined under United States GAAP
(September 2000 as restated) 1,591 1,693
notes to the annual financial statements ( c o n t i n u e d )
sappi

sappi > 2 0 0 1 p a g e 1 0 7
for the year ended September 2001
ZAR million note 2001 2000
Operating loss 1 (13) (10)Income from subsidiaries – dividends 500 2,653 Interest received 19 21
Profit before tax 506 2,664 Taxation 43 82
Net profit 463 2,582
company income statement
at September 2001
ZAR million note 2001 2000
AssetsNon-current assets 10,185 10,135
Property, plant and equipment 5 7 Investments in subsidiaries (Annexure A) 10,121 10,039 Other non-current assets 59 89
Loan to Executive Share Purchase Trust 58 88 Unlisted and other investments and loans at cost and Directors’ valuation 1 1
Current assets 5 11
Receivables 5 11
Total assets 10,190 10,146
Equity and liabilitiesShareholders’ equity 10,051 10,035
Ordinary share capital 239 239 Share premium 6,427 6,427 Non-distributable reserves 3 7 7 Distributable reserves 3,378 3,362
Current liabilities 139 111
Trade and other payables 31 35 Taxation payable 108 76
Total equity and liabilities 10,190 10,146
company balance sheet

sappi > 2 0 0 1 p a g e 1 0 8
for the year ended September 2001
ZAR million 2001 2000
Profit before tax 506 2,664Adjustments for non-cash items:
Dividends received – (2,470)Subsidiary transactions (78) (557)Other (2) (32)
Cash generated by (utilised in) operations 426 (395)Decrease (increase) in working capital 2 (13)Taxation paid (11) (3)Dividends paid (447) (275)
Cash utilised in operating activities (30) (686)Decrease (increase) in non-current assets 30 (16)Proceeds of issuance of ordinary shares – 701
Net movement in cash and cash equivalents – (1)Cash and cash equivalents at beginning of year – 1
Cash and cash equivalents at end of year – –
company cash flow statement
sappi
for the year ended September 2001
company statement of changes in shareholders’ equity
Ordinary share Non-
Number of Ordinary capital distribu- Distribu-ordinary share Share and table table
ZAR million shares capital premium premium reserves reserves Total
Balance – September 1999 as reported 224.6 225 5,740 5,965 7 780 6,752Changes in accounting policies – – – – – 275 275
Balance – September 1999 restated 224.6 225 5,740 5,965 7 1,055 7,027Net profit – – – – – 2,582 2,582Dividends * – – – – – (275) (275)Issuance of ordinary shares 14.5 14 687 701 – – 701
Balance – September 2000 239.1 239 6,427 6,666 7 3,362 10,035Net profit – – – – – 463 463Dividends * – – – – – (447) (447)
Balance – September 2001 239.1 239 6,427 6,666 7 3,378 10,051
* This is the dividend that relates to the previous financial year’s earnings that was declared subsequent to year end. In terms of our newly adoptedaccounting policy (AC 107 revised – Events after balance sheet date), dividends declared after the balance sheet date are accounted for in theyear in which they are declared and not in the year in which the profits are earned.

sappi > 2 0 0 1 p a g e 1 0 9
for the year ended September 2001
ZAR million 2001 2000
1. Operating profitThe operating profit is arrived at after taking into account the items detailed below:Foreign exchange gains 4 21 Depreciation 2 1 Technical and administrative services paid other thanto bona fide employees of the Company 32 32 Auditors’ remuneration 3 4
– fees for audit 2 2 – fees for other services 1 2
2. Directors’ emolumentsNon-executive DirectorsServices as Directors 2 1
Executive DirectorsServices as Directors of operating divisions 19 15 Performance-related payments 11 6
Total Directors’ emoluments 32 22 Less: paid by subsidiaries 30 21
2 1
Share options exercised during the financial yearAverage Gains on
market value exercise ofat date of share options
Number of shares Option price exercise ZAR million
85,000 R19.90 R63.64 3.7 16,000 R39.00 R75.17 0.6 40,000 R22.10 R60.00 1.5 16,000 R21.30 R69.10 0.8
Details of Directors’ service contractsThe Executive Directors have service contracts with notice periods of 24 months or less. These notice periods are in linewith international norms for Executive Directors.
The Non-executive Directors do not have service contracts with the Company.
None of the Directors have provisions for pre-determined compensation on termination of their contracts exceeding eighteenmonths’ salary and benefits in kind.
Directors proposed for election or re-electionNo Non-executive Director that is proposed for election or re-election at the forthcoming annual general meeting has anyunexpired service contract.
Messrs W H Sheffield and D G Wilson, both Executive Directors, are proposed for re-election at the forthcoming annualgeneral meeting. At September 2001 the unexpired terms of Mr Sheffield’s and Mr Wilson’s service contracts were eacheighteen months.
3. Non-distributable reserves 2001 2000
Reduction in capital 6 6 Capital redemption reserve fund 1 1
7 7
notes to the company financial statements

sappi > 2 0 0 1 p a g e 1 1 0
at September 2001
Share Effective Book value Loan to (by) capital holding of investment subsidiary
2001 2000 2001 2000 2001 2000 Annexure A ZAR ZAR ZAR ZARInvestments in subsidiaries % % million million million million
Set out below are the more significant
subsidiaries or those that have a loan
with Sappi Limited:
Southern Africa
Sappi Manufacturing (Pty) Ltd O ZAR12,026,250 100 100 1,851 1,481 2,446 3,355
Usutu Pulp Company Ltd O SZL10,000,000 100 97 – – – –
Pulp Holdings (Pty) Ltd H ZAR2,000 100 100 8 8 (8) (8)
Sappi Management
Services (Pty) Ltd M ZAR100 100 100 – – 184 211
Sappi Share Facilitation
Co. (Pty) Ltd H ZAR1,000 100 – – – 615 –
America
SDW Holdings Corporation H US$1,000 100 100 – – (33) (22)
Europe
European Paper Holdings SA H EUR81,432,000 100 100 104 104 – –
Sappi Alfeld AG O EUR31,200,000 100 100 – – – –
Sappi Belgium BV O EUR51,377,619 100 100 – – – –
Sappi Ehingen AG O EUR20,800,000 95 94 – – – –
Sappi Europe SA O EUR15,130,751 100 100 – – (13) –
Sappi Fine Paper plc M GBP50,000 100 100 1 1 – (1)
Sappi Gratkorn GmbH O EUR36,336 100 100 – – – –
Sappi Holding AG H EUR72,673 100 100 539 539 7 4
Sappi International SA F EUR1,196,266,102 100 100 4,674 4,674 1 1
Sappi Maastricht BV O EUR31,992 100 100 – – – –
Sappi Nijmegen BV O EUR59,037 100 100 – – – –
Sappi Papier Holding AG O EUR72,673 100 100 – – – –
Sappi Lanaken Presspaper NV O EUR39,162,921 99 99 – – – –
Sappi U.K. Ltd O GBP74,020,000 100 100 – – 95 57
investments
sappi

sappi > 2 0 0 1 p a g e 1 1 1
at September 2001
Share Effective Book value Loan to (by) capital holding of investment subsidiary
2001 2000 2001 2000 2001 2000 Annexure A ZAR ZAR ZAR ZARInvestments in subsidiaries (continued) % % million million million million
Far East
Speciality Pulp Trading Co. Ltd H HKD10,000 100 100 – – 6 –
Other
Brocas Ltd H US$3,385,401 100 100 9 9 (41) (60)
Lignin Insurance Co. Ltd F GBP400,000 100 100 – – – –
Various other companies – – (17) (7)
7,186 6,816 3,242 3,530
Writedown of investment in subsidiaries (307) (307) – –
6,879 6,509 3,242 3,530
Holding companies H
Operating companies O
Finance companies F
Management companies M
2001 2000
ZAR ZAR
million million
Market value of listed subsidiaries
Sappi Ehingen AG 724 498
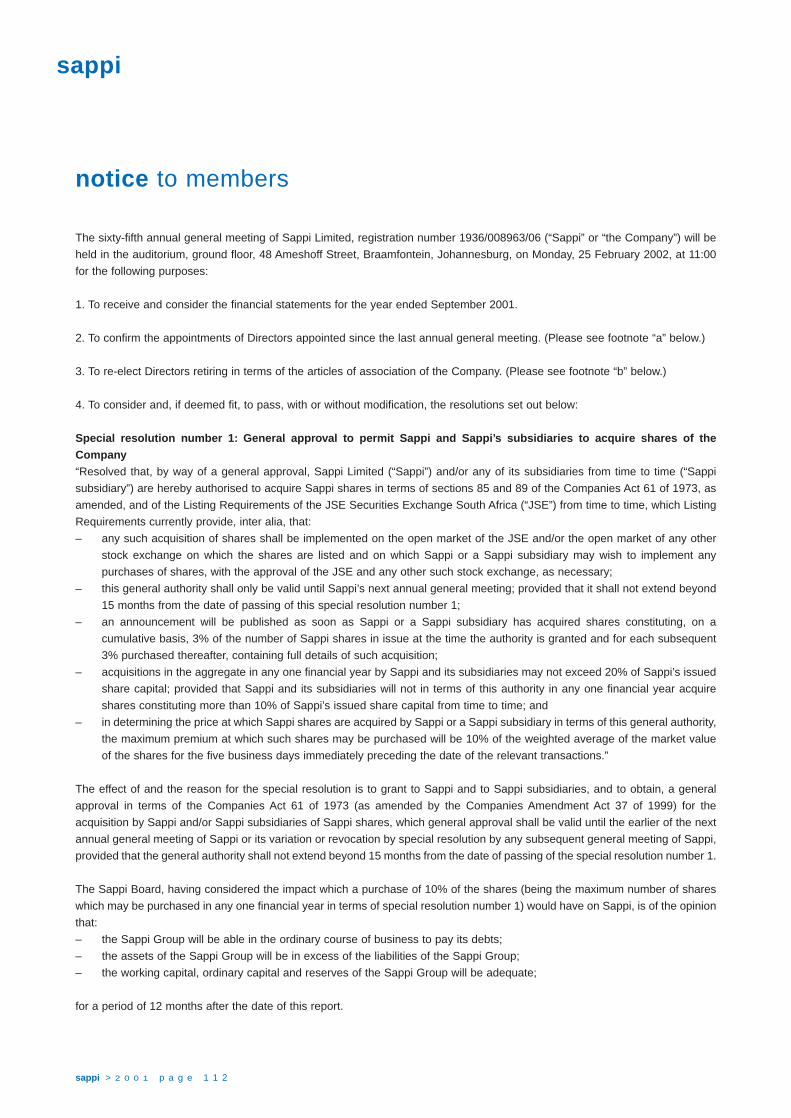
The sixty-fifth annual general meeting of Sappi Limited, registration number 1936/008963/06 (“Sappi” or “the Company”) will be
held in the auditorium, ground floor, 48 Ameshoff Street, Braamfontein, Johannesburg, on Monday, 25 February 2002, at 11:00
for the following purposes:
1. To receive and consider the financial statements for the year ended September 2001.
2. To confirm the appointments of Directors appointed since the last annual general meeting. (Please see footnote “a” below.)
3. To re-elect Directors retiring in terms of the articles of association of the Company. (Please see footnote “b” below.)
4. To consider and, if deemed fit, to pass, with or without modification, the resolutions set out below:
Special resolution number 1: General approval to permit Sappi and Sappi’s subsidiaries to acquire shares of theCompany“Resolved that, by way of a general approval, Sappi Limited (“Sappi”) and/or any of its subsidiaries from time to time (“Sappi
subsidiary”) are hereby authorised to acquire Sappi shares in terms of sections 85 and 89 of the Companies Act 61 of 1973, as
amended, and of the Listing Requirements of the JSE Securities Exchange South Africa (“JSE”) from time to time, which Listing
Requirements currently provide, inter alia, that:
– any such acquisition of shares shall be implemented on the open market of the JSE and/or the open market of any other
stock exchange on which the shares are listed and on which Sappi or a Sappi subsidiary may wish to implement any
purchases of shares, with the approval of the JSE and any other such stock exchange, as necessary;
– this general authority shall only be valid until Sappi’s next annual general meeting; provided that it shall not extend beyond
15 months from the date of passing of this special resolution number 1;
– an announcement will be published as soon as Sappi or a Sappi subsidiary has acquired shares constituting, on a
cumulative basis, 3% of the number of Sappi shares in issue at the time the authority is granted and for each subsequent
3% purchased thereafter, containing full details of such acquisition;
– acquisitions in the aggregate in any one financial year by Sappi and its subsidiaries may not exceed 20% of Sappi’s issued
share capital; provided that Sappi and its subsidiaries will not in terms of this authority in any one financial year acquire
shares constituting more than 10% of Sappi’s issued share capital from time to time; and
– in determining the price at which Sappi shares are acquired by Sappi or a Sappi subsidiary in terms of this general authority,
the maximum premium at which such shares may be purchased will be 10% of the weighted average of the market value
of the shares for the five business days immediately preceding the date of the relevant transactions.”
The effect of and the reason for the special resolution is to grant to Sappi and to Sappi subsidiaries, and to obtain, a general
approval in terms of the Companies Act 61 of 1973 (as amended by the Companies Amendment Act 37 of 1999) for the
acquisition by Sappi and/or Sappi subsidiaries of Sappi shares, which general approval shall be valid until the earlier of the next
annual general meeting of Sappi or its variation or revocation by special resolution by any subsequent general meeting of Sappi,
provided that the general authority shall not extend beyond 15 months from the date of passing of the special resolution number 1.
The Sappi Board, having considered the impact which a purchase of 10% of the shares (being the maximum number of shares
which may be purchased in any one financial year in terms of special resolution number 1) would have on Sappi, is of the opinion
that:
– the Sappi Group will be able in the ordinary course of business to pay its debts;
– the assets of the Sappi Group will be in excess of the liabilities of the Sappi Group;
– the working capital, ordinary capital and reserves of the Sappi Group will be adequate;
for a period of 12 months after the date of this report.
sappi > 2 0 0 1 p a g e 1 1 2
notice to members
sappi
sappi > 2 0 0 1 p a g e 1 1 3
Special resolution number 2: Amendments to articles of association
“Resolved that the articles of association of Sappi be amended as follows:
1. by the insertion of a new article 17.4 after the existing article 17.3:
“17.4 Subject to the provisions of the Act, a proxy instrument need not bear a handwritten signature of the member
appointing the proxy and may, provided it is in a form which is approved or accepted by the Directors, be an
instrument created by electronic or other means, including, without limitation, electronic mail or telefacsimile”;
2. by the replacement of article 33 with the following:
“33. NOTICES
33.1 Subject to the provisions of the articles and the requirements of the JSE, any notice which is required to be given
to members, beneficial holders or Directors shall be in writing and may be given to:
33.1.1 any member, beneficial holder or Director who has notified an electronic mail address or telefacsimile number to
the Company for this purpose, by sending –
33.1.1.1 such notice; or
33.1.1.2 if the notice is available on a website for at least the period commencing on the day after the date on which such
notice was sent and expiring on the later of the twenty-first day succeeding that day or the day of the meeting, if
any, to which the notice relates, a message advising that a notice is available on such website and containing the
web address of such website;
by electronic mail or telefacsimile, as the case may be, to such address or telefacsimile number, as the case may be;
33.1.2 any member, beneficial holder or Director by delivery in person; or
33.1.3 any member, beneficial holder or Director by delivering it or sending it through the post, properly addressed, to –
33.1.3.1 a member at his address shown in the register of members;
33.1.3.2 a beneficial holder, at the address which has been disclosed to the Company in respect of that beneficial holder
and which has been recorded in the Company’s register of such disclosures;
33.1.3.3 a Director at his postal address shown in the Directors’ register;
and any such notice to members shall simultaneously be given to the secretary or other suitable official of any
recognised stock exchange on which the shares of the Company are listed for the time being, in accordance with
the requirements of that stock exchange. Any such notice to members shall also be advertised in accordance with
the requirements of any such stock exchange.
33.2 Every such notice given in terms of 33.1 shall be deemed to have been received –
33.2.1 if delivered, on the date on which it is so delivered;

sappi > 2 0 0 1 p a g e 1 1 4
33.2.2 if it is sent by post, on the day on which it was posted;
33.2.3 if it, or a message referred to in 33.1.1, is sent by electronic mail, on the day on which it was so sent;
33.2.4 if it, or a message referred to in 33.1.2, is sent by telefacsimile, on the day on which it was successfully transmitted;
notwithstanding that such notice may not actually have been received.
The reason for the passing of special resolution number 2 is to amend the articles of association of Sappi to enable
Sappi to –
• permit proxy instruments created by electronic means;
• give notices in electronic format; and
• prescribe the manner in which the aforegoing must be effected.
The effect of the passing of special resolution number 2 is that the articles of association of Sappi will be amended
as set out above.
Ordinary resolution number 1: Control of unissued shares“Resolved that all the authorised but unissued ordinary shares in the capital of Sappi be placed under the control of the Directors of
Sappi with authority to issue and allot all or part thereof in their discretion, subject to the provisions of sections 221 and 222 of the
Companies Act 61 of 1973 and subject to the rules and requirements of the JSE Securities Exchange South Africa.”
Ordinary resolution number 2: General authority to issue shares for cash“Resolved that, subject to a 75% majority of the votes cast by shareholders, present in person or by proxy and entitled to vote at
the annual general meeting held to consider, inter alia, this resolution, and subject to the passing of ordinary resolution number
1 to be proposed at the annual general meeting at which this ordinary resolution is considered, the directors of Sappi be and are
hereby authorised, by way of a general authority, to issue all or any of the authorised but unissued ordinary shares in the capital
of Sappi for cash as they in their discretion deem fit, subject to the Listings Requirements of the JSE Securities Exchange South
Africa (“JSE”) from time to time, which Listings Requirements currently provide, inter alia, that:
– this authority will not extend beyond the earlier of the date of the annual general meeting of Sappi in respect of its financial
year ending 30 September 2002 or the date of the expiry of 15 months from the date of the annual general meeting at which
this ordinary resolution is proposed:
– issues in terms of this authority in any one financial year will not exceed 15% in the aggregate of the number of shares in
Sappi’s issued share capital;
– a press announcement giving full details, including the impact on net asset value and on earnings per share, will be
published at the time of any issue representing, on a cumulative basis within any one financial year, 5% or more of the
number of shares in issue prior to such issue;
– in determining the price at which shares will be issued in terms of this authority, the maximum discount permitted will be
10% of the weighted average traded price of such shares, as determined over the 30 business day period prior to the date
that the price of the issue is determined or agreed by the Directors of Sappi, if such shares have not been traded in the said
30 business day period, a ruling will be obtained from the Committee of the JSE; and
– any such issue will only be made to public shareholders as defined in the Listings Requirements of the JSE.”
Ordinary resolution number 3: Signature of documents, etc“Resolved that any Director of Sappi be and is hereby authorised to sign all such documents and do all such things as may be
necessary for or incidental to the implementation of the resolutions to be proposed at the annual general meeting convened to
consider this resolution.”
notice to members ( c o n t i n u e d )
sappi

sappi > 2 0 0 1 p a g e 1 1 5
A shareholder entitled to attend and vote is entitled to appoint one or more proxies to attend, speak and, on a poll, to vote in
his/her stead. A proxy need not be a shareholder.
Sappi Management Services (Pty) Limited
Secretaries: per D J O’Connor48 Ameshoff Street
Braamfontein, Johannesburg, 2001
14 December 2001
Footnotes
(a) Confirmation of appointments of Directors appointed since the last annual general meeting
1. William Herbert Sheffield (53), BSc (Chemistry), MBA, Chief Executive of Sappi Fine Paper. Prior to joining Sappi on 1 May
2001, Mr Sheffield spent 13 years in the newsprint business with Abitibi Consolidated, most recently managing Abitibi’s
international business. He was a founding Board member of Pan Asia Paper, the Asian newsprint joint venture based
in Singapore. Previous positions include Logistics, Marketing, Operating, and a 17 year career in the North American
steel sector.
Mr Sheffield is a Canadian citizen, currently residing in London.
(b) Directors retiring by rotation and who are seeking re-election
1. David Charles Brink (62), MSc Eng (Mining), DCom (hc). Mr Brink is currently the Executive Chairman of Murray and
Roberts Holdings Limited, Deputy Chairman of ABSA Group Limited and of ABSA Bank Limited, Chairman of Unitrans
Limited, a Director of BHP Billiton PLC, of BHP Billiton Limited and of Sanlam Limited. Mr Brink was appointed a Non-
executive Director of Sappi Limited on 8 March 1994, and is currently Chairman of the Human Resources Committee and
a member of the Nomination Committee of the Board of Directors of Sappi Limited.
2. Franklin Abraham Sonn (62). Originally a graduate of the University of the Western Cape and Unisa, Dr Sonn subsequently
received nine doctoral qualifications in law, education, humanities and philosophy from various institutions in Europe, North
America and South Africa. Dr Sonn was the South African Ambassador to the United States from 1995 to 1998. Prior to this
position, he was a Board member of seven major South African banks and businesses and he currently serves on the Board
of a number of South African companies. He was appointed to the Board of Sappi Limited on 1 July 1999.
3. Donald Gert Wilson (44), BCom CTA, Chartered Accountant (South Africa), Executive Director – Finance of Sappi Limited.
He joined Sappi in April 1999 and was appointed to the Board on 27 May 1999. He has held various executive financial
positions in the Barloworld Group, a South African based international industrial corporation, mainly within their Caterpillar
earthmoving division.

sappi > 2 0 0 1 p a g e 1 1 6
Sappi Limited
Sappi head office
Executive Chairman, Eugene van As (62)
Corporate Affairs and Communication Manager,
André Oberholzer (35)
Finance – Executive Director, Donald Wilson (44)
Group Financial Controller, Laurence Newman (45)
Group Internal Audit Manager, Wayne Reid (33)
Group Management Accountant, Urs Lanz (43)
Group Information Technologies and Services Director,
Deborah Farnaby (36)
Group Corporate Counsel, Mark Thompson (49)
Investor Relations Manager, Paul Leslie-Smith (38)
Strategic Development Director, Robert Hope (49)
Treasury Director, Kaj Burchardi (59)
Sappi Fine Paper
Chief Executive Officer, Bill Sheffield (53)
Chief Financial Officer, Mike Turner (48)
Marketing and Sales Director, Hank Mollenhauer (57)
Technology Director, Doeko Bosscher (56)
CEO Sappi Fine Paper Europe, Wolfgang Pfarl (56)
CEO Sappi Fine Paper North America, Monte Haymon (64)
Managing Director Sappi Fine Paper South Africa,
Albert Lubbe (53)
Sappi Fine Paper Europe
Chief Executive Officer, Wolfgang Pfarl (56)
Chief Financial Officer, Hubert Gebreiter (54)
Human Resources Director, to be appointed
Information Technology Director, Guido Lauwers (45)
Logistics Director, Jeroen Diderich (34)
Manufacturing, Research and Development Director,
Rudolf Thummer (53)
Marketing and Sales Director Graphics Papers,
Michael Spallart (39)
Purchasing Director Raw Materials, Victor Kamm (42)
Purchasing Director Technical Goods/Utilities,
Werner Reiter (47)
Speciality Paper Director, Theo Reijnen (54)
Sappi Fine Paper North America
President and Chief Executive Officer, Monte Haymon (64)
Administration – Executive Vice-president, Jennifer Miller (46)
Finance – Vice-president and Chief Financial Officer and
Treasurer, Mark Becker (42)
Human Resources – Vice-president, Jim Mullen (58)
Information and Technology – Vice-president,
Cliff Hubbard (54)
Coated Products – Vice-president and GM,
Robert Weeden (50)
Sales and Customer Services – Vice-president,
Lester Labov (54)
Speciality Products – Vice-president and GM,
Paula Cholmondeley (54)
Supply Chain Management – Vice-president,
David Mahaney (59)
Technology and Engineering – Vice-president,
Harley Wood (59)
Sappi Fine Paper South Africa
Managing Director, Albert Lubbe (53)
Finance Director, Glen Pearce (38)
Marketing Director, Wayne Rau (39)
Technical Director, Chris Davies (53)
Sappi Forest Products
Chairman of South African businesses, John Job (56)
Finance Director, Jan Labuschagne (41)
Human Resources Director, Brian Dick (51)
Strategic Projects Director, Andrea Rossi (47)
Technical Director, Bertus van der Merwe (48)
Sappi Forests Managing Director, André Wagenaar (56)
Sappi Kraft Managing Director, Andrew Carr (49)
Sappi Saiccor Managing Director, Alan Tubb (51)
Sappi Trading
Managing Director, Hugh Martin (54)
Finance Director, Henri Kirsten (48)
divisional and corporate management
sappi

sappi > 2 0 0 1 p a g e 1 1 7
Industry definitionsbleached pulp – pulp that has been bleached by means ofchemical additives to make it suitable for fine paper production
chemical pulp – a generic term for pulp made from wood fibrethat has been produced in a chemical process
coated fine paper – coated paper made from chemical pulp.Also referred to as coated free sheet
coated papers – papers that contain a layer of coating materialon one or both sides. The coating materials of pigments andbinders which act as a filler to improve the printing surface ofthe paper
corrugating medium – paperboard made from chemical andsemi-chemical pulp, or waste paper, that is to be converted toa corrugated board by passing it through corrugating cylinders.Corrugating medium between layers of linerboard form theboard from which corrugated boxes are produced
dissolving pulp – highly purified chemical pulp intendedprimarily for conversion into chemical derivatives of celluloseand used mainly in the manufacture of viscose fabrics
fibre – fibre is generally referred to as pulp in the paperindustry. Wood is treated chemically or mechanically toseparate the fibres during the pulping process
fine paper – paper usually produced from chemical pulp forprinting and writing purposes and consisting of coated anduncoated paper
kraft paper – packaging paper (bleached or unbleached) madefrom kraft pulp
kraft pulp – chemical wood pulp produced by digesting woodby means of the sulphate pulping process
linerboard – the grade of paperboard used for the exteriorfacings of corrugated board. Linerboard is combined withcorrugating medium by converters to produce corrugatedboard used in boxes
market pulp – pulp produced for sale on the open market, asopposed to that produced for own consumption in anintegrated mill
mechanical pulp – pulp produced by means of the mechanicalgrinding or refining of wood or wood chips
NBSK – Northern Bleached Softwood Kraft pulp. One of themain varieties of market pulp, mainly produced from sprucetrees in Scandinavia, Canada and north eastern USA. Theprice of NBSK is a benchmark widely used in the pulp andpaper industry for comparative purposes
newsprint – paper produced for the printing of newspapersmainly from mechanical pulp and/or recycled waste paper
packaging paper – paper used for packaging purposes
pulpwood – wood suitable for producing pulp – usually not ofsufficient standard for saw-milling
release paper – backing paper for self-adhesives and/or paperused to impart designs on or to polymers, e.g. artificial leather
sackkraft – kraft paper used to produce multiwall paper sacks
speciality paper – a generic term for a group of papersintended for commercial and industrial use such as flexiblepackaging, metallised base paper, coated bag paper, etc.
uncoated woodfree paper – printing and writing paper madefrom bleached chemical pulp used for general printing,photocopying and stationery, etc. Referred to as uncoated as itdoes not contain a layer of pigment to give it a coated surface
woodfree paper – paper made from chemical pulp
Financial definitionsdebt/total capitalisation – current and non-current interest-bearing borrowings, and bank overdraft (net of cash, cashequivalents and short-term deposits), divided by shareholders’equity plus minority interest, non-current liabilities, currentinterest-bearing borrowings and overdraft
EBITDA – earnings before interest, tax, depreciation,amortisation and fellings (before non-trading profit/loss)
fellings – the amount charged against the income statement,representing the standing cost of the plantations harvested
net asset value – shareholders’ equity plus net deferred tax
net assets – total assets less current liabilities
NOPAT – net operating profit after current tax
ROE – return on average equity. Net profit divided by averageshareholders’ equity
RONA – operating profit divided by average net assets
RONOA – operating profit divided by average net operatingassets, which are total assets (excluding deferred taxation andcash) less current liabilities (excluding interest-bearingborrowings and bank overdraft)
glossary
sappi > 2 0 0 1 p a g e 1 1 8
Annual general meeting 25 February 2002First and third quarter reports released January and July 2002Second quarter and half-year report released May 2002Financial year-end 30 September 2002Preliminary results for the fourth quarter and year released, dividends announced November 2002Annual report posted to shareholders December 2002
shareholders’ diary
Group SecretaryDenis O’Connor
SecretariesSappi Management Services (Pty) Limited48 Ameshoff Street2001 Braamfontein South AfricaPO Box 315602017 Braamfontein South Africa
Telephone +27 (0) 11 407-8111Telefax +27 (0) 11 403-1493E-mail [email protected] www.sappi.com
Transfer SecretariesSouth AfricaMercantile Registrars Limited8th Floor11 Diagonal Street2001 Johannesburg PO Box 10532000 Johannesburg
Telephone +27 (0) 11 370-5000Telefax +27 (0) 11 370-5271E-mail [email protected]
United KingdomCapita IRG plcBourne House34 Beckenham RoadBeckenhamKent, BR3 4TUDX 91750Beckenham West
Telephone +44 (0) 208 639-2000Telefax +44 (0) 208 658-3430E-mail [email protected]
United States ADR DepositaryThe Bank of New YorkADR Department101 Barclay StreetNew York, NY 10286
Telephone +1 212 815-5800Telefax +1 212 815-4023E-mail [email protected]
Corporate Affairs and CommunicationAndré Oberholzer – Manager
Telephone +27 (0) 11 407-8111Telefax +27 (0) 11 403-8236E-mail andré[email protected]
administrationSappi LimitedReg No 1936/008963/06JSE code: SAPISIN code: ZAE 000006284
Certain statements in this annual report that are neither reported financial results nor other historical information, are forward-looking statements, including, but not limited to statements that are predictions of or indicate future events, trends, plans orobjectives. Undue reliance should not be placed on such statements because, by their nature, they are subject to known andunknown risks and uncertainties and can be affected by other factors that could cause actual results and Company plans andobjectives to differ materially from those expressed or implied in the forward-looking statements (or from past results). Such risks,uncertainties and factors include, but are not limited to the highly cyclical nature of the pulp and paper industry (and the factorsthat contribute to such cyclicality, such as levels of demand, production capacity, production and pricing), adverse changes in themarkets for the Group’s products, consequences of substantial leverage, changing regulatory requirements, unanticipatedproduction disruptions, economic and political conditions in international markets, the impact of investments, acquisitions anddispositions (including related financing) and currency fluctuations. The Company undertakes no obligation to publicly update orrevise any of these forward-looking statements, whether to reflect new information or future events or circumstances or otherwise.
forward-looking statement
sappi

sappi > 2 0 0 1 p a g e 1 1 9
SAPPI LIMITED (Reg No 1936/008963/06)If you are unable to attend the sixty-fifth annual general meeting of the members convened for 11:00 on Monday, 25 February2002, you should complete and return this form of proxy as soon as possible, but in any event to be received by not later than11:00 South African time on Thursday, 21 February 2002.
I/We
of
being a shareholder(s) of Sappi Limited (“the Company”) holding ___________________ ordinary shares in the Company and
entitled to vote at the abovementioned annual general meeting, do hereby appoint
of
or failing him
of
or failing him
of
or failing him, the Chairman of the meeting as my/our proxy to attend and speak and, on a poll, to vote for me/us and on my/ourbehalf at the annual general meeting of the Company to be held at 11:00 on Monday, 25 February 2002.
Number of shares †
For Against Abstain
Confirmation of appointment of Directors appointed since the last annual general meeting * Mr W H Sheffield
Re-election of retiring Directors **Mr D C Brink
Dr F A Sonn
Mr D G Wilson
Special resolution number 1 – a general approval for the Company and its subsidiaries to acquire Sappi Limited shares.
Special resolution number 2 – to amend the articles of association to enable the Company to permit proxy instruments created by electronic means and to give notices in electronic format.
Ordinary resolution number 1 – placing all the unissued ordinary shares in the authorised share capital of the Company under the control of the Directors of the Company with the authority to allot and issue same in terms of the Companies Act and the Listings Requirements of the JSE Securities Exchange South Africa.
Ordinary resolution number 2 – a general authority for the directors to issue shares for cash in terms of the Listings Requirements of the JSE Securities Exchange South Africa.
Ordinary resolution number 3 – authority for Directors to sign all documents and do all such things necessary to implement the above resolutions.
† Insert X in the appropriate block if you wish to vote all your shares in the same manner. If not, insert the number of votes inthe appropriate block. If no indication is given, the proxy will vote as he/she thinks fit.
Signed at on 2002
Assisted by me (where applicable)
Each shareholder is entitled to appoint one or more proxies (who need not be shareholders of the Company) to attend, speakand, on a poll, vote in place of that shareholder at the annual general meeting.
* Refer footnote (a) on page 115.
** Refer footnote (b) on page 115.
Please see overleaf.
proxy formfor annual general meeting

sappi > 2 0 0 1 p a g e 1 2 0
Instructions on signing and lodging the annual general meeting proxy form:
1. A deletion of any printed matter and the completion of any blank spaces need not be signed or initialled. Any alteration must
be signed, not initialled.
2. The Chairman shall be entitled to decline to accept the authority of the signatory:
(a) under a power of attorney; or
(b) on behalf of a company,
if the power of attorney or authority has not been deposited at the office of the Company’s transfer secretaries, Mercantile
Registrars Limited, 8th Floor, 11 Diagonal Street, Johannesburg, 2001, Republic of South Africa, or Capita IRG plc, Bourne
House, 34 Beckenham Road, Beckenham, Kent BR3 4TU, United Kingdom, by not later than 11:00 South African time on
Thursday, 21 February 2002.
3. The signatory may insert the name(s) of any person(s) whom the signatory wishes to appoint as his/her proxy in the blank
spaces provided for that purpose.
4. When there are joint holders of shares and if more than one of such joint holders be present or represented, the person
whose name stands first in the register in respect of such shares or his/her proxy, as the case may be, shall alone be entitled
to vote in respect thereof.
5. The completion and lodging of this form of proxy will not preclude the signatory from attending the meeting and speaking
and voting in person thereat to the exclusion of any proxy appointed in terms hereof should such signatory wish to do so.
6. Forms of proxy may be deposited at the office of the Company’s transfer secretaries, Mercantile Registrars Limited, 8th Floor,
11 Diagonal Street, Johannesburg, 2001, Republic of South Africa, or Capita IRG plc, Bourne House, 34 Beckenham Road,
Beckenham, Kent BR3 4TU, United Kingdom, by not later than 11:00 South African time on Thursday, 21 February 2002.
7. If the signatory does not indicate in the appropriate place on the face hereof how he/she wishes to vote in respect of a
particular resolution, his/her proxy shall be entitled to vote as he/she deems fit in respect of that resolution.
8. The chairman of the annual general meeting may reject any proxy form which is completed other than in accordance with
these instructions, provided that he may accept such proxy forms where he is satisfied as to the manner in which a member
wishes to vote.
notes to the proxy
sappi

sappiThe word for fine paper
Ifc Financial highlights2 Sappi profile
12 Sappi at a glance14 Sappi worldwide16 Sappi executive committee18 Chairman’s statement24 Questions and answers 26 Sappi Board28 Sappi fine paper32 Sappi forest products36 Sappi’s people37 Environmental commitment39 Value added statement
40 Management discussionand analysis of results(incorporating FinancialDirector’s report)
48 Financial performance49 Performance against financial
objectives50 Five-year review52 Share statistics 54 Corporate governance56 Auditors’ report56 Directors’ approval56 Secretary’s certificate
57 Directors’ report60 Income statement61 Balance sheet62 Cash flow statement63 Statement of changes in
shareholders’ equity64 Income statement in rands65 Balance sheet in rands66 Notes to the annual financial
statements107 Company income statement107 Company balance sheet108 Company cash flow statement
108 Company statement ofchanges in shareholders’ equity
109 Notes to the company financialstatements
110 Investments112 Notice to members116 Divisional and corporate
management117 Glossary118 Shareholders’ diary118 Administration118 Forward-looking statement119 Proxy form
G R A P H I C O R 2 4 4 7 0
Printing technique – printed cmyk, special blue andspecial silver both outside and inside cover. Overall mattlamination outside, overall aqueous varnish inside, spotUV varnish outside and inside.
idea exchange
Sappi paper used in the annual report – Cover Strobe Silk – 325 gsmPages 1 – 16 Strobe Silk – 148 gsmPages 17 – 56 Magno Satin – 150 gsmPages 57 – 120 Diamond Premium Art Matt – 135 gsm
idea exchange
CONTENTS
sappi cover 24470 14/12/01 10:31 AM Page 2

annu
al r
epor
t
01
sappi
sappi @ www.sappi.com
sappi 2001 annual report
sappi
sappi cover 24470 14/12/01 10:31 AM Page 1