SAPP DSM and ENERGY EFFICIECNY ACTIVITIES...1 SOUTHERN AFRICAN POWER POOL SAPP DSM and ENERGY...
20
SOUTHERN AFRICAN POWER POOL 1 SAPP DSM and ENERGY EFFICIECNY ACTIVITIES Readlay Makaliki (ZESCO) SAPP DSMWG UNECE GEE21 Geneva, Switzerland 18 April 2013
Transcript of SAPP DSM and ENERGY EFFICIECNY ACTIVITIES...1 SOUTHERN AFRICAN POWER POOL SAPP DSM and ENERGY...

SOUTHERN AFRICAN POWER POOL 1
SAPP DSM and ENERGY EFFICIECNY
ACTIVITIES
Readlay Makaliki (ZESCO)
SAPP DSMWG
UNECE GEE21 Geneva, Switzerland
18 April 2013

SOUTHERN AFRICAN POWER POOL 2
KEY AGENDA ITEMS
Member Utilities
SAPP Objectives
Demand and Supply Status
Energy Mix
Projected Demand Vs. Current Capacity
Energy Efficiency Drivers
EE & DSM Activities
Challenges/Opportunities

SOUTHERN AFRICAN POWER POOL 3
MEMBER UTILITIES
ESKOM – South Africa
EDM,HCB - Mozambique
ZESCO, CEC, LHP - Zambia
SNEL – Congo DR
ENE – Angola
ESCOM – Malawi
TANESCO – Tanzania
NAMPOWER – Namibia
BPC – Botswana
ZESA – Zimbabwe
SEC – Swaziland
LEC – Lesotho

SOUTHERN AFRICAN POWER POOL 4
MEMBERSHIP
Located in country that was a Southern African Development
Community (SADC) member by Sept 1994
Operating Members
Are members who are signatories of all principal documents governing
SAPP and have their system interconnected internationally with at least
one member. They are responsible for meeting all policy procedures
guidelines established by SAPP
Non-Operating Members
These are members who are signatories to only one SAPP Principle
document Inter-Utility Memorandum of Understanding. They
participate in all activities except those related to operation of the power
pool.

SOUTHERN AFRICAN POWER POOL 5
SAPP OBJECTIVES
1. Provide a forum for the development of a world class,
robust, safe, efficient, reliable and stable
interconnected electrical system in the southern
African region.
2. Co-ordinate and enforce common regional standards of
Quality of Supply; measurement and monitoring of
systems performance.
3. Harmonise relationships between member utilities.
4. Facilitate the development of regional expertise
through training programmes and research.
5. Increase power accessibility in rural communities.
6. Implement strategies in support of sustainable
development priorities

SOUTHERN AFRICAN POWER POOL 6
DEMAND AND SUPPLY SITUATION
No. Country Utility
Installed
Capacity
[MW] As at
Jan 2013
Available
Capacity
[MW]
Jan 2013
Suppressed
Demand &
Forecast
Demand
Capacity
Shortfall
including
reserves,
MW
Calculated
Reserve
Margin, %
1 Angola ENE 1,793 1,480 1341
2 Botswana BPC 352 322 604
3 DRC SNEL 2,442 1,170 1398
4 Lesotho LEC 72 72 138
5 Malawi ESCOM 287 287 412
6 Mozambique EDM /HCB 2308 2,279 636
7 Namibia NamPower 393 360 635
8 South Africa Eskom 44,170 41,074 42416
9 Swaziland SEC 70 70 255
10 Tanzania TANESCO 1380 1,143 1444
11 Zambia ZESCO / CEC/LHPC 1,870 1,845 2287
12 Zimbabwe ZESA 2,045 1,600 2267
57,182 51,702 53,833 (7,709) -4.1%
53,722 48,792 50,636 (7,079) -3.8%
TOTAL SAPP
Total Interconnected SAPP

SOUTHERN AFRICAN POWER POOL 7
ENERGY MIX
80%
1%
1% 14%
4%
Coal
Oil
Gas
Hydro
Other
309 TWh - 2010

SOUTHERN AFRICAN POWER POOL 8
PROJECTED DEMAND Vs CURRENT CAPACITY

SOUTHERN AFRICAN POWER POOL 9
ENERGY EFFICIENCY DRIVERS
1. All excess capacity in the SADC/ SAPP Region has been
depleted and at peak hours it’s difficult to import power
from member utilities.
2. Electricity demand strongly correlated to economic
growth
3. The growth in electricity demand is mainly driven by the
following:
Growth in agriculture
Rural electrification projects (IAES)
New mining activities
New manufacturing and
Housing estate projects
4. Reduce the carbon footprint by investing in EE and REs

SOUTHERN AFRICAN POWER POOL 10
ENERGY EFFICIENCY ACTIVITIES
In mitigating power deficit SAPP embarked on EE
Projects and DSM
1. Energy Saver Lamp distribution (utility driven)
2. Solar Water Heater Project
3. Hot Water Load control (Ripple Control)
4. Commercial Lighting
5. Prepaid meter Installation
6. Investments in REs (Solar, Small hydros, Wind
Farms)

SOUTHERN AFRICAN POWER POOL 11
UTILITY CFL PROGRAM SAVINGS (2009 to 2012)
CFL Program saving up to 2,045 MW from 2009 to date
Surpassed target of 1,500 MW
-
200
400
600
800
1,000
1,200
1,400
1,600
1,800
2,000
-
20
40
60
80
100
120
140 O
the
r U
tiliti
es
CFL Utility MW Savings Other Utilities Eskom

SOUTHERN AFRICAN POWER POOL 12
Utility CFL Target Savings for 2013
No. Country UtilityCFL Target for
2013, MW
1 Angola ENE 150
2 Botswana BPC 40
3 DRC SNEL 65
4 Lesotho LEC 20
5 Malawi ESCOM 50
6 Mozambique EDM /HCB 3
7 Namibia NamPower 20
8 South Africa Eskom 400
9 Swaziland SEC 1
10 Tanzania TANESCO 24
11 Zambia ZESCO / CEC/LHPC 54
12 Zimbabwe ZESA 203
1,030 TOTAL SAPP
SOUTHERN AFRICAN POWER POOL 13
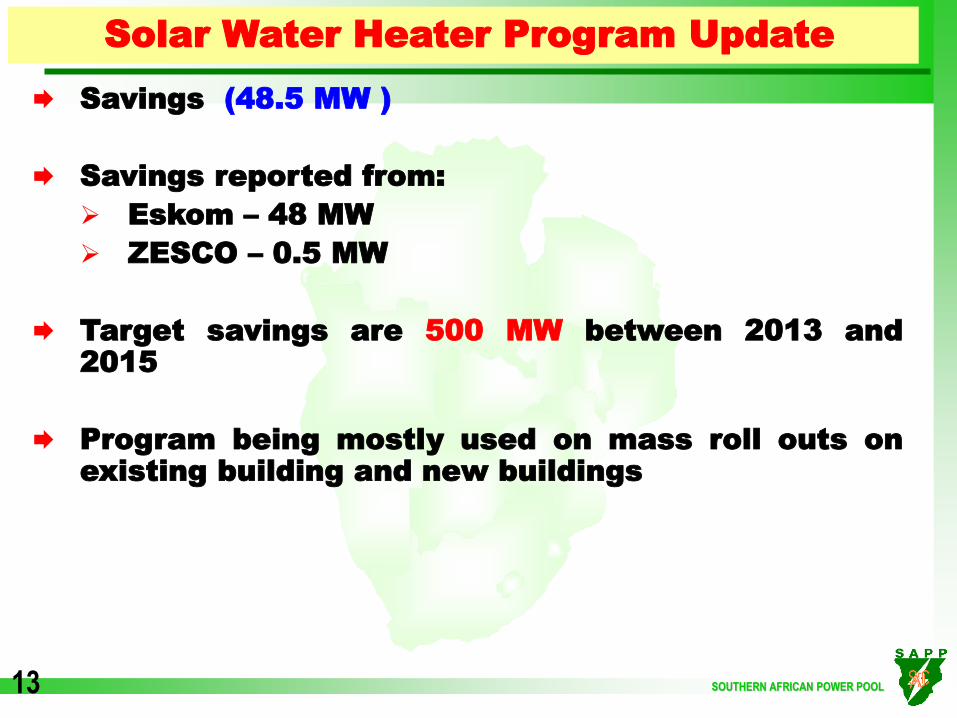
Solar Water Heater Program Update
Savings (48.5 MW )
Savings reported from:
Eskom – 48 MW
ZESCO – 0.5 MW
Target savings are 500 MW between 2013 and
2015
Program being mostly used on mass roll outs on
existing building and new buildings

SOUTHERN AFRICAN POWER POOL 14
Hot Water Load Control Update
Savings Realised to date (211 MW )
Savings reported from:
Eskom – 129 MW
BPC - 40 MW
ESCOM – 21 MW
Other Utilities – 31 MW
Target savings are 400 MW between 2011 and
2015
Mainly remote ripple control programs

SOUTHERN AFRICAN POWER POOL 15
Virtual Power Station - Where is SAPP?
2012 Actual vs. Target
CFL = 2045 MW
HWLC = 211 MW
SWH = 48.4 MW
CL = 42 MW
2,305 MW installed vs. 3,200 MW target (72%)
0
500
1000
1500
2000
2500
3000
3500
CFL HWLC SWH Commercial Lighting
Total
Actual Target
CFL = 136%
HWLC = 70%
SWH = 12%
CL = 4%

SOUTHERN AFRICAN POWER POOL 16
Virtual Power Station – Status
Overall success of 72 % (2,305 MW) achieved in 3
years.
Target is to implement 1,920 MW from 2013 to
2015.
Aggressive / Proactive utility action to be pursued
for the remaining programs. (by all utilities)
Experience has shown that the easier the program
is to implement the faster the success rate (eg
136% implemented for the CFL program)
M& V critical for validation of programs
SOUTHERN AFRICAN POWER POOL 17
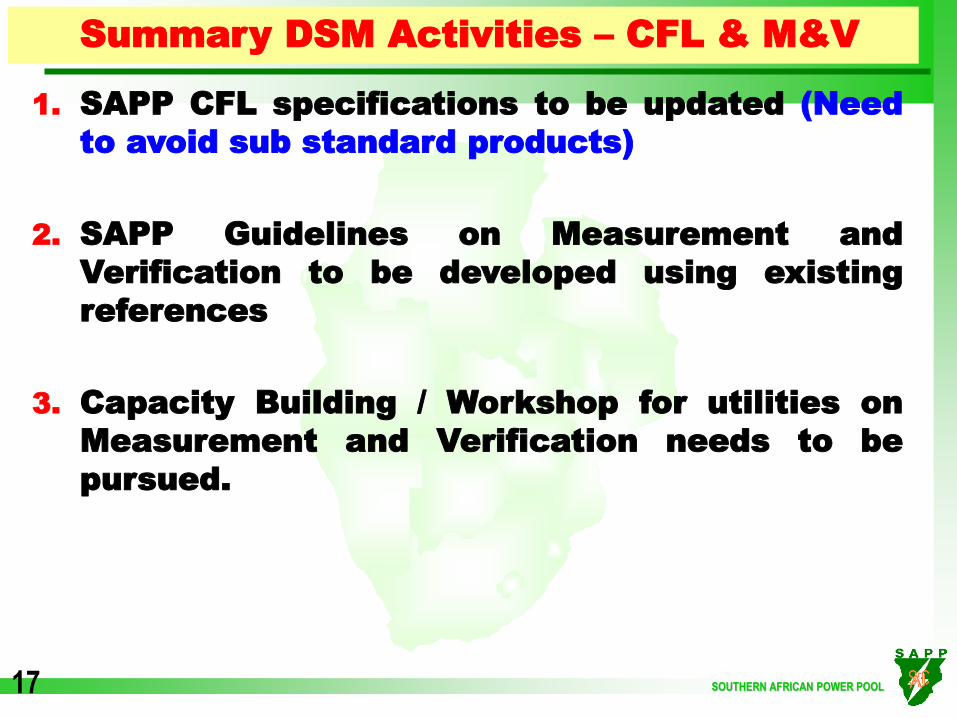
Summary DSM Activities – CFL & M&V
1. SAPP CFL specifications to be updated (Need
to avoid sub standard products)
2. SAPP Guidelines on Measurement and
Verification to be developed using existing
references
3. Capacity Building / Workshop for utilities on
Measurement and Verification needs to be
pursued.

SOUTHERN AFRICAN POWER POOL 18
SAPP Energy Efficiency Framework
1. Draft SAPP Energy Efficiency Framework
developed.
2. Task Team formed to finalise framework (16-
17 April, ZESA Zimbabwe)
3. Involvement of private sector participation and
ESCOs in the Framework to be highlighted

SOUTHERN AFRICAN POWER POOL 19
SAPP EE CHALLENGES/OPPORTUNITIES
1. SAPP member utilities have embraced EE and
RE Programmes
2. However most DSM Programs are hindered by
financial constraints
3. Need to create an enabling environment for RE
and EE development and deployment (Policy)
4. Through Economic Commission for Africa
(ECA), SAPP requests assistance in capacity
building and sharing the UNECE experiences
to accelerate Energy Efficiency programmes
in member countries

SOUTHERN AFRICAN POWER POOL 20
Thank you!