
Sapa Investor Briefing Oslo, 3 November 2016 Innovative ... · Our strategy is to lead the...
69
Innovative aluminium solutions Copyright © 2016 Sapa Group • Sapa Investor Briefing • Oslo, 3 November 2016
Transcript of Sapa Investor Briefing Oslo, 3 November 2016 Innovative ... · Our strategy is to lead the...

Innovative aluminium solutions
Copyright © 2016 Sapa Group
• Sapa Investor Briefing
• Oslo, 3 November 2016
Copyright © 2016 Sapa Group
2
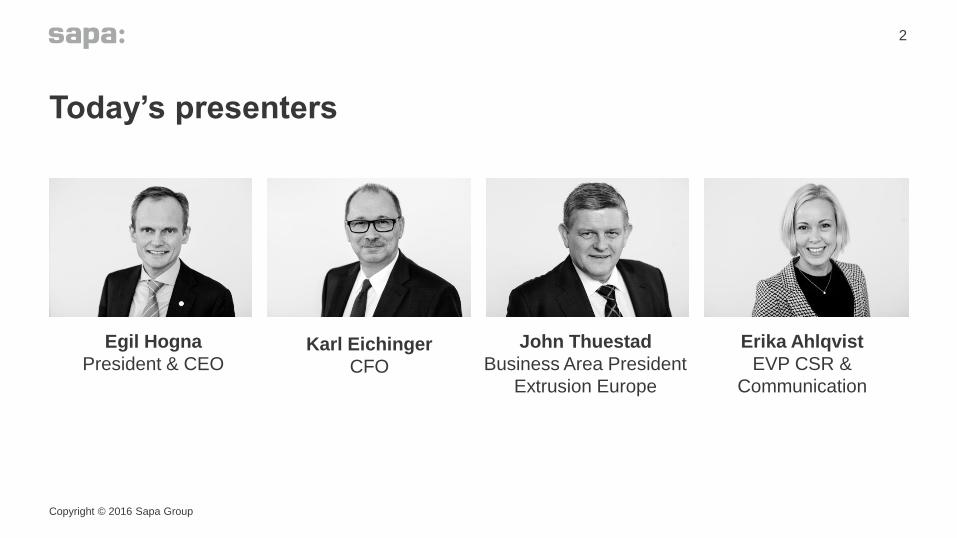
Today’s presenters
Egil Hogna
President & CEO
John Thuestad
Business Area President
Extrusion Europe
Karl Eichinger
CFO
Erika Ahlqvist
EVP CSR &
Communication
Today’s agenda
Building the Sapa of today and the future
CEO presentation
Leveraging the Sapa platform in practice
Business area Extrusion Europe presentation
Shifting focus from turnaround to profitable growth
CFO presentation
The journey ahead
CEO concluding remarks
Q&ACopyright © 2016 Sapa Group
3

Shaping a sustainable future through innovative aluminium solutions
Building the Sapa of today and the future
Copyright © 2016 Sapa Group
4
• Egil Hogna
• President & CEO

Copyright © 2016 Sapa Group
5
Unique position as world leading extrusion company
• Aluminium and Extrusion is an attractive market
• JV formation rationale proven with clear competitive advantages
• Business model with high value added, flexibility and low commodity price risk
• Clear strategy for growth and value creation
• Our journey is paying off – consistent improvements since inception
Our purpose
Shaping a sustainable future through innovative aluminium solutions
Copyright © 2016 Sapa Group
6

2007 2008 2009 2010 2011 2012 2013 2014 2015 Sep-16
Total recordable rate
Safety is our top priority
Copyright © 2016 Sapa Group
12.8
3.6
7

Sapa has driven consolidation in the extrusion industry
• Building on knowledge base and rightsizing portfolio in Europe
• Integrating and capitalizing on strong positions in North America
• Developing attractive positions in high-growth markets
• Flexibility and capability to meet challenging market conditions
8
1963 1971 1986 1997 2000 2005 2007 2009 20132010 2011
Hydro, Karmøy,
NorwaySapa establishes
Scandex in the
Netherlands
Hydro acquires 5
Alcan plants in Europe
Hydro acquires
Acro in Brazil
Sapa acquires
Anodizing in USA
Hydro builds
Precision Tubing
plant in Suzhou,
China
Sapa forms joint
venture with Alcoa
Sapa acquires
Indalex in USA
and Canada
Sapa aquires
Vijalco in Vietnam
Sapa acquires Alufit in
Kuppam, India and
Jiangyin in China
Joint venture between
Sapa and Hydro
extrusion Sapa, Vetlanda,
Sweden

Copyright © 2016 Sapa Group
9
Sapa – more than 50 years of consolidation
22,200 people
54 NOK billion turnover**
#1 global extrusions producer
Present in ~ 40 countries
> 50% of production using recycled aluminium
14% ROCE*
* Pre tax rolling 12 months, year to date Q3 2016
** Rolling 12 months, year to date Q3 2016

Significant steps taken since last year
Copyright © 2016 Sapa Group
10
• Significant bottom line improvements, supported by Sapa delivering on synergy targets ahead of time
• Quality systems lifted to industry benchmark
• Improved product mix and increased Net Added Value per kg by 12%*
• Corporate HQ streamlined, business area synergy setup strengthened
• Strengthened platform for growth in Asia in attractive niches, expansions commencing in Precision Tubing
• NOK 1.35 billion vs NOK 1 billion target
Integration and
restructuring
Increased quality
and value-added
Simplification and
collaboration
Asian footprint
consolidated
* Net Added Value defined as revenues less cost of materials and freight.
Figure is LTM Q3 2016 over LTM Q3 2015 (NOK)

Sapa operates in four business areas
Copyright © 2016 Sapa Group
11
Extrusion Europe Building Systems Precision TubingExtrusion North America

Business concentrated in Extrusion North America and Europe
Copyright © 2016 Sapa Group
12
Sales breakdown by business area (2015)
36 %
39 %
13%
12 % Extrusion Europe
Extrusion NorthAmerica
Building System
Precision Tubing
Sales breakdown by geography (2015)
52%42%
2%
4%Europe
North & CentralAmerica
South America
Asia incl ME
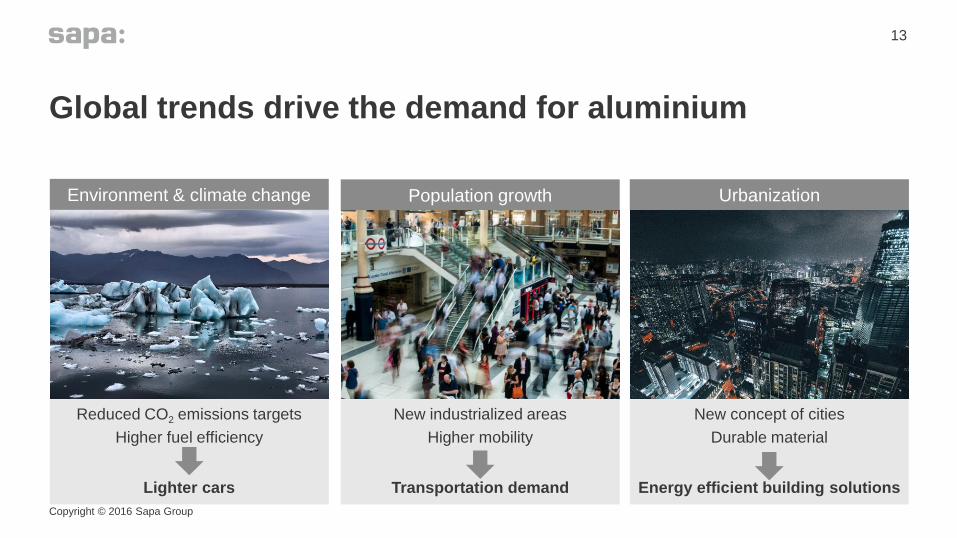
Global trends drive the demand for aluminium
13
Copyright © 2016 Sapa Group
Environment & climate change Population growth Urbanization
Reduced CO2 emissions targets
Higher fuel efficiency
Lighter cars
New industrialized areas
Higher mobility
Transportation demand
New concept of cities
Durable material
Energy efficient building solutions

Copyright © 2016 Sapa Group
14
Aluminium is durable, infinitely recyclable and provides more efficient solutions
Low weight
high strength
Superior
malleability
Corrosion
resistance
Recyclable with
low energy input

Bauxite Alumina
DownstreamUpstream
Well-positioned in downstream aluminium
Copyright © 2016 Sapa Group
15
What it does?
Mining Refining Smelting & Casting
What it produces?
Who it serves?
Foundry alloys, ingots
Commodity
price is pass-
through
Extrusion Casting Rolling
Cast products Plates, strip and foilExtruded products

Robust outlook for aluminium extrusion end markets
16
4.0% 3.5%1.9% 2.0%
0.5%
5.5%
2.5%
Asia Excl China North America Europe China Central/ SouthAmerica
Other Weighted Average
Extrusion Demand Volume CAGR 2015-2020 by Sector
Source: CRU – Global Extrusion Data – 2016 June
6.0% 5.6%4.3%
3.5%
0.9%
3.9%2.5%
Transportation &Automotive
ConsumerDurables
Machinery &Equipment
Electrical Construction Other Weighted Average
13% 10% 12% 60% 2% 2%
14% 4% 12% 3% 63% 3%% of 2015
market demand
% of 2015
market demand
Extrusion Demand Volume CAGR 2015-2020 by Geography
Copyright © 2016 Sapa Group
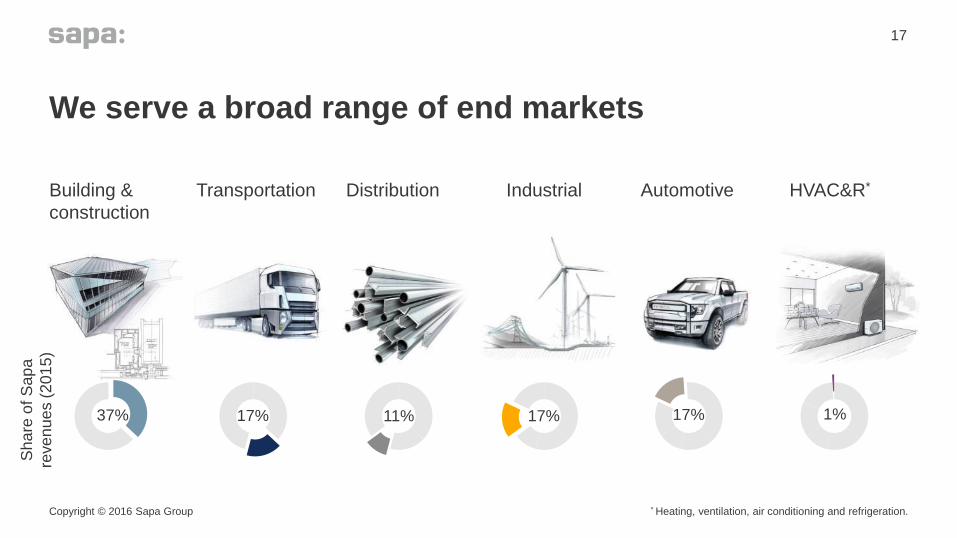
We serve a broad range of end markets
Copyright © 2016 Sapa Group
17
Building &
construction
AutomotiveIndustrialTransportation Distribution HVAC&R*
37% 17% 11% 17% 17% 1%
Sh
are
of S
ap
a
reve
nu
es (
20
15
)
* Heating, ventilation, air conditioning and refrigeration.

Sapa’s vision guides our strategy and how we do business
We are aluminium. Excelling in technology and innovation. Today and tomorrow. Sapa – Innovative aluminium solutions
Copyright © 2016 Sapa Group
18
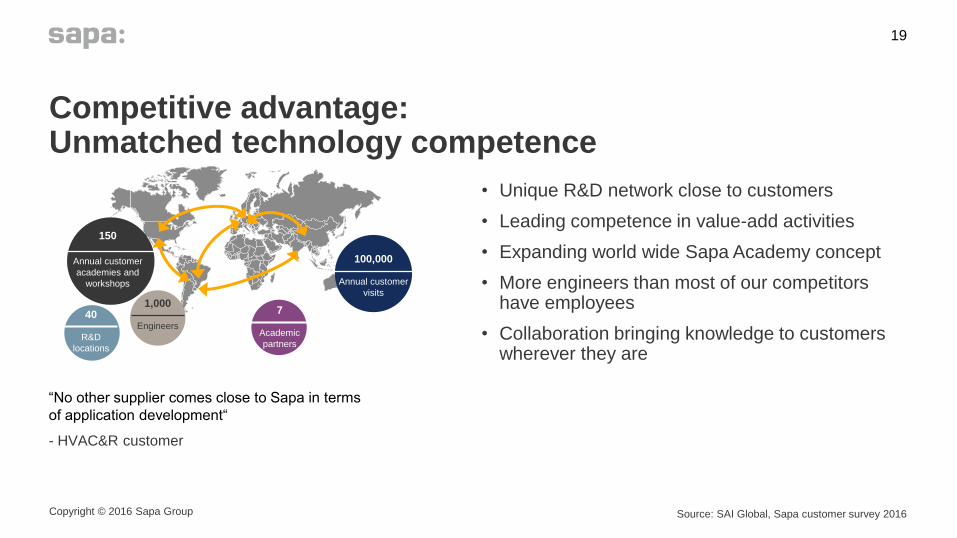
• Unique R&D network close to customers
• Leading competence in value-add activities
• Expanding world wide Sapa Academy concept
• More engineers than most of our competitors have employees
• Collaboration bringing knowledge to customers wherever they are
Copyright © 2016 Sapa Group
19
1,000
Engineers
40
R&D
locations
7
Academic
partners
“No other supplier comes close to Sapa in terms
of application development“
- HVAC&R customer
150
Annual customer
academies and
workshops
100,000
Annual customer
visits
Competitive advantage: Unmatched technology competence
Source: SAI Global, Sapa customer survey 2016
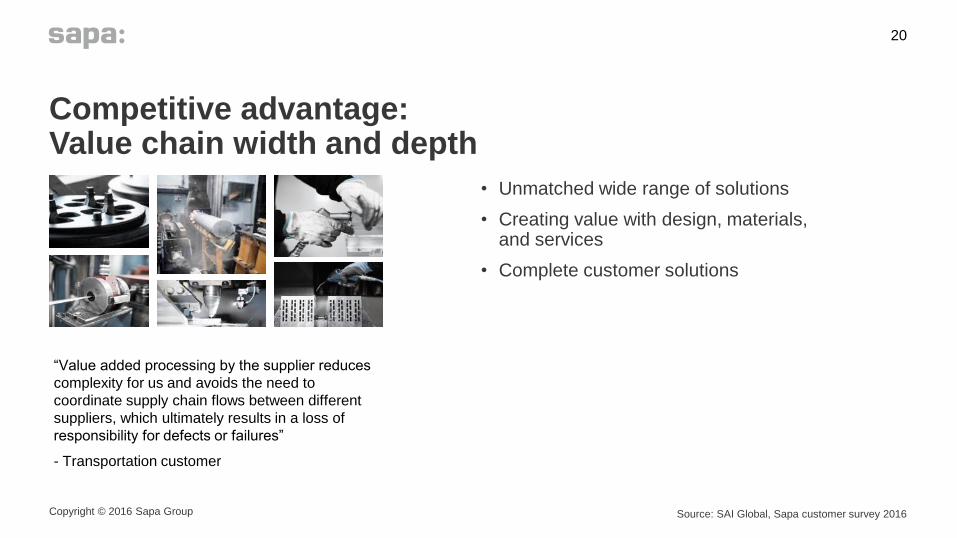
• Unmatched wide range of solutions
• Creating value with design, materials, and services
• Complete customer solutions
Copyright © 2016 Sapa Group
20
“Value added processing by the supplier reduces
complexity for us and avoids the need to
coordinate supply chain flows between different
suppliers, which ultimately results in a loss of
responsibility for defects or failures”
- Transportation customer
Competitive advantage: Value chain width and depth
Source: SAI Global, Sapa customer survey 2016
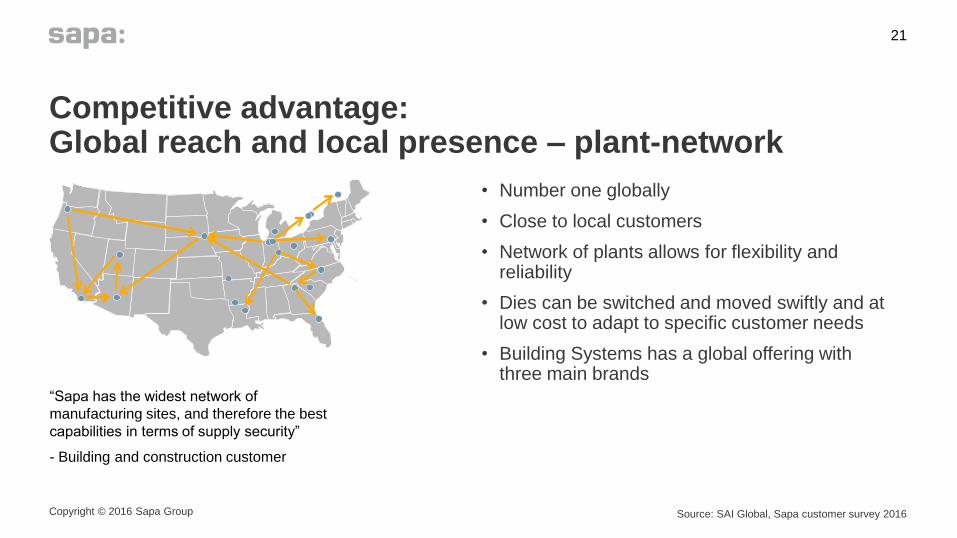
• Number one globally
• Close to local customers
• Network of plants allows for flexibility and reliability
• Dies can be switched and moved swiftly and at low cost to adapt to specific customer needs
• Building Systems has a global offering with three main brands
Copyright © 2016 Sapa Group
21
“Sapa has the widest network of
manufacturing sites, and therefore the best
capabilities in terms of supply security”
- Building and construction customer
Competitive advantage: Global reach and local presence – plant-network
Source: SAI Global, Sapa customer survey 2016

Our strategy is to lead the aluminium extrusion industry by offering the best value in innovative aluminium solutions
1. Increase value-added to our customers
Copyright © 2016 Sapa Group
22
2. Simplify and collaborate
3. Selective growth

Fast facts
Extrusion Europe – market leader with strong focus on value added products
• Be the European industry shaper
• Benefit from speed and proximity in building and construction
• Outperform competition in vertical integration and material substitution
• Grow exposure to high value add automotive, transport, and engineering end markets
Copyright © 2016 Sapa Group
23
40 locations
Market share
Revenues:
NOK 19.8 bn
9,400 people
24%

Fast facts
Extrusion North America – uniquely positioned as the only coast-to-coast supplier
• Further develop strong position in transportation and distribution
• Increase position through superior “ease of doing business” model and unique new services and product offerings
• Lead in alloy development, application engineering support, and customer education academies
• Grow exposure to high value add automotive and building and construction end markets
24
Copyright © 2016 Sapa Group
23 locations
Market share
Revenues:
NOK 20.6 bn
6,300 people
27%

Fast facts
Building Systems – leading European player with well recognized multi-brand portfolio
• Become the market leader in Europe
• Grow business in Asia and enter North America
• Lead in product design and energy efficient solutions through strong R&D capabilities
• Reinforce three main brands to improve market positions and lower product development costs
25
Copyright © 2016 Sapa Group
Employees in
29 countries
Market share
Revenues:
NOK 7.2 bn
2,800 people
18%

Fast facts
Precision Tubing – technology leaders in selected niches
• Be in the forefront in precision aluminium solutions for heat transfer and industrial applications
• Lead the material substitution in the HVAC&R industry
• Focus extrusion business in South America and Asia on selected high added value market niches
• Create new aluminium solutions for fluid lines, cables and cooling lines for batteries
26
Copyright © 2016 Sapa Group
17 locations
Market share*
Revenues:
NOK 6.3 bn
3,100 people
64%
* Automotive, main markets

Key priorities for 2017
• Continuing improvements in safety and quality
• Value over volume - increased share of value-added products in all business areas
• Simplification and collaboration to further reduce costs and operate smarter
• Continued focus on capital efficiency and strong cash generation
• Continue to lay the foundation for strategic growth
27
Copyright © 2016 Sapa Group

Shaping a sustainable future through innovative aluminium solutions
Leveraging the Sapa platform in practice
Copyright © 2016 Sapa Group
28
• John Thuestad
• BA President
Extrusion Europe
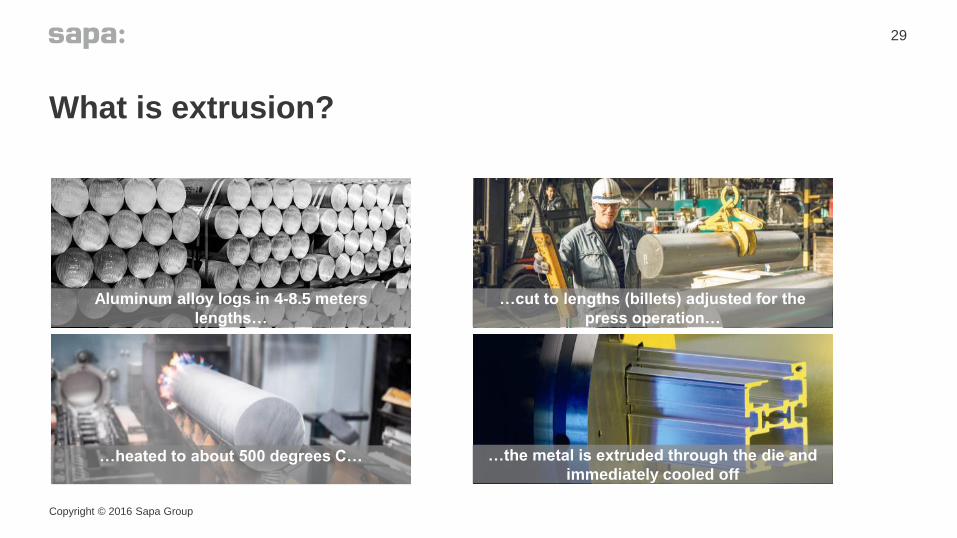
What is extrusion?
Copyright © 2016 Sapa Group
29
…heated to about 500 degrees C… …the metal is extruded through the die and
immediately cooled off
Aluminum alloy logs in 4-8.5 meters
lengths…
…cut to lengths (billets) adjusted for the
press operation…

Develop plant footprint to reflect the European
market
Took leadership position in European market
Created a European lead team and culture
Our journey since 2013
Copyright © 2016 Sapa Group
30
People CustomersCapability
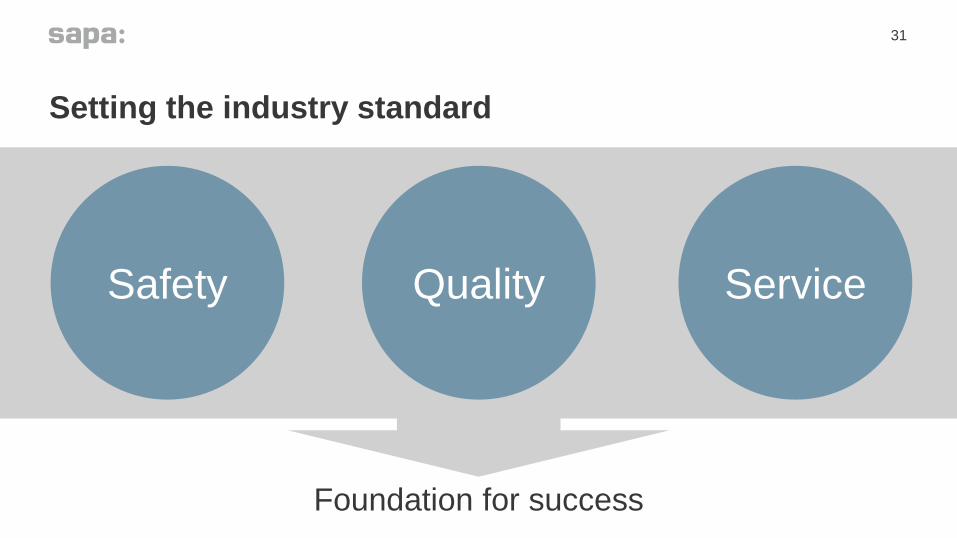
Setting the industry standard
Safety Quality Service
Foundation for success
31

Extrusion Europe’s journey is paying offFocus shift: Value over volume
Copyright © 2016 Sapa Group
32
Volume (kmt) NAV/kg (EUR, indexed)
Underlying EBIT (NOK million)
613 563 574
2014 2015 LTM Q3 2016
100 115 119
2014 2015 LTM Q3 2016
224
475
705
2014 2015 LTM Q3 2016
• Value over volume – selective on segments to develop
• Improved product mix
• Improving cost position through significant restructuring
Highlights
LTM = Last Twelve Months; NAV = Net Added Value, calculated as operating revenues less cost of material, including freight costs out

From extrusions to solutions
Copyright © 2016 Sapa Group
33
16 Locations for Surface Treatment
>600 kmt of extrusions produced in
40 locations350 kmt of billet remelted in 8 Cast Houses
EUR 350 million of Fabrication

How do we leverage the strengths of Sapa?
Copyright © 2016 Sapa Group
34
Scale Capability R&D/Applications
1 2 3

Scale
• 40 production locations in 20 countries with 24% market share
• 10,000 employees with knowledge & experience unparalleled in the market
• 20,000 customers (300-600 customers per plant)
• Low dependence on individual customers, markets or segments
35
Copyright © 2016 Sapa Group
1

2
B&C Marine & OffshoreAutomotive Rail
Capability
Copyright © 2016 Sapa Group
36
Customized design and tailored solutions
• Light & strong structural parts
• Next generation crash management systems and alloys
• Smart and modular battery solutions for e-mobility
• Aesthetical and functional roof rails and trims
• Exceptional quality and lead times for large scale high end projects
• Direct connection with local metal builders driving high value in regional markets
• Internal synergies & service driving the value proposition of Sapa Building Systems
• Structural friction stir welded components and sub-assemblies
• Large structural extrusions to support light weight designs
• Alloy development to drive material efficiency
• Welded panels for structures below and above the waterline
• Fully fabricated components
• New alloy development, focusing on corrosion resistance

R&D and application development
• Copyright © 2016 Sapa Group • We have the Sapa Technology facility in Sweden focusing on process and product development
• We have over 200 application engineers throughout Europe
• We have an unparalleled ability to partner with our customers for advanced solutions
37
Copyright © 2016 Sapa Group
3

When we combine these, there is nothing we can’t do when it comes to aluminium
Copyright © 2016 Sapa Group
38
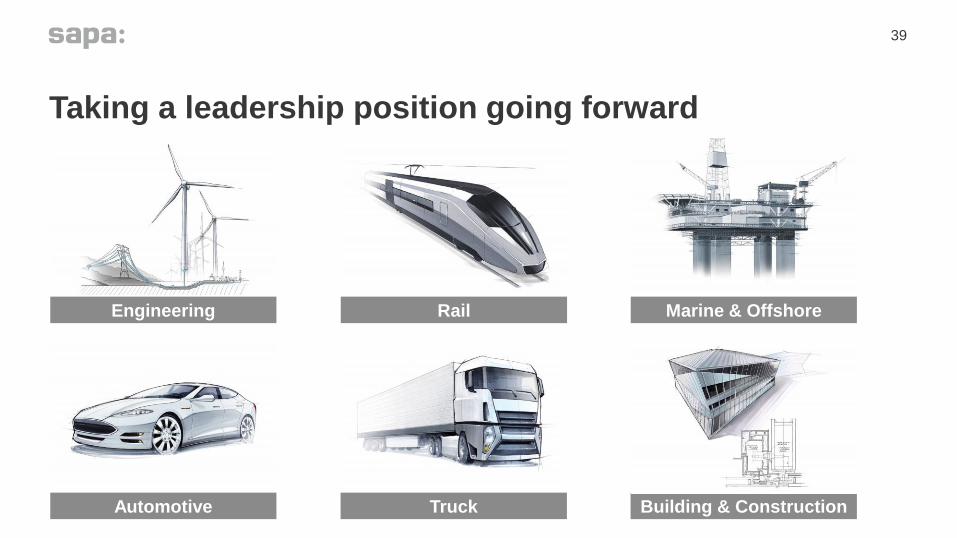
Taking a leadership position going forward
Building & Construction
Engineering Marine & Offshore
Automotive Truck
Rail
39

Crash management systems for safer trucks
• Joint development with major truck manufacturers
• Sapa in Tier 1 position, delivering 100% of the volume
• 45% weight reduction
• Value add based product including alloy development, bending, machining, welding, and assembly
Copyright © 2016 Sapa Group
40

Delivering solutions to marine and offshore market
• Working with Apply Leirvik, delivering parts to the housing quarters constructed with wide panels
• Weight reduction, corrosion resistance, and lowered maintenance costs
• Utilizing Sapa’s competence and capabilities in Magnor, Norway and Finspång, Sweden
Copyright © 2016 Sapa Group
41
Courtesy Apply Lervik

Driving high end building and construction solutions
• Supply a façade system designed by Gartner
• Provides a one stop solution – project management, extrusion, thermal break & surface treatment
• Uniquely positioned to provide profiles including big and wide shapes
Copyright © 2016 Sapa Group
42

Our strategic priorities going forward
• Increase solution development serving the high value markets
• Outperform competition in vertical integration and material substitution
• Shape the European aluminium extrusion Industry
Copyright © 2016 Sapa Group
43

Shaping a sustainable future through innovative aluminium solutions
From turnaround to profitable growth
Copyright © 2016 Sapa Group
44
• Karl Eichinger
• CFO

Recap of financial priorities at JV formation
Copyright © 2016 Sapa Group
45
• Retain business
• Extract synergies
• Improve margins
Level
of
urg
en
cy
High1
2
3
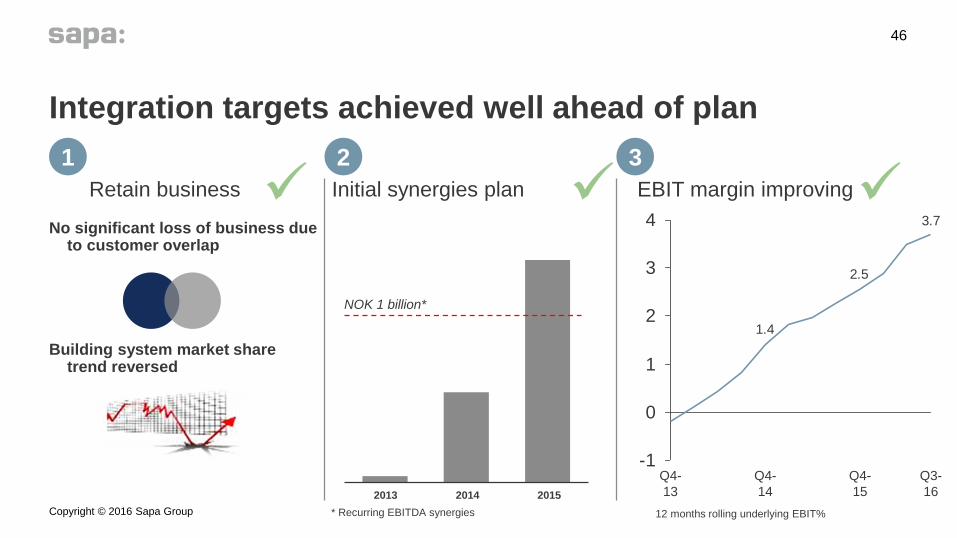
No significant loss of business due
to customer overlap
Building system market share trend reversed
Integration targets achieved well ahead of plan
Copyright © 2016 Sapa Group
46
20142013 2015
Initial synergies plan EBIT margin improvingRetain business
12 months rolling underlying EBIT%
1 2 3
NOK 1 billion*
* Recurring EBITDA synergies
3.7
2.5
1.4
-1
0
1
2
3
4
Q4-
13
Q4-
14
Q4-
15
Q3-
16

We went through 29 significant restructuring projects in the initial synergy programme
Copyright © 2016 Sapa Group
47
Divestments (5)
Full plant closure (10)
Part closure / restructuring / downsizing (14)
Bolzano
Haticon II
Autocar
Jiangyin
SCAP
Guelph
Hanover
Miami
Workington
Pinon
Bedwas
Seneffe
Fossanova
Eural
Perfialsa
Sweden I
Sweden II
Koefem I
Koefem II
Trzcianca
Ziar
X-Docks France
X-Docks DACH
Harderwijk
Haticon I
Benelux cost reduction
Iberia cost reduction
Puget
Extrusion Americas 2nd round restructuring

1 399 1 363 1 366
2014 2015 LTM Q3 2016
(2.3)%
Sapa Group Cost position and portfolio mix improved
Copyright © 2016 Sapa Group
48
Volume (kmt) NAV/kg (NOK, indexed)
Underlying EBIT (NOK million)
100 125 134
2014 2015 LTM Q3 2016
652
1 407
1 991
2014 2015 LTM Q3 2016
• Value over volume – selective on segments to develop
• Customer value focus reflected in the margins
• Company wide restructuring has strengthened the cost position and enable result improvements
LTM = Last Twelve Months; NAV = Net Added Value, calculated as operating revenues less cost of material, including freight costs out
Corporate cost and other are included in Sapa group with 2016 Q3 LTM -200 MNOK, 2015 FY -194 MNOK, 2014 FY -458 MNOK
Highlights
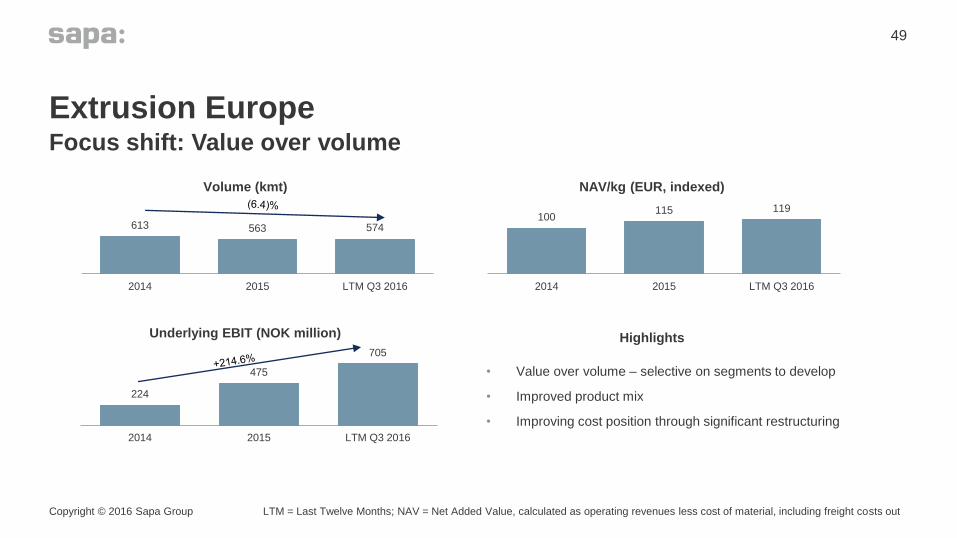
Extrusion EuropeFocus shift: Value over volume
Copyright © 2016 Sapa Group
49
Volume (kmt) NAV/kg (EUR, indexed)
Underlying EBIT (NOK million)
613 563 574
2014 2015 LTM Q3 2016
100 115 119
2014 2015 LTM Q3 2016
224
475
705
2014 2015 LTM Q3 2016
• Value over volume – selective on segments to develop
• Improved product mix
• Improving cost position through significant restructuring
Highlights
LTM = Last Twelve Months; NAV = Net Added Value, calculated as operating revenues less cost of material, including freight costs out
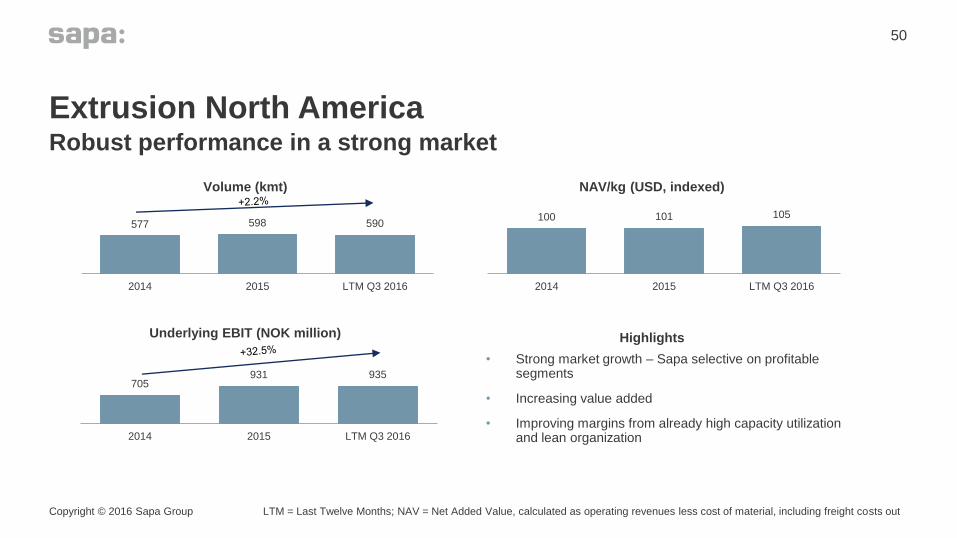
577 598 590
2014 2015 LTM Q3 2016
Extrusion North AmericaRobust performance in a strong market
Copyright © 2016 Sapa Group
50
Volume (kmt) NAV/kg (USD, indexed)
Underlying EBIT (NOK million)
100 101 105
2014 2015 LTM Q3 2016
705 931 935
2014 2015 LTM Q3 2016
• Strong market growth – Sapa selective on profitable segments
• Increasing value added
• Improving margins from already high capacity utilization and lean organization
Highlights
LTM = Last Twelve Months; NAV = Net Added Value, calculated as operating revenues less cost of material, including freight costs out

88 77 77
2014 2015 LTM Q3 2016
Building SystemsRestructuring and stronger commercial offering improving results
Copyright © 2016 Sapa Group
51
Volume (kmt) NAV/kg (EUR, indexed)
Underlying EBIT (NOK million)
100 115 119
2014 2015 LTM Q3 2016
(1)71
297
2014 2015 LTM Q3 2016
• Improving results in weak market
• Increasing value added
• Significant restructuring has improved cost position
Highlights
LTM = Last Twelve Months; NAV = Net Added Value, calculated as operating revenues less cost of material, including freight costs out

147 145 149
2014 2015 LTM Q3 2016
+1.4%
Precision TubingBenefiting from restructuring and growing end-markets
Copyright © 2016 Sapa Group
52
Volume (kmt) NAV/kg (NOK, indexed)
Underlying EBIT (NOK million)
100 124 132
2014 2015 LTM Q3 2016
181 124
255
2014 2015 LTM Q3 2016
• Underlying market improvement in automotive and HVAC&R
• Restructuring in 2014-16 in general extrusion
• Focus shift, niche strategy in emerging markets paying off
Highlights
LTM = Last Twelve Months; NAV = Net Added Value, calculated as operating revenues less cost of material, including freight costs out

Steady trajectory of improving results
53
52
190367
652
8891 021
1 224
1 407
1 586
1 907 1 991
0.4%1.4%
2.8%
4.8%
6.4%7.1%
8.3%
9.5%
10.8%
13.0%13.7%
Q1'14 Q2'14 Q3'14 Q4'14 Q1'15 Q2'15 Q3'15 Q4'15 Q1'16 Q2'16 Q3'16
LTM Underlying EBIT LTM ROCE (%)
LTM rolling underlying EBIT in NOK million, ROCE (pre-tax)
Copyright © 2016 Sapa Group LTM = Last Twelve Months
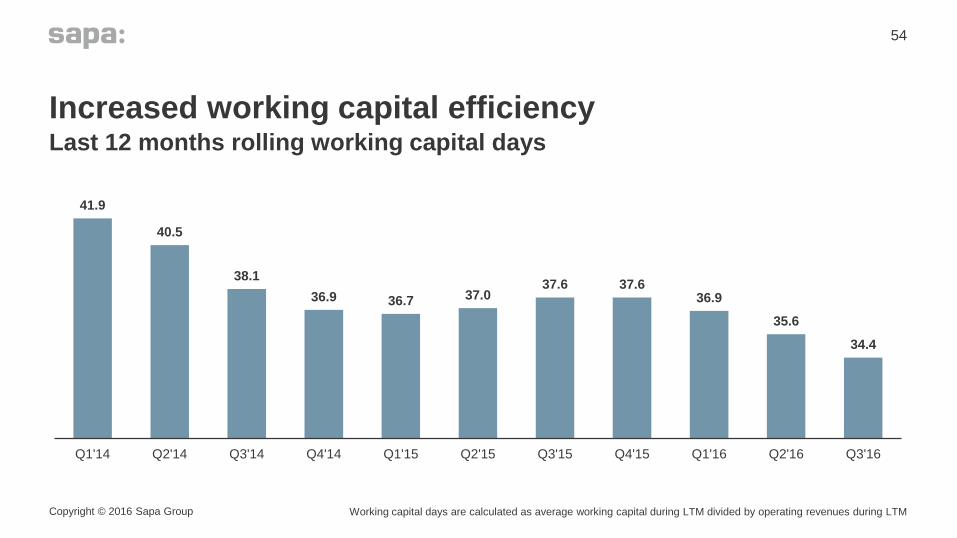
54
41.9
40.5
38.1
36.9 36.7 37.037.6 37.6
36.9
35.6
34.4
Q1'14 Q2'14 Q3'14 Q4'14 Q1'15 Q2'15 Q3'15 Q4'15 Q1'16 Q2'16 Q3'16
Last 12 months rolling working capital days
Increased working capital efficiency
Copyright © 2016 Sapa Group Working capital days are calculated as average working capital during LTM divided by operating revenues during LTM
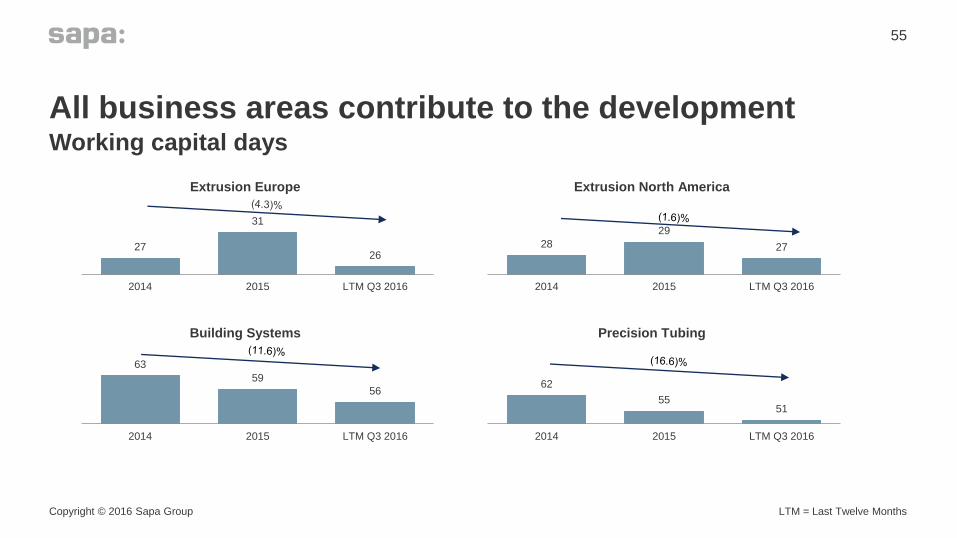
63
59
56
2014 2015 LTM Q3 2016
All business areas contribute to the developmentWorking capital days
Copyright © 2016 Sapa Group
55
Extrusion Europe Extrusion North America
Building Systems Precision Tubing
LTM = Last Twelve Months
27
31
26
2014 2015 LTM Q3 2016
62
55 51
2014 2015 LTM Q3 2016
28
29
27
2014 2015 LTM Q3 2016

Sustaining and safety Capex below depreciationCapex (NOK billion)
56
1.1 1.1
1.51.3
2013 2014 2015 LTM 2016
Copyright © 2016 Sapa Group
Capex as % of
Depreciation94% 85% 112% 100%

Meeting strong demand in automotive in China
Copyright © 2016 Sapa Group
57

Select investments within e-mobility
Copyright © 2016 Sapa Group
58
Continued focus on capital efficiency
• Continued tight working capital management
• Sustained and safety Capex below depreciation
• Selective capability and capacity investments to support move towards more value-added solutions
59
Copyright © 2016 Sapa Group
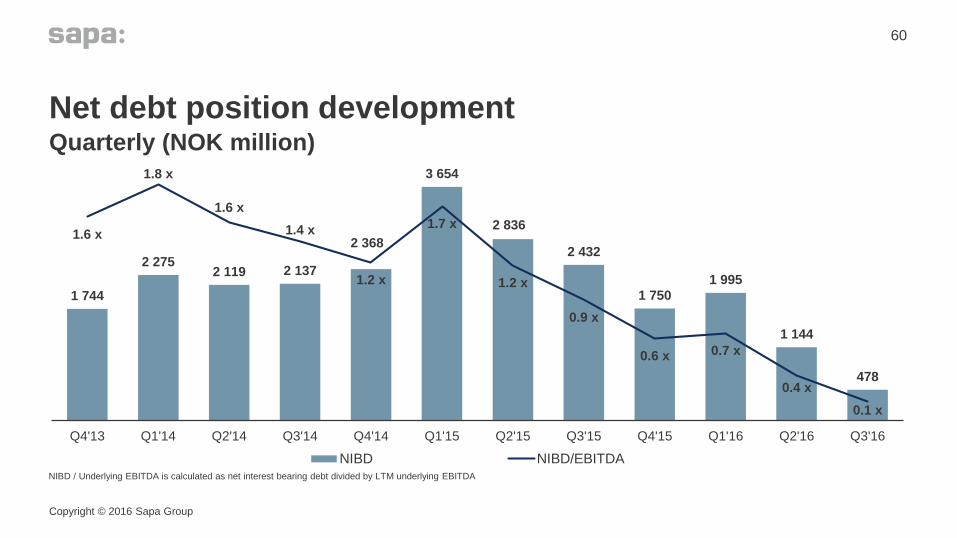
1 744
2 275 2 119 2 137
2 368
3 654
2 836
2 432
1 750
1 995
1 144
478
1.6 x
1.8 x
1.6 x
1.4 x
1.2 x
1.7 x
1.2 x
0.9 x
0.6 x 0.7 x
0.4 x
0.1 x
Q4'13 Q1'14 Q2'14 Q3'14 Q4'14 Q1'15 Q2'15 Q3'15 Q4'15 Q1'16 Q2'16 Q3'16
NIBD NIBD/EBITDA
Net debt position development
60
Quarterly (NOK million)
Copyright © 2016 Sapa Group
NIBD / Underlying EBITDA is calculated as net interest bearing debt divided by LTM underlying EBITDA

Sapa has low exposure to aluminum price volatility
Copyright © 2016 Sapa Group
61
• Spread: production, engineering, design -> value added
• Premium: premium above LME reflecting standard ingot and billet premiums
• London Metal Exchange (LME): price
• Formula Pricing: LME and Premium passed to the customer at market
• Fixed Price Contract: LME and Premium hedged for certain period during which customer charged a flat rate
• Catalogue Pricing: Set price in effect until a change is communicated
Pricing components
Formula50%Fixed
Price40%
Catalogue10%
Pricing methods
Premium
Spread
LME
Price to
Customer

Key takeaways
• ROCE: 13.7% (up from 0.4% as of Q1-2014)
• EBIT: NOK 2.0 billion LTM* (up from NOK 52 million as of Q1-2014)
• NIBD/EBITDA: 0.1x (down from 1.8x as of Q1-2014)
• Working capital days: 34.4 (down from 41.9 as of Q1-2014)
• Sustaining capex: below depreciation
Copyright © 2016 Sapa Group
62
* LTM = Last twelve months rolling
Shaping a sustainable future through innovative aluminium solutions
The journey ahead
Copyright © 2016 Sapa Group
63
• Egil Hogna
• President & CEO
Copyright © 2016 Sapa Group
64
Unique position as world leading extrusion company
• Aluminium and Extrusion is an attractive market
• JV formation rationale proven with clear competitive advantages
• Business model with high value added, flexibility and low commodity price risk
• Clear strategy for growth and value creation
• Our journey is paying off – consistent improvements since inception

www.shapes.al

Shaping a sustainable future through innovative aluminium solutions
Appendix
Copyright © 2016 Sapa Group
66
Copyright © 2016 Sapa Group
67
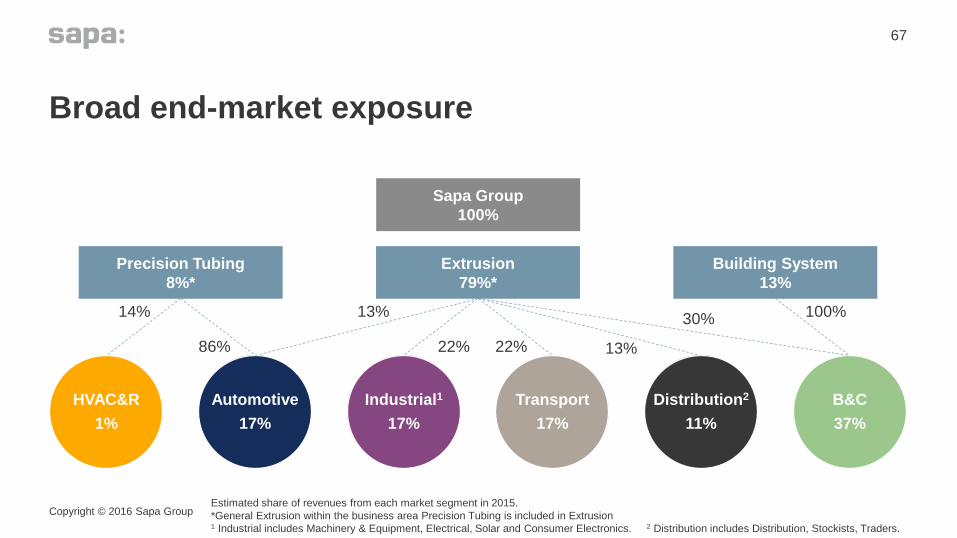
Broad end-market exposure
Distribution2
11%
Transport
17%
HVAC&R
1%
B&C
37%
Industrial1
17%
Automotive
17%
Sapa Group
100%
Precision Tubing
8%*
Extrusion
79%*
Building System
13%
14%
86%
13%
22% 22% 13%
100%
Estimated share of revenues from each market segment in 2015.
*General Extrusion within the business area Precision Tubing is included in Extrusion1 Industrial includes Machinery & Equipment, Electrical, Solar and Consumer Electronics. 2 Distribution includes Distribution, Stockists, Traders.
30%

The corporate management team
Copyright © 2016 Sapa Group
68
Florian Krumbacher
EVP General
Counsel
Katarina Nilsson
EVP HR
Egil Hogna
President & CEOKarl Eichinger
CFO
Rafael Fuertes
EVP Strategy &
Innovation
Erika Ahlqvist
EVP Communication
Charlie Straface
EVP Extrusion
Americas
Salvador Biosca
EVP Building
Systems
John Thuestad
EVP Extrusion
Europe
Sergio Vendrasco
EVP Precision
Tubing
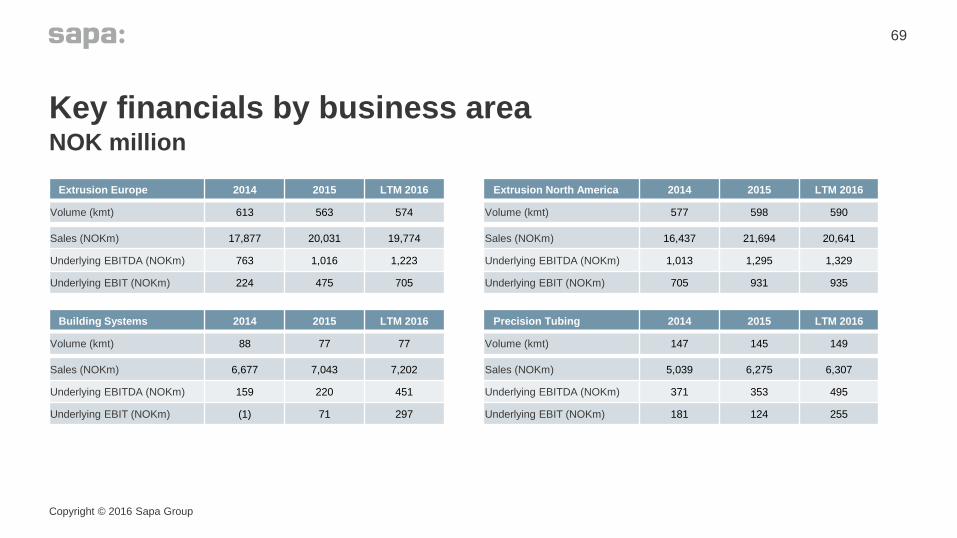
Key financials by business area
69
NOK million
Copyright © 2016 Sapa Group
Extrusion Europe 2014 2015 LTM 2016
Volume (kmt) 613 563 574
Sales (NOKm) 17,877 20,031 19,774
Underlying EBITDA (NOKm) 763 1,016 1,223
Underlying EBIT (NOKm) 224 475 705
Building Systems 2014 2015 LTM 2016
Volume (kmt) 88 77 77
Sales (NOKm) 6,677 7,043 7,202
Underlying EBITDA (NOKm) 159 220 451
Underlying EBIT (NOKm) (1) 71 297
Extrusion North America 2014 2015 LTM 2016
Volume (kmt) 577 598 590
Sales (NOKm) 16,437 21,694 20,641
Underlying EBITDA (NOKm) 1,013 1,295 1,329
Underlying EBIT (NOKm) 705 931 935
Precision Tubing 2014 2015 LTM 2016
Volume (kmt) 147 145 149
Sales (NOKm) 5,039 6,275 6,307
Underlying EBITDA (NOKm) 371 353 495
Underlying EBIT (NOKm) 181 124 255


