![Notions fondamentales du langage C# · Dotnet France Association 3 [Notions fondamentales du langage Csharp] [Date : 25/03/09] Langage humain Langage de programmation Langage binaire](https://static.fdocuments.us/doc/165x107/5be2ccf909d3f284098c57fb/notions-fondamentales-du-langage-c-dotnet-france-association-3-notions-fondamentales.jpg)
SAP Notions fondamentales Chapitre 1 et 2
52
1 Copyright © 2006, Pierre-Majorique LÉGER, Jacques ROBERT, Gilbert BABIN and Robert PELLERIN, HEC Montréal. All rights reserved for all countries. ERP Simulation Game with mySAP ERP CHAPTER 1 - INTRODUCTION 1.1 Description of our new company 1.1.1 Introduction As a participant in the HEC Montreal Simulation game, you’ve just earned a new job in the industry of pre-packaged mixes of Muesli. Muesli is a popular breakfast dish. Dry muesli is a mixture of mainly rolled oats and wheat flakes, with nuts and pieces of dried fruit. According to Wikipedia,“Muesli was invented in 1900 by Swiss doctor Maximilian Bircher-Benner for patients in his hospital” . Muesli was first popularized in Germany and Switzerland. In the late 1980s, the company Kellogg marketed its brand Mueslix in North America. Since then, an interest for its own local brand of muesli has developed. Today, dry muesli is widely available in the form of pre-packaged mixes. It can be stored for many months and served mixed with yoghurt or milk and pieces of fresh fruit. Some like it in hot milk. Muesli provides an excellent source of essential ingredients as it is rich in fibre and essential trace elements. In the local market, about 2 million boxes of local brands of muesli were sold in 2003. Your new company is one of the local producing companies of pre-packaged muesli boxes. The market is surprisingly fragmented. This could be explained by the fact that entry costs in the industry are relatively small. In 2003, there were six local companies competing in this relatively small but competitive market. You are part of a small executive team leading this company. As member of the executive team, you will have to make strategic decisions throughout the quarters. You will have to select the recipe for your products, perform sale forecasting and production planning, make pricing decisions and determine advertising budgets for each distribution channel. Your team will also be responsible for accounting functions, including reporting quarterly profits. Your new employer has been clear. Unethical behaviour, such as falsifying financial reports, not paying suppliers or the bank loan on time, and violating the industry regulations are unacceptable and will be severely punished. Otherwise, the name of the game is to make the most profit. 1.1.2 Make-to-stock business processes Your muesli company is a make-to-stock manufacturer. It can only sell products that are held in inventory. Therefore, cereal boxes have to be manufactured in advance. This determines some of the business processes that your company will need to perform. Your executive team will need to forecast the number of products the firm intends to sell in the next period for each of its brands. Based on this forecast, production is planned. Material requirements are met by purchasing raw materials from the appropriate suppliers. Production is done in batch. Every product requires its own work center and manufacturing equipment. Further, purchasing raw material requires liquidity. If you choose to produce any large number of boxes in advance, you will have to borrow the necessary funds from the bank on which you will have to pay interest.
Transcript of SAP Notions fondamentales Chapitre 1 et 2

1Copyright © 2006, Pierre-Majorique LÉGER, Jacques ROBERT, Gilbert BABIN and Robert PELLERIN, HEC Montréal. All rights reserved for all countries.
ERP Simulation Game with mySAP ERP
CHAPTER 1 - INTRODUCTION
1.1 Description of our new company
1.1.1 Introduction
As a participant in the HEC Montreal Simulation game, you’ve just earned a new job in the industry of pre-packaged mixes of Muesli.
Muesli is a popular breakfast dish. Dry muesli is a mixture of mainly rolled oats and wheat fl akes, with nuts and pieces of dried fruit.
According to Wikipedia, “Muesli was invented in 1900 by Swiss doctor Maximilian Bircher-Benner for patients in his hospital”. Muesli was
fi rst popularized in Germany and Switzerland. In the late 1980s, the company Kellogg marketed its brand Mueslix in North America.
Since then, an interest for its own local brand of muesli has developed. Today, dry muesli is widely available in the form of pre-packaged
mixes. It can be stored for many months and served mixed with yoghurt or milk and pieces of fresh fruit. Some like it in hot milk. Muesli
provides an excellent source of essential ingredients as it is rich in fi bre and essential trace elements. In the local market, about 2 million
boxes of local brands of muesli were sold in 2003.
Your new company is one of the local producing companies of pre-packaged muesli boxes. The market is surprisingly fragmented. This
could be explained by the fact that entry costs in the industry are relatively small. In 2003, there were six local companies competing in
this relatively small but competitive market. You are part of a small executive team leading this company. As member of the executive
team, you will have to make strategic decisions throughout the quarters. You will have to select the recipe for your products, perform
sale forecasting and production planning, make pricing decisions and determine advertising budgets for each distribution channel. Your
team will also be responsible for accounting functions, including reporting quarterly profi ts. Your new employer has been clear. Unethical
behaviour, such as falsifying fi nancial reports, not paying suppliers or the bank loan on time, and violating the industry regulations are
unacceptable and will be severely punished. Otherwise, the name of the game is to make the most profi t.
1.1.2 Make-to-stock business processes
Your muesli company is a make-to-stock manufacturer. It can only sell products that are held in inventory. Therefore, cereal boxes have
to be manufactured in advance. This determines some of the business processes that your company will need to perform.
Your executive team will need to forecast the number of products the fi rm intends to sell in the next period for each of its brands. Based
on this forecast, production is planned. Material requirements are met by purchasing raw materials from the appropriate suppliers.
Production is done in batch. Every product requires its own work center and manufacturing equipment. Further, purchasing raw material
requires liquidity. If you choose to produce any large number of boxes in advance, you will have to borrow the necessary funds from the
bank on which you will have to pay interest.

2Copyright © 2006, Pierre-Majorique LÉGER, Jacques ROBERT, Gilbert BABIN and Robert PELLERIN, HEC Montréal. All rights reserved for all countries.
ERP Simulation Game with mySAP ERP
Because this is a small company, your team will also have to supervise almost all of the operations of the company and take active part in
some of day-to-day processes. There are tasks that you simply cannot delegate and the success of your company depends on your team.
Your responsibilities in operations include issuing product requisition and purchase orders for raw materials, receiving and producing
the receipts for raw materials, posting invoices and paying the suppliers, transferring the raw material and the fi nished products to the
relevant storage location, and issuing the production order.
We have provided a detailed description of the fi rm’s production cycle:
Forecasting Plants always need to produce a period worth of products in advance. Only product in stock at the beginning
of the period can be sold to retailers. Therefore, the sales manager needs to forecast demand for the next
period.
Production Planning Based on the forecasted sales unit for the next period, demand planning is transferred to production
planning. The planner then runs the materials requirements plan (MRP), which automatically generates the
raw materials purchase requisitions.
Purchase Order When a purchase requisition is received, the purchasing manager contacts the suppliers of the products
required. The purchasing manager chooses the vendor who offers the best price. He can either buy on the
spot or from a contract previously negotiated. After assigning the chosen vendor to the purchase requisition,
a formal purchase order is created.
Goods Receipts When the goods are received, the receiving clerk checks that the goods delivered correspond to the purchase
order. The invoice sent with the product is forwarded to accounting and posted by an accounting clerk.
Outgoing Payment Since the goods are payable upon reception, the accounting clerk carries out the transaction required to pay
the vendor. A cheque for the amount owing is issued and sent to the vendor.
Transfer Material The goods received are moved from the receiving dock to the raw materials’ storage shelves. Confi rmation of
this transfer is recorded in the system.
Production Order Once all the inputs required for production are available, a production order is created.
Transfer Material The raw materials required are then transferred from the storage to the production site. Confi rmation of this
transfer is also recorded in the system.
Finished Product
Transfer
Once manufacturing is completed, the fi nished products are transferred from the production site to the
warehouse. This transfer is again confi rmed in the system.

3Copyright © 2006, Pierre-Majorique LÉGER, Jacques ROBERT, Gilbert BABIN and Robert PELLERIN, HEC Montréal. All rights reserved for all countries.
ERP Simulation Game with mySAP ERP
Fortunately for your management team, your sales representatives will take care of receiving and managing sale orders, managing the
shipping of fi nished products to the stores, and invoicing and receiving payment from clients. More precisely, they are responsible of
the following processes:
Sales Order Regularly, retailers ask the manufacturers for a quotation. The retailer sends the order to the manufacturer. The sales
representative records this order.
Shipping The fi nished products are then shipped to the customers. In addition to entering a shipping slip, the clerk must also
adjust the inventory of fi nished products (post goods issue).
Invoicing Accounting then sends an invoice to the customer.
Incoming
Payment
Upon reception of payment, the accounting clerk clears the customer account and records the deposit of the
payment.
Finally, there is a list of managerial and strategic activities that you will have to undertake. The strategic decisions involved price fi xing,
allocating advertising expenditures, and choosing the recipes for your product. You will also have to deal with your banker in order to
secure a credit line and issue quarterly fi nancial reports. This is hard and challenging work but this is why you accepted the job.
1.1.3 The ERP system
Considering all your responsibilities, your team will be kept pretty busy. Fortunately, the company has acquired a new ERP system:
mySAP ERP. Presumably, none of you has any practical experience with my SAP ERP or another ERP system, but you are entrepreneurial
and resourceful so you are looking to fully exploit the possibilities of the ERP system. You will quickly have to:
Become familiar with the enterprise resource planning (ERP) software.
Develop a practical understanding of the main concepts underlying an ERP software, and
Identify the benefi ts of intra-company integration.
An ERP software is an integrated information system that manages enterprise data, helps integrate business processes and provides data
for business intelligence. One of your fi rst tasks is to parameterize the system by entering what is called the master data (see chapter 2).
Next, you will have to learn how to perform the various operational tasks in order to plan production, order raw material, produce, insert
price lists and advertising budget, etc. (see chapter 3)
•
•
•

4Copyright © 2006, Pierre-Majorique LÉGER, Jacques ROBERT, Gilbert BABIN and Robert PELLERIN, HEC Montréal. All rights reserved for all countries.
ERP Simulation Game with mySAP ERP
1.1.4 Physical layout and logistics
On your fi rst day at your new job, the boss’s secretary, Ms. Christie, kindly proposes a visit of the factory. The main entrance leads to the
reception and to the offi ces of the executive team, which in turn, leads you to a large shop fl oor.
As you enter the shop fl oor, you begin to get a better understanding of your new business. Mr. Jack comes to greet you and begins to
explain how the machines work. You listen carefully. On the shop fl oor the production machines are lined up. On the right of the shop fl oor,
a door leads to the raw material warehouse. About twice a day, the raw materials are distributed in large receptacles. The raw materials
are then mixed by a calibrated machine that processes the programmed recipe. The machine can be quickly stopped and recalibrated
in order to produce a new recipe. Another machine inserts the plastic bags into the appropriate boxes. Finally, a third machine puts the
mixtures into the boxes and seals the plastic bags and boxes. The fi nished products are then bundled into large delivery boxes. Each
delivery box is identifi ed with the product name and stored in the fi nished product warehouse which can be accessed at the left of the
shop. By the shop fl oor, lie more offi ces. These offi ces belong to the salespeople, who are in charge of receiving the orders.
Further in the back, you visit the two warehouses. The one at the right is the raw material warehouse. The delivery truck stops at the
reception dock located at the back of the factory, where they unload the raw materials. The warehouse is actually quite large and
there is no major storage space problem. On the other side, you access the fi nished product warehouse. As the products are being
manufactured, they are stored in this warehouse. There are six different sections, one for each product in the company’s production line.
When an order has been sent by a client, the salespeople prepare a shipment order and a delivery truck comes to the expedition dock
to load the fi nished product boxes.
“Clearly,” Mr. Jack says, “you do not want to have a delivery truck come in when there is no product in stock, so as a rule we never produce
a shipment order if the desired product is out of stock. It happens from time to time. When it does we lose a sale. Once, an employee had
forgotten to put the fi nished products in the fi nished product warehouse and we lost a lot of money. The boss was really not happy.”
Your visit ends with the docks. The raw material comes in large batches measured in kilos. The delivery cost of cereals (wheat and oats) is
150 euros per trip. Usually, you are told, each delivery is relatively large, anywhere from 500 to 750 kilos. The delivery cost of dried fruits
(raisins, blueberries, strawberries and nuts) is 80 euros per delivery. A typical delivery is 5 to 15 bags. Unfortunately, delivery of each raw
material is done separately.

5Copyright © 2006, Pierre-Majorique LÉGER, Jacques ROBERT, Gilbert BABIN and Robert PELLERIN, HEC Montréal. All rights reserved for all countries.
ERP Simulation Game with mySAP ERP
1.2 Description of the marketplace
1.2.1 Supply of raw materials and inputs
In order to produce a box of cereals, one can use up to six different ingredients: wheat, oats, nuts, raisins, strawberries and blueberries.
The compositions of the cereals are not predetermined; therefore each fi rm must select the composition of each of its products.
It is custom in the muesli industry to classify muesli cereal into six different categories depending on the composition of the product:
original, raisins, nuts, blueberries, strawberries and mixed fruits. Each of these categories corresponds to a well-regulated label since
consumers are looking for products associated with one of these appellations or labels. The regulation requires that a product referred
to as “Blueberry Müesli” contains only blueberries, wheat and oats with a minimum of 20% for each. The same applies for Nut, Strawberry,
and Raisin Müesli appellations. Product labelled as “Original recipe” must contain only oats and wheat with a minimum of 20% wheat
and 30% oats. Products labelled “mixed fruits” must contain all six ingredients with a total of at least 30% non-cereal ingredients. The
following table summarizes the labelling regulations.
Table 1.1 : Muesli Label Regulation
Ingredients
Labels Wheat Oats Blueberries Strawberries Raisins Nuts
Original Min 20% - Max 70% Min 30% - Max 80% No No No No
Blueberries Min 20% Min 20% Min 20% No No No
Strawberries Min 20% Min 20% No Min 20% No No
Raisins Min 20% Min 20% No No Min 20% No
Nuts Min 20% Min 20% No No No Min 20%
Mixed fruits Min 20% Min 20% Min 30%
Boxes come ine two sizes: 500 gr. or 1 kg boxes. Some distribution channels will sell only small boxes; others, only the larger boxes (see
the retail section). Packaging is comprised of two inputs: plastic bags and cardboard boxes.
All the ingredients going into the production of muesli cereals are produced within highly competitive markets. Wheat, oats, raisins,
strawberries, blueberries and nuts are all commodities whose prices are determined by the Global Commodities Market. Each individual
fi rm in the local muesli industry is too small to have any impact on the commodity market prices. Distribution of food products is
provided by a single distribution fi rm: FoodBrokers Inc.

6Copyright © 2006, Pierre-Majorique LÉGER, Jacques ROBERT, Gilbert BABIN and Robert PELLERIN, HEC Montréal. All rights reserved for all countries.
ERP Simulation Game with mySAP ERP
Blueberries and strawberries are typically the more costly inputs while wheat and oats are the cheapest. The production variable cost
includes the cost of the raw materials, and the cost of the plastic bag and cardboard box. Raisins, blueberries and strawberries are
typically the more costly inputs while wheat and oats are cheapest. In 2003, a study performed by HEC Montréal calculated the average
cost of the raw materials included in dry muesli cereals.
Table 1.2: Input Cost 2003 (at low seasonal price)
Cost of inputs 2003 2004
Wheat 1.82 euros/kg 2.01 euros/kg
Oats 1.66 euros/kg 1.69 euros/kg
Raisins 5.18 euros/kg 3.28 euros/kg
Strawberries 6.62 euros/kg 7.02 euros/kg
Blueberries 8.52 euros/kg 8.32 euros/kg
Nuts 3.91 euros/kg 7.91 euros /kg
Packaging 0.5kg 0.80 euro 0.82 euro
Packaging 1kg 1.10 euros 1.19 euros
The study has shown that the cost of raw materials, in particular, strawberries and blueberries was seasonally determined. The prices
during the off season periods may be more than twice than during the harvest season. In 2004, the price of raisins was at an all time low
due to a price war between producing countries. In 2004, the price of nuts sharply increased because of the coup d’état and subsequent
civil war in Demientia, the world’s major producer of nuts. The price was expected to increase substantially in the future.
The next table presents some of characteristics of the commodity markets. Dates where the seasonal prices are at their highest and at
their lowest are also listed.

7Copyright © 2006, Pierre-Majorique LÉGER, Jacques ROBERT, Gilbert BABIN and Robert PELLERIN, HEC Montréal. All rights reserved for all countries.
ERP Simulation Game with mySAP ERP
Table 1.3: Commodity Markets
Commodity Description of the market Dates of high prices Dates of low prices
Wheat Heavily traded market with low
volatility in the spot price.
Quarter 1: Day 10 to 20 Quarter 3: Day 4 to 55
Oats Large market with small volatility
in the spot price.
Quarter 2: Day 15 to 25 Quarter 4: Day 10 to 20
Nuts Volatile spot prices cause by
international sourcing risk.
Quarter 1: Day 1 to 25 Quarter 3: Day 25 to 35
Strawberries Seasonal market Quarter 1: Day 30 to 40 Quarter 3: Day 1 to 10
Blueberries Seasonal market Quarter 2: Day 25 to 35 Quarter 3: Day 25 to 35
Raisins Market control by the Dried
Raisins Cartel (DRC), but in 2003
the Cartel had great diffi culty in
controlling its members.
Quarter 1: Day 25 to 35 Quarter 3: Day 45 to 55
The plastic bags and the cardboard boxes used in the packaging are produced mainly by specialized printing companies. The companies
purchase the boxes from the cardboard producers and then print the brand logos according to specifi cations. The plastic bags are typically
sold by the same companies. There are a few companies in the local market capable and so the market remains quite competitive. The
main company that have been supplying your fi rm is Continental Printing Co.
1.2.2 Retail
There are three distribution channels for muesli cereal in the local market: the convenient stores, the traditional grocery stores and the
hypermarkets (large discount outlets).
Grocery stores
The grocery store is still the main distribution channel for the muesli industry. In 2003, 46.6% of total sales were through the traditional
grocery stores. Grocery stores offer their customers more variety than the other types of stores. A typical store would carry 4 or 5
different brands of muesli on their shelves and grocery store would sell both small and large boxes. In 2003, there were 58 grocery stores

8Copyright © 2006, Pierre-Majorique LÉGER, Jacques ROBERT, Gilbert BABIN and Robert PELLERIN, HEC Montréal. All rights reserved for all countries.
ERP Simulation Game with mySAP ERP
in the local market.
Independent grocers
The independent grocers or convenient stores are small proximity stores. They sell a small variety of products: beverage, beer, dairy
product, candies and chips, newspapers and magazines, and some everyday non-perishable food products including muesli cereals.
Convenient stores will only sell 500gr boxes. Their consumers are less sensitive to prices, but more sensitive to brand names and
advertising. Convenient stores will typically order in small quantities and will stock the shelves only one or two brands. In 2003, the
estimated market shared served by the convenience stores was 22%. Prices are on average 10% to 15% higher in the convenient stores
than in traditional grocery stores. In 2003, there were 122 convenience stores in the local market.
Hypermarkets
The large discount stores or hypermarkets are a growing phenomenon. They not only sell food, they sell books, CDs, clothing, and
electronic appliances. These stores have managed to attract numbers of consumers looking for cheaper prices. In 2003, 28.3% of sales
were at hypermarkets, a major increase from the previous decade. Hypermarkets will only sell the large format and will offer a more
limited variety than the grocery stores. Only 1 kilo boxes are sold at the outlets. Many studies have shown that outlet consumers are
highly sensitive to price while less sensitive to advertising and branding. Typically, the products are sold at prices 5% to 10% lower than
in traditional grocery stores. In 2003, there were 12 outlets in the local market.
9Copyright © 2006, Pierre-Majorique LÉGER, Jacques ROBERT, Gilbert BABIN and Robert PELLERIN, HEC Montréal. All rights reserved for all countries.
ERP Simulation Game with mySAP ERP
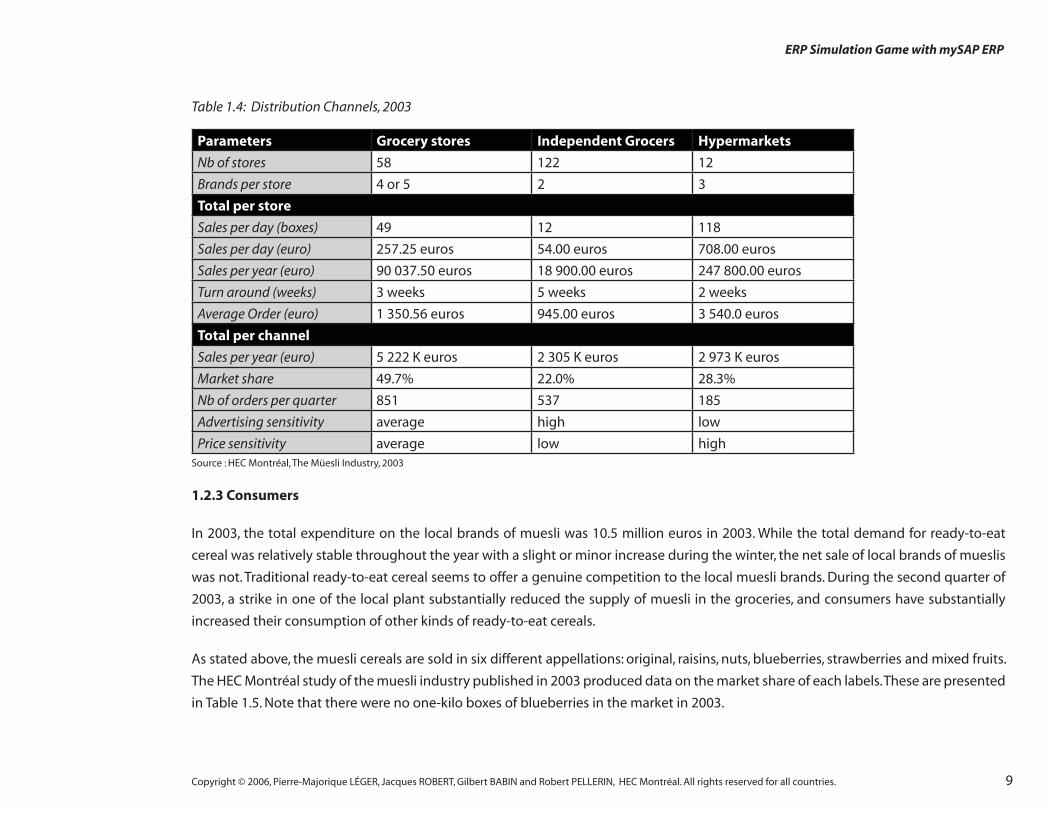
Table 1.4: Distribution Channels, 2003
Parameters Grocery stores Independent Grocers Hypermarkets
Nb of stores 58 122 12
Brands per store 4 or 5 2 3
Total per store
Sales per day (boxes) 49 12 118
Sales per day (euro) 257.25 euros 54.00 euros 708.00 euros
Sales per year (euro) 90 037.50 euros 18 900.00 euros 247 800.00 euros
Turn around (weeks) 3 weeks 5 weeks 2 weeks
Average Order (euro) 1 350.56 euros 945.00 euros 3 540.0 euros
Total per channel
Sales per year (euro) 5 222 K euros 2 305 K euros 2 973 K euros
Market share 49.7% 22.0% 28.3%
Nb of orders per quarter 851 537 185
Advertising sensitivity average high low
Price sensitivity average low highSource : HEC Montréal, The Müesli Industry, 2003
1.2.3 Consumers
In 2003, the total expenditure on the local brands of muesli was 10.5 million euros in 2003. While the total demand for ready-to-eat
cereal was relatively stable throughout the year with a slight or minor increase during the winter, the net sale of local brands of mueslis
was not. Traditional ready-to-eat cereal seems to offer a genuine competition to the local muesli brands. During the second quarter of
2003, a strike in one of the local plant substantially reduced the supply of muesli in the groceries, and consumers have substantially
increased their consumption of other kinds of ready-to-eat cereals.
As stated above, the muesli cereals are sold in six different appellations: original, raisins, nuts, blueberries, strawberries and mixed fruits.
The HEC Montréal study of the muesli industry published in 2003 produced data on the market share of each labels. These are presented
in Table 1.5. Note that there were no one-kilo boxes of blueberries in the market in 2003.

10Copyright © 2006, Pierre-Majorique LÉGER, Jacques ROBERT, Gilbert BABIN and Robert PELLERIN, HEC Montréal. All rights reserved for all countries.
ERP Simulation Game with mySAP ERP
Table 1.5: Statistics on sales per label (2003)
Labels Label repartition
500g
Label repartition
1Kg
Original 8,4% 28,9%
Nuts 24,0% 23,9%
Strawberries 16,0% 12,8%
Blueberries 9.4% -
Raisins 18,8% 31.4%
Mixed Fruit 23.3% 2.8%
In Table 1.6, the average price for each label in each distribution channel and size are presented. Not surprisingly, consumers looking for
the high-end labels – blueberry, strawberry, raisin or mixed fruits – are willing to pay more for the cereal. Note that these numbers have
changed in the past and more up-to-date studies may be required to better assess the market for mueslis.
Table 1.6: Statistics on price per label, format and channel, 2003
Labels Hypermarkets Grocery stores Average 1kg Grocery stores I n d e p e n d e n t
Grocers
Average 500gr
Blueberries - - - 3.77 euros 4.05 euros 3.88 euros
Mixed Fruit 4.97 euros 5.23 euros 5.13 euros 3.24 euros 3.49 euros 3.35 euros
Nuts 5.45 euros 5.83 euros 5.62 euros 3.48 euros 3.79 euros 3.63 euros
Original 3.85 euros 4.05 euros 3.97 euros 2.73 euros 3.03 euros 2.88 euros
Raisins 4.30 euros 4.43 euros 4.37 euros 2.95 euros 3.25 euros 3.07 euros
Strawberries 4.51 euros 4.71 euros 4.59 euros 3.36 euros 3.67 euros 3.49 euros
Average 4.47 euros 4.58 euros 4.53 euros 3.25 euros 3.53 euros 3.37 euros
1.2.4 Banks
It may not come as a surprise to you but your company needs money in order to make money. You have to stock raw material and
produce fi nished goods ahead of schedule. In order to pay for inputs and production you will need liquid assets. Your company has had a
good relationship with the First Regional National Bank. The Bank currently offers you a good credit rate and extends a suffi ciently large
credit line. After each quarter, your company will have to produce a full fi nancial statement to your banker.
11Copyright © 2006, Pierre-Majorique LÉGER, Jacques ROBERT, Gilbert BABIN and Robert PELLERIN, HEC Montréal. All rights reserved for all countries.
ERP Simulation Game with mySAP ERP
Your banker, a smart but rigid fellow named Gaston, does not like amateurs and cowboys. Your banker will extend you favourable credit
conditions only if your company keeps reimbursing its debt on time and with interest. He does not like companies that take too much
risk and have excess unsold merchandise. He dislikes managers that fail to pay bills on time – to their bank or suppliers. But most of all,
he dislikes managers that do not respect the law or fail to respect elementary ethical rules. One of the most fundamental rules that he
applies scrupulously is that his clients must produce accurate quarterly fi nancial reports. Failure to produce these reports or, worse, to
producing inaccurate reports can have major consequences. He has not hesitated in the past to reduce credit ratings whenever he felt
necessary, refuse to increase credit lines or simply cancel the one you already have.
As your boss often says: “I have worked hard to build my company’s reputation, do not damage it by bad management”.
HERE IS A TIP: Just in case you did not get the message already: produce your fi nancial reports accurately and on time.
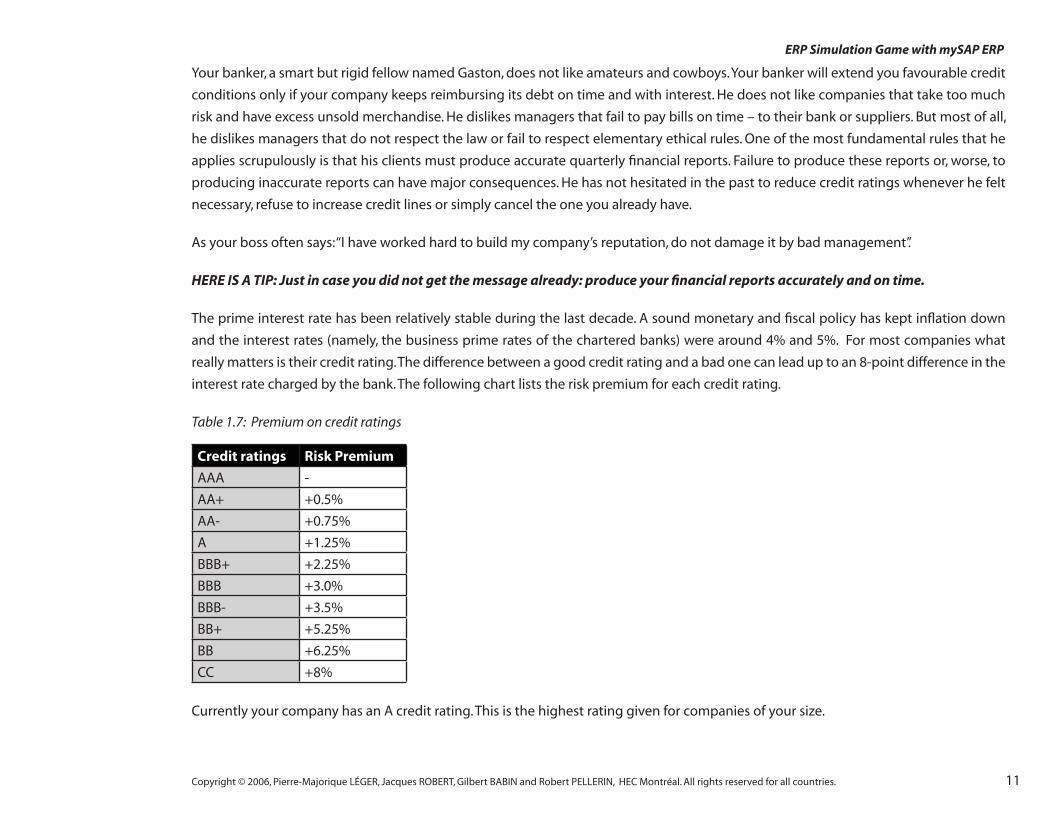
The prime interest rate has been relatively stable during the last decade. A sound monetary and fi scal policy has kept infl ation down
and the interest rates (namely, the business prime rates of the chartered banks) were around 4% and 5%. For most companies what
really matters is their credit rating. The difference between a good credit rating and a bad one can lead up to an 8-point difference in the
interest rate charged by the bank. The following chart lists the risk premium for each credit rating.
Table 1.7: Premium on credit ratings
Credit ratings Risk Premium
AAA -
AA+ +0.5%
AA- +0.75%
A +1.25%
BBB+ +2.25%
BBB +3.0%
BBB- +3.5%
BB+ +5.25%
BB +6.25%
CC +8%
Currently your company has an A credit rating. This is the highest rating given for companies of your size.

12Copyright © 2006, Pierre-Majorique LÉGER, Jacques ROBERT, Gilbert BABIN and Robert PELLERIN, HEC Montréal. All rights reserved for all countries.
ERP Simulation Game with mySAP ERP
1.3 Decision area
1.3.1 Products and recipes
In the HEC Montréal Simulation game, fi rms can produce up to six different brands. For each of these products, the fi rm must specify its
composition and the size of the box.
Each team must fi nd, according to its own strategy, the recipes that it wishes to produce and market. One of the strategic objectives is to
try to fi nd niches, i.e. recipes that are unique in the market and which are desired by a suffi ciently large share of consumers. One other
objective is to target appropriately the various distribution channels. One must recall that small boxes are only ordered by convenient
stores and groceries, large boxes are sold only to hypermarkets and groceries. Also, try to produce lower cost recipes for the more price
sensitive markets.
HERE IS A TIP: The market for mueslis is relatively segmented. Consumers have different preferences about mueslis and use different
suppliers. The key to success for fi rms competing in the market is to fi nd the right niches. If you are the only fi rm serving a particular
niche (say, small boxes of mixed fruit in grocery stores) you would be able to sell your product to this segment without fearing
competition form alternative local brands.
While a fi rm may choose to change the recipe of one of its products, it cannot do so when there are still units of that brand in stock. In
order to introduce a “new recipe”, one must fi rst clear its inventories for that product. The retailers use the description of your product in
order to make their purchase decision, if you advertise one recipe but deliver instead some old boxes based on another recipe not only
is it unethical but also illegal. If your company ever does so, you will be sued and it will damage seriously your reputation.
HERE IS A TIP: Because a fi rm cannot change the recipe of one of its products while there are still some units of stock, we recommend
that teams do not actively produce and market all six different brands at the beginning of the game but rather produce four or
fi ve different brands early in the game. This will allow teams to introduce easily one or more new recipes in the market during the
game.
Technically, a recipe must be specifi ed in the bill of materials in your ERP system. Your must enter into the information system the
percentage of each ingredient: wheat, oats, strawberries, blueberries, raisins and nuts. Percentages are measured in weight. It is very
important that the sum of percentages total 100%, also the percentage must respect the labelling guidelines presented in Table 4. The
food and drug administration is a serious organisation and it monitors product labelling carefully. Fines for violation of the labelling rule
are high. As your boss often says: “If you cannot add a few numbers and adhere to simple arithmetical rules, you should not be here.”

13Copyright © 2006, Pierre-Majorique LÉGER, Jacques ROBERT, Gilbert BABIN and Robert PELLERIN, HEC Montréal. All rights reserved for all countries.
ERP Simulation Game with mySAP ERP
1.3.2 Forecasting, procurement and production
The next decision your executive team will have to make is how much and when to produce.
A manufacturer can only sell products that are held in inventory. Therefore, boxes of cereal have to be manufactured according to a
make-to-stock manufacturing strategy. Your executive team will need to forecast the number of products the fi rm intends to sell in
the next period for each of its brands. Production is done in batches but before producing you need to purchase the necessary inputs.
Recall that your executive team has many operational responsibilities: you must issue product requests and purchase orders for raw
materials, receive and produce the receipts for raw materials, send reception invoices and pay the suppliers, transfer the raw material to
the plant warehouse, and fi nally issue the product order. Further, purchasing raw material requires liquidity. If you choose to produce a
large number of boxes in advance, you will have to borrow the necessary funds from the bank on which you will have to pay interest.
All this requires careful planning.
As mentioned previously, the price of some raw materials (blueberries and strawberries) is highly seasonal. For those products it is
preferable to buy the raw materials when the price is low and stock for future production. Long term planning becomes even more
important in these cases.
HERE IS A TIP: Ideally you would want to order raw material and produce in small batches but do so more frequently. This allows
your company to be more responsive to the market and adjust quickly.
1.3.3 Pricing
Whenever it desires, a fi rm may choose to change it prices. Price selection is a key element of ones strategy. If one charges too much,
demand will be too low; if one charges too little, the profi t will not be enough to pay for the fi xed expenditures. Notice that the pricing
decisions need not be the same for all distribution channels. Because, convenient stores customers are less price sensitive, it is a smart
to charge these stores a higher price to these stores instead of than traditional grocery stores. Similarly, calculating the optimal price for
each product and distribution channel is a complex task. Business acumen is required to make the correct pricing decisions. Remember
that muesli consumption accounts for a small proportion of ready-to-eat cereal consumption. Consumers have other options. They can
buy something else if mueslis are out of their price range. Remember also that you have overheads, advertising expenditures, interest
payments and payments for the raw materials; you must price your product correctly so that you do not lose money. As your boss often
says, “We do not run a charity group down here”. You must make a profi t.
In April 2004, a business conference was organized by the Muesli industry. According to one of the panellists, Ms. Scarlet Red, the best
practice consists of charging a mark up of about 1.00 euro to 1.50 euros per box. Another industry expert, Professor Plum disagrees. It

14Copyright © 2006, Pierre-Majorique LÉGER, Jacques ROBERT, Gilbert BABIN and Robert PELLERIN, HEC Montréal. All rights reserved for all countries.
ERP Simulation Game with mySAP ERP
is silly, he argues, to reduce pricing decisions based on one simple rule. Optimal pricing depends on many things: (i) the prices tendered
by competitors; (ii) the size and cost of the product; (iii) the distribution channel; and (iv) ultimately the strategy of the fi rms including
its advertising strategy.
1.3.4 Advertising
In each quarter, you must decide on how much to invest in marketing. You must determine a marketing budget for the current quarter
for each of your products (up to 6) and each of the distribution channels (up to 3). You will be able to increase your marketing budget
during a quarter. The money invested in marketing during a quarter will be spent equally among the remaining days of the quarter.
You will not able to be able to decrease your marketing budget during a quarter as some of the sum invested might already have been
spent.
HERE IS A TIP: Advertising is good but not always necessary. Do not spend all your margins on advertising; you will end up losing
money.
In the Muesli industry, marketing is persuasive. It seeks to convince consumers that your product is the one they should prefer. Globally,
it is like a zero-sum game. If a fi rm increases advertising for one of its products it attracts consumers away from other products.
HERE IS A TIP: Try to avoid spending a lot of advertising money for two different products in the same distribution channels. One
euro spent on a product hurts the sale of the other and vice versa.

15Copyright © 2006, Pierre-Majorique LÉGER, Jacques ROBERT, Gilbert BABIN and Robert PELLERIN, HEC Montréal. All rights reserved for all countries.
ERP Simulation Game with mySAP ERP
CHAPTER 2 - SETTING UP THE SIMULATION COMPANIES
This chapter presents the required pre-confi guration every team needs to go through in preparation of the simulation game. Because
the teaching objective of this simulation is not to have the team confi gure the whole system in order to participate in the game, a
great deal of confi guration has already been done for you. Yet, some preparation has been intentionally left to the participants. The
participants will fi rst review how their company was modelled in the system using the different organizational elements available in
SAP. Then, each simulation company needs to create the master data that will be used in the game. Such a preparation should provide
the participants with a fi rst-hand contact of the system and help to appropriate the different building blocks of the information system
that support their company.
2.1 Organizational elements
The organizational elements represent the enterprise structure in the ERP system. They help to portray the specifi c organizational
structure of a business in the system. Each module of the ERP system has it own organizational elements. During the confi guration
phase of an ERP implementation, the company must be modeled into the system using the different accounting, logistics and human
resources organizational units.
The main purpose of organizational elements is to segment the transactional data that will be collected by the system. Some elements,
such as the company code, are required for legal fi nancial reporting as they are necessary to track of where revenues and costs are
incurred. Other elements will be used for internal corporate reporting and data segmentation.
It should be noted that these elements are logical, i.e. they can represent both physical and virtual concepts. For example, there may be
more than one storage location at a physical address to distinguish between stocks that require different valuation approaches. On the
other hand, stock in transit could be stored in a virtual storage location that would not have a physical address.
The following table presents the most important organizational elements available in SAP
16Copyright © 2006, Pierre-Majorique LÉGER, Jacques ROBERT, Gilbert BABIN and Robert PELLERIN, HEC Montréal. All rights reserved for all countries.
ERP Simulation Game with mySAP ERP
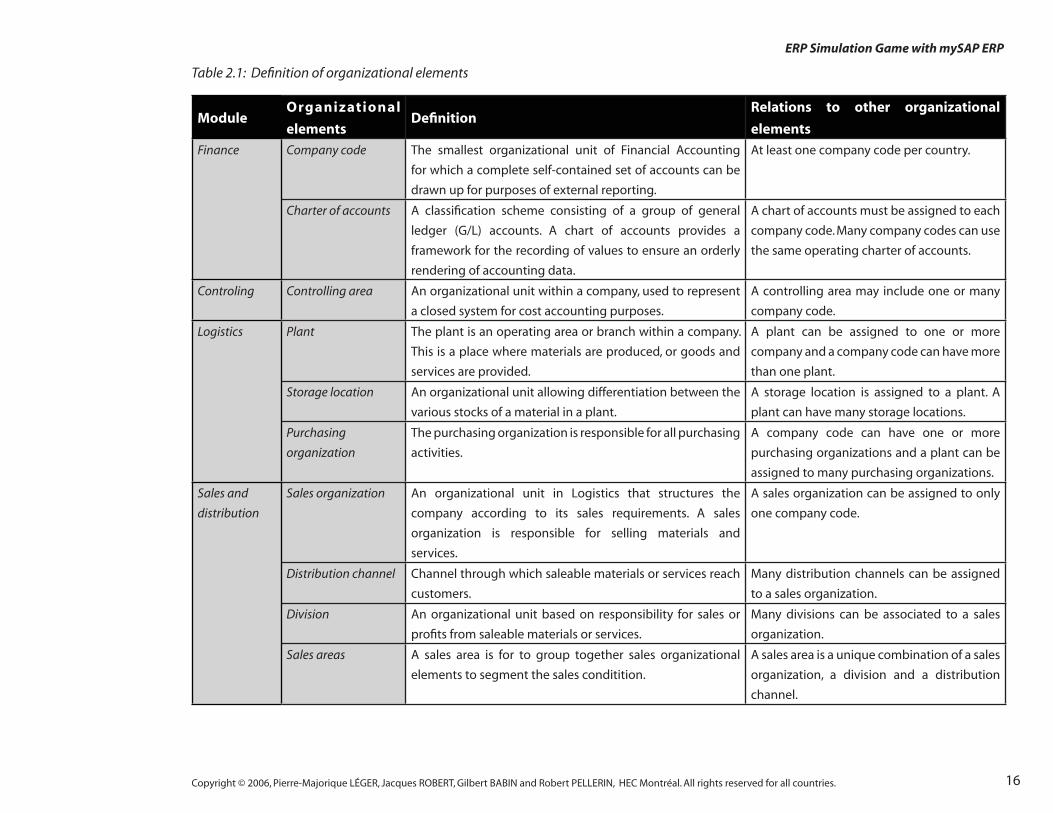
Table 2.1: Defi nition of organizational elements
ModuleOrganizational
elementsDefi nition
Relations to other organizational
elements
Finance Company code The smallest organizational unit of Financial Accounting
for which a complete self-contained set of accounts can be
drawn up for purposes of external reporting.
At least one company code per country.
Charter of accounts A classifi cation scheme consisting of a group of general
ledger (G/L) accounts. A chart of accounts provides a
framework for the recording of values to ensure an orderly
rendering of accounting data.
A chart of accounts must be assigned to each
company code. Many company codes can use
the same operating charter of accounts.
Controling Controlling area An organizational unit within a company, used to represent
a closed system for cost accounting purposes.
A controlling area may include one or many
company code.
Logistics Plant The plant is an operating area or branch within a company.
This is a place where materials are produced, or goods and
services are provided.
A plant can be assigned to one or more
company and a company code can have more
than one plant.
Storage location An organizational unit allowing differentiation between the
various stocks of a material in a plant.
A storage location is assigned to a plant. A
plant can have many storage locations.
Purchasing
organization
The purchasing organization is responsible for all purchasing
activities.
A company code can have one or more
purchasing organizations and a plant can be
assigned to many purchasing organizations.
Sales and
distribution
Sales organization An organizational unit in Logistics that structures the
company according to its sales requirements. A sales
organization is responsible for selling materials and
services.
A sales organization can be assigned to only
one company code.
Distribution channel Channel through which saleable materials or services reach
customers.
Many distribution channels can be assigned
to a sales organization.
Division An organizational unit based on responsibility for sales or
profi ts from saleable materials or services.
Many divisions can be associated to a sales
organization.
Sales areas A sales area is for to group together sales organizational
elements to segment the sales conditition.
A sales area is a unique combination of a sales
organization, a division and a distribution
channel.
17Copyright © 2006, Pierre-Majorique LÉGER, Jacques ROBERT, Gilbert BABIN and Robert PELLERIN, HEC Montréal. All rights reserved for all countries.
ERP Simulation Game with mySAP ERP
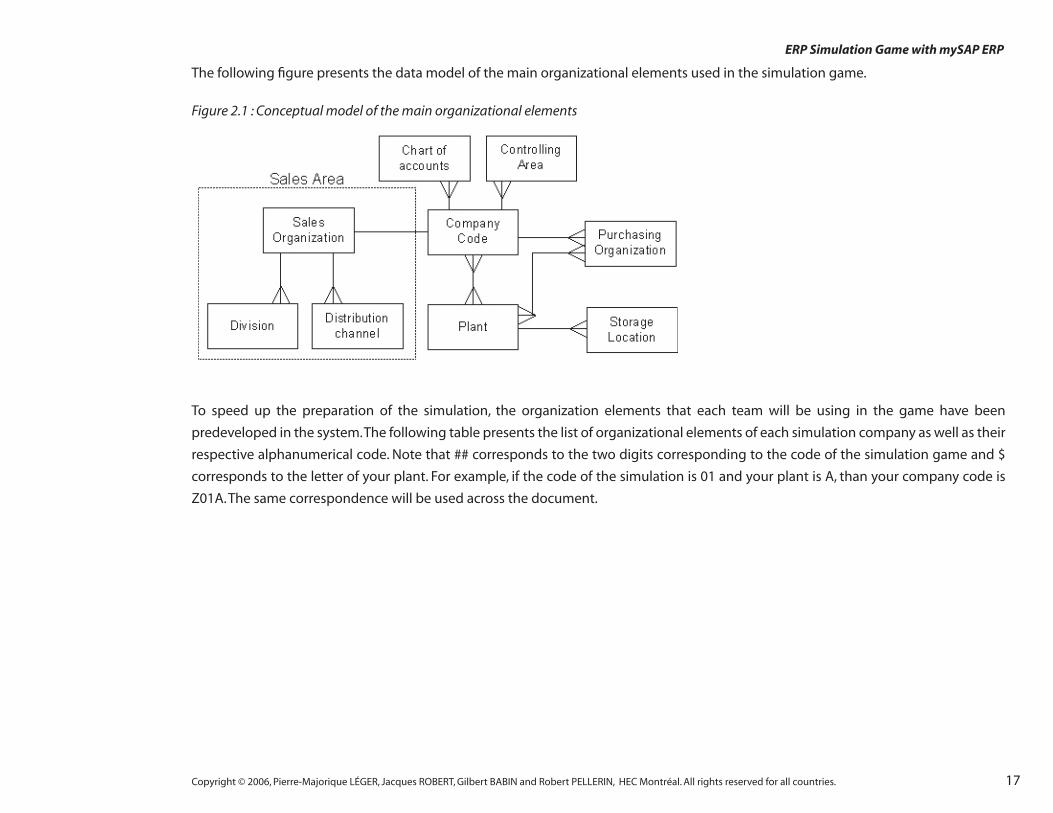
The following fi gure presents the data model of the main organizational elements used in the simulation game.
Figure 2.1 : Conceptual model of the main organizational elements
To speed up the preparation of the simulation, the organization elements that each team will be using in the game have been
predeveloped in the system. The following table presents the list of organizational elements of each simulation company as well as their
respective alphanumerical code. Note that ## corresponds to the two digits corresponding to the code of the simulation game and $
corresponds to the letter of your plant. For example, if the code of the simulation is 01 and your plant is A, than your company code is
Z01A. The same correspondence will be used across the document.
18Copyright © 2006, Pierre-Majorique LÉGER, Jacques ROBERT, Gilbert BABIN and Robert PELLERIN, HEC Montréal. All rights reserved for all countries.
ERP Simulation Game with mySAP ERP
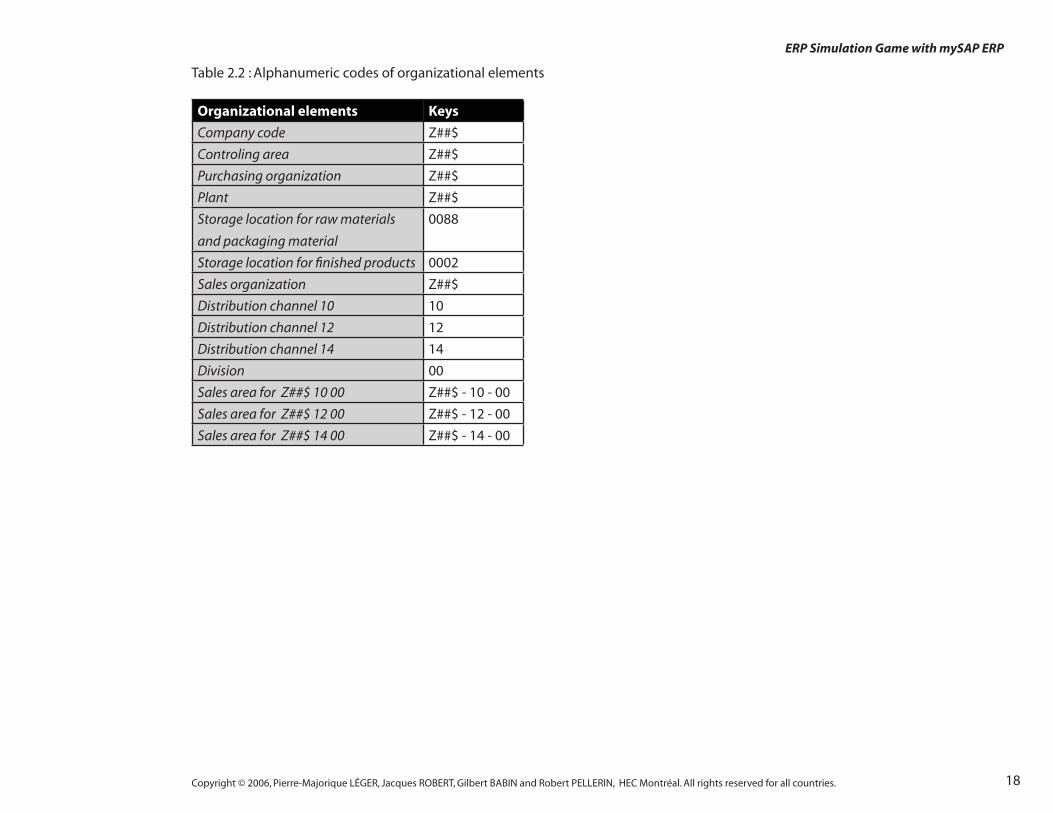
Table 2.2 : Alphanumeric codes of organizational elements
Organizational elements Keys
Company code Z##$
Controling area Z##$
Purchasing organization Z##$
Plant Z##$
Storage location for raw materials
and packaging material
0088
Storage location for fi nished products 0002
Sales organization Z##$
Distribution channel 10 10
Distribution channel 12 12
Distribution channel 14 14
Division 00
Sales area for Z##$ 10 00 Z##$ - 10 - 00
Sales area for Z##$ 12 00 Z##$ - 12 - 00
Sales area for Z##$ 14 00 Z##$ - 14 - 00

19Copyright © 2006, Pierre-Majorique LÉGER, Jacques ROBERT, Gilbert BABIN and Robert PELLERIN, HEC Montréal. All rights reserved for all countries.
ERP Simulation Game with mySAP ERP
The next fi gure presents the organizational structure that was confi gured in the information system of each company.
Figure 2.2 Organization structure of a typical muesli company
20Copyright © 2006, Pierre-Majorique LÉGER, Jacques ROBERT, Gilbert BABIN and Robert PELLERIN, HEC Montréal. All rights reserved for all countries.
ERP Simulation Game with mySAP ERP
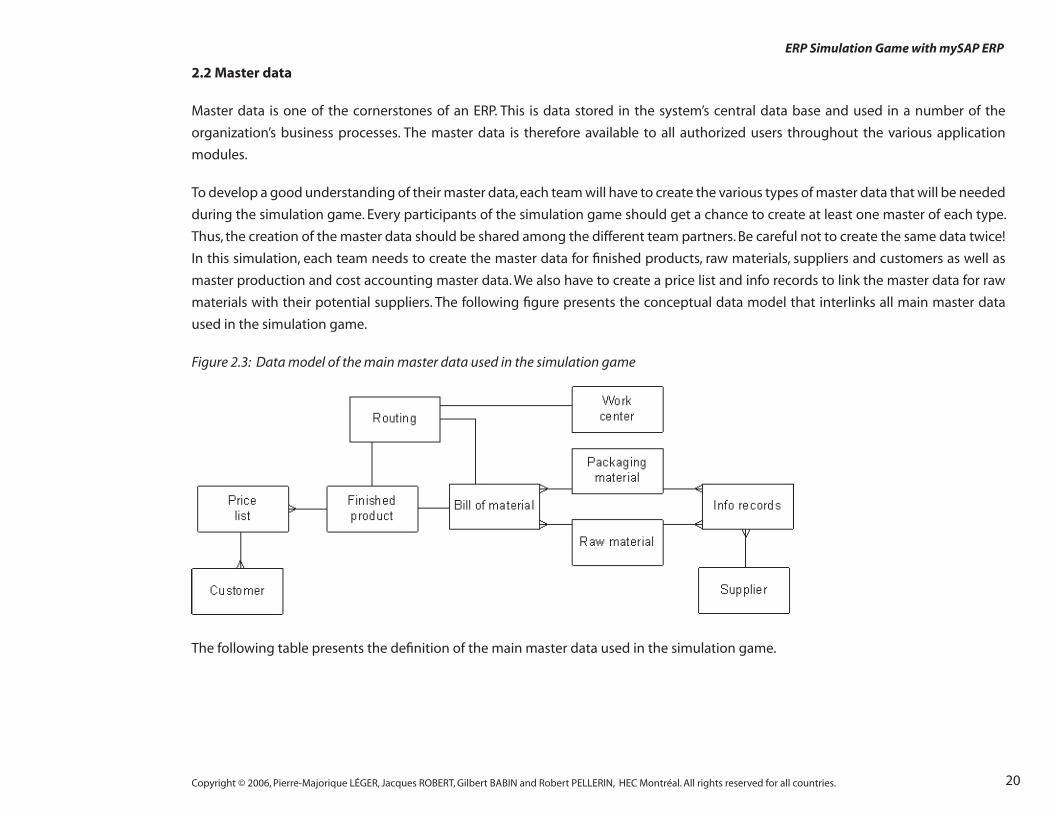
2.2 Master data
Master data is one of the cornerstones of an ERP. This is data stored in the system’s central data base and used in a number of the
organization’s business processes. The master data is therefore available to all authorized users throughout the various application
modules.
To develop a good understanding of their master data, each team will have to create the various types of master data that will be needed
during the simulation game. Every participants of the simulation game should get a chance to create at least one master of each type.
Thus, the creation of the master data should be shared among the different team partners. Be careful not to create the same data twice!
In this simulation, each team needs to create the master data for fi nished products, raw materials, suppliers and customers as well as
master production and cost accounting master data. We also have to create a price list and info records to link the master data for raw
materials with their potential suppliers. The following fi gure presents the conceptual data model that interlinks all main master data
used in the simulation game.
Figure 2.3: Data model of the main master data used in the simulation game
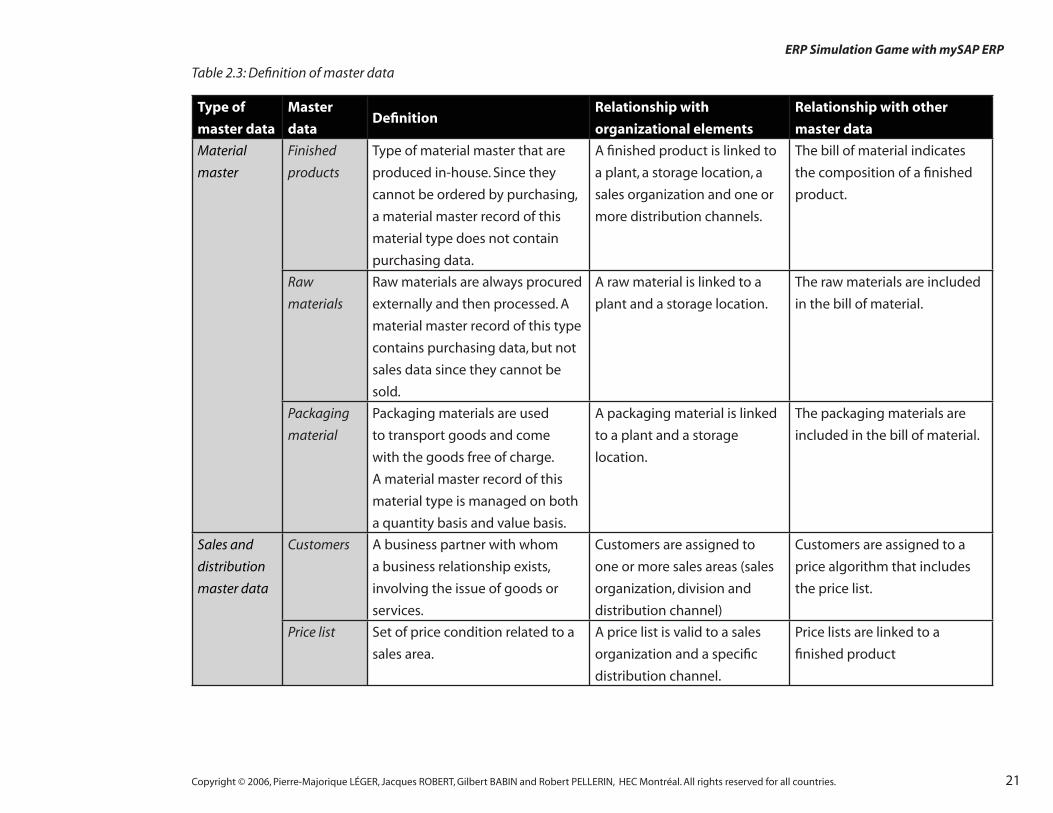
The following table presents the defi nition of the main master data used in the simulation game.
21Copyright © 2006, Pierre-Majorique LÉGER, Jacques ROBERT, Gilbert BABIN and Robert PELLERIN, HEC Montréal. All rights reserved for all countries.
ERP Simulation Game with mySAP ERP
Table 2.3: Defi nition of master data
Type of
master data
Master
dataDefi nition
Relationship with
organizational elements
Relationship with other
master data
Material
master
Finished
products
Type of material master that are
produced in-house. Since they
cannot be ordered by purchasing,
a material master record of this
material type does not contain
purchasing data.
A fi nished product is linked to
a plant, a storage location, a
sales organization and one or
more distribution channels.
The bill of material indicates
the composition of a fi nished
product.
Raw
materials
Raw materials are always procured
externally and then processed. A
material master record of this type
contains purchasing data, but not
sales data since they cannot be
sold.
A raw material is linked to a
plant and a storage location.
The raw materials are included
in the bill of material.
Packaging
material
Packaging materials are used
to transport goods and come
with the goods free of charge.
A material master record of this
material type is managed on both
a quantity basis and value basis.
A packaging material is linked
to a plant and a storage
location.
The packaging materials are
included in the bill of material.
Sales and
distribution
master data
Customers A business partner with whom
a business relationship exists,
involving the issue of goods or
services.
Customers are assigned to
one or more sales areas (sales
organization, division and
distribution channel)
Customers are assigned to a
price algorithm that includes
the price list.
Price list Set of price condition related to a
sales area.
A price list is valid to a sales
organization and a specifi c
distribution channel.
Price lists are linked to a
fi nished product

22Copyright © 2006, Pierre-Majorique LÉGER, Jacques ROBERT, Gilbert BABIN and Robert PELLERIN, HEC Montréal. All rights reserved for all countries.
ERP Simulation Game with mySAP ERP
Type of
master data
Master
dataDefi nition
Relationship with
organizational elements
Relationship with other
master data
Production
master data
Bill of
material
A complete, structured list of
the components that make up
an object. The list contains the
description, the quantity, and unit
of measure. The components are
known as BOM items.
The bill of material is a link to a
specifi c plant.
The bill of material linked
together the fi nished product
with the raw material and
packaging material required for
its production.
Work
centers
An organizational unit that defi nes
where and when an operation
must be performed. Work
centers can be machines, people,
production lines and groups of
craftsmen.
The work centers are located in
a specifi c plant.
Eatch routing is linked to one
work center.
Routings A routing type that defi nes one or
more sequences of operations for
the production of a material.
Routings are specifi c to a plant. Routing are related to fi nished
products, and work centers.
Purchasing
master data
Vendors A business partner from whom
materials or services can be
procured.
Vendors are attached to
a company code and a
purchasing organization.
Vendors are linked to their
respective raw and packaging
material through the info-
records.
Info-records The logical tie between a vendor
and its products.
Info records are valid for a
specifi c plant and purchasing
organization.
Info records create the links
between the vendors and each
of the material they provide.
Source list The source list records the
approved or blocked vendor for a
given material.
Source lists are specifi c to
a plant and a purchasing
organization.
Source lists tie together an
approved/blocked vendor to a
material. Info-records need to
be created beforehand.

23Copyright © 2006, Pierre-Majorique LÉGER, Jacques ROBERT, Gilbert BABIN and Robert PELLERIN, HEC Montréal. All rights reserved for all countries.
ERP Simulation Game with mySAP ERP
Type of
master data
Master
dataDefi nition
Relationship with
organizational elements
Relationship with other
master data
Financial
master data
Accounts A structure that records value
transactions within an accounting
unit. The account can refer to
an object to which the value
transactions are assigned.
Accounts are related to a
charter of accounts.
Account we linked to account
groups
Cost
controlling
master data
Profi ts
centers
An organizational unit in
accounting that refl ects a
management-oriented structure of
the organization for the purpose
of internal control.
Profi t centers are links to a
controlling area.
A profi t center may contain
many cost centers.
Cost centers An organizational unit within a
controlling area that represents
a defi ned location of cost
incurrence.
Cost centers are links to a
controlling area.
A cost center may be related to
one profi t center.
24Copyright © 2006, Pierre-Majorique LÉGER, Jacques ROBERT, Gilbert BABIN and Robert PELLERIN, HEC Montréal. All rights reserved for all countries.
ERP Simulation Game with mySAP ERP
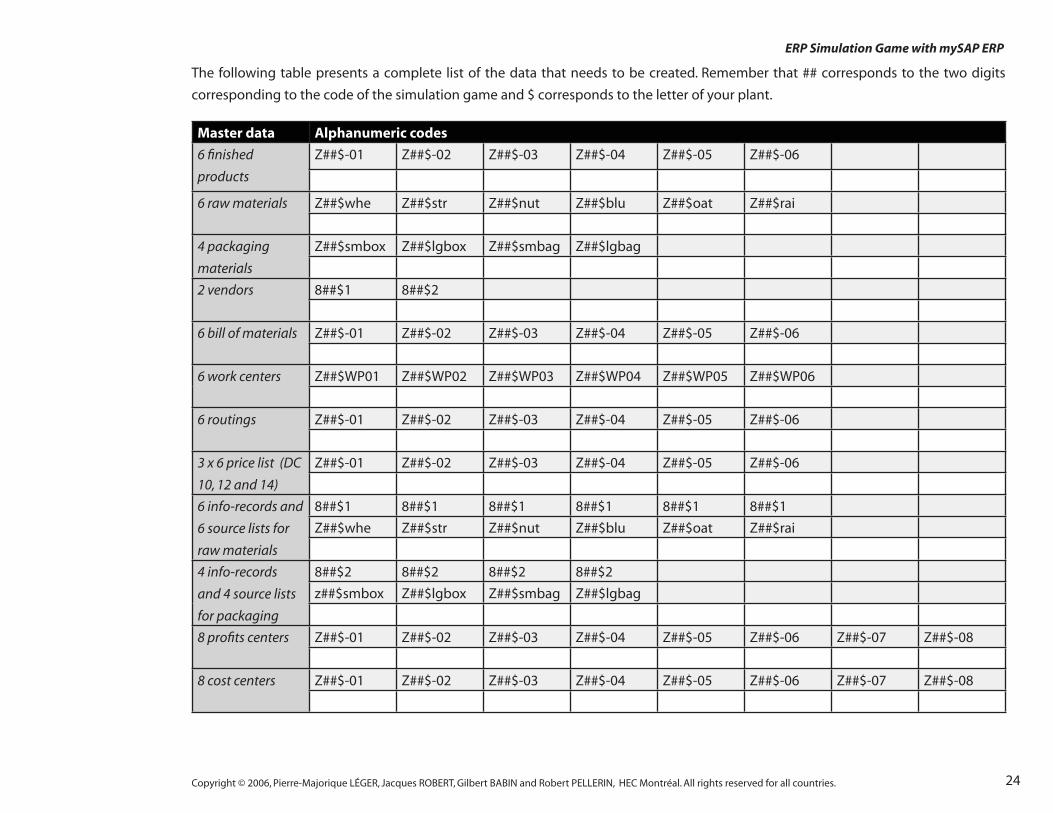
The following table presents a complete list of the data that needs to be created. Remember that ## corresponds to the two digits
corresponding to the code of the simulation game and $ corresponds to the letter of your plant.
Master data Alphanumeric codes
6 fi nished
products
Z##$-01 Z##$-02 Z##$-03 Z##$-04 Z##$-05 Z##$-06
6 raw materials Z##$whe Z##$str Z##$nut Z##$blu Z##$oat Z##$rai
4 packaging
materials
Z##$smbox Z##$lgbox Z##$smbag Z##$lgbag
2 vendors 8##$1 8##$2
6 bill of materials Z##$-01 Z##$-02 Z##$-03 Z##$-04 Z##$-05 Z##$-06
6 work centers Z##$WP01 Z##$WP02 Z##$WP03 Z##$WP04 Z##$WP05 Z##$WP06
6 routings Z##$-01 Z##$-02 Z##$-03 Z##$-04 Z##$-05 Z##$-06
3 x 6 price list (DC
10, 12 and 14)
Z##$-01 Z##$-02 Z##$-03 Z##$-04 Z##$-05 Z##$-06
6 info-records and
6 source lists for
raw materials
8##$1 8##$1 8##$1 8##$1 8##$1 8##$1
Z##$whe Z##$str Z##$nut Z##$blu Z##$oat Z##$rai
4 info-records
and 4 source lists
for packaging
8##$2 8##$2 8##$2 8##$2
z##$smbox Z##$lgbox Z##$smbag Z##$lgbag
8 profi ts centers Z##$-01 Z##$-02 Z##$-03 Z##$-04 Z##$-05 Z##$-06 Z##$-07 Z##$-08
8 cost centers Z##$-01 Z##$-02 Z##$-03 Z##$-04 Z##$-05 Z##$-06 Z##$-07 Z##$-08
25Copyright © 2006, Pierre-Majorique LÉGER, Jacques ROBERT, Gilbert BABIN and Robert PELLERIN, HEC Montréal. All rights reserved for all countries.
ERP Simulation Game with mySAP ERP
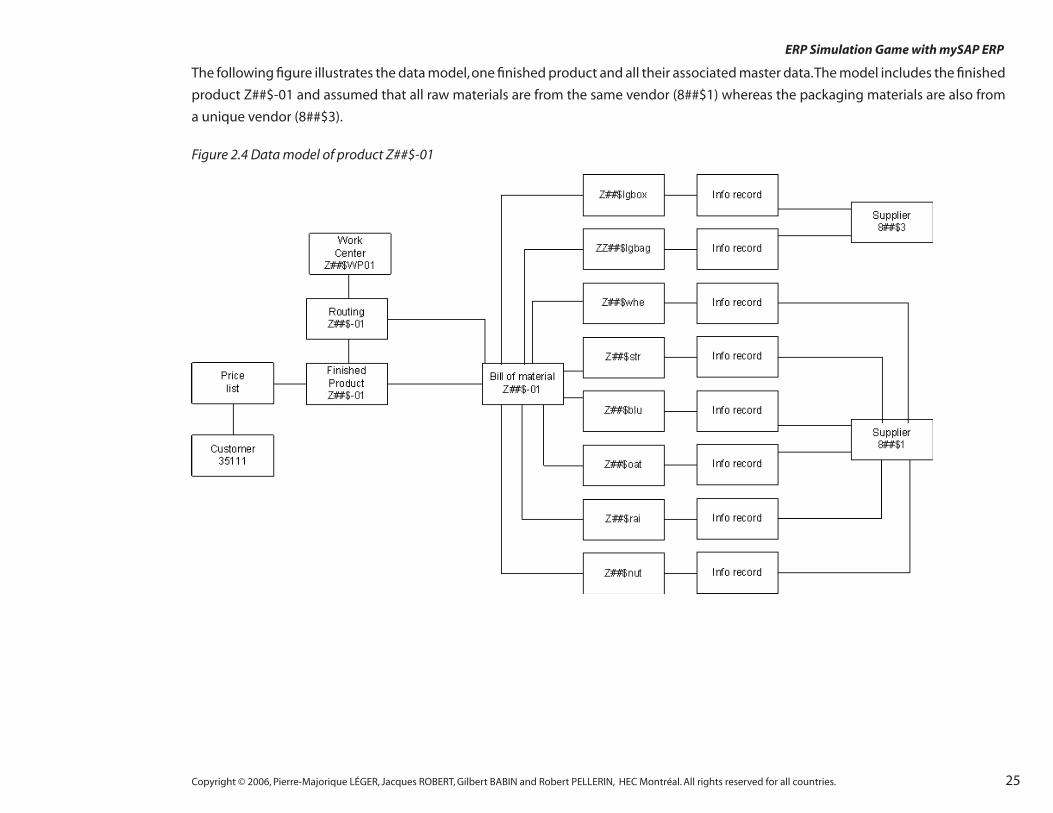
The following fi gure illustrates the data model, one fi nished product and all their associated master data. The model includes the fi nished
product Z##$-01 and assumed that all raw materials are from the same vendor (8##$1) whereas the packaging materials are also from
a unique vendor (8##$3).
Figure 2.4 Data model of product Z##$-01

26Copyright © 2006, Pierre-Majorique LÉGER, Jacques ROBERT, Gilbert BABIN and Robert PELLERIN, HEC Montréal. All rights reserved for all countries.
ERP Simulation Game with mySAP ERP
Before we start creating data in the system, it is recommended to set a default value for certain fi eld that would need to be entered over
and over again. To set a value to these fi eld, access the transaction SU03. ollowing program in the pull-down menu path: system/user
profi le/own data.
In the parameters tab, enter the following parameters ID and parameters value.
Fields Data to input
Parameter ID BUK VKO WRK EKO SPA FWS KPL SPR
Parameter value Z##$ 00 EUR INT EN
Click on to save.
2.1 Creating the material masters
The master record for the fi nished product is the most important master data in the system. This record is used by most of the R/3
modules. The centralization of all the information for each product on a single record prevents needless redundancies between different
departments. In a transaction, the system copies from the record only the information required for the current business document (for
example, the product description, weight, storage location, etc.). All the user has to enter is the information specifi c to each transaction
(i.e. the quantity ordered). In this simulation, the Material Master is used at nearly all stages of the business process. Two types of product
records must be created: one for fi nished products, and one for raw materials.
2.1.1. Finished products
Each fi rm has to defi ne its fi nished products. All teams need to create six fi nished products: Z##$-01, Z##$-02, Z##$-03, Z##$-04, Z##$-05
and Z##$-06, where ## corresponds to the two digits corresponding to the code of the simulation game and $ corresponds to the letter
of your plant.
The creating of the fi nished products requires specifying a set of parameters which indicate to SAP the business rules associated to this
master data. Based on the simulation requirements, here are the main parameters that are used in all your fi nished products:
Boxes of muesli cereal are retail products (Field Industry sector).
They are classifi ed in the system as food material (Field Material group). Material group is a grouping of materials and services
according to their characteristics.
Boxes are counted in pieces (Field Base Unit Measure) and are sold on pallets (Field Transport Group) and transported by a forklift
•
•
•
SU3
System / User profi le /Own data.
SU3
System / User profi le /Own data.
MMF1
Logistics / Materials Management / Material Master / Material / Create (Special) / Finished product
MMF1
Logistics / Materials Management / Material Master / Material / Create (Special) / Finished product

27Copyright © 2006, Pierre-Majorique LÉGER, Jacques ROBERT, Gilbert BABIN and Robert PELLERIN, HEC Montréal. All rights reserved for all countries.
ERP Simulation Game with mySAP ERP
(Field Loading Group).
These products are taxable (Field Tax Classifi cation) and are valued as fi nished products (Field Valuation Class) at the standard
price (Field Price control) of 3 euros (Field Standard Price).
The availability of this product must be checked daily (Field Availability Check).
The material is planned using an MRP run (Field MRP Type) in a make-to-stock production strategy (Field MRP Group). Plants
are using a lot-for-lot order quantity (Field Lot size), i.e. the system creates one large production lot from the independent
requirements. The MRP controller is the role of the person in charge of doing the planning run.
Because of the simulation constraints, in-house production is assumed to take 0 days (Field In-house production), and time
buffers are set to minimal delay (Field ShecdMargin Key).
Create the fi nished products
Each fi rm has to defi ne its fi nished products. All team need to defi ne 6 fi nished products.
On “Create Finished product (Initial Screen)”, enter the following information:
Fields Data to input
Material Z##$-%%
Industry sector Retail
where ## corresponds to the number of the simulation and $ corresponds to the name of your plant. For example, if the current simulation
is the fi rst, ## corresponds to 01. “$” corresponds to the letter of your plant (A to E). “%%” corresponds to the product number (01 to 06).
•
•
•
•

28Copyright © 2006, Pierre-Majorique LÉGER, Jacques ROBERT, Gilbert BABIN and Robert PELLERIN, HEC Montréal. All rights reserved for all countries.
ERP Simulation Game with mySAP ERP
Views Fields Data to input
Basic Data 1 Description Z##$-%%
Base Unit of Measure PC (Pieces(s))
Material Group Z##$
Gross weight 1
Net weight 1
Basic Data 2 You have no data to enter here. (Press “enter”.)
Sales: Sales Org. Data 1 Tax Classifi cation 1 (Full tax)
Sales: Sales Org. Data 2 You have no data to enter here. (Press “enter”.)
Sales: General / Plant Data Availability check: 01 (Daily requirements)
Transport group 0001 (On pallets)
Loading group 0002 (Forklift)
Foreign Trade: Export Data You have no data to enter here. (Press “enter”.)
MRP1 MRP group 0010 (change from default 31)
MRP Type PD (MRP)
MRP Controller 101
Lot Size EX (Lot-for-lot order quantity)
MRP2 In-house production 0 days ( You can ignore it by pressing “enter”)
SchedMargin key 001
Prod. stor. location 0002
MRP3 Strategy group 10 (Make-to-stock production)
MRP4 You have no data to enter here. (Press “enter”.)
Work Scheduling You have no data to enter here. (Press “enter”.)
General Plant Data / Storage 1 You have no data to enter here. (Press “enter”.)
General Plant Data / Storage 2 You have no data to enter here. (Press “enter”.)
Accounting 1 Valuation class 7920 (Finished product)
Price control S (Standard price)
Standard price 3 EUR
Accounting 2 You have no data to enter here. (Press “enter”.)
Costing 1 Profi t center Z##$-01
Step 1 : Click on “Select View(s)” and highlight the following views of the muesli data. Then click on “Continue (Enter)“
STEP 2 : In the “Organization levels”, enter the following information:
STEP
3 :
The
reco
rd c
on
tain
s a
seri
es o
f m
and
ato
ry d
ata
in t
he
vari
ou
s vi
ews
of “
Mat
eria
l
Mas
ter”.
Pre
ssin
g “e
nte
r” s
tart
s an
au
tom
atic
ch
eck
and
yo
u g
o o
n to
th
e n
ext
tab.
Sales Org. Z##$
Distribution channel 10
Plant Z##$
Storage location 0002

29Copyright © 2006, Pierre-Majorique LÉGER, Jacques ROBERT, Gilbert BABIN and Robert PELLERIN, HEC Montréal. All rights reserved for all countries.
ERP Simulation Game with mySAP ERP
Costing 2 You have no data to enter here. (Press “enter”.) Then, click “yes” to save the product.
Extend the fi nished products:
A message confi rms that the fi nished product was created in the system. However, the product has been only assigned to the distribution
channel 10. Because you will want the product to be available in the two other distribution channels, we need to extend the material
master to these other sales areas. By extending the master data, you will be able to reuse the information previously entered in other
segments of the organizational structure.
There are three distribution channels: 10 (Hypermarkets), 12 (Grocery chains) and 14 (independent grocers). Your materials were already
linked with the distribution channel 10. You have to extend your fi nished product with the distribution channel 12 and 14.
Fields Data to input
Material Z##$-%% (The material you want to extend)
Industry sector Retail
Click on “Select View(s) and highlight the same views as the fi rst time you create your material. Then click on “Continue (Enter)”.
In the “Organization levels”, enter the following information:
Fields Data to input
Plant Z##$
Storage location 0002
Sales Org. Z##$
Distribution channel 12
Click on “Continue (Enter)”.
A notice saying “The material already exists and will be extended “ appears.
Click on to save.
Repeat the same operations to link your material with the distibution channel 14.
Should you forget to input some data, you can go back in change mode (transaction MM02).
MMF1
Logistics / Materials Management / Material Master / Material / Create (Special) / Finished product
MMF1
Logistics / Materials Management / Material Master / Material / Create (Special) / Finished product
MM02
Logistics / Materials Management / Material Master / Material / Change / Immediately
MM02
Logistics / Materials Management / Material Master / Material / Change / Immediately

30Copyright © 2006, Pierre-Majorique LÉGER, Jacques ROBERT, Gilbert BABIN and Robert PELLERIN, HEC Montréal. All rights reserved for all countries.
ERP Simulation Game with mySAP ERP
2.1.2 Creating raw materials
Each fi rm has to defi ne all its raw materials. All teams need to create six raw materials: Z##$whe, Z##$str, Z##$nut, Z##$blu, Z##$oat and
Z##$rai, where ## corresponds to the two digits corresponding to the code of the simulation game and $ corresponds to the letter of
your plant.
The creating of the raw products requires specifying a set of parameters which indicate to SAP the business rules associated to this
master data. Based on the simulation requirements, here are the main parameters that are used in all your fi nished products:
Raw materials are retail products (Field Industry sector).
They are classifi ed in the system as food material (Field Material group).
Raw materials are counted in kilograms (Field Base Unit Measure).
The procurement of all raw materials is the responsibility of purchasing group 100. The purchasing group number is the key for
the group of buyers, who are responsible for certain purchasing activities.
The purchase orders of raw materials need to be generated automatically when purchase requisitions are converted into
purchase orders (Field Autom.PO).
No direct planning is needed for the raw materials (Field MRP Group). The dependent requirements for the raw material will be
generated by the MRP run (Field MRP Type) of their associated fi nished products.
Dependent requirements of raw materials are planned using a lot-for-lot order quantity (Field Lot size), i.e. the system creates one
large production lot from the independent requirements.
The dependent requirements issued from the forecast of the independent requirements are assumed to be constant (Field
Forecast model).
The MRP controller is the role of the person in charge of doing the planning run.
These products are valued as raw material (Field Valuation Class) and are valued using a moving average price (Field Moving
average price) of 1 euro per KG.
The availability of the products must be checked daily (Field Availability Check), and the planned delivery time is assumed to be
1 day (Field Plnd Delivery time). Time buffers are set to minimal delay (Field ShecdMargin Key).
•
•
•
•
•
•
•
•
•
•
•
MMR1
Logistics / Materials Management / Material Master / Material / Create (Special) / Raw Material
MMR1
Logistics / Materials Management / Material Master / Material / Create (Special) / Raw Material

31Copyright © 2006, Pierre-Majorique LÉGER, Jacques ROBERT, Gilbert BABIN and Robert PELLERIN, HEC Montréal. All rights reserved for all countries.
ERP Simulation Game with mySAP ERP
The same raw material will be used for the different fi nished products. Therefore, the creation of these 6 raw materials needs to be shared
between the members of the team. You also have to create 4 markets data for the packaging support.
N.B. You have to follow the same process for all the material masters that you need to create. For example, your plant will have to create
component Z##$whe, then Z##$str and so on. Remember: ## corresponds to the number of the simulation and “$” correspond to the
letter of your plant. For example, if the current simulation is the fi rst and your plant is A, then Z##$ corresponds to Z01A.
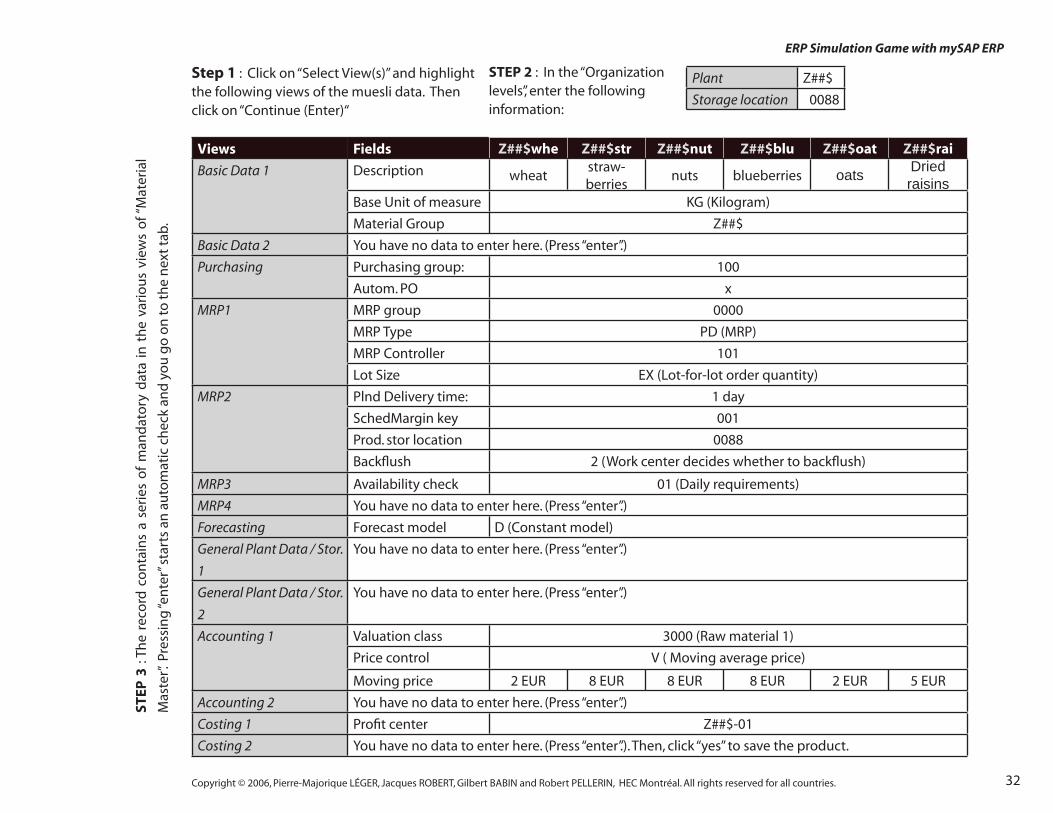
On “Create Raw Material (Initial Screen)”, enter the following information:
Fields Data to input
Material Z##$whe Z##$str Z##$nut Z##$blu Z##$oat Z##$rai
Industry sector Retail
32Copyright © 2006, Pierre-Majorique LÉGER, Jacques ROBERT, Gilbert BABIN and Robert PELLERIN, HEC Montréal. All rights reserved for all countries.
ERP Simulation Game with mySAP ERP
Views Fields Z##$whe Z##$str Z##$nut Z##$blu Z##$oat Z##$rai
Basic Data 1 Description wheatstraw-berries
nuts blueberries oats Dried raisins
Base Unit of measure KG (Kilogram)
Material Group Z##$
Basic Data 2 You have no data to enter here. (Press “enter”.)
Purchasing Purchasing group: 100
Autom. PO x
MRP1 MRP group 0000
MRP Type PD (MRP)
MRP Controller 101
Lot Size EX (Lot-for-lot order quantity)
MRP2 Plnd Delivery time: 1 day
SchedMargin key 001
Prod. stor location 0088
Backfl ush 2 (Work center decides whether to backfl ush)
MRP3 Availability check 01 (Daily requirements)
MRP4 You have no data to enter here. (Press “enter”.)
Forecasting Forecast model D (Constant model)
General Plant Data / Stor.
1
You have no data to enter here. (Press “enter”.)
General Plant Data / Stor.
2
You have no data to enter here. (Press “enter”.)
Accounting 1 Valuation class 3000 (Raw material 1)
Price control V ( Moving average price)
Moving price 2 EUR 8 EUR 8 EUR 8 EUR 2 EUR 5 EUR
Accounting 2 You have no data to enter here. (Press “enter”.)
Costing 1 Profi t center Z##$-01
Costing 2 You have no data to enter here. (Press “enter”.). Then, click “yes” to save the product.
Step 1 : Click on “Select View(s)” and highlight the following views of the muesli data. Then click on “Continue (Enter)“
STEP 2 : In the “Organization levels”, enter the following information:
STEP
3 :
The
reco
rd c
on
tain
s a
seri
es o
f m
and
ato
ry d
ata
in t
he
vari
ou
s vi
ews
of “
Mat
eria
l
Mas
ter”.
Pre
ssin
g “e
nte
r” s
tart
s an
au
tom
atic
ch
eck
and
yo
u g
o o
n to
th
e n
ext
tab.
Plant Z##$
Storage location 0088

33Copyright © 2006, Pierre-Majorique LÉGER, Jacques ROBERT, Gilbert BABIN and Robert PELLERIN, HEC Montréal. All rights reserved for all countries.
ERP Simulation Game with mySAP ERP
Click on to save.
If you forget information, go back in change mode (transaction MM02)
2.1.3 Creating packaging materials
The creating of the packaging material requires specifying a set of parameters which indicate to SAP the business rules associated to this master data. Based on the simulation requirements, here are the main parameters that are used in all your fi nished products:
Packaging material are retail products (Field Industry sector).
They are classifi ed in the system as food material (Field Material group).
Raw material are counted in pieces (Field Base Unit Measure).
The procurement of all raw materials is the responsibility of purchasing group 100 (Field Purchasing group).
The purchasing group number is the key for the group of buyers, who are responsible for certain purchasing activities.
The purchase orders of raw material need to be generated automatically when purchase requisitions are converted into purchase
orders (Field Autom.PO).
No direct planning is needed for the raw materials (Field MRP Group).
The dependant requirements for the raw materials will be generated by the MRP run (Field MRP Type) of their associated fi nished
product.
Dependant requirements of raw materials are planned using a lot-for-lot order quantity (Field Lot size), i.e. the system creates one
large production lot from the independent requirements.
The dependant requirements issued from the forecast of the independent requirements are assumed to be constant (Field
Forecast model).
The MRP controller is the role of the person in charge of doing the planning run.
These products are valued as raw materials (Field Valuation Class) and are valued using a moving average price (Field Moving
average price) that varies according to the size of the packaging material.
The availability of this product must be checked daily (Field Availability Check), and the planned delivery time is assumed to be
1 day (Field Plnd Delivery time). Time buffers are set to minimal delay (Field ShecdMargin Key).
After creating all of the ingredients, you’ll have to create four other raw materials: small format box (0.5 kg), large format box (1 kg), a
•
•
•
•
•
•
•
•
•
•
•
•
•
MMR1
Logistics / Materials Management / Material Master / Material / Create (Special) / Raw Material
MMR1
Logistics / Materials Management / Material Master / Material / Create (Special) / Raw Material
34Copyright © 2006, Pierre-Majorique LÉGER, Jacques ROBERT, Gilbert BABIN and Robert PELLERIN, HEC Montréal. All rights reserved for all countries.
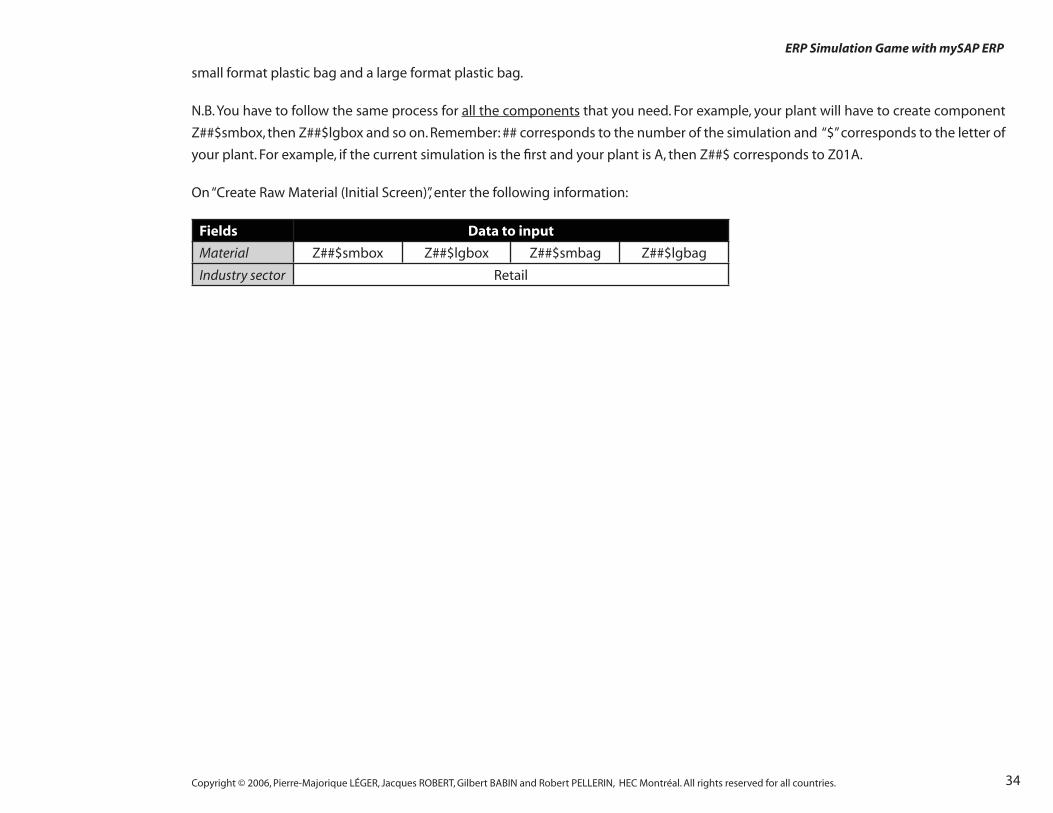
ERP Simulation Game with mySAP ERP
small format plastic bag and a large format plastic bag.
N.B. You have to follow the same process for all the components that you need. For example, your plant will have to create component
Z##$smbox, then Z##$lgbox and so on. Remember: ## corresponds to the number of the simulation and “$” corresponds to the letter of
your plant. For example, if the current simulation is the fi rst and your plant is A, then Z##$ corresponds to Z01A.
On “Create Raw Material (Initial Screen)”, enter the following information:
Fields Data to input
Material Z##$smbox Z##$lgbox Z##$smbag Z##$lgbag
Industry sector Retail

35Copyright © 2006, Pierre-Majorique LÉGER, Jacques ROBERT, Gilbert BABIN and Robert PELLERIN, HEC Montréal. All rights reserved for all countries.
ERP Simulation Game with mySAP ERP
Views Fields Z##$smbox Z##$lgbox Z##$smbag Z##$lgbag
Basic Data 1 Description Small box 0.5kg
Large box 1kg
Small plastic bag 0.5kg
Large plastic bag 1kg
Base Unit of measure PC (piece (s))
Material Group Z##$
Basic Data 2 You have no data to enter here. (Press “enter”.)
Purchasing Purchasing group: 100
Autom. PO x
MRP1 MRP group 0000
MRP Type PD (MRP)
MRP Controller 101
Lot Size EX (Lot-for-lot order quantity)
MRP2 Plnd Delivery time: 1 day
SchedMargin key 001
Prod. stor. location 0088
Backfl ush 2 (Work center decides whether to backfl ush)
MRP3 Availability check 01 (Daily requirements)
MRP4 You have no data to enter here. (Press “enter”.)
Forecasting Forecast model D (Constant model)
General Plant Data / Stor.
1
You have no data to enter here. (Press “enter”.)
General Plant Data / Stor.
2
You have no data to enter here. (Press “enter”.)
Accounting 1 Valuation class 3000 (Raw material 1)
Price control V ( Moving average price)
Moving price 0.5 EUR 0.75 EUR 0.25 EUR 0.35 EUR
Accounting 2 You have no data to enter here. (Press “enter”.)
Costing 1 You have no data to enter here. (Press “enter”.)
Costing 2 You have no data to enter here. (Press “enter”.), Then, click “yes” to save the product
Step 1 : Click on “Select View(s)” and highlight the following views of the muesli data. Then click on “Continue (Enter)
STEP 2 : In the “Organization levels”, enter the following information:
STEP
3 :
The
reco
rd c
on
tain
s a
seri
es o
f m
and
ato
ry d
ata
in t
he
vari
ou
s vi
ews
of “
Mat
eria
l
Mas
ter”.
Pre
ssin
g “e
nte
r” s
tart
s an
au
tom
atic
ch
eck
and
yo
u g
o o
n to
th
e n
ext
tab.
Plant Z##$
Storage location 0088

36Copyright © 2006, Pierre-Majorique LÉGER, Jacques ROBERT, Gilbert BABIN and Robert PELLERIN, HEC Montréal. All rights reserved for all countries.
ERP Simulation Game with mySAP ERP
Click on to save.
Should you forget to input some data, you can go back in change mode (transaction MM02).MM02
Logistics / Materials Management / Material Master / Material / Change / Immediately
MM02
Logistics / Materials Management / Material Master / Material / Change / Immediately
37
ERP Simulation Game with mySAP ERP
Copyright © 2006, Pierre-Majorique LÉGER, Jacques ROBERT and Gilbert BABIN, HEC Montréal. All rights reserved for all countries.
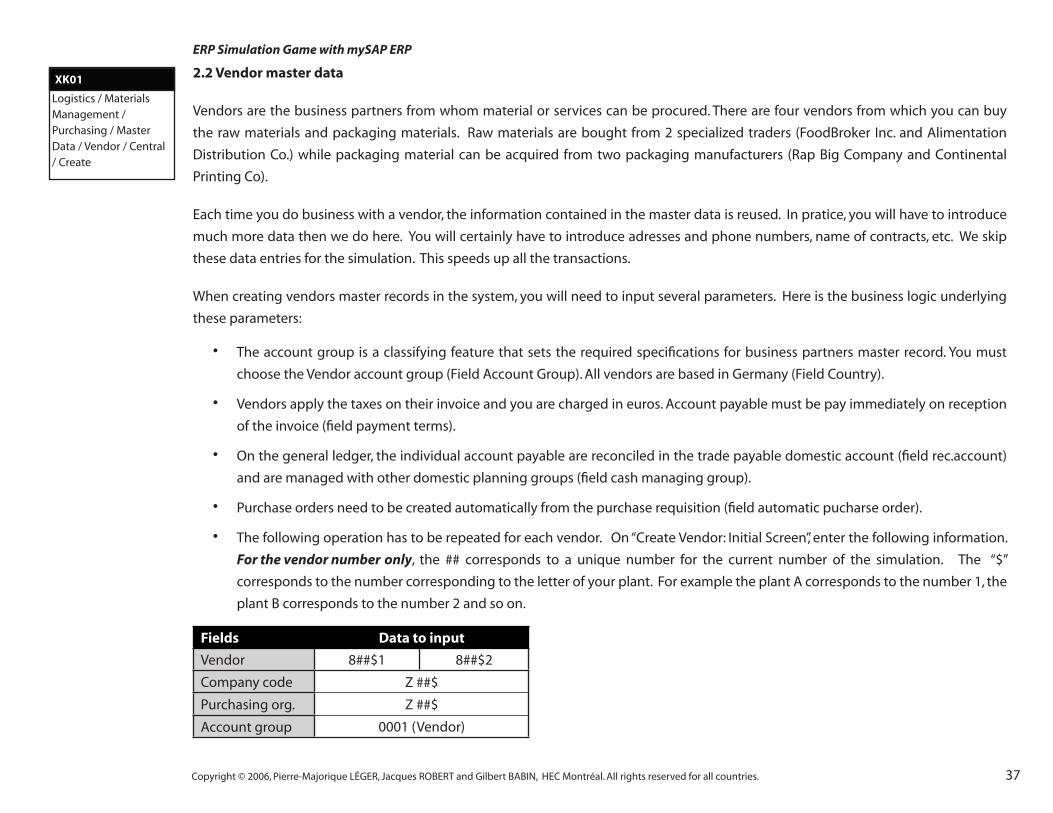
2.2 Vendor master data
Vendors are the business partners from whom material or services can be procured. There are four vendors from which you can buy
the raw materials and packaging materials. Raw materials are bought from 2 specialized traders (FoodBroker Inc. and Alimentation
Distribution Co.) while packaging material can be acquired from two packaging manufacturers (Rap Big Company and Continental
Printing Co).
Each time you do business with a vendor, the information contained in the master data is reused. In pratice, you will have to introduce
much more data then we do here. You will certainly have to introduce adresses and phone numbers, name of contracts, etc. We skip
these data entries for the simulation. This speeds up all the transactions.
When creating vendors master records in the system, you will need to input several parameters. Here is the business logic underlying
these parameters:
The account group is a classifying feature that sets the required specifi cations for business partners master record. You must
choose the Vendor account group (Field Account Group). All vendors are based in Germany (Field Country).
Vendors apply the taxes on their invoice and you are charged in euros. Account payable must be pay immediately on reception
of the invoice (fi eld payment terms).
On the general ledger, the individual account payable are reconciled in the trade payable domestic account (fi eld rec.account)
and are managed with other domestic planning groups (fi eld cash managing group).
Purchase orders need to be created automatically from the purchase requisition (fi eld automatic pucharse order).
The following operation has to be repeated for each vendor. On “Create Vendor: Initial Screen”, enter the following information.
For the vendor number only, the ## corresponds to a unique number for the current number of the simulation. The “$”
corresponds to the number corresponding to the letter of your plant. For example the plant A corresponds to the number 1, the
plant B corresponds to the number 2 and so on.
Fields Data to input
Vendor 8##$1 8##$2
Company code Z ##$
Purchasing org. Z ##$
Account group 0001 (Vendor)
•
•
•
•
•
XK01
Logistics / Materials Management / Purchasing / Master Data / Vendor / Central / Create

38Copyright © 2006, Pierre-Majorique LÉGER, Jacques ROBERT and Gilbert BABIN, HEC Montréal. All rights reserved for all countries.
ERP Simulation Game with mySAP ERP
On the “Create Vendor: Address” screen, enter the following information:
Fields Data to input
Vendor 8##$1 8##$2
Title Company
Name FoodBroker Inc. Continental Printing Co.
Search term Raw materials Packaging
Country DE DE
Press “enter” to go on to the next screen.
Create Vendor screens : Press
enter navigate through the
screens.
Fields
Z #
#$0
1
Z #
#$0
2
Control Sales / pur.tax X
Payment Transactions Press “enter” to skip the screen
Accounting Information AccountingRec Account: 160000 (Trade Payables – domestic)
Cash mgmnt group A1 (Domestic)
Payment Transaction Accounting Payment terms 0001 (Payable immediately Due Net)
Correspondence Accounting Press “enter” to skip the screen
Purchasing DataOrder currency EUR (euro)
Automatic PO X
Partner Functions Press “enter” to skip the screen
Do not forget to save data on the vendors by click on the disk .
You must repeat this procedure for the other vendor.
Should you need to modify the vendor record subsequently you need to execute the transaction XK02 .XK02
Logistics / Materials Management / Purchasing / Master Data / Vendor / Central / Change
XK02
Logistics / Materials Management / Purchasing / Master Data / Vendor / Central / Change

39
ERP Simulation Game with mySAP ERP
Copyright © 2006, Pierre-Majorique LÉGER, Jacques ROBERT and Gilbert BABIN, HEC Montréal. All rights reserved for all countries.
2.3 Customers master
A customer is a business partner with whom a business relationship exists involving the issue of goods or services. Each time a
customer issues an order, you do not want to reenter the relevant information. The customers data contains the information on
your customers that might be useful in futur transactions.
All customer are retailers located in Germany, they pay in euros.
Because of the important number of customer masters that need to be created in the system, they have already been created for
you. However, you can display them by distribution channel with the following report.
On the “CABAP:Execute Program” screen, enter the following information.
Field Data to input
Program RFDKVZ00
Click on
On the “Customer List” screen, enter the following information:
Fields Data to input
Company code Z##$
Search help ID S (Customers per sales group)
Should you wish to narrow the search for a specifi c distribution channel, click on the complex search help and enter the desired number
in the distribution channel fi eld and click on continue.
The Field « Communication with customer » in the « output control” fi eld in the bottom of the page needs to be empty.
Click on to execute the report.
•
•
•
SA38
System menu > Services > Reporting
SA38
System menu > Services > Reporting

40Copyright © 2006, Pierre-Majorique LÉGER, Jacques ROBERT and Gilbert BABIN, HEC Montréal. All rights reserved for all countries.
ERP Simulation Game with mySAP ERP
2.4 Production Master data
2.4.1 Bill of Material
In order to manufacture a fi nished product, you need to specify the raw material that is required. This information is used each time you
issue a production order and when you make your procurement planning. The quantities of raw materials required for the production
of a product is specifi ed in a BOM (Bill of Material). Each fi nished product must have its BOM. A BOM is a complete and structured list
of the components that make up the fi nished product. The list contains the description, the quantity and the unit of measure of each
component. The components of a BOM are known as BOM items.
In the context of the simulation game, the BOM represents the recipe of your muesli cereal boxes. Remember that you need to follow the
label guideline in developing your product (see chapter 1). The BOMs must be associated with a specifi c plant. A given BOM cannot be
used in two distinct plants. When a BOM is created, you must specify which plant will be used (fi eld plant). You must also specify in what
context the BOM will be used. In your case, it will be used in the production context (fi eld BOM usage).
You will be asked to enter a specifi c recipe for the BOM with your fi rst six products. The same recipe will used for all products of all teams
during the fi rst round (quarter) of the simulation. You will be allowed to change this recipe in future rounds. When you complete a BOM,
you will have to fi ll a table. Each row corresponds to a different component or BOM item. For each BOM item, you need to specify the
material number of the component (fi eld component), its quantity (fi eld quantity), its unit of measure and the category of the item (fi eld
Ict). The category of all BOM items is stock item. The unit of measure (fi eld Un) of the food products is in kilograms, the unit of packaging
product is in piece.
Here are the steps to create a bill-of-material in SAP. On “Create Material BOM: Initial Screen”, enter the following information. Remember
that ## corresponds to the simulation numboer and $ to the letter of your plant.
Fields Data to inputProduct Z##$-01 Z##$-02 Z##$-03 Z##$-04 Z##$-05 Z##$-06
Plant Z##$
BOM Usage 1 (Production)
CS01
Logistics / Production / Master Data/ Bills of Material / Bill of Material / Material BOM / Create
CS01
Logistics / Production / Master Data/ Bills of Material / Bill of Material / Material BOM / Create
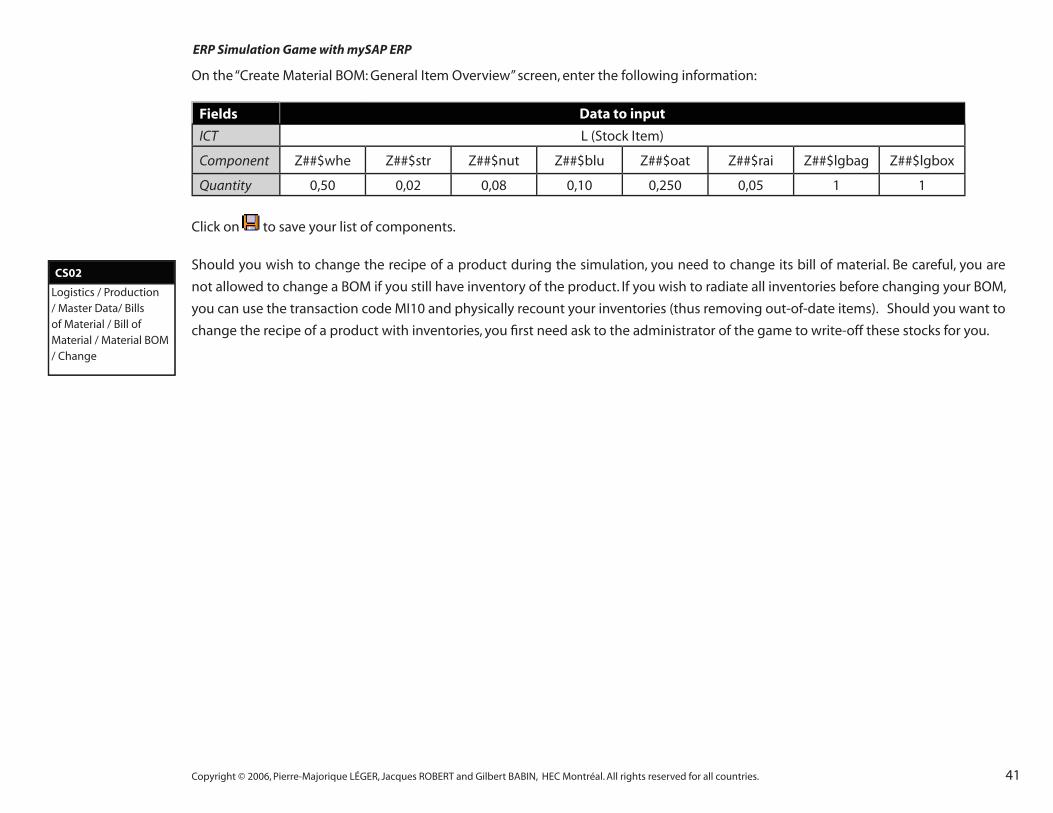
41
ERP Simulation Game with mySAP ERP
Copyright © 2006, Pierre-Majorique LÉGER, Jacques ROBERT and Gilbert BABIN, HEC Montréal. All rights reserved for all countries.
On the “Create Material BOM: General Item Overview” screen, enter the following information:
Fields Data to input
ICT L (Stock Item)
Component Z##$whe Z##$str Z##$nut Z##$blu Z##$oat Z##$rai Z##$lgbag Z##$lgbox
Quantity 0,50 0,02 0,08 0,10 0,250 0,05 1 1
Click on to save your list of components.
Should you wish to change the recipe of a product during the simulation, you need to change its bill of material. Be careful, you are
not allowed to change a BOM if you still have inventory of the product. If you wish to radiate all inventories before changing your BOM,
you can use the transaction code MI10 and physically recount your inventories (thus removing out-of-date items). Should you want to
change the recipe of a product with inventories, you fi rst need ask to the administrator of the game to write-off these stocks for you.
CS02
Logistics / Production / Master Data/ Bills of Material / Bill of Material / Material BOM / Change
CS02
Logistics / Production / Master Data/ Bills of Material / Bill of Material / Material BOM / Change
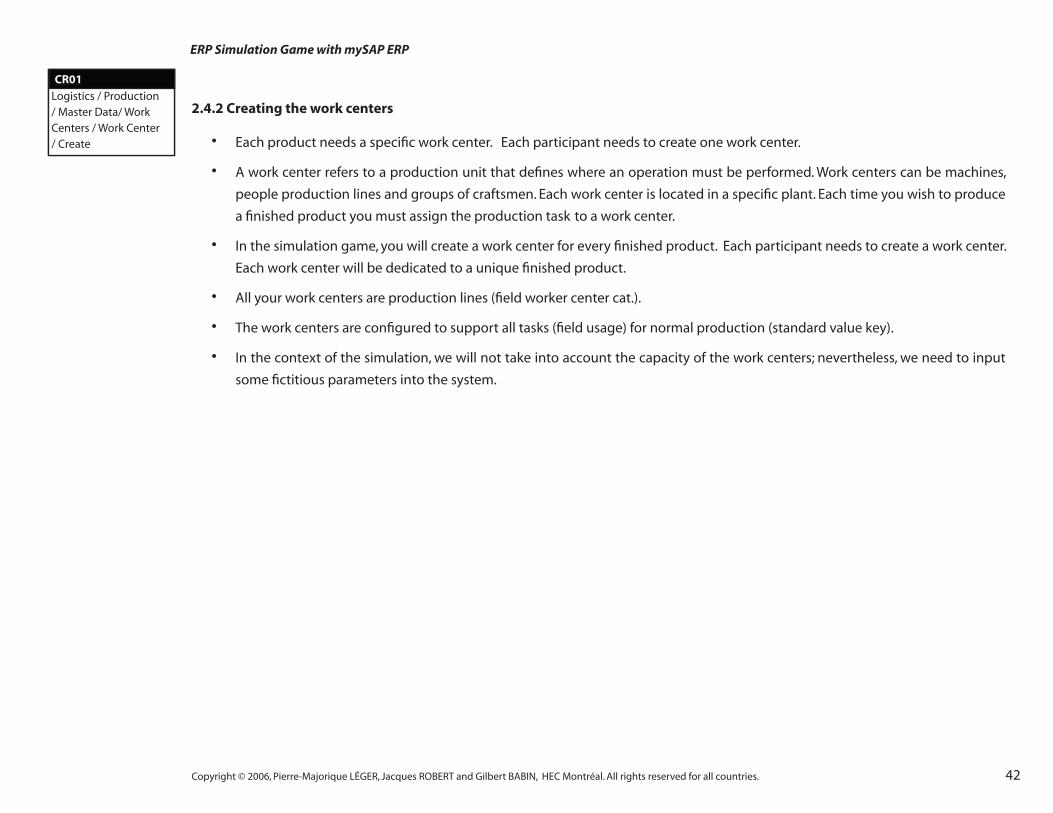
42Copyright © 2006, Pierre-Majorique LÉGER, Jacques ROBERT and Gilbert BABIN, HEC Montréal. All rights reserved for all countries.
ERP Simulation Game with mySAP ERP
2.4.2 Creating the work centers
Each product needs a specifi c work center. Each participant needs to create one work center.
A work center refers to a production unit that defi nes where an operation must be performed. Work centers can be machines,
people production lines and groups of craftsmen. Each work center is located in a specifi c plant. Each time you wish to produce
a fi nished product you must assign the production task to a work center.
In the simulation game, you will create a work center for every fi nished product. Each participant needs to create a work center.
Each work center will be dedicated to a unique fi nished product.
All your work centers are production lines (fi eld worker center cat.).
The work centers are confi gured to support all tasks (fi eld usage) for normal production (standard value key).
In the context of the simulation, we will not take into account the capacity of the work centers; nevertheless, we need to input
some fi ctitious parameters into the system.
•
•
•
•
•
•
CR01
Logistics / Production / Master Data/ Work Centers / Work Center / Create
CR01
Logistics / Production / Master Data/ Work Centers / Work Center / Create
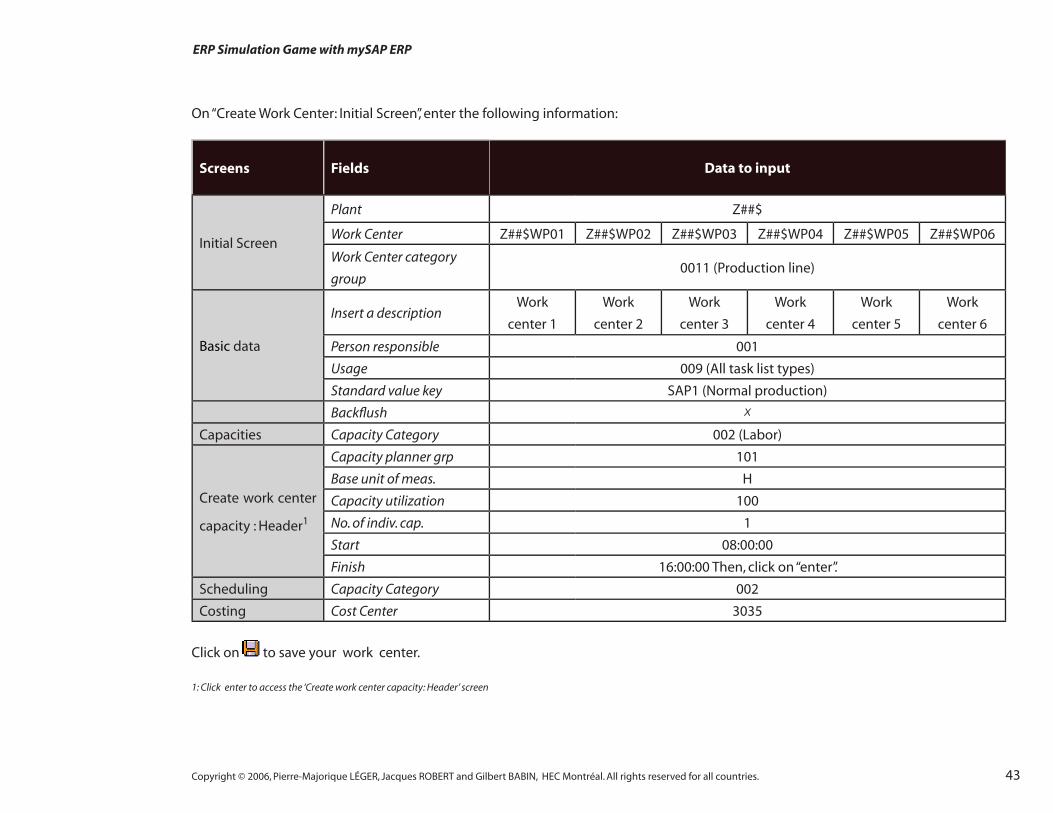
43
ERP Simulation Game with mySAP ERP
Copyright © 2006, Pierre-Majorique LÉGER, Jacques ROBERT and Gilbert BABIN, HEC Montréal. All rights reserved for all countries.
On “Create Work Center: Initial Screen”, enter the following information:
Screens Fields Data to input
Initial Screen
Plant Z##$
Work Center Z##$WP01 Z##$WP02 Z##$WP03 Z##$WP04 Z##$WP05 Z##$WP06
Work Center category
group0011 (Production line)
Basic data
Insert a descriptionWork
center 1
Work
center 2
Work
center 3
Work
center 4
Work
center 5
Work
center 6
Person responsible 001
Usage 009 (All task list types)
Standard value key SAP1 (Normal production)
Backfl ush X
Capacities Capacity Category 002 (Labor)
Create work center
capacity : Header1
Capacity planner grp 101
Base unit of meas. H
Capacity utilization 100
No. of indiv. cap. 1
Start 08:00:00
Finish 16:00:00 Then, click on “enter”.
Scheduling Capacity Category 002
Costing Cost Center 3035
Click on to save your work center.
1: Click enter to access the ‘Create work center capacity: Header’ screen

44Copyright © 2006, Pierre-Majorique LÉGER, Jacques ROBERT and Gilbert BABIN, HEC Montréal. All rights reserved for all countries.
ERP Simulation Game with mySAP ERP
2.4.3 Creating routings
Each product needs a routing. Routings correspond to the steps necessary to produce a fi nal product. Each participant needs to create
the routing of its product.
When you wish to produce a fi nished product, you must specify how to produce it and on which work centers to produce it. The routing
defi nes one sequence of one or more operations for the production of a material. A routing is specifi c to a fi nished product to be
manufactured (fi eld material).
In order to complete a routing, you must complete a table. Each operation corresponds to a row in the table. The fi rst row describes the
fi rst task or operation to be performed, the second row to the second task, etc. In the simulation game, we assume that there is only one
operation to in order to manufacture a muesli cereal box.
Each task or operation in the routing is attached to a specifi c work center (fi eld work center). Each time an operation in a routing is
performed a document will be created in order to confi rm the execution of the task. In the routing master data you must specify in
advance the type of the document that will be associated with the operation. In the case of the simulation, it is an in-house production
order that will be used (fi eld Control key).
Screens Fields Data to input
Initial ScreenMaterial Z##$-01 Z##$-02 Z##$-03 Z##$-04 Z##$-05 Z##$-06
Plant Z##$
Header detailsUsage 1 (Production)
Status 4 (Released (general))
Operations1Work center Z##$WP01 Z##$WP02 Z##$WP03 Z##$WP04 Z##$WP05 Z##$WP06
Control Key ZSIM
Click on “CompAlloc” at the top. This will confi rm the “Bill of material” for your product. Click on to save your routing.
1 : On the “Create Routing:Header Details” screen, click on “Operations”
CA01
Logistics / Production / Master Data/ Routings / Routings / Standard Routings / Create
CA01
Logistics / Production / Master Data/ Routings / Routings / Standard Routings / Create

45
ERP Simulation Game with mySAP ERP
Copyright © 2006, Pierre-Majorique LÉGER, Jacques ROBERT and Gilbert BABIN, HEC Montréal. All rights reserved for all countries.
2.5 Sales price
2.5.1 Set the sales price
In SAP, the price-setting algorithms are saved in the conditions records. These conditions records are used to set prices automatically
based on the various conditions applicable when a product is sold. These conditions include the price list, discounts, surcharges,
transportation costs and taxes. You must specify a sale price and sale conditions for each fi nished product that you wish to sell to every
sales area (a unique combination of sales organization, division and distribution channel) Each of those prices is contained in a price list
together with the sales conditions.
You must specify prices (fi eld amount) in euros (fi eld unit) for each fi nished product (fi eld material) and channel (fi eld distribution
channel). For the system to interpret the amount introduced as a sales price, you must select the Condition type PR00 (fi eld Condition
type).
On the “Create Condition Records: Overview” screen, click on the icon and then enter the following information:
Fields Data to input
MaterialMaterial Z##$-01Z##$-01 Z##$-02Z##$-02 Z##$-03Z##$-03 Z##$-04Z##$-04 ##Z##$-05Z##$-05 Z##$-06Z##$-06
Sales organization Z##$
Distribution channel 10
Price list 01
Document currency EUR
Condition type PR00Material Z##$-01 Z##$-02 Z##$-03 Z##$-04 Z##$-05 Z##$-06Amount 3 if it’s a small box and 5 if it’s a large box
Unit EUR
Because you cannot alter the master data during the simulation and because you may not know in advance in which distribution
channels you will want to sell your product it is highly recommended to introduce a price for all three channels.
VK31
Logistics / Sales and Distribution / Master Data / Conditions / Create / Prices / Price List
VK31
Logistics / Sales and Distribution / Master Data / Conditions / Create / Prices / Price List

46Copyright © 2006, Pierre-Majorique LÉGER, Jacques ROBERT and Gilbert BABIN, HEC Montréal. All rights reserved for all countries.
ERP Simulation Game with mySAP ERP
Therefore, repeat the same operations for each product for the distribution channel 12 and 14.
2.5.2 Change the sale price
You will able to change these prices during the simulation by using the following instructions.
On “Price List with Release Status”, enter the following information:
Fields Data to input
Sales organization Z##$
Distribution channel 10, 12 or 14
Material number Z##$-%%
Click on
On “Change Condition Records: Overview”, enter the following information:
Field Data to input
Amount The new sale price of your material
Click on to save.
VK32
Logistics / Sales and Distribution / Master Data / Conditions / Change / Prices / Price List
VK32
Logistics / Sales and Distribution / Master Data / Conditions / Change / Prices / Price List
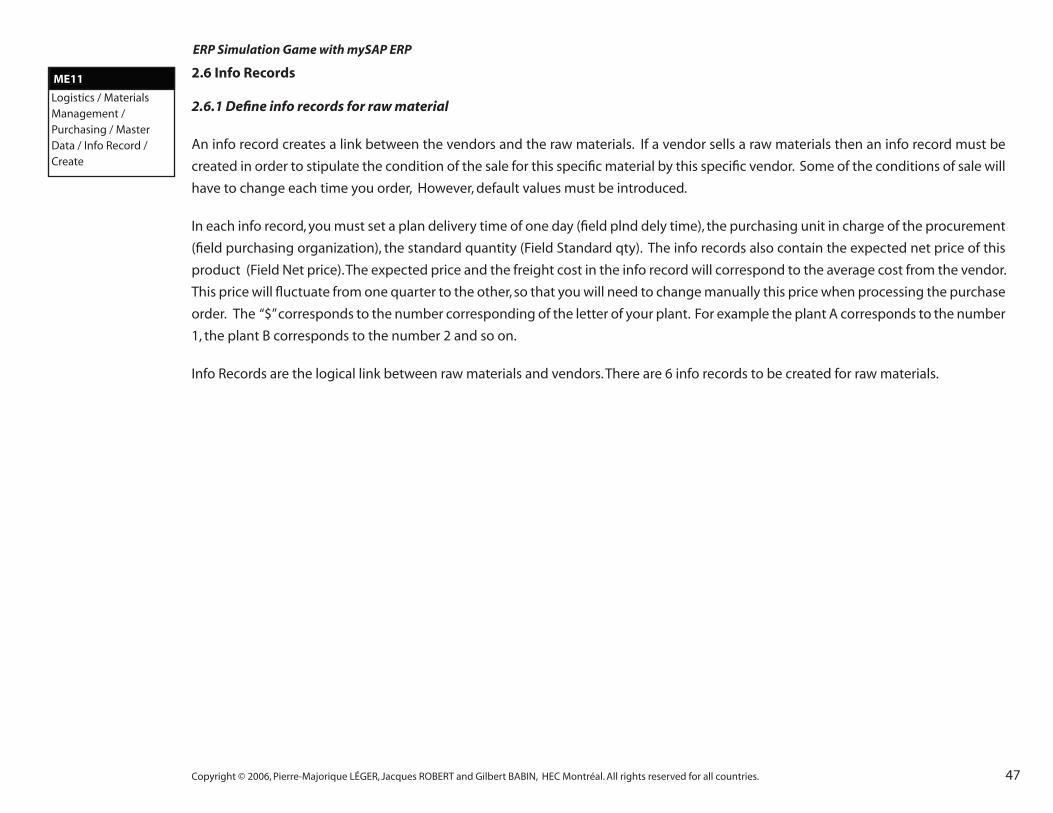
47
ERP Simulation Game with mySAP ERP
Copyright © 2006, Pierre-Majorique LÉGER, Jacques ROBERT and Gilbert BABIN, HEC Montréal. All rights reserved for all countries.
2.6 Info Records
2.6.1 Defi ne info records for raw material
An info record creates a link between the vendors and the raw materials. If a vendor sells a raw materials then an info record must be
created in order to stipulate the condition of the sale for this specifi c material by this specifi c vendor. Some of the conditions of sale will
have to change each time you order, However, default values must be introduced.
In each info record, you must set a plan delivery time of one day (fi eld plnd dely time), the purchasing unit in charge of the procurement
(fi eld purchasing organization), the standard quantity (Field Standard qty). The info records also contain the expected net price of this
product (Field Net price). The expected price and the freight cost in the info record will correspond to the average cost from the vendor.
This price will fl uctuate from one quarter to the other, so that you will need to change manually this price when processing the purchase
order. The “$” corresponds to the number corresponding of the letter of your plant. For example the plant A corresponds to the number
1, the plant B corresponds to the number 2 and so on.
Info Records are the logical link between raw materials and vendors. There are 6 info records to be created for raw materials.
ME11
Logistics / Materials Management / Purchasing / Master Data / Info Record / Create

48Copyright © 2006, Pierre-Majorique LÉGER, Jacques ROBERT and Gilbert BABIN, HEC Montréal. All rights reserved for all countries.
ERP Simulation Game with mySAP ERP
On “Create Info Record: Initial Screen”, enter the following information:
ScreensScreens Fields Data to input
Initial screen
Vendor 8##$1 8##$1 8##$1 8##$1 8##$1 8##$1
Material Z##$whe Z##$str Z##$nut Z##$blu Z##$oat Z##$rai
Purch. org. Z##$
Plant Z##$
Purchase org. data 11
Plnd dely time 1
Purch group 100
Standard qty 100
Net price 3 10 6 10 3 6
1 : On the “Create Info Record: General Data” screen, click on “Purch. Org data 1”
Click on to save.
2.6.2 Defi ne info records for packaging
We must also establish a link between the packaging goods and their suppliers. If a vendor sells a package product an info record must
be created in order to specify the sale conditions. Your team needs to create four info-records. The packaging info record contains the
same information that those of the material info records.
For the vendor number only, the ## corresponds to a unique number for the current number of the simulation. The “$” corresponds to
the number corresponding of the letter of your plant. For exemple the plant A corresponds to the number 1, the plant B corresponds
to the number 2 and so on.
ME11
Logistics / Materials Management / Purchasing / Master Data / Info Record / Create
ME11
Logistics / Materials Management / Purchasing / Master Data / Info Record / Create
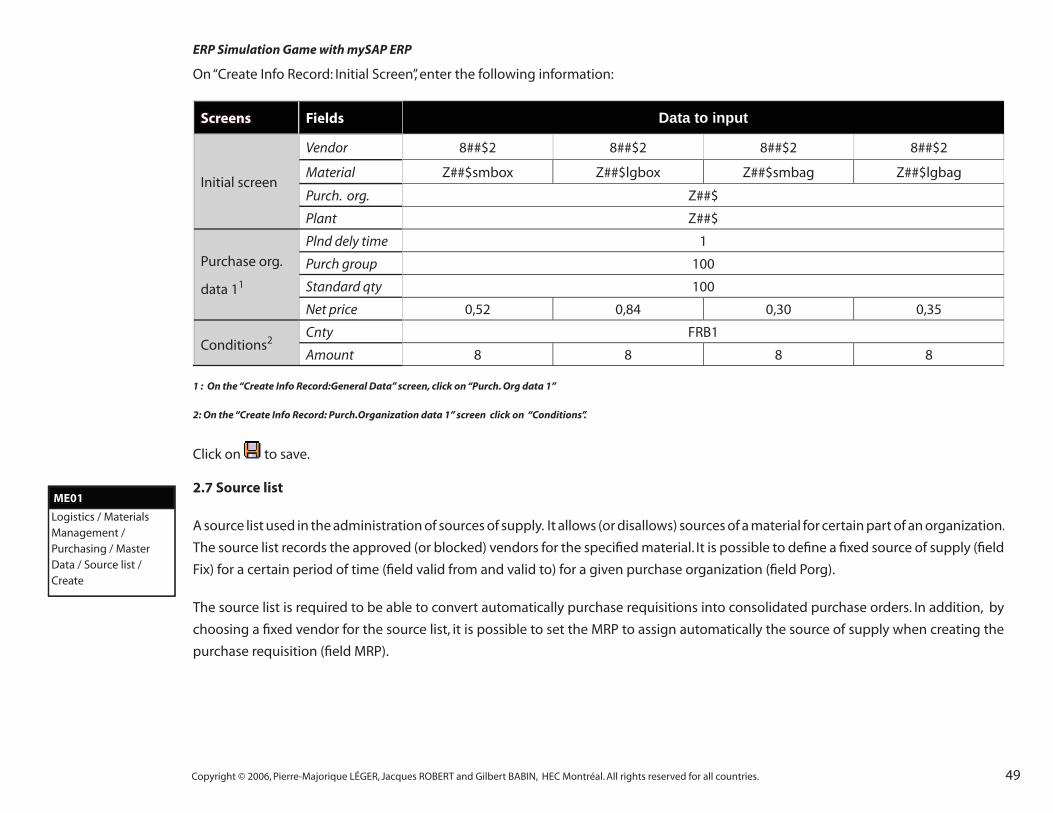
49
ERP Simulation Game with mySAP ERP
Copyright © 2006, Pierre-Majorique LÉGER, Jacques ROBERT and Gilbert BABIN, HEC Montréal. All rights reserved for all countries.
On “Create Info Record: Initial Screen”, enter the following information:
ScreensScreens Fields Data to input
Initial screen
Vendor 8##$2 8##$2 8##$2 8##$2
Material Z##$smbox Z##$lgbox Z##$smbag Z##$lgbag
Purch. org. Z##$
Plant Z##$
Purchase org.
data 11
Plnd dely time 1
Purch group 100
Standard qty 100
Net price 0,52 0,84 0,30 0,35
Conditions2Cnty FRB1
Amount 8 8 8 8
1 : On the “Create Info Record:General Data” screen, click on “Purch. Org data 1”
2: On the “Create Info Record: Purch.Organization data 1” screen click on “Conditions”.
Click on to save.
2.7 Source list
A source list used in the administration of sources of supply. It allows (or disallows) sources of a material for certain part of an organization.
The source list records the approved (or blocked) vendors for the specifi ed material. It is possible to defi ne a fi xed source of supply (fi eld
Fix) for a certain period of time (fi eld valid from and valid to) for a given purchase organization (fi eld Porg).
The source list is required to be able to convert automatically purchase requisitions into consolidated purchase orders. In addition, by
choosing a fi xed vendor for the source list, it is possible to set the MRP to assign automatically the source of supply when creating the
purchase requisition (fi eld MRP).
ME01
Logistics / Materials Management / Purchasing / Master Data / Source list / Create
ME01
Logistics / Materials Management / Purchasing / Master Data / Source list / Create

50Copyright © 2006, Pierre-Majorique LÉGER, Jacques ROBERT and Gilbert BABIN, HEC Montréal. All rights reserved for all countries.
ERP Simulation Game with mySAP ERP
On the “Maintain Source List: Initial Screen”, enter the following information:
ScreensScreens Fields Data to input
Material
Z##
$wh
e
Z##
$str
Z##
$nu
t
Z##
$blu
Z##
$oat
Z##
$rai
Z##
$sm
box
Z##
$lg
box
Z##
$sm
bag
Z##
$lg
bag
Plant Z##$
Press “enter” to go on to the next screen.
On the “Maintain Source List: Overview Screen”, enter the following information:
Fields Data to input
Material
Z##
$wh
e
Z##
$str
Z##
$nu
t
Z##
$blu
Z##
$oat
Z##
$rai
Z##
$sm
box
Z##
$lg
box
Z##
$sm
bag
Z##
$lg
bag
Valid from Today
Valid to One year from today
Vendor 8##$1 8##$2
Porg Z##$
Fix x
MRP 1 (Record relevant to MRP)
Click on to save.

51
ERP Simulation Game with mySAP ERP
Copyright © 2006, Pierre-Majorique LÉGER, Jacques ROBERT and Gilbert BABIN, HEC Montréal. All rights reserved for all countries.
2.8 Controlling master data
The following paragraphs describe the creation of controlling master data.
2.8.1 Creating profi t center
If required, enter Controlling Area “Z##$”, then press Enter. Note that the fi rst profi t center was already been created for you (Z##$-01)
Enter the following information:
Fields Data to input
Profi t center Z##$-02 Z##$-03 Z##$-04 Z##$-05 Z##$-06 Z##$-07 Z##$-08
Copy from Z##$-01
Co area Z##$, Then, press “enter”
Name Z##-$-02 Z##-$-03 Z##-$-04 Z##-$-05 Z##-$-06 Z##-$-07 Z##-$-08
Long text Z##-$-02 Z##-$-03 Z##-$-04 Z##-$-05 Z##-$-06 Z##-$-07 Z##-$-08
Person respons. Leave the default value in this fi eld.
Profi t Ctr Group H1
Click on to save.
A window will confi rm the creation of the profi t center. Press “enter” to continue, and then activate the profi t center by clicking on
activate (SHIFT+F1).
In the status bar, a message will confi rm the creation and activation of the profi t center.
KE51
Accounting / Controlling / Profi t Center Accounting / Master Data / Profi t Center /Individual Processing
KE51
Accounting / Controlling / Profi t Center Accounting / Master Data / Profi t Center /Individual Processing

52Copyright © 2006, Pierre-Majorique LÉGER, Jacques ROBERT and Gilbert BABIN, HEC Montréal. All rights reserved for all countries.
ERP Simulation Game with mySAP ERP
2.8.2 Creating cost centers
If required, enter Controlling Area “Z##$”, then press Enter
Tabs Fields Data to input
BasicData
Cost center Z##$-02 Z##$-03 Z##$-04 Z##$-05 Z##$-06 Z##$-07 Z##$-08
Valid from Today
To Enter 31.12.9999, then press “enter”
Reference: Cost center Z##$-01
Controlling area Z##$-01, Then press “enter” to continue
Name Z##$-02 Z##$-03 Z##$-04 Z##$-05 Z##$-06 Z##$-07 Z##$-08
Description Z##$-02 Z##$-03 Z##$-04 Z##$-05 Z##$-06 Z##$-07 Z##$-08
Person respons. Leave the default value in this fi eld.
Department Corporate
Cost center category 1
Hierarchy area Z##$
Business area 1000
Functional area 0100
Profi t center Z##$-02 Z##$-03 Z##$-04 Z##$-05 Z##$-06 Z##$-07 Z##$-08
Click on to save
2.9.3 Displaying profi t and cost centers hierarchy
In the following screen, you will be able to see all the information regarding the profi t centers created under hierarchy H1 and the status
of these profi t centers (Active is represented with a green light).
In the following screen, you will be able to see all the information regarding the cost centers created under hierarchy H1 and the status
of these cost centers (Active is represented with a green light).
KS01
Accounting / Controlling / Cost Center Accounting / Master Data / Cost Center /Individual Processing
KS01
Accounting / Controlling / Cost Center Accounting / Master Data / Cost Center /Individual Processing
KCH6N
Accounting / Controlling / Profi t Center Accounting / Master Data / Standard Hierarchy / Display
KCH6N
Accounting / Controlling / Profi t Center Accounting / Master Data / Standard Hierarchy / Display
OKENN
Accounting / Controlling / Cost Center Accounting / Master Data / Standard Hierarchy / Display
OKENN
Accounting / Controlling / Cost Center Accounting / Master Data / Standard Hierarchy / Display