SAP HANA Admin & Monitoring - NDM Technologies · SAP HANA® Admin & Monitoring ... and...
27
SAP HANA ® Admin & Monitoring
Transcript of SAP HANA Admin & Monitoring - NDM Technologies · SAP HANA® Admin & Monitoring ... and...

SAP HANA® Admin & Monitoring

© 2013 SAP AG. All rights reserved. 2
Content
This presentation provides an overview regarding administration, monitoring
and supportability of the SAP HANA database between the 1.0 SPS 03 version
and the 1.0 SPS 05 version.
It covers changes to the SAP HANA studio administration perspective and
changes to the SAP HANA database.
Functionality of other SAP HANA studio perspectives (like the Information
Modeler) is not covered in this presentation.

© 2013 SAP AG. All rights reserved. 3
SAP HANA Administration and Monitoring Introduction
Administration and Monitoring of SAP HANA
Enables customers to make sure their HANA system runs as expected
Provides possibilities to analyze problems
Can be done using the HANA specific tool SAP HANA studio
Is also integrated into the SAP landscape (DBA Cockpit, Solution Manager)
Use Cases for different administration tools
SAP HANA studio
– Stand-alone tool, available since first SAP HANA delivery for Windows and Linux operating systems
– Provides advanced administration/monitoring features
– Allows to start/stop the HANA database
– Is required to perform a recovery
– Contains further functionality for modeling and lifecycle management
DBA Cockpit / Solution Manager
– Is available as of SAP BW 7.30 SP05 and SAP Solution Manager 7.1 SP04
– Provides basic administration/monitoring features in existing SAP system landscape
– Is used by SAP support for first problem analysis

© 2013 SAP AG. All rights reserved. 4
SAP HANA Studio
Overview
Consists of several
applications /
perspectives
Administration console
Information modeler
Lifecycle management
Perspectives can be switched easily
Quick link buttons
Welcome screen
Several SAP HANA databases can
be integrated
Navigator tree
Folder structure
Context menu provides easy access to all functions

© 2013 SAP AG. All rights reserved. 5
Organizing the System Landscape
All SAP HANA databases of your system landscape
can be integrated
All databases are listed in the Navigator on the
left hand side
Use folders in the Navigator to virtually organize the
system landscape
Search functionality is available
Landscape information can be exported and imported
Working with a database with different users is possible
Using external authentication (Kerberos) is possible

© 2013 SAP AG. All rights reserved. 6
Improved Export/Import Wizard in HANA Studio
Ex- and Import all catalog objects with/without dependencies
All catalog objects can be exported to a file system and then imported back into
another database, for example, to move data from a test to a productive system
New with
SPS5

© 2013 SAP AG. All rights reserved. 7
Administration Console
Overview
Provides most important information about one database at a glance
Database state and general system information
Alerts
Memory usage
CPU usage
Disk usage
Detailed information
available via links
Database version
history

© 2013 SAP AG. All rights reserved. 8
Administration Console
Landscape
List of all services (processes), their status and resource consumption
Name server
Index server
Preprocessor
Statistic Server
Restarting services
Display and configuration of hosts and their
role (master, standby, …)

© 2013 SAP AG. All rights reserved. 9
Support Distribution
Enabled studio connectivity for multi-host landscape
For a distributed system, the master host is entered and is used to establish the connection to the database.
If this master host is unavailable, the connection is established automatically through one of the other hosts
in the system.
New with
SPS5
© 2013 SAP AG. All rights reserved. 10
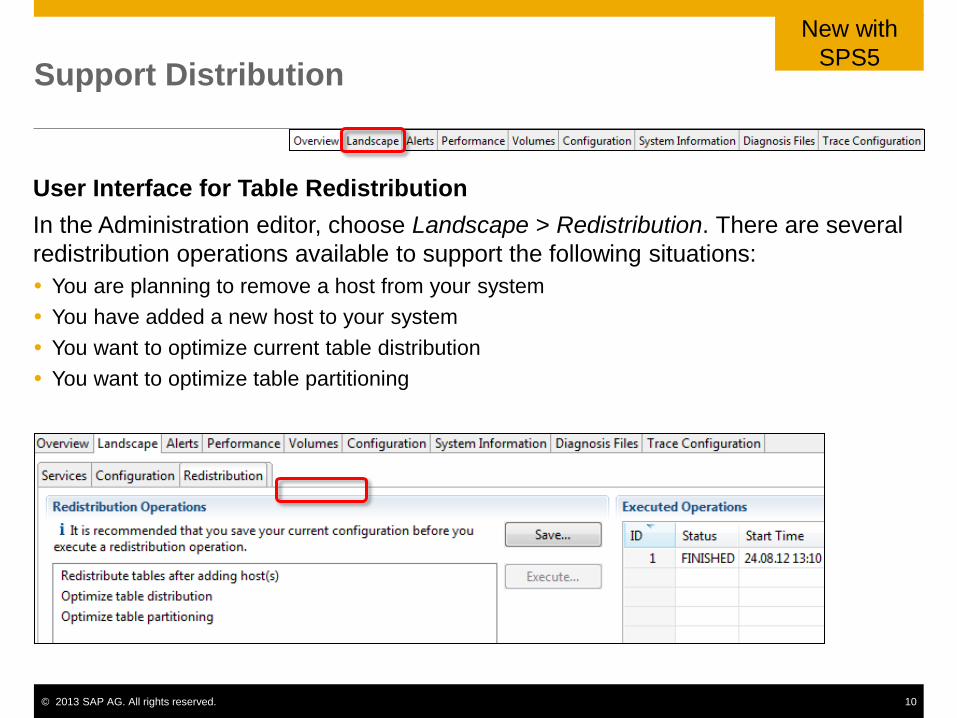
Support Distribution
User Interface for Table Redistribution
In the Administration editor, choose Landscape > Redistribution. There are several
redistribution operations available to support the following situations:
You are planning to remove a host from your system
You have added a new host to your system
You want to optimize current table distribution
You want to optimize table partitioning
New with
SPS5

© 2013 SAP AG. All rights reserved. 11
Support Distribution
Remove host from landscape
In the Administration editor, choose Landscape > Configuration
From the context menu of the host that you plan to remove, choose Remove Host
In the Remove Host dialog box, choose Yes
The system marks the host for removal and executes the required redistribution
operation
New with
SPS5

© 2013 SAP AG. All rights reserved. 12
Administration Console
Alerts
List of current
or all alerts
Filter available
Status of all
checks
Configure email notifications
Configure warning level thresholds
Configure check start times

© 2013 SAP AG. All rights reserved. 13
Statistics Server
Additional alerts – two examples
Alert for blocking situations
The alert is sent when blocking
situations occur longer than 5, 10, 15
minutes
Alert for size of trace files
The alert is sent when the size of a
diagnosis file goes over 1024, 2048MB
New with
SPS5

© 2013 SAP AG. All rights reserved. 14
Administration Console
Performance
List of threads
Status
Running
SQL statements
Graphical display of
performance KPIs
e.g. CPU usage,
Memory consumption,
Table unloads, …
Statement Monitoring
Job Progress

© 2013 SAP AG. All rights reserved. 15
Improved Monitoring
Session monitor
The Session sub-tab under Performance allows you to monitor all sessions in the
current landscape, such as identifying of inactive sessions, investigating of blocking
situations, and viewing memory consumption by session.
New with
SPS5

© 2013 SAP AG. All rights reserved. 16
Administration Console
Volumes
Detailed information
about storage size
and usage
Total and used size of
data area
Total and used size of
log area
Total and used size of
storage areas
Two different views: grouped by service and grouped by storage
Access Statistics for different volumes

© 2013 SAP AG. All rights reserved. 17
Improved displays in SAP HANA Studio
Volume display - status of
log segments
This view describes each
allocated log segment and
shows its current state and log
position range, which is
currently contained in this
segment.
New with
SPS5

© 2013 SAP AG. All rights reserved. 18
Administration Console
List of INI files
including the
parameters
Editing of
parameters
Filter available

© 2013 SAP AG. All rights reserved. 19
Administration Console
System Information
System Information contains list of
useful SQL statements
e.g. to get information about:
Expensive SQL statements
Memory usage
SQL locks
Merge statistics
…

© 2013 SAP AG. All rights reserved. 20
Administration Editor
Log Files
List and display possibility of all database log and trace files
‘Show Start of File’, ‘Show End of File’ available, number of lines configurable
‘Show Entire File’ available
Download button available

© 2013 SAP AG. All rights reserved. 21
Improved Monitoring
New and enhanced tracing capabilities
Trigger remotely support script to collect support information
The script is triggered from the Diagnosis Files tab. Afterwards the created
compressed file can be downloaded.
New with
SPS5

© 2013 SAP AG. All rights reserved. 22
Administration Editor
Trace Configuration
Trace Configuration
Information on Overview screen in
Administration editor about configured
traces
Trace Configuration page displays all
running traces
Wizard allows to configure all
possible traces
– Global database trace
– Database trace
– User specific trace
– SQL trace
– Performance trace
– Expensive statements trace
– End-to-end trace
Users without change
permissions can see the current
trace configuration

© 2013 SAP AG. All rights reserved. 23
Improved Monitoring
New and enhanced tracing capabilities
Kernel Profiler
The kernel profiler is a
sampling profiler to collect
information about frequent
and/or expensive execution
paths during query
processing.
It can be used to analyze
performance issues with
systems on which third-
party software cannot be
installed, or parts of the
database that are not
accessible by the
performance trace.
New with
SPS5

© 2013 SAP AG. All rights reserved. 24
Improved SQL Plan Cache
Offer quick access to visualize plan from expensive statements and SQL
plan cache display
To help you understand and analyze the execution plan of an expensive statement
or an SQL statement further, you can generate a graphical view of its plan by right-
clicking the statement and choosing Visualize Plan. A graphical representation of
the query, with estimated performance, is displayed. You can then validate the
estimated performance by choosing Execute in the context menu. Another similar
high-level graphic is generated with execution time information for each of the
parts.
Visualized Plan Column Plan Execution

© 2013 SAP AG. All rights reserved. 25
Improved SQL Plan Cache
Add physical table access details and parallelization details to execution plan
It is now possible to see the parallelization degree of CPU resources which were
used to process SQL queries.

© 2013 SAP AG. All rights reserved. 26
Improved SQL Plan Cache
Add timeline view to execution plan
The timeline tab view shows different temporal execution details of plan operations
processing one SQL statement. The runtime of the whole processed query as well
as for individual plan operations contributing to the result of a given query are
displayed.
Improve readability and usability by
introducing SQL-level abstractions
Plan operations now have a
descriptive summary and can be
logically grouped to make them
understandable to users familiar with
SQL, for example, JEDistinctAttribute
and JEPreAggregate form a logical
group by block.

Thank You!
Contact information:
Anke Riechers
SAP AG | Product Management | TIP IMP Product & Strategy (AG)
Rosenthaler Str. 30 | 10178 Berlin | Germany