SAP BO Planning Reporting Case Studies
37
JUERGEN LINDNER [ SAP POINT OF CONTACT MEMBER SINCE: 1998 ] SAP BusinessObjects: Planning and Reporting Case Studies [ 06/17/2011 Amol Palekar Edmund Manrique ATUL PATANKAR [ ASUG INSTALLATION MEMBER MEMBER SINCE: 2000 LINDA WILSON [ ASUG INSTALLATION MEMBER MEMBER SINCE: 1999 [ [ Edmund Manrique (TekLink Intl.)
Transcript of SAP BO Planning Reporting Case Studies

JUERGEN LINDNER[SAP POINT OF CONTACT
MEMBER SINCE: 1998
]SAP BusinessObjects:
Planning and Reporting Case Studies
[06/17/2011
Amol Palekar
Edmund Manrique
ATUL PATANKAR[ASUG INSTALLATION MEMBER
MEMBER SINCE: 2000
LINDA WILSON[ASUG INSTALLATION MEMBER
MEMBER SINCE: 1999
[
[ Edmund Manrique
(TekLink Intl.)

[
� Implementing drill-down Spend Performance Reporting with SAP BOBJ
� Driver based planning using SAP BusinessObjects Dashboards (Xcelsius) on top of SAP BPC – NW 7.5
� Leveraging a free SAP BPC Starter Kit for Cost and Expense Planning (SKCEP demo)
Learning Points
Real Experience. Real Advantage. 2

[
Real Experience. Real Advantage.
IMPLEMENTING SPEND
PERFORMANCE REPORTING
3

[• The company was undergoing a standard Procurement reporting project
in SAP ECC
• Currently, they had minimum visibility to:
• Vendor spend
• Revenue loss/gain due to untimely payments
• Procurement cycle time
• PO delivery aging, etc…
• Unavailability of uniform Procurement/Spend KPIs across the
organization
• No single point of access for the Procurement related KPIs
• TekLink participated in workshops,
business blueprint, design and
development of the KPI and Spend
Analytics Dashboard project
• Drill down functionality from SAP
Business Objects Dashboards
(Xcelsius) dashboards to WebI was
proposed so as to cater to the
various reporting consumers across
Business Challenge What We Did?Company Overview
• A public company in the
utilities industry
• Annual Revenues of $
12.4 Bn [2010]
• Employee base of
20,000+ employees
Customer Case Study
Real Experience. Real Advantage.
various reporting consumers across
all levels
• TekLink led a 2-phase project to
implement the 24 KPIs, which lasted
9 months, as opposed to a big bang
approach so that lessons learned
could be leveraged
• SAP Business Objects Dashboards
(Xcelsius) Dashboards were
integrated seamlessly into the SAP
Enterprise Portal (common reporting
interface across the enterprise)
Procurement
• View overall
purchasing activity,
including value and
aging
• Perform vendor
performance analysis,
including quality
• Align strategic
procurement for price
negotiation/contract
development
• Manage contract
growth rate
• View savings due to
cost reduction
Spend
• Rank vendors and
commodities by
spend
• Identify savings due
to timely payments
• Identify savings lost
due to untimely
payment
• Manage spend - $$
of PO based
invoices compared
to total invoices $$
• View overall spend
by company code
• Monitor plant spend
Inventory
• Analyze inventory
growth rate by plant,
material type and/or
MRP controller
• Monitor inventory
accuracy
• View excess
inventory
• View inventory aging
• Monitor inventory
accuracy
• Monitor stock room
response time
Accounts Payable
• Analyze invoice
growth rate
• Show trend of
automated process in
order to increase
them
• Monitor timing of AP
process
Business Benefits
4

[ Requirements
Procurement (1)
• Contracts• Contract Usage• Vendor View• Strategic Buyer
Report
Procurement (2)
• Purchase Order Overview
• PO Delivery Aging
• Open Requisitions
Spend
• Overall Spend by CC
• Vendor Ranking by Spend
• Commodity Ranking
Inventory
• Inventory Growth
• Inventory by Mat. Type
• Inventory by Mat. Planner
Accounts Payable
• Invoice Growth Rate
• Vendor Discounts
• Managed Spend
� Spend Performance KPIs
Real Experience. Real Advantage. 5
Report• Supplier Quality
Defects• Procurement
Cost Savings
• Open Requisitions
• Procurement Cycle Time
• Vendor Ranking by PO
• Commodity Ranking
• Vendor Ranking by Transaction Volume
• Inventory by Mat. Planner
• Inventory Accuracy
• Excess Inventory
• Managed Spend

[ Solution Overview – Procurement KPIs (1)
Real Experience. Real Advantage. 6

[ Solution Overview – Procurement KPIs (2)
Real Experience. Real Advantage. 7

[ Solution Overview – Spend KPIs (1)
Real Experience. Real Advantage. 8

[ Solution Overview – Spend KPIs (2)
Real Experience. Real Advantage. 9

[ Accounts Payable
Real Experience. Real Advantage. 10

[ Solution Overview – Inventory KPIs
Real Experience. Real Advantage. 11

[ Solution: Technical OverviewSAP NetWeaver Enterprise Portal
SAP BOBJ Dashboards (Xcelsius) 2008 SP2
Drilldown with
openDocument ()
BICS Connectivity
Real Experience. Real Advantage. 12
BEx Query (Aggregated)
SAP BW InfoCubes
OLTP Source Systems
BEx Query (Detailed)
NW 7.0 EhP1 SP5 with ABAP and Java stack
WebI Report
ETL

[
� “A good dashboard fits on a single screen”
� Define actionable dashboard screens
� Use separate BEx queries for dashboard display and detailed drilldown
� Ensure that the variables used in the BEx Query always return valid default value
� Define all the calculations in the query itself
Lessons Learnt/ Best Practices
Real Experience. Real Advantage. 13
� Define all the calculations in the query itself
� Use CUID to link the drilldown report from dashboard

[
Real Experience. Real Advantage.
VISUAL DRIVER BASEDPLANNING USING
SAP BOBJ DASHBOARDS (XCELSIUS) AND BPC-NW 7.5
14

[
� Traditional Budgets/Forecasts take a longtime to develop and are often outdated assoon as they are complete.
� Spreadsheet based or account basedbudgets and forecasts do not deliverfinancial analysts or business peopleuseful accurate information.
Driver Based Planning – The Problem
Real Experience. Real Advantage. 15
useful accurate information.
� The budgeting / forecasting process is an exercise in guesswork with little fundamental foundation where spending is not related to sales forecasts or operational activities.
� The finance department responsible for forecasts received from managers has no way to judge reasonableness or to communicate the logic used when creating a plan.

[
� Driver-based planning, the best practice methodology for creating financial plansbased on specific “drivers” that impactresults.
� Benefits of Driver based planning:� Rapid flexible creation of rolling forecasts
� More accurate forecasts
Driver Based Planning – The Solution
Real Experience. Real Advantage. 16
� More accurate forecasts
� Easier to understand and communicate forecast results
� Easier to analyze variances to the forecast at their root cause

[ Driver Based Planning – Example (simplified)
Snowfall
• Colorado• Utah• …
Ski Sales
• Premium Skis• Retail Skis
Real Experience. Real Advantage. 17
Binding/Boot Sales
• Premium Bindings• Premium Boots
Distribution Costs
• # shipments• Freight Costs• Handling Costs• Warehouse Salaries …

[ Demo
Real Experience. Real Advantage.

[ SAP BOBJ Dashboards – BPC Integration
Real Experience. Real Advantage. 19
� BOE CMS can provide single sign-on to BPC from the SAP Business Objects Dashboards (Xcelsius) Model
� SAP Business Objects Dashboards (Xcelsius) Models can be used inside of or external to BPC, when used in BPC the Model will inherit Current View as filters to the dashboard
Source – SAP EPM Connector User Guide

[
EPM Connector Options
� EPM Connector for Xcelsius enables Xcelsius dashboards to:� Retrieve data using Analyzer report
� Enter and save data using Analyzer report
� Display Business Process Flows – Shows information for user logged on
� Display Current View – Uses CV from BPC web. (even in office)
SAP BOBJ Dashboards - BPC Integration
Real Experience. Real Advantage.
� Display Current View – Uses CV from BPC web. (even in office)
� Display Application Sets – User Specific based on authorization.
� Display Applications – Displays list of applications within appset user is authorized to see.
� Display dimension members – Gets dimension members user is authorized for. (Could be used to generate cost center dropdown for example)
� Display text from content library – Retrieves TXT file data from content library.
20

[ SAP BOBJ Dashboards - BPC Integration Steps to Connect
� Client
� Install BPC 7.5 ODBO Provider
� SAP BusinessObjects Extended Analytics Analyzer SP05 or higher
� SAP Business Objects Dashboards (Xcelsius) 2008 Support Pack 2 or higher
Real Experience. Real Advantage.
higher
� BPC Data Grid Add On For Xcelsius (recommended)
� Web Server
� Microsoft Visual C++ 2005 SP1 Redistributable Package (x86).
� Microsoft Visual C++ 2005 Service Pack 1 Redistributable Package ATL Security Update
� Configure the XMLA provider.
� Configure crossdomain.xml files to allow flash to access data from URL’s in the same DNS domain (see documentation)
21

[ Building SAP BOBJ Dashboards Model (1)
Read Data
1. From Xcelsius use Analyzer to retrieve BPC data
2. Use the “=GetReportDefinition()” syntax and put this in an Excel Cell.
3. Copy data and “Paste Values” to remove Analyzer formulas.
4. Create connection using EPM Connector
5. Bind the Connection to the =GetReportDefinition() cell.
Real Experience. Real Advantage.
5. Bind the Connection to the =GetReportDefinition() cell.
6. Add BPC Data Grid (or other visualization component to display results.
7. Add Data Refresh Button. EPM connector will not refresh on load.
22

[ Building SAP BOBJ Dashboards Model (2)
Write Data
1. Create a new data connection using operation type “Enter and Save data using Analyzer Report”
2. Bind the Connection to the =GetReportDefinition() cell.
3. Update BPC Data Grid to allow input or modify model to allow input.
4. Select 3 cells in a column where Submitted, Accepted, Rejected counts are
Real Experience. Real Advantage.
4. Select 3 cells in a column where Submitted, Accepted, Rejected counts are displayed
5. Select a cell where messages are displayed
23

[ Publishing Options
� Publish as SWF in PPT, XLS, Word, PDF. (Note – You cannot publish a SWF in office 2007, you must save as 97-2003)
� Publish to BPC Office – If you publish to BPC office. SAP BOBJ Dashboards (Xcelsius) will inherit the current view for any dimension not in header or body of analyzer report.
� Publish to BPC Web – Same as Office, Current view will be inherited from
Real Experience. Real Advantage.
� Publish to BPC Web – Same as Office, Current view will be inherited from BPC Web for any dimension not in the Analyzer report.
� Publish as SWF to any application that supports SWF files. (BOBJ Widgets etc)
� In all cases BPC security remains in effect
24

[
� Fully Qualify Analyzer Query if you plan to use outside of BPC
� Add Filter Values for all Dimensions within the Query
� SAP BOBJ Dashboards (Xcelsius) Version – SWF Deployment Issue in 3.0
� Enable Live-Office Integration
� When submitting data, all data is submitted, even if the values have not changed.
Best Practices / Lessons Learned
Real Experience. Real Advantage. 25
changed.
� You cannot submit blank values. You must submit 0s. Blank values will generate an error.

[
Real Experience. Real Advantage.
STARTER KIT FOR COST AND EXPENSE PLANNING
(SKCEP)
26

[
SAP has been aggressively building a set of industry and cross-industry content to help accelerate SAP Business Planning and Consolidation Projects
� SAP IFRS Starter Kit
� SAP Planning & Consolidation for Banking
� SAP Planning & Consolidation for Health Care
� SAP Planning & Consolidation for Public Sector
What is SKCEP?
Real Experience. Real Advantage. 27
� SAP Planning & Consolidation for Public Sector
� SAP Sales and Operations Planning RDS (Rapid Deployment Solutions)
� SAP Starter Kit for Cost and Expense Planning

[ Save Time, Cost, and Resources
Implementation Efforts Significantly Reduced Through Pre-built Integration:
� Pre-defined cost center and profit center accounting data models and mappings
� Pre-built data management packages to load data from SAP ERP and SAP NetWeaver® BW
� Closed-loop SAP ERP integration via data management packages to load data back into SAP ERP and drill-through reporting integration
Real Experience. Real Advantage.
data back into SAP ERP and drill-through reporting integration
� Reporting and analysis integration with SAP NetWeaver BW via data management packages to load data back into SAP NetWeaver BW
� Embedded integration with Cost Center Accounting via Excel-based planning and version copy

[ Accelerate Deployment and Adoption
Ease-of-use for greater business self-service
� Visual layout and easy, one-click buttons to enable the business to own and understand their own data loads
� Offline planning capabilities
� Built-in functions to spread, weight and trend values
� Starter Kit Excel Ribbon functions to further facilitate planning and improve performance:
Real Experience. Real Advantage.
Save Data
Refresh Data
Expand Hierarchy
Collapse Hierarchy
Forecast Expenses
Lock/Unlock Cells, Columns and Rows
Copy Rows
Copy Columns
Top-Down Distribute
Equally
On existing ratios

[ Visual Design for Data Load Management
Real Experience. Real Advantage.

[ One-Click EASY Data Loads
Real Experience. Real Advantage.
�
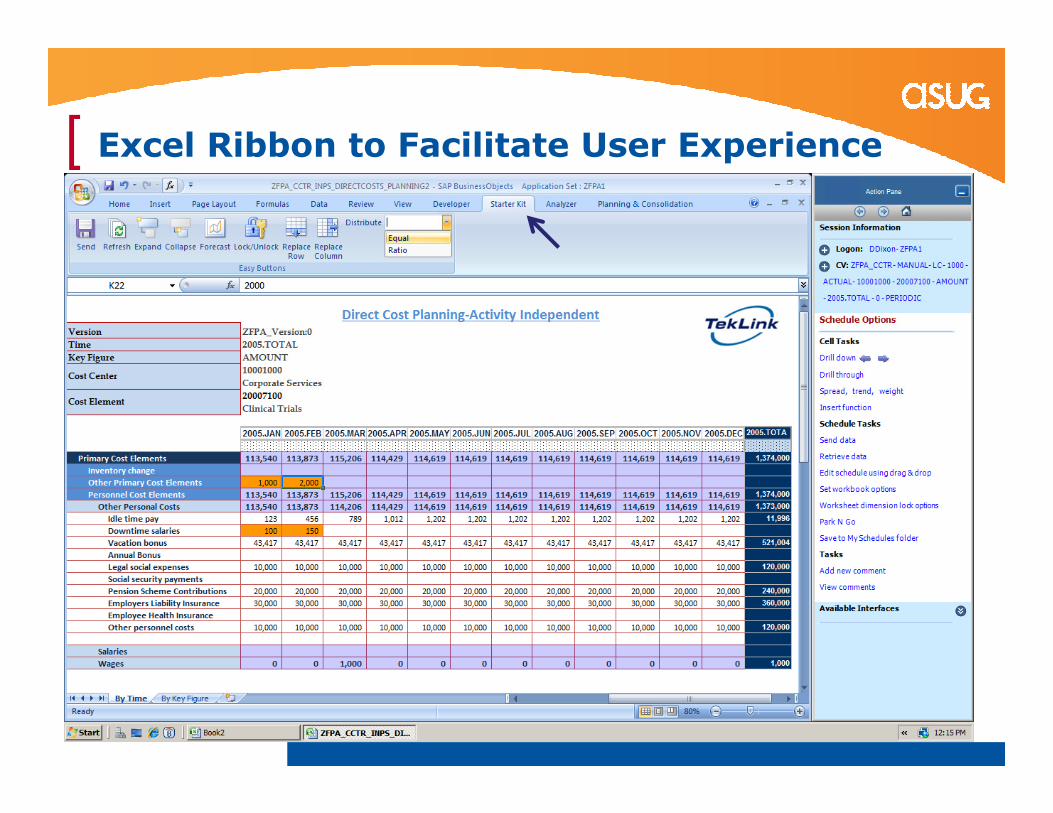
[ Excel Ribbon to Facilitate User Experience
Real Experience. Real Advantage.

[ Enable New Business Scenarios & Use CasesMore flexibility in defining processes, data and models
� Combine data from any source at any level of detail in your planning layouts
� Reference market, forecast, history or benchmarks in input schedules
� Add product, customer and channel views to costs and expense planning
� Enable integration with operational planning processes and non-financial models
� Enable global views of data such as activity prices across cost centers and controlling areas
Real Experience. Real Advantage.
controlling areas
� Define custom calculation models and business rules such as average pricing, rate determination and allocation methodologies
� Enable rolling re-forecasting and hierarchical formats
� Process control with versioning, work status definitions, business process flows (BPFs) and distribution and collection functionality

[ Use Case of SAP BPC Value PropositionCost and expense planning input schedule functions and features:
1. The ability to specify reference data for comparison and copy functions toinitialize a plan:
• For annual planning reference can be prior year plan or actuals
• For re-forecasting reference can be current plan year
2. The ability to reforecast based up updated actuals and forecastingfunctions (such as trend, weights, spread, statistical and averagingmethods)
Real Experience. Real Advantage.
methods)
3. The use of hierarchy-based distribution keys in addition to time-baseddistribution keys as well as new distribution methods not found in CO
4. Locking and unlocking of cells, rows and columns to prevent data changeseither manually or after distributions and calculations
5. Dynamic data groupings for navigation ease and performance
6. Drill through to SAP ERP

[
DEMO
Real Experience. Real Advantage.
DEMO

[ Questions?
How to contact us:
Amol Palekar
Real Experience. Real Advantage.
Edmund Manrique

[ ]� Thank you.
Real Experience. Real Advantage. 37